Abstract
Studying the spatial distribution characteristics of and factors that influence intangible cultural heritage is an important way to improve the management and protection of the heritage. On the basis of the standard deviation ellipse, point pattern analysis, kernel density analysis, spatial autocorrelation, Geodetector, and other methods, 891 national intangible cultural heritage artifacts (divided into five batches and ten categories) in the Yellow River Basin were taken as the research objects, and their spatial and temporal distribution characteristics and causes were quantitatively analyzed. As per the results, (1) the intangible cultural heritage in the Yellow River Basin shows a spatial distribution pattern that is dense in the east and sparse in the west, and there is a strong spatial dependence; (2) the intangible cultural heritage in the Yellow River Basin shows a “west first and then east” trend in time, and the quantity and type have significant differences in different time sections; (3) according to the batch analysis, the aggregation of the second batch of the intangible cultural heritage is the strongest, and the NNI value continues to increase from the second to the fifth batch of the intangible cultural heritage, indicating that the development of intangible cultural heritage is increasingly related to areas with backward economies and ethnic minorities; and (4) policy orientation, economic development, and topography are the dominant factors affecting the spatial distribution pattern of the intangible cultural heritage in the Yellow River Basin.
1. Introduction
Intangible cultural heritage mainly refers to various practices, performances, manifestations, knowledge systems, and skills, as well as related tools, objects, crafts, and cultural sites, that groups and sometimes individuals perceive as their cultural heritage. Intangible cultural heritage reflects the subjective initiative of man and its effect on the man–land relationship, and its occurrence and development law explain this relationship more comprehensively. The rotection and development of intangible cultural heritage helps to continue the historical context of various countries and promote cultural exchange among civilizations. The intangible cultural heritage of the Yellow River Basin is an important part of the traditional Chinese culture. Protecting and using this heritage of the Yellow River Basin (thus ensuring it is inherited) is of great significance in strengthening cultural confidence and building socialist cultural power [1]. Research by foreign scholars on the early stages of intangible cultural heritage has mainly focused on its definition and connotation; the relationship between intangible cultural heritage and human society; and the value evaluation, protection concept, development, and use of intangible cultural heritage [2,3,4,5]. In recent years, research has focused on constructing and exploring intangible cultural heritage theory, the impact of the declaration and development of intangible cultural heritage on the economy and society, the protection and management of intangible cultural heritage, and further innovation [6,7,8,9]. At present, foreign countries are paying more attention to research from a human perspective [10]. The scale of research varies from research across continents to research in specific villages [11,12]. In short, foreign research mainly involves literature retrieval, sample collection, construction model, case analysis, and other research methods [2,3,4,5,6,7,8,9,10,11,12]. The research on intangible cultural heritage in China started relatively late, mainly focusing on the concept, characteristics, and protection of the heritage [13,14,15]. The adoption of the Convention on the Protection of Intangible Cultural Heritage in 2004 marked a new stage in the study of intangible cultural heritage in China. Research has focused on protecting intangible cultural heritage through theoretical exploration, path implementation, and national policy interpretation [16,17]. Research has also focused on the value assessment of intangible cultural heritage, tourism development, heritage protection, communication teaching, and the aggregation and service of intangible cultural heritage resources [18,19,20,21]. Some studies have focused on pedagogy, folklore, history, geography, and literature, though such studies are few [22,23,24]. In terms of research scale, most studies take a provincial administrative unit as the research object, and overall, there is less research on a national scale [25,26,27,28,29,30]. An analysis of the above literature indicates that domestic research has mainly adopted the field investigation method, the historical literature method, the sequence method, spatial autocorrelation, point pattern analysis, and the hot spot clustering method [13,14,15,16,17,18,19,20,21,22,23,24,25,26,27,28,29,30]. The Yellow River is the mother river of the Chinese nation and has bred rich and diverse cultures. The exploration and protection of the intangible cultural heritage in the Yellow River Basin have ensured that the traditional Chinese culture is inherited and carried forward. The Yellow River Basin in the study area includes 92 cities in nine provinces (Qinghai, Gansu, Ningxia, Inner Mongolia (excluding eastern Mongolia), Shanxi, Shaanxi, Henan, Shandong, and Aba Tibetan), the Qiang Autonomous Prefecture of Sichuan, and the Ganzi Tibetan Autonomous Prefecture, including areas from Hekou Town in Tuoketuo County, Inner Mongolia, to Taohuayu in Xingyang City, Henan Province; the middle reaches of the Yellow River; and areas from below Taohuayu estuary to the lower reaches of the Yellow River.
In this paper, the spatial and temporal distribution characteristics of national intangible cultural heritage projects in the Yellow River Basin were studied by using quantitative statistics and GIS spatial analysis technology from a geographical perspective. The reasons affecting the distribution of intangible cultural heritage projects were analyzed using the geographical detector model, which provides a scientific basis for the inheritance and research of intangible cultural heritage projects in the Yellow River Basin.
2. Research Methods and Data Processing
2.1. Research Methods
2.1.1. Standard Deviation Ellipse
The standard deviation ellipse is used to study the spatial distribution characteristics of intangible cultural heritage items in each time section. The standard deviation ellipse reflects the distribution characteristics, the agglomeration degree, and the agglomeration center of intangible cultural heritage projects through the long axis, the short axis, the ellipse area, and the ellipse center of gravity, so as to show the direction and centrality of intangible cultural heritage distribution. The smaller the elliptical area and the distance between the long and short axes, the greater the degree of agglomeration, and vice versa. The formulas for calculating the ellipse center of gravity and the standard deviation ellipse are:
where SDEx and SDEy are the axial lengths of the standard deviation ellipse in the x-axis and y-axis directions, respectively; = , , and and represent the horizontal and vertical coordinates of the i item in the t time section, respectively. and denote the abscissa and ordinate of the center of gravity of the t time section.
2.1.2. The Nearest-Point Index
The nearest-neighbor index is used to analyze the degree of deviation from the random distribution by calculating the average distance between the nearest-neighbor intangible cultural heritage projects and comparing it with the average distance in the random distribution model. The calculation formula is:
where NNI stands for the nearest-neighbor index, mindij is the distance between a certain intangible cultural heritage and its nearest neighbor, n is the total number of intangible cultural heritage artifacts, and a is the total area of the study area. NNI ≤ 0.5 is aggregated distribution, NNI ≥ 1.5 is uniform distribution, 0.5 < NNI ≤ 0.8 is aggregated-random distribution, 0.8 < NNI < 1.2 is random distribution, and 1.2 ≤ NNI < 1.5 is random-discrete distribution.
2.1.3. Nuclear Density Analysis
Kernel density analysis is the density function of the estimated position in probability theory, which is used to detect the spatial aggregation degree of intangible cultural heritage projects. The calculation formula is as follows:
where k () is a kernel function, h > 0 for the broadband, and (x − xi) is the distance between x and xi.
2.1.4. Spatial Autocorrelation
Firstly, Global Moran’s I index is used to test the similar level of unit attribute values in adjacent areas of space. Secondly, the Getis-Ord index is used to calculate the local spatial autocorrelation, which reflects the spatial distribution law within the study area. The calculation formula is:
Here, x and S2 are the mean and standard deviation of variable x, respectively; n is the number of research units; xi and xj are attribute values of space units i and j, respectively; and Wij is a space weight matrix. According to the different values of distribution, this paper will be divided into six types: high-visibility hot spots, middle-visibility hot spots, low-visibility hot spots, random distribution area, low-visibility cold spots, and high-visibility cold spots.
2.1.5. Geographical Detector
Geodetector is a statistical model used to explore spatial differentiation and reveal the driving factors behind it [31]. In this paper, the differentiation and factor detection, and interaction detection in Geodetector are used. The former can analyze the explanatory power of a single influencing factor in the formation of intangible cultural heritage, and the latter can reflect the explanatory power of the interaction between the two different influencing factors in the formation of intangible cultural heritage. The explanatory power of a geographical detector is measured by the q value, and its expression is:
Here, n denotes the classification of factor x; Nm and N are the unit numbers of layer m and the whole region, respectively; and are the variance in layer m and region Y, respectively; and q is the detection value and the value range is [0, 1]. The larger the q value, the greater the explanatory power of the influence factor in the formation of intangible cultural heritage.
2.2. Data Source
The main source of the Yellow River Basin National Intangible Cultural Heritage data is the China Intangible Cultural Heritage Network, China Intangible Cultural Heritage Digital Museum (https://www.ihchina.cn (accessed on 20 December 2021)). Until now, the list of five batches of national intangible cultural heritage has been published. There are 78 items of folk literature; 116 items of traditional music; 79 items of traditional dance; 140 items of traditional drama; 49 items of folk art; 44 items of traditional sports, entertainment, and acrobatics; 110 items of traditional art; 127 items of traditional skills; 37 items of traditional medicine; and 111 items of folk custom in the intangible cultural heritage of the Yellow River Basin.
Querying the official website and other websites one by one has helped to determine the origin time of the intangible cultural heritage and its birthplace as the positioning coordinates. The spatial coordinates of the intangible cultural heritage are acquired from Google Maps, and the administrative boundary is culled from the 1:4 million basic geographic information database. Geomorphology, climate, hydrology, and other natural divisions are acquired from an atlas of China [32]; and cultural geography division is acquired from Chinese Cultural Geography [33].
3. Results and Analysis
3.1. Types of Intangible Cultural Heritage Structure in the Yellow River Basin
There are 891 national intangible cultural heritage items in the Yellow River Basin—176 in the first batch, 266 in the second batch, 132 in the third batch, 111 in the fourth batch, and 106 in the fifth batch—accounting for 24.7% of the national intangible cultural heritage (Table 1).

Table 1.
Number of batches of intangible cultural heritage in the Yellow River Basin.
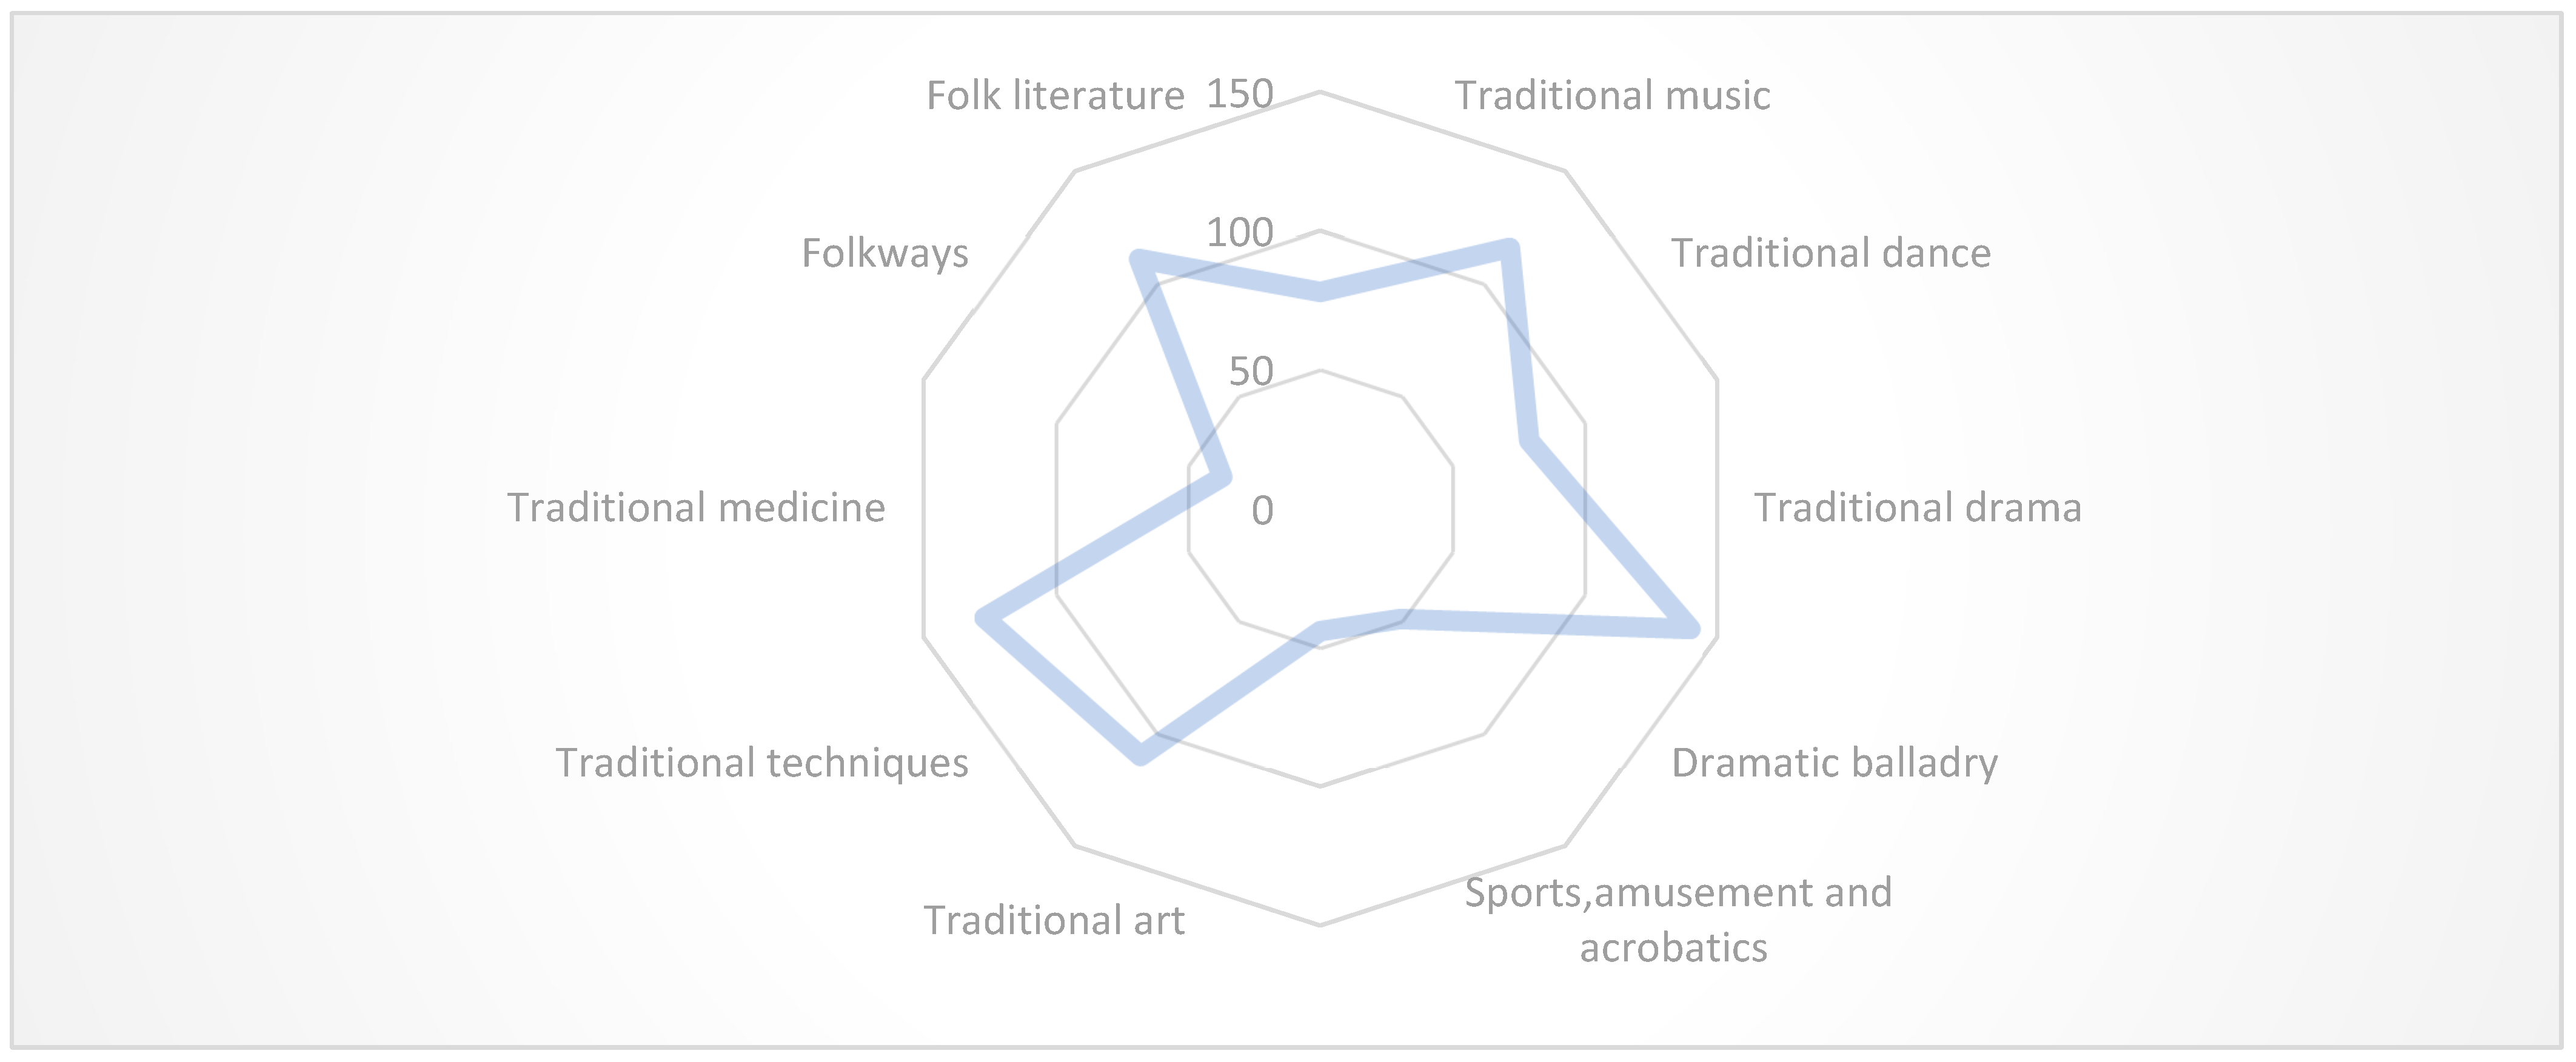
The proportion of intangible cultural heritage in the Yellow River Basin is high. In the five published lists of intangible cultural heritage, the proportion of intangible cultural heritage in the Yellow River Basin is more than 20% and the proportion in the second batch of national intangible cultural heritage lists is as high as 27.1%. The number of traditional operas in the intangible cultural heritage of the Yellow River Basin is the largest, accounting for 16%. The second is the traditional skills, accounting for 14%. Next, the traditional music class accounted for 13%, traditional art class accounted for 12%, folk class accounted for 12%, traditional dance class accounted for 9%, folk literature class accounted for 9%, and music class accounted for 6%. Traditional sports, entertainment and acrobatics, and traditional medicine account for only about 5% each. Traditional operas and traditional skills are the main types of intangible cultural heritage in the Yellow River Basin (Figure 1). Traditional sports, entertainment and acrobatics, and traditional medicine are difficult to learn due to their high technical content, and they are mostly inherited by small groups of people, which makes them prone to being lost, resulting in a small number of intangible cultural heritage artifacts.
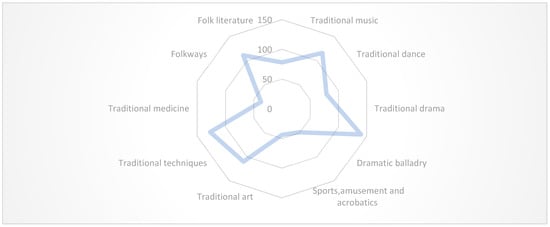
Figure 1.
Structure diagram of intangible cultural heritage types in the Yellow River Basin.
3.2. Distribution of Intangible Cultural Heritage Time Characteristics in the Yellow River Basin
The intangible cultural heritage in the Yellow River Basin has gradually formed over time. The analysis of the spatial distribution characteristics of the intangible cultural heritage in each time section is conducive to the correct understanding of the origin and development of intangible cultural heritage projects and helps protect and develop the intangible cultural heritage. The study spans nearly five thousand years. The spatial distribution of intangible cultural heritage and the shift of the center of gravity are deeply affected by time. So it is not analyzed across equal time intervals. On the basis of previous studies [34], the historical period is divided into the pre-Qin period (Xia, Shang, and Zhou), Qin and Han Dynasties (including three countries); Wei, Jin, and Southern and Northern Dynasties; Sui, Tang, and Five Dynasties; Song and Yuan (including Jin) Dynasties; Ming and Qing Dynasties; and modern and seven other time sections for analysis.
On the basis of the existing excavations, this paper analyzes the identified intangible cultural heritage of the Yellow River Basin across seven time intervals. The analysis shows that the distribution characteristics of each time section are significantly different (Table 2). According to the proportion of each category in each time section, combined with the specific analysis of historical knowledge, it can be seen that 159 pieces of intangible cultural heritage originated in the pre-Qin period, accounting for a relatively high proportion (18% of the total). In this period, most of the intangible cultural heritage was based on folk literature, folk customs, and traditional skills. Most of them involved the exploration and imagination of nature by the ancestors, and the influence of myth is strong. A total of 75 pieces of intangible cultural heritage (accounting for 9% of the total) originated in the Qin and Han Dynasties. Traditional art and traditional skills are the main intangible cultural heritage from this time. The unification of the Qin Dynasty and the prosperity of the Han Dynasty created good living conditions for creating intangible cultural heritage. For example, the invention of paper during the Han Dynasty prompted the production of paper-cut artwork everywhere. A total of 38 intangible cultural heritage artifacts (accounting for 4% of the total), dominated by traditional music, originated in the Wei, Jin, and Southern and Northern Dynasties. The rise of Buddhism and Taoism at this stage enabled the spread and development of religious music. A total of 109 pieces of intangible cultural heritage (accounting for 12% of the total) trace their origins to the Sui, Tang, and Five Dynasties. At this time, the ceramic technology represented by the tricolor of the Tang Dynasty was greatly developed, mainly based on traditional techniques. In all, 117 pieces of intangible cultural heritage (accounting for 13% of the total), mainly folk customs and traditional music, originated in the Song and Yuan Dynasties. In this stage, the northern minorities gradually occupied the dominant position, enabling the stable development of the intangible cultural heritage of minorities, gradually leading to prosperity. The maximum number of intangible cultural heritage artifacts originated in the Ming and Qing Dynasties, including a total of 377 items (accounting for 42% of the total). During this period, the traditional drama occupied a leading position, with 105 items. At this time, political stability, economic prosperity, and people’s living standards improved and there was more commitment to the pursuit of superstructure and spiritual prosperity, promoting the vigorous development of intangible cultural heritage. In the shorter modern times, 16 intangible cultural heritage artifacts (accounting for 2% of the total) have originated.
Table 2.
Types of intangible cultural heritage in the Yellow River Basin; historical quantity.
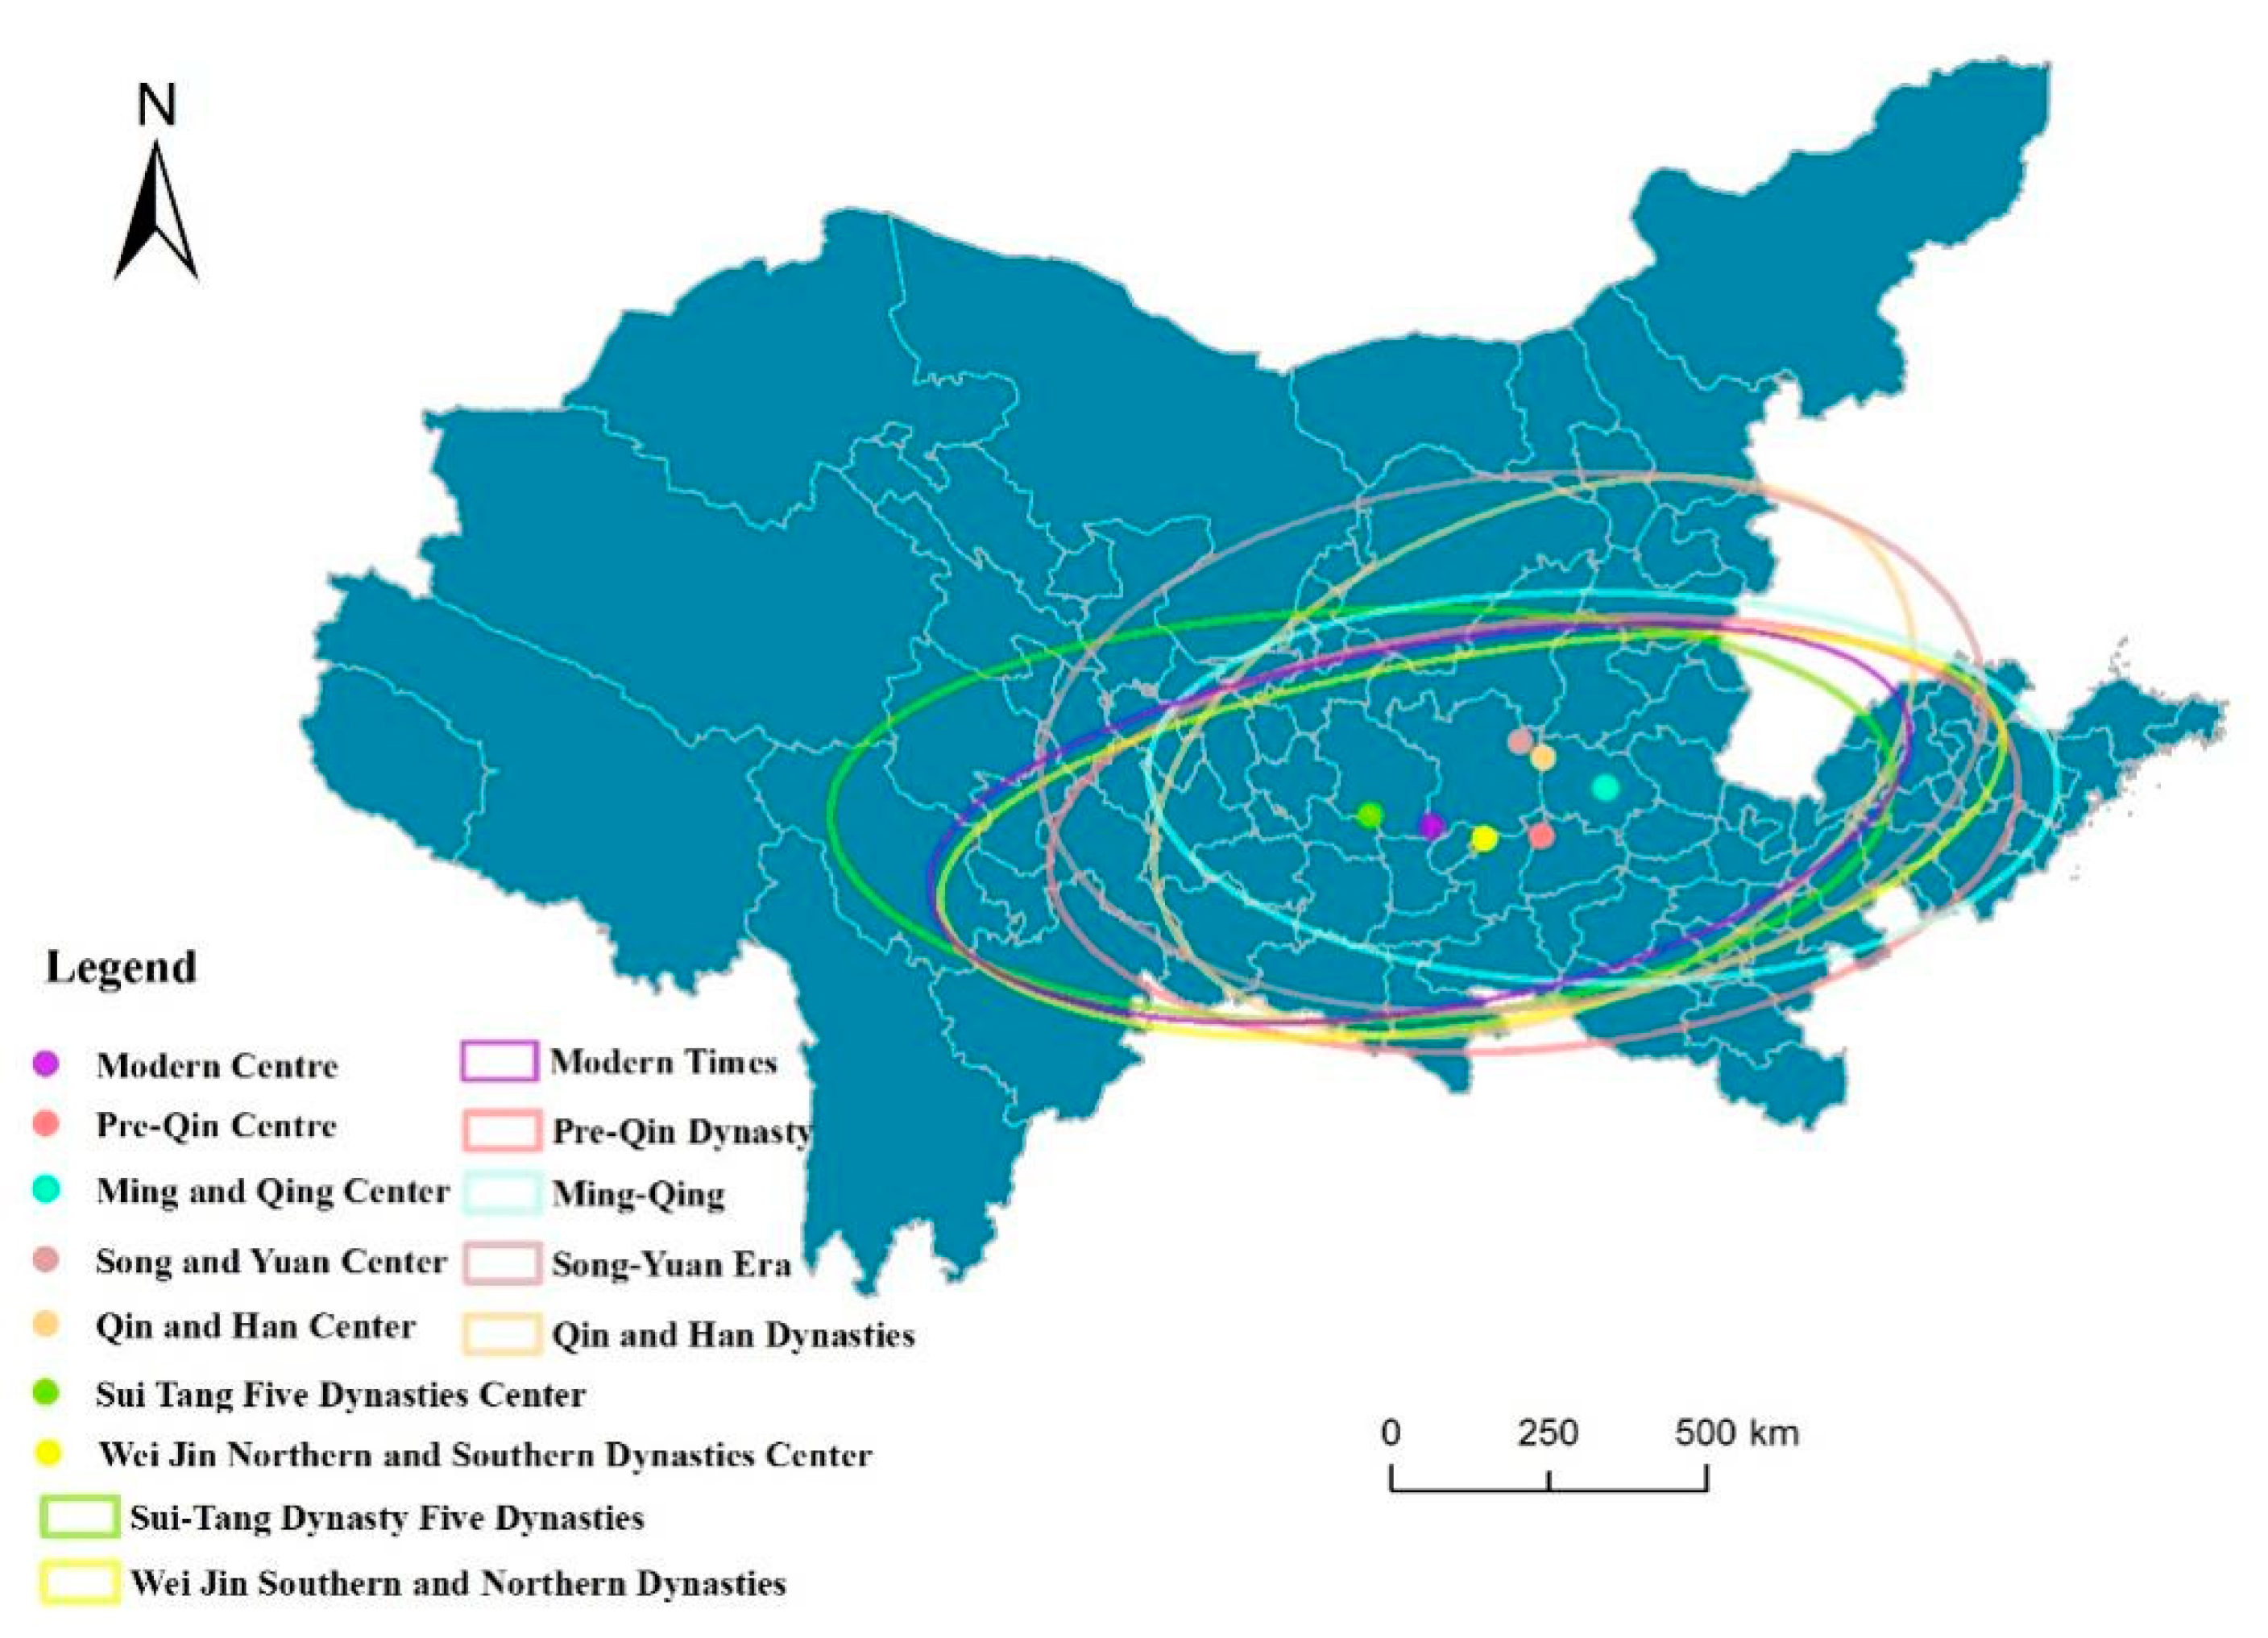
To more clearly analyze the spatial distribution pattern of the intangible cultural heritage in the seven time sections now registered, this paper uses the spatial statistical tool Arc-GIS10.2. The elliptical center of gravity of the known pieces of intangible cultural heritage in the Yellow River Basin from each time period is located in the middle reaches of the Yellow River and presents the development trend of “first west then east” in the central range (Figure 2). Historically, the pre-Qin period and the Qin and Han Dynasties were dominated by agriculture and people mainly lived in the middle reaches of the Yellow River, which provided a better natural environment. The elliptical center of gravity was located at the junction of Shanxi and Shaanxi. During the Wei, Jin, and Northern and Southern Dynasties and the Sui, Tang, and Five Dynasties, all ethnic groups interacted with each other and the intangible cultural heritage produced by Princess Wencheng alone included 20 items. The elliptical center of gravity of the intangible cultural heritage gradually developed westward. In the Song and Yuan Dynasties, due to the rise of northern Mongolia and other ethnic minorities, the elliptical center of intangible cultural heritage began to develop northeastward. Under the Ming and Qing Dynasties, the society became stable, the country became rich, and businesses prospered, creating fertile soil for the origin and development of intangible cultural heritage. The elliptical rotation angle of each time section presents a process of “decrease–increase” within the range of 70.8°–88.17°, indicating that the intangible cultural heritage distribution in the Yellow River Basin presents a spatial distribution pattern with east–west orientation in each historical period. With the continuous change in the economic, political, and cultural center in the Song and Yuan Dynasties, the elliptical area was the largest and the aggregation degree of intangible cultural heritage distribution was the lowest. During the Ming and Qing Dynasties, the national economic and political pattern was basically formed, so the elliptical area was the smallest and the agglomeration of intangible cultural heritage distribution was the strongest.

Figure 2.
Elliptical difference and center of gravity distribution of intangible cultural heritage standards in the Yellow River Basin.
3.3. Spatial Distribution of Intangible Cultural Heritage in the Yellow River Basin
3.3.1. Distribution Pattern of Intangible Cultural Heritage in the Yellow River Basin
The Yellow River Basin is cultural wealth left to us by our ancestors. The overall intangible cultural heritage from the Yellow River Basin presents a spatial distribution pattern that is dense in the east and sparse in the west (Figure 3). The eastern region has a superior geographical environment and a developed economy. It has a long history and a high level of social development and so has seen human-intensive and social development for a long time, leading to more intangible cultural heritage. The western region has a relatively poor geographical environment, poor economic and social development, a fragile ecological environment, and fewer human beings and has seen a shorter social development time.
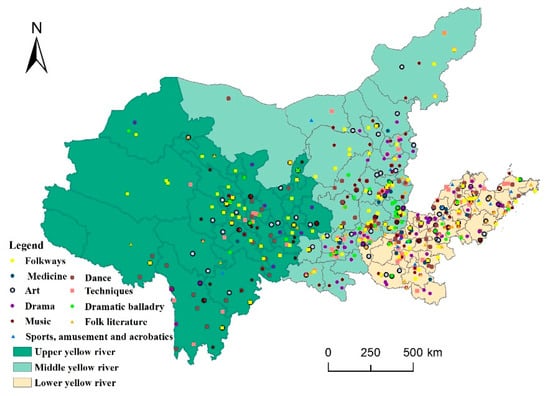
Figure 3.
Schematic diagram of the distribution of the intangible cultural heritage in the Yellow River Basin.
The distribution of intangible cultural heritage in the upper, middle, and lower reaches of the Yellow River Basin is as follows: the middle reaches of the Yellow River have 334 pieces of intangible cultural heritage (accounting for 37.5% of the total), followed by the lower reaches of the Yellow River (311 items, accounting for 34.9 of the total) and the upper reaches of the Yellow River (246 items, accounting for 27.6% of the total). This paper further analyzes the upper, middle, and lower reaches of the Yellow River from the perspective of density. The overall average density of intangible cultural heritage distribution in the Yellow River Basin is 3.12 items/million km2, and the density in the lower reaches of the Yellow River Basin is 9.63 items/million km2, which is far higher than the average level. The density in the middle reaches of the Yellow River Basin is 3.08 items/10,000 km2, which is slightly lower than the average level and in second place. The density in the lower Yellow River Basin is 1.69 items/10,000 km2, which is far below the average level and ranks third. The distribution of intangible cultural heritage is most intensive in the middle and lower reaches of the Yellow River Basin (Table 3).
Table 3.
Regional distribution of intangible cultural heritage in the Yellow River Basin.
3.3.2. Spatial Distribution Pattern of Intangible Cultural Heritage in the Yellow River Basin
The nearest-neighbor index (NNI, Table 4) is derived from Formula (3). The intangible cultural heritage in the Yellow River Basin presents an aggregated spatial distribution pattern.
Table 4.
The nearest-neighbor distance index of intangible cultural heritage in the Yellow River Basin.
From the perspective of batch analysis, the aggregation of the second batch of intangible cultural heritage is the strongest, the NNI value continues to increase from the second batch to the fifth batch of intangible cultural heritage, and the spatial cohesion gradually decreases. The spatial distribution pattern also decreases from the aggregation of the second batch of intangible cultural heritage to the aggregation-randomness of the fourth batch of the third batch of intangible cultural heritage and finally to the random distribution of the fifth batch of intangible cultural heritage.
From the perspective of classification, the traditional opera, traditional sports, entertainment and acrobatics, and folk art show a random distribution mode. The remaining seven types of intangible cultural heritage show an aggregation-random distribution mode. Traditional arts and crafts have the strongest aggregation, with an NNI value of 0.547; dramatic balladry has the weakest aggregation, with an NNI value of 0.823.
3.3.3. Spatial Aggregation of Intangible Cultural Heritage in the Yellow River Basin
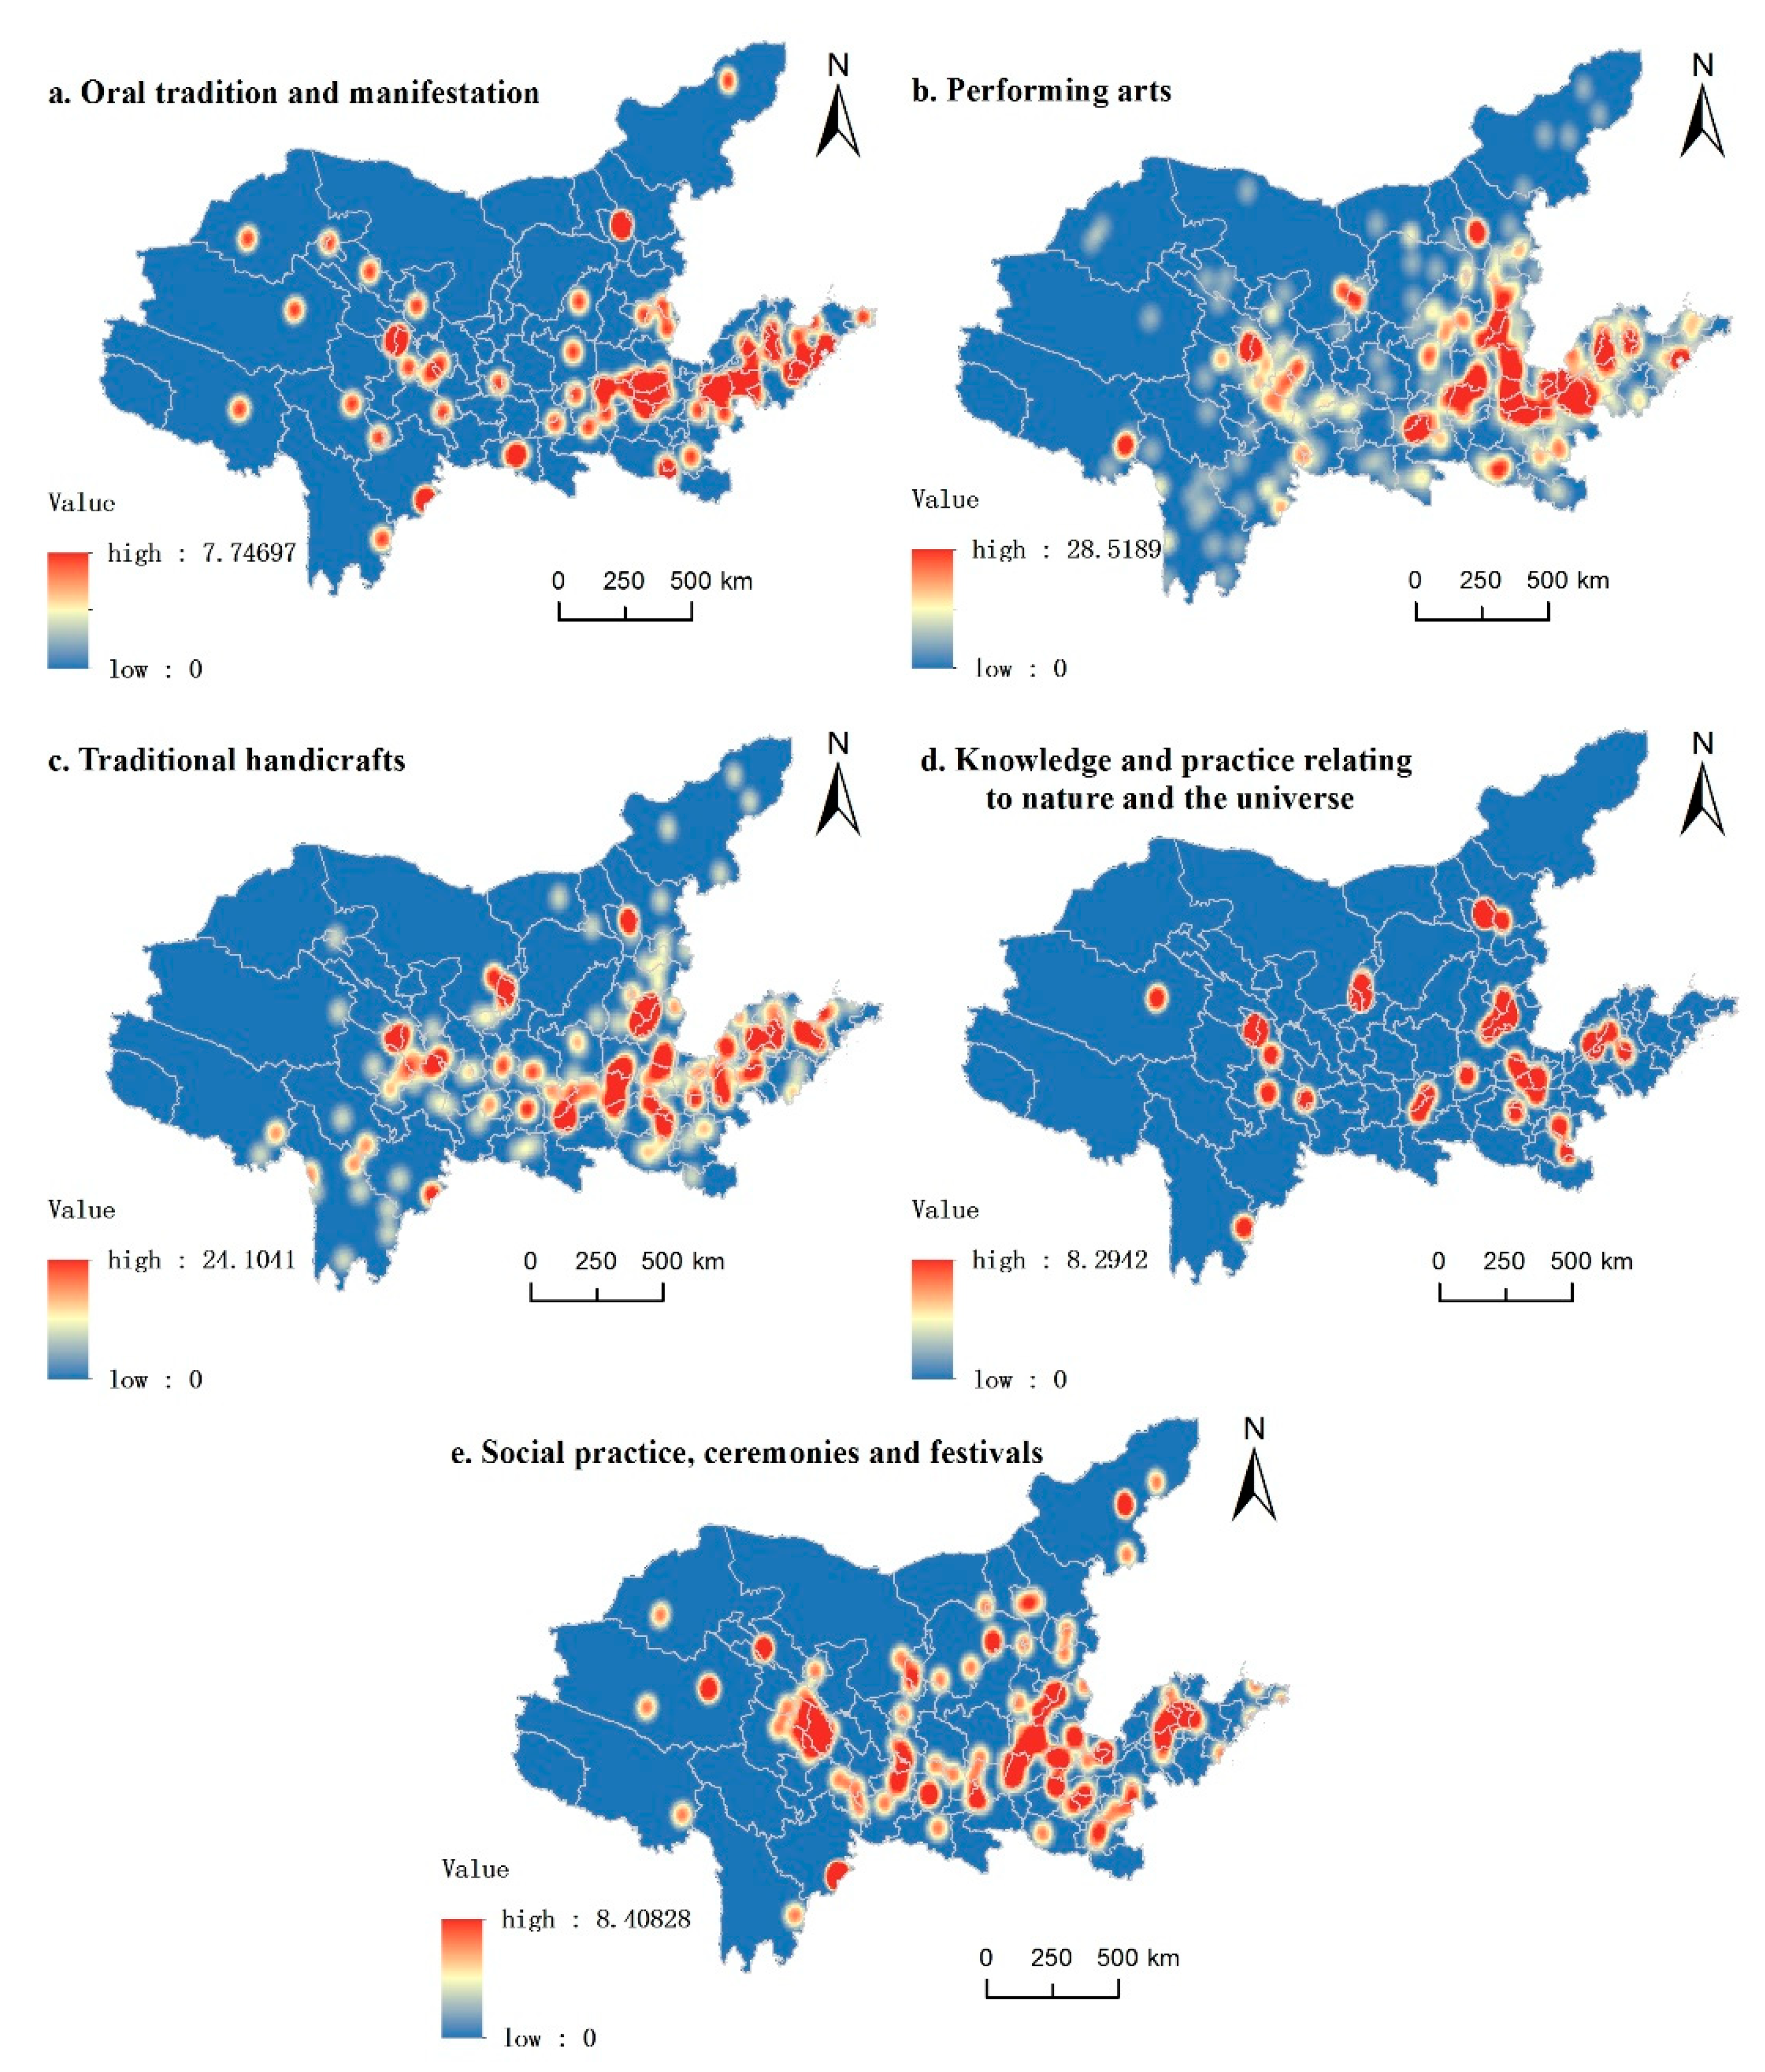
China’s intangible cultural heritage is divided into oral tradition and manifestations (folk literature), performing arts (traditional music, traditional dance, traditional opera, music, traditional sports and entertainment, and acrobatics), traditional crafts (traditional art, traditional skills, etc.), knowledge and practice related to nature and the universe (traditional medicine), social practice, and rituals and festivals (folk customs). To facilitate the study, the text uses the classification method of “Convention for the Protection of Intangible Cultural Heritage” in the analysis of the density of intangible cultural heritage in the Yellow River Basin.
Oral tradition and forms of intangible cultural heritage in the lower reaches of the intersection of Yuncheng City, Jincheng City, and Jiaozuo City; Heze City and Jining City in Shandong Province; and Rizhao City and Qingdao City form three high-density areas. The upper reaches of Xining City, Haidong City, the middle reaches of Taiyuan City, Yangquan City, Jincheng City, Hohhot City, and the downstream Zibo City form four high-density distribution areas (Figure 4a).

Figure 4.
Kernel density map of different types of intangible cultural heritage in the Yellow River Basin.
Intangible cultural heritage in the form of performing arts forms two high-density areas in the middle and lower reaches, in an L-shaped distribution pattern of high-density areas, showing central Shanxi with distribution characteristics from north to south and northern Henan Shandong with distribution characteristics from west to east. The second high-density area is in Yuncheng City and Linfen City in Southeast Shanxi. In addition, performing arts form three sub-high-density areas, in Xining City upstream, Xi’an City and Hohhot City mid-stream, and central Shandong Province downstream (Figure 4b).
Traditional handicraft is another kind of intangible cultural heritage and includes burning, dyeing and weaving, sculpture, and other categories. Traditional handicraft is an important part of Chinese art. However, with the development of modern industrial society, changes in people’s consumption concepts and levels, and the slow propagation cycle of its own inheritance, the development of traditional handicrafts is relatively slow. Traditional handicrafts show a spatial “trunk–wings” distribution pattern in space. The trunk position of traditional handicrafts is composed of three high-density areas (central Shanxi, southwest Shanxi, and southeast Shanxi) and two sub-high-density areas (Hohhot and central Henan strip urban agglomeration). The right wing is composed of high-density areas in Jinan and Zibo and two sub-high-density areas in Liaocheng, Heze, and Weifang. The left wing is composed of the Xining-Haidong area, the Hetao plain area, and the Xi’an area with three sub-high-density areas (Figure 4c).
The knowledge and practice of nature and the universe have formed two high-density areas in central Shanxi, as well as in Jincheng and Xinxiang. The Tibetan areas of Xining and Haidong; the Inner Mongolian areas of Hohhot; Xi’an, the ancient political center; and the Hetao Plain, with rich products, form four high-density areas (Figure 4d). Social practice, rituals, and festivals form two high-density areas: the H distribution pattern in the middle and lower reaches of the Yellow River and the cluster distribution pattern in Xining and Haidong. In addition, two sub-high-density areas are in central Shandong, Guyuan City and Tianshui City (Figure 4e).
3.3.4. Spatial Correlation Analysis of Intangible Cultural Heritage in the Yellow River Basin
According to Formula (5), the Moran’s I value of intangible cultural heritage in the Yellow River Basin is 0.073251, tested by the level of visibility (Z (I) > 1.96, P (I) < 0.05). It shows that the intangible cultural heritage in the Yellow River Basin has a positive spatial autocorrelation in different regional spatial units, showing a relatively strong spatial agglomeration pattern.
Using the Getis-Ord statistics of Formula (6), the number of intangible cultural heritage artifacts in each region is imported into this method for calculation and the high-value region and low-value region are obtained with a Z score and p-value.
The intangible cultural heritage in the Yellow River Basin presents an “east hot and west cold” spatial distribution pattern. Hot spots in the middle and lower reaches of the region form a ring structure, with central and southern Shanxi as the core. Hot spots and high-profile indigenous areas are distributed in Taiyuan, Jinzhong, Lvliang, and Changzhi in central and southern Shanxi. The prominent indigenous areas in the hot spots are mainly distributed in two regions. The first is a total of seven urban areas, around Yulin, Xinzhou, Yangquan, Anyang, Hebi, Jincheng, and Jiaozuo. The second is the upstream Guoluo Tibetan Autonomous Prefecture and the Ganzi Tibetan Autonomous Prefecture. The hot spots with low visibility are the most peripheral areas distributed in the hot spot circle structure, which are composed of Yan’an City, Linfen City, Zhengzhou City, and Xinxiang City. The cold point area is mainly distributed in the northern part of the Yellow River Basin. The cold point high-profile indigenous areas are distributed in the form of a strip from the northwest to the southeast, followed by Alxa League, Jiayuguan City, Shizuishan City, Yinchuan City, Wuzhong City, and five other urban areas. Indigenous areas with low cold spots are distributed in Zhongwei City and Wuhai City. In most other regions of the Yellow River Basin, there is no obvious aggregation and the distribution area is random (Figure 5).
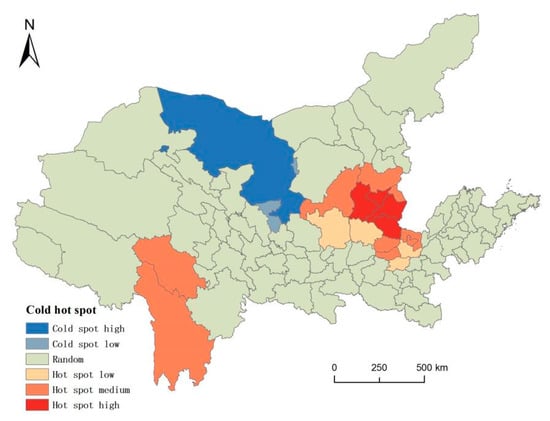
Figure 5.
Distribution map of hot and cold areas of intangible cultural heritage in the Yellow River Basin.
4. Influencing Factors
The results of the analysis show that the spatial distribution of the intangible cultural heritage in the Yellow River Basin has a strong spatial dependence and its spatial distribution pattern is formed under the combined action of many factors. To quantitatively study the formation mechanism and the influence of factors and their interaction on the formation of the intangible cultural heritage in the Yellow River Basin, this paper uses two models of differentiation and factor detection and interaction detection in Geodetector.
4.1. Selection of Influencing Factors
The intangible cultural heritage of the Yellow River Basin has been naturally generated and has constantly developed over the long history of the river. Its formation is closely related to the local cultural and ecological environment. Cultural ecology is a nature−society−economy composite involving three aspects of the region: natural environment, economic environment, and social environment. Accordingly, the influencing factors of ICH can be classified into three categories: natural, social, and economic. Combined with the theory of cultural geography and previous research progress, this paper studies the causes of intangible cultural heritage in the Yellow River Basin in terms of seven factors in three aspects: nature, economy, and social culture. Taking the number of intangible cultural heritage projects in cities of the Yellow River Basin as the dependent variable, seven independent variables, i.e., topography, climate, hydrology, total GDP, per capita GDP, cultural zoning, and policy support, are selected. Geomorphology, climate, hydrology, and cultural zoning help to calculate the density of each geographical unit after the superposition of the number of intangible cultural heritage projects in the Yellow River Basin and the zoning map and then code it with the combination of administrative divisions. Since the first batch of intangible cultural heritage items published in 2006, the total GDP is represented by the average of 15 years, from 2006 to 2020, of cities, states, and allies in the Yellow River Basin. The GDP per capita of selected cities, states, and leagues in the Yellow River Basin is a 15-year average from 2006–2020. It is difficult to quantify policy support as a non-digital factor. This paper selects the word frequency of “intangible cultural heritage” mentioned in the 15-year government work report of cities, states, and leagues in the Yellow River Basin from 2006 to 2020.
4.2. Single Factor Analysis
The differentiation and factor detection model was used to calculate the influence of each index on intangible cultural heritage formation in the Yellow River Basin (Table 5). All seven factors passed the significance test at the 0.05 level, indicating that they are important driving factors affecting the spatial distribution of intangible cultural heritage in the Yellow River Basin. The order of explanatory power for the spatial differentiation of intangible cultural heritage in the Yellow River Basin from high to low is as follows: policy support (0.4256) > per capita GDP (0.3233) > total GDP (0.2332) > topography (0.1531) > climate (0.1306) > hydrology (0.1199) > culture (0.0435).
Table 5.
Detection results of intangible cultural heritage factors in the Yellow River Basin.
Among social and cultural factors, the value of policy support factor q is the highest, indicating that policy support has the greatest impact on the spatial differentiation of intangible cultural heritage. The declaration, protection, development, and inheritance of intangible cultural heritage cannot be separated from the support of local policies. The degree of support of policies reflects the local emphasis on intangible cultural heritage, which is manifested in the differentiation of intangible cultural heritage in space. The cultural zoning factor q is the lowest of all indicators, indicating that both the easternmost Qilu cultural subregion and the westernmost Tibetan nomadic cultural subregion can breed brilliant intangible cultural heritage. From the perspective of social and cultural factors, the Yellow River Basin is rich in intangible cultural resources, and more policies are needed to explore them and ensure they are inherited. The q values of the two factors of economic factors are high, ranking two or three, indicating that economic factors have always had an important influence on the generation and inheritance of non-heritage items. The terrain factor has the highest explanatory power among natural factors. The distribution of intangible cultural heritage decreases with the increase in terrain. Compared with rugged terrain, high-altitude mountains, and plateaus, flat terrain, low-altitude plains, and basins are more suitable for human survival and development and social practice and more conducive to the generation and inheritance of intangible cultural heritage.
Good climate and when people’s lives are relatively easy, is conducive to the birth and spread of intangible cultural heritage; on the contrary, the formation and development of intangible cultural heritage will be hindered by harsh climate, cold wave invasion, alpine hypoxia, and when people face difficulties in their life. Among the 10 types of intangible cultural heritage projects, climate is the most closely related to folk intangible cultural heritage. Twenty-four solar terms (spring cattle custom in the hometown) in Anyang City, Henan Province, are formed by the influence of climate. The last is the hydrological factor. Since ancient times, the richness of water resources has directly affected human production and life and thus affected the distribution of intangible cultural heritage.
4.3. Interaction Analysis
The differentiation and factor detection model can explore the degree and mode of influence of a single factor on the spatial differentiation of intangible cultural heritage in the Yellow River Basin, but by analyzing the interaction between the two factors, the interaction detection model can detect whether the explanatory power of the spatial differentiation of intangible cultural heritage in the Yellow River Basin will be enhanced or weakened or whether the influence of factors on the spatial differentiation of intangible cultural heritage in the Yellow River Basin is independent (Table 6). The model shows that the explanatory power of the two-factor interaction in the spatial differentiation of intangible cultural heritage in the Yellow River Basin is stronger than that of the single factor and the types of interaction are dominated by nonlinear enhancement and supplemented by two-factor enhancement. This shows that the spatial differentiation characteristics of intangible cultural heritage in the Yellow River Basin are formed under the joint influence of independent variables, such as topography, climate, hydrology, total GDP, per capita GDP, cultural zoning, and policy support, and not by a single independent variable or a single factor. From the q value, the explanatory power of the interaction between policy support and other factors is strong, among which the explanatory power of the interaction with GDP is the strongest (0.8299), followed by the explanatory power of the interaction with per capita GDP (0.7893) and hydrology (0.6945). In addition, the explanatory power of terrain factors in natural factors has been greatly improved after their interaction with economic factors and social and cultural factors. The explanatory power reaches a value of 0.7004 when interacting with per capita GDP, and the explanatory power is also higher when interacting with the total GDP (0.6310) and policy support (0.6208). Further analysis shows that the dominant factors affecting the spatial differentiation pattern of intangible cultural heritage in the Yellow River Basin are affected not only by policies and economy but also by topography.
Table 6.
Interaction detection results of intangible cultural heritage factors in the Yellow River Basin.
5. Discussion
5.1. Discussion on the Temporal and Spatial Distribution of Intangible Cultural Heritage
In the exploration of the development history of intangible cultural heritage, the determination of the time section is an important part. Chai et al. defined the development of intangible cultural heritage as three stages of development, from the Stone Age to the pre-Qin period, from the Qin and Han Dynasties to the Song Dynasty, and from the Yuan and Ming to the Qing Dynasties [35]. Han et al. defined the development of intangible cultural heritage as six stages according to cultural characteristics [36]. This paper makes a statistical analysis of the declared intangible cultural heritage of the Yellow River Basin according to the seven mainstream time sections, and the results show that the intangible cultural heritage developed prosperously in the pre-Qin period; during the Sui, Tang, and Five Dynasties; during the Song and Yuan Dynasties; and during the Ming and Qing Dynasties, which is consistent with the previous research results [35,36,37].
In terms of the research on the spatial differentiation characteristics of intangible cultural heritage in terms of time scale, Chai et al. used mathematical statistics to analyze the temporal distribution pattern of intangible cultural heritage in Shanxi Province [35]. Hu et al. calculated the geographical weighted average center of the intangible cultural heritage sites in each historical stage of Hubei Province, with the nuclear density value of the intangible cultural heritage as the weight, and characterized the spatial historical development trajectory of the intangible cultural heritage in Hubei Province [37]. In this paper, the standard deviation ellipse method is used to analyze the intangible cultural heritage of seven time sections in history. The production and development of intangible cultural heritage in the Yellow River Basin are concentrated in the middle reaches of the Yellow River and show a “first west then east” trend in the central range. Some scholars have explored and analyzed the intangible cultural heritage time according to the batch time published at the world, national, and provincial levels [38,39]. In the section on the spatial distribution model, this paper analyzes the nearest-neighbor index of five batches of intangible cultural heritage in the Yellow River Basin. An exploration of batch agglomeration law shows that China has gradually increased the development and use of intangible cultural heritage artifacts in minority areas and economically underdeveloped areas.
The spatial analysis method is used to analyze the intangible cultural heritage of the Yellow River Basin. According to it, the intangible cultural heritage presents a spatial distribution trend of agglomeration and has strong spatial dependence, which is consistent with the previous research results [40,41,42,43]. The intangible cultural heritage in the Yellow River Basin presents a dense-east-sparse-west spatial distribution pattern. This paper studies the spatial distribution of intangible cultural heritage in the Yellow River Basin in terms of the ten categories of Chinese intangible cultural heritage standards and the five categories of classification standards of the Convention for the Protection of Intangible Cultural Heritage. From the perspective of Chinese classification standards, traditional operas, traditional skills, and traditional art account for a relatively high proportion. From the perspective of international classification standards, the proportion of performing arts is the most prominent.
5.2. Discussion on the Causes of Non-Inherited Differentiation
In recent years, a large number of studies have analyzed the factors influencing non-inherited differentiation. Xu et al. used superposition of the spatial distribution characteristics of intangible cultural heritage, natural geographical characteristics, and cultural geographical characteristics to analyze the pattern of Chinese intangible cultural heritage differentiation [26]. Wang et al. analyzed the causes of non-remaining differences in Xinjiang from five aspects: topography, river distribution, ethnic migration, the promotion of the ancient Silk Road, and the level of economic development [44]. Wu et al. made a qualitative and quantitative analysis of the causes of differentiation of Chinese intangible cultural heritage from the perspectives of rivers, topography, climate, economy, ethnic groups, cultural areas, and seven other aspects [45].
Previous studies on the influencing factors of intangible cultural heritage are mostly divided into two types. One is qualitative research, and the other is qualitative or quantitative research on various indicators by different methods. There are few articles using a unified method to analyze the causes of intangible cultural heritage. In the few articles using Geodetector to explore the causes of intangible cultural heritage distribution, the differentiation and factor detection models are more used, while the interaction detection model is ignored. On the basis of the theory of cultural geography, this paper determines the three criteria layers, of nature, economy, and social culture, and uses Geodetector to make a systematic quantitative analysis of the causes of intangible cultural heritage in the Yellow River Basin. In the specific analysis process, not only the score and factor detection model are used to analyze the influencing factors, but also the interaction detection model is used to explore the influencing factors of heritage in the Yellow River Basin. Geodetector studies show that the spatial and temporal distribution pattern of intangible cultural heritage is generated by multiple natural, economic, social, and cultural driving factors, consistent with previous studies [44,45,46]. In this study, policy support of social and cultural factors has a major influence on the distribution of intangible cultural heritage in the Yellow River Basin. The Yellow River Basin is rich in intangible cultural heritage resources, but due to its own characteristics of activity, inheritance, and vulnerability, local government policy protection is critical to the protection and development of intangible cultural heritage.
In this paper, mathematical statistics analysis, standard deviation ellipse, nearest-neighbor index, kernel density analysis, and the spatial autocorrelation method are used to analyze the temporal and spatial distribution characteristics of intangible cultural heritage in the Yellow River Basin and the influence factors are quantitatively analyzed by geographical detectors. However, the provincial intangible cultural heritage projects are not included in the data processing, which is a point for improvement. The next research focus will be to study the tourism development mode of intangible cultural heritage in the Yellow River Basin through the spatial distribution pattern of intangible cultural heritage projects in the Yellow River Basin has formed under the Yellow River Basin so as to effectively improve the management and protection of intangible cultural heritage; strengthen the protection consciousness of, enhance the protection mechanism of, and effectively carry forward intangible cultural heritage and ensure it is inherited, and provide spiritual strength for the development of the country and the rejuvenation of the nation. Through the analysis of the interaction detection model, terrain factors are also the key factors affecting the distribution of intangible cultural heritage in the Yellow River Basin.
6. Discussion
- (1)
- According to what has been excavated, the intangible cultural heritage projects in the Yellow River Basin show a dense-east-sparse-west spatial distribution pattern. In the middle and lower reaches of the Yellow River Basin, a hot area centered on the central and southern Shanxi is formed. A cold point area centered on Alxa League is formed in the northern Yellow River Basin.
- (2)
- The intangible cultural heritage in the Yellow River Basin generally presents the “four peaks and three valleys” characteristics historically. The spatial distribution characteristics of various types are also different, and the oral tradition and manifestation of intangible cultural heritage are mainly composed of three high-density areas and four sub-high-density areas in the middle and lower reaches of the Yellow River. The intangible cultural heritage of performing arts in space is L shaped; the traditional handicrafts have a trunk–wings spatial distribution pattern; the spatial distribution pattern of knowledge and practice intangible cultural heritages related to nature and the universe consists of two high-density areas and four sub-high-density areas; social practice, rituals, and festivals are composed of two high-density areas and two sub-high-density areas. It can be seen from the NNI values of each batch that the state has been paying increasing attention to the development of intangible cultural heritage in economically backward areas and ethnic minority areas.
- (3)
- The spatial distribution pattern of intangible cultural heritage joint influence of policy orientation, economic development, topography, and other factors.
Author Contributions
Validation, S.H.; Writing—original draft, Q.L.; Writing—review & editing, Z.Z. All authors have read and agreed to the published version of the manuscript.
Funding
This research was funded by Shanxi Yellow River “5G+” Tourism Planning Research Fund, fund number: HH202005; New Era Postgraduate Political and Ideological Education Collaborative Mechanism and Management Model Research Project Fund, fund number: 2021YJJG146; 20-year Zhang Zhongwu Yellow River Cultural and Ecological Research Institute Funded by the project fund, the fund number is: (0503) Bureau level/(02242005).
Institutional Review Board Statement
Not applicable.
Informed Consent Statement
Not applicable.
Data Availability Statement
Not applicable.
Acknowledgments
We express our gratitude to the anonymous reviewers and editors for their professional comments and suggestions.
Conflicts of Interest
The authors declare no conflict of interest.
References
- Opinions on Further Strengthening the Protection of Intangible Cultural Heritage. Office of the State Council. 12 August 2021. Available online: http://www.gov.cn/gongbao/content/2021/content_5633447.htm (accessed on 17 February 2022).
- Bille, M. Assembling heritage: Investigating the Unesco proclamation of Bedouin intangible heritage in Jordan. Int. J. Herit. Stud. 2012, 18, 107–123. [Google Scholar] [CrossRef]
- Giudici, E.; Melis, C.; Dessì, S.; Ramos, B.F.P.G. Is intangible cultural heritage able to promote sustainability in tourism? Int. J. Qual. Serv. Sci. 2013, 5, 101–114. [Google Scholar]
- Cominelli, F.; Greffe, X. Intangible cultural heritage: Safeguarding for creativity. City Cult. Soc. 2012, 3, 245–250. [Google Scholar] [CrossRef]
- Wang, Y.; Bramlell, B. Heritage protection and tourism development priorities in Hangzhou, China: A political economy and governance perspective. Tour. Manag. 2012, 33, 988–998. [Google Scholar] [CrossRef]
- Xie, F. Review of foreign intangible cultural heritage related research. Guizhou Ethn. Stud. 2011, 3, 93–98. [Google Scholar]
- Cozzani, G.; Pozzi, F.; Dagnino, F.M.; Katos, A.V.; Katsouli, E.F. Innovative technologies for intangible cultural heritage education and preservation: The case of i-Treasures. Pers. Ubiquitous Comput. 2017, 2, 1–13. [Google Scholar]
- Arizpe, L. How to Reconceptualize Intangible Cultural Heritage; Springer International Publishing: Berlin Germany, 2015. [Google Scholar]
- Fromm, A.B. Ethnographic museums and intangible cultural heritage return to our roots. J. Mar. Isl. Cult. 2016, 5, 9–10. [Google Scholar] [CrossRef]
- Hiroyuki, H. Between Preservation and Tourism: Folk Performing Arts in Contemporary Japan. Asian Folk. Stud. 2003, 62, 225–236. [Google Scholar]
- Arizpe, L. Intangible cultural heritage, diversity and coherence. Mus. Int. 2004, 56, 130–136. [Google Scholar] [CrossRef]
- Robinson, R.N.S.; Clifford, C. Authenticity and festival food service experience. Ann. Tour. Res. 2012, 39, 571–600. [Google Scholar] [CrossRef]
- Xiang, Y. On the Concept and Category of “Oral and Intangible Heritage”. Folk. Cult. Forum 2004, 3, 69–73. [Google Scholar]
- Yang, Y. The origin, present situation and related problems of intangible cultural heritage concept. World Herit. 2003, 2, 27–31. [Google Scholar]
- Wu, X. A Preliminary Study on the Concept of Intangible Cultural Heritage. China Mus. 2004, 1, 66–70. [Google Scholar]
- Liu, K. Some theoretical reflections on the protection of intangible cultural heritage. Folk Cult. Forum 2004, 4, 51–54. [Google Scholar]
- Mu, Y.; Tan, H.; Liu, Z. An Introduction to Intangible Cultural Heritage; Beijing Normal University Press: Beijing, China, 2010. [Google Scholar]
- Tian, Q. On the generality and particularity of the protection of intangible cultural heritage in western China—Take the “Intangible Cultural Heritage Law” as the starting point. J. Minzu Univ. China 2012, 39, 95–101. [Google Scholar]
- Zhang, X.; Yu, H.; Chen, T.; Wang, X.; Wang, F. The Value Evaluation System and Application of Intangible Cultural Heritage Resource Tourism Development—Taking Suzhou City as an Example. Adv. Geogr. Sci. 2016, 35, 997–1007. [Google Scholar]
- Pu, L.; Xiao, L. Investigation and Research on the Status Quo of the Educational Inheritance of the Yi Nationality’s Long Narrative Poem “Ashima”. Ethn. Educ. Res. 2016, 27, 137–144. [Google Scholar]
- Hu, Z.; Liu, P.; Deng, Y.; Deng, Y.; Zheng, W.; Qiu, H. Recognition of Landscape Gene of Rucheng Intangible Cultural Heritage: Taking Incense Dragon as an Example. Human Geogr. 2015, 30, 64–69. [Google Scholar]
- Ding, Y. Study on the Policy Measures Related to the Systematic Protection of Intangible Cultural Heritage during the 14th Five-Year Plan Period. Manag. World 2020, 36, 22–35. [Google Scholar]
- Mang, Z.; Liu, Z. Several Key Issues on the Concept of Intangible Cultural Heritage Protection in China. Folk. Stud. 2019, 6, 39–46+157–158. [Google Scholar]
- Gao, B. The Future Folklore Outline of Daily Life. Folk. Stud. 2017, 1, 19–34+157. [Google Scholar]
- Dai, Q.; Liu, J.; Wu, Y.; Xu, W. Discussing the protection of Guangxi’s intangible cultural heritage from a regional perspective. Resour. Sci. 2013, 35, 1104–1112. [Google Scholar]
- Xu, B.; Pan, J. Spatial distribution characteristics and influencing factors of China’s national intangible cultural heritage. Econ. Geogr. 2018, 38, 188–196. [Google Scholar]
- Zhang, J.; Wen, J.; Liu, J.; Zhu, H. Spatial and temporal distribution characteristics and tourism response of intangible cultural heritage in Shanxi Province. Sci. Geogr. Sonics 2017, 37, 1104–1111. [Google Scholar]
- Jiang, J.; Yang, Q.; Zhang, Z.; Su, K. Spatial pattern and tourism development model of intangible cultural heritage in Chongqing. Econ. Geogr. 2019, 39, 205–213. [Google Scholar]
- Miao, H.; Zhang, M. Research on the Spatial Structure of “Intangible Cultural Heritage” Tourism Resources in Northwest Ethnic Areas Based on GIS Buffer Analysis. Resour. Environ. Arid. Areas 2014, 28, 179–186. [Google Scholar]
- Hao, J.; Lin, S.; Wang, G.; An, X.; Ren, Q. Distribution characteristics and utilization of the intangible cultural heritage tourism resources in Liaoning Province. World Reg. Stud. 2018, 27, 167–176. [Google Scholar]
- Wang, J.; Xu, C. Geodetector: Principle and prospective. Acta Geogr. Sin. 2017, 72, 116–134. [Google Scholar]
- Wang, J. Atlas of China; China Map Press: Beijing, China, 2004. [Google Scholar]
- Wang, H. Chinese Cultural Geography; Central China Normal University Press: Wuhan, China, 2010. [Google Scholar]
- Gong, S.; Li, Z.; Xie, H.; Wang, X.; Zhang, T.; Shi, G.; Chen, F. The temporal and spatial characteristics of epidemic in China in 3000 and its influencing factors. Acta Geogr. Sinica 2021, 76, 1976–1996. [Google Scholar]
- Chai, G.; Sun, W. Analysis on the spatial-temporal distribution and gravity center movement of intangible cultural heritage in Shanxi. Cult. Herit. Bimon. 2010, 2, 6–11. [Google Scholar]
- Han, S.; Xu, P.; Ma, P. Spatial and temporal distribution of intangible cultural heritage in Jiangsu and its influencing factors. Sci. Geogr. Sin. 2021, 41, 1598–1605. [Google Scholar]
- Hu, J.; Chen, M.; Zhang, Y.; Gong, Y.; Kong, Y. Research on the spatial and temporal characteristics of intangible cultural heritage in Hubei Province. Econ. Geogr. 2017, 37, 206–214. [Google Scholar]
- He, X.; Yi, J. Spatial-temporal distribution characteristics and influencing factors of intangible cultural heritage in Hunan Province. J. Cent. South Univ. For. Technol. (Soc. Sci.) 2018, 12, 69–74. [Google Scholar]
- Tian, X.; Hu, J. Research on the spatial-temporal pattern and tourism utilization of intangible cultural heritage in Gansu Province. J. Cent. China Norm. Univ. (Nat. Sci.) 2021, 55, 1073–1082. [Google Scholar]
- Li, J.; Zhao, Q.; Chen, J. Spatial Distribution Characteristics and Influencing Factors of Intangible Cultural Heritage in Yangtze River Economic Belt. Econ. Geogr. 2020, 40, 191–198. [Google Scholar]
- Liang, J.; Wang, H. Spatial Distribution Characteristics and Influencing Factors of Intangible Cultural Heritage in Pearl River—Xijiang Economic Belt. J. Soc. Sci. 2018, 12, 39–49. [Google Scholar]
- Li, R.; Zhao, W.; Chen, J. The structure and geographical spatial distribution characteristics of intangible cultural heritage in Fujian Province. Areal Res. Dev. 2014, 33, 97–102. [Google Scholar]
- Yuan, S.; Chen, B. The structure and geographical spatial distribution of intangible cultural heritage in Guangdong Province. Trop. Geogr. 2012, 32, 94–97. [Google Scholar]
- Wang, C.; Zan, M.; Shi, G.; Zhou, L. Spatial Distribution Characteristics and Causes of Cultural Resources in Xinjiang—A Case Study of Intangible Cultural Heritage. Arid. Land Geogr. 2021, 44, 584–591. [Google Scholar]
- Wu, Q.; Li, X.; Zhang, M. Spatial Distribution and Causes of Different Types of Intangible Cultural Heritage in China. Econ. Geogr. 2015, 35, 175–183. [Google Scholar]
- Kang, L.; Yang, Z.; Han, F. Spatial Distribution and Influencing Factors of Intangible Cultural Heritage in Xinjiang. J. Desert Res. 2022, 42, 158–166. [Google Scholar]


Publisher’s Note: MDPI stays neutral with regard to jurisdictional claims in published maps and institutional affiliations. |
© 2022 by the authors. Licensee MDPI, Basel, Switzerland. This article is an open access article distributed under the terms and conditions of the Creative Commons Attribution (CC BY) license (https://creativecommons.org/licenses/by/4.0/).