1. Introduction
Since the turn of the 20th century, global climate change has led to frequent natural disasters, causing economic losses of more than USD 900B, of which the economic losses caused by flood disasters are the highest, accounting for approximately 32% [
1]. The Intergovernmental Panel on Climate Change (IPCC) defines a flood as “the overflow of water from the normal range of channel or other water bodies, or the accumulation of water in areas that are not flooded under normal circumstances” [
2]. Under the effect of climate and geographical conditions, China is one of the countries with the most serious flood disasters in the world [
3]. The number, intensity, loss, and impact scope of flood disasters are the highest among the various types of natural disasters seen in this country [
4]. For example, the catastrophic flood in 1998 affected a total of 223 million people and caused a direct economic loss of CNY 166B.
Coal is the main energy source in China [
5]. In 2021, the raw coal output was 4.13 billion tons, and coal consumption accounted for 56% of the total energy consumption [
6]. As a disaster-bearing body, coal mines are seriously affected by flood disasters. Floods not only directly lead to flooding accidents and industrial square destruction, but also indirectly induce abnormal water gushing underground, water permeability issues, groundwater pollution, and other chain disasters [
7].
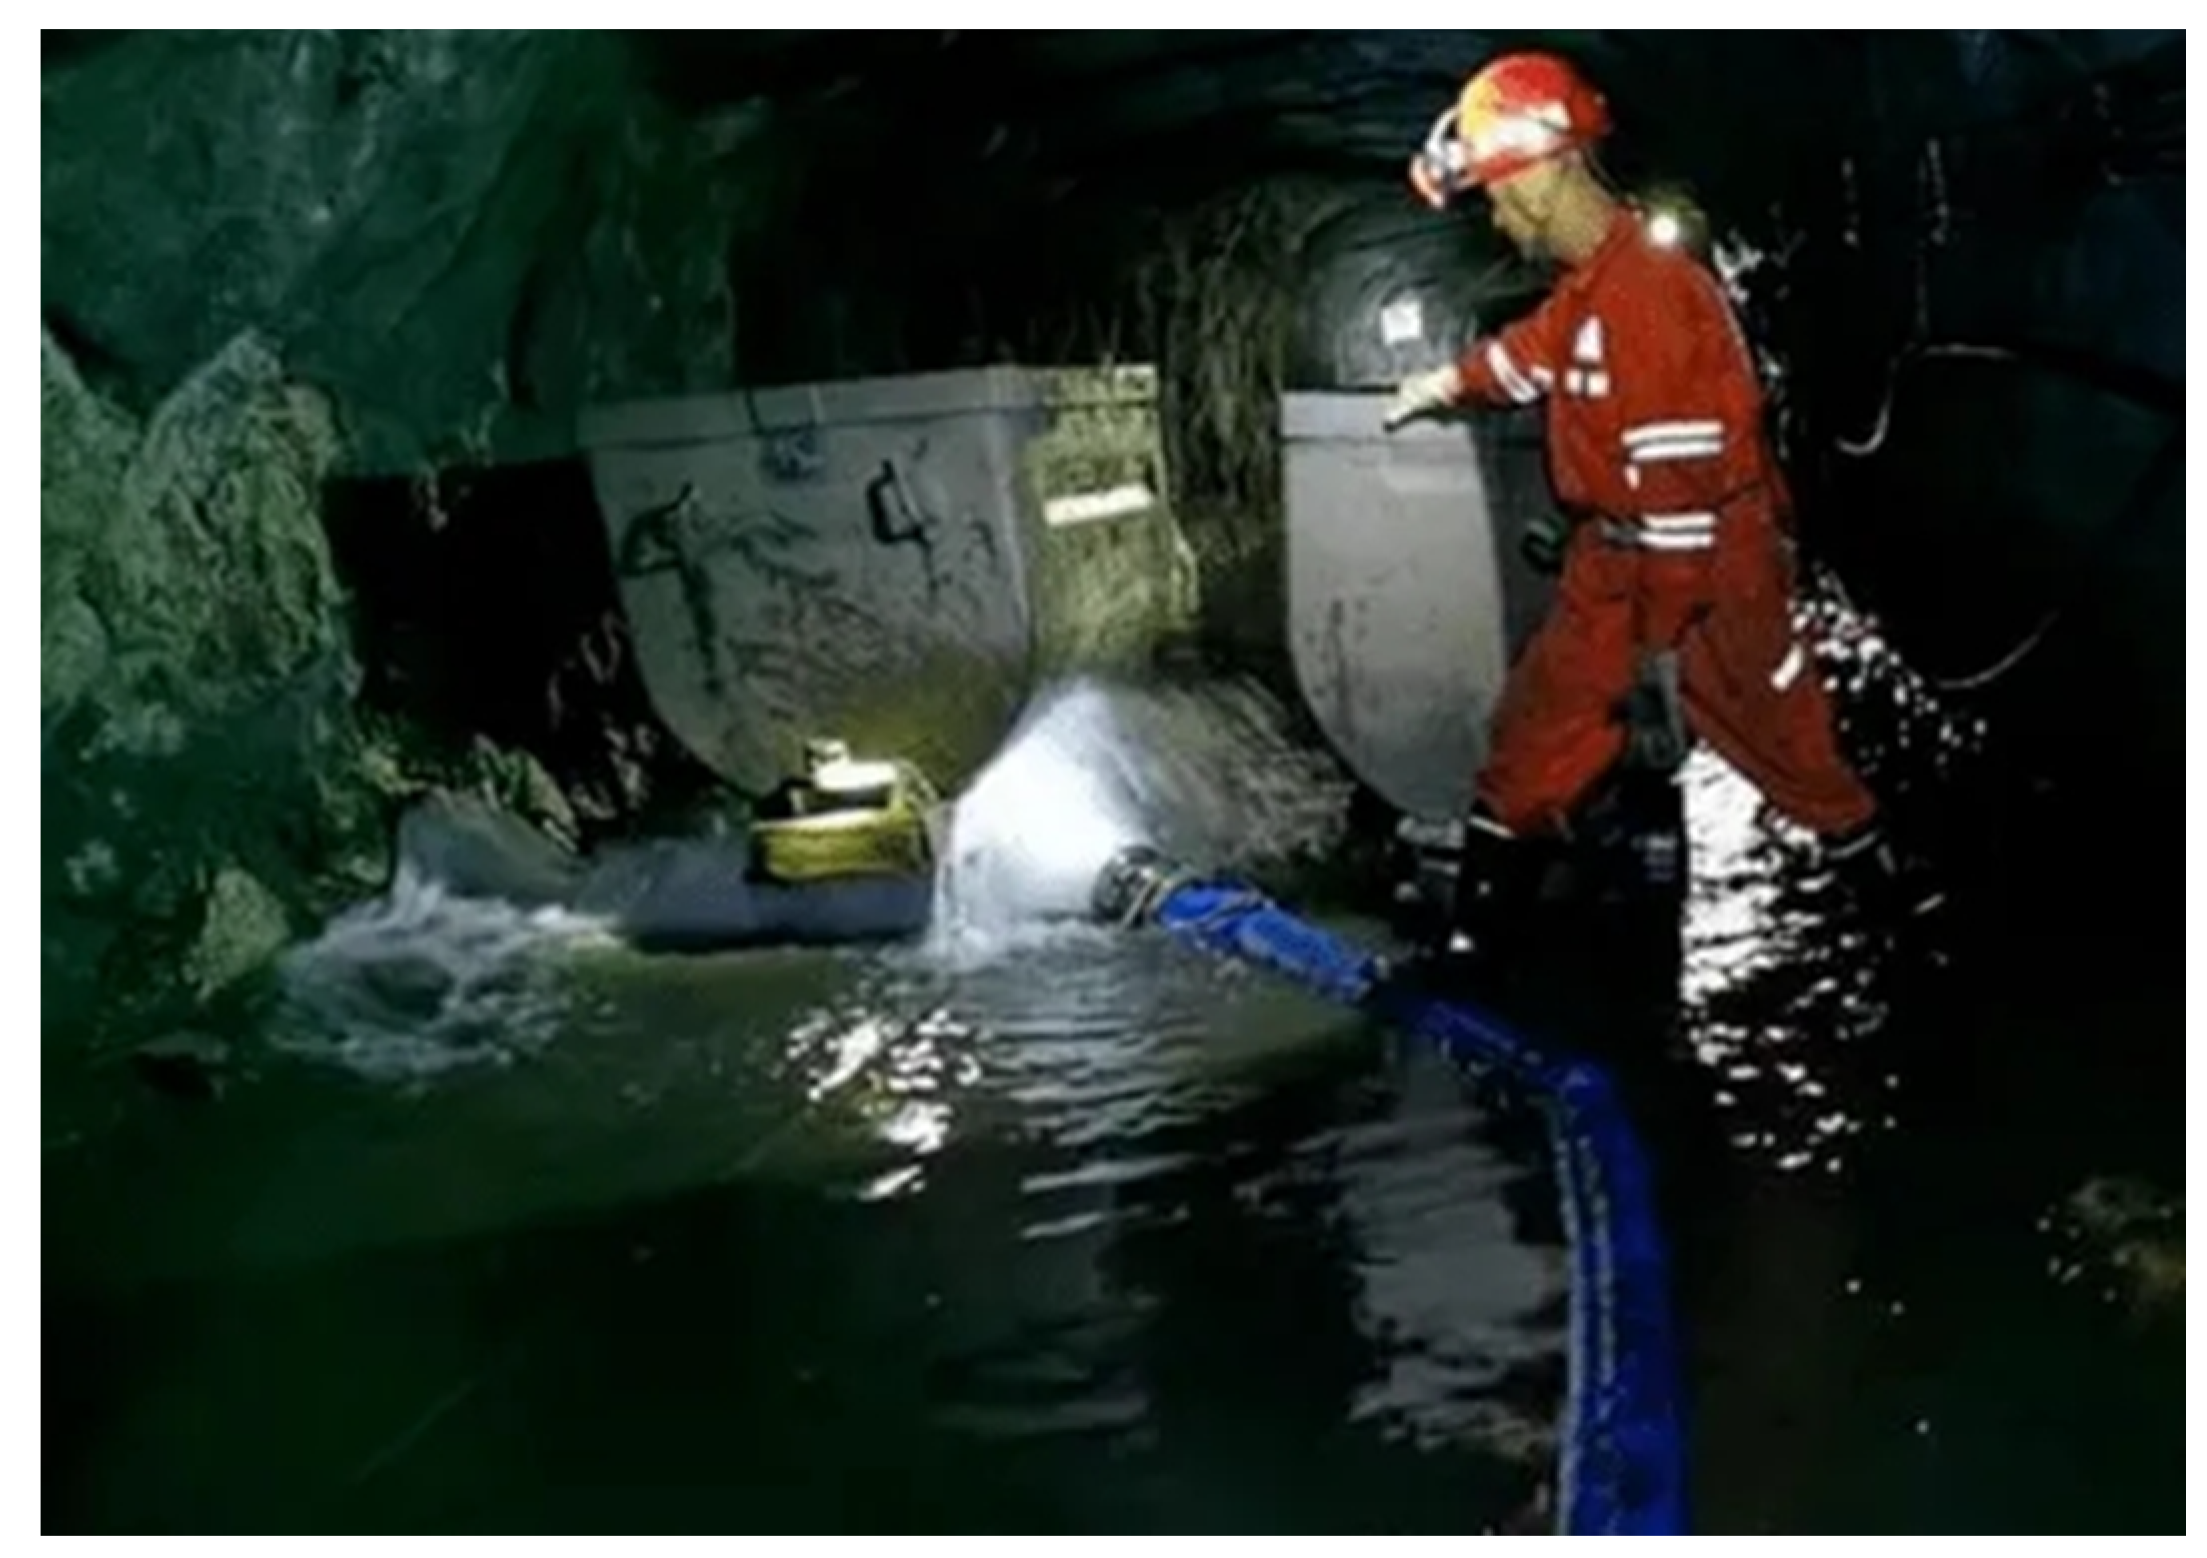
Figure 1 shows a flooding accident in a coal mine in Guizhou, China.
Some scholars have defined accidents caused by natural disasters as NaTech (Natural Hazards Triggering Technological Accidents) events [
8,
9].
Table 1 lists some published incidents of flood disasters in coal mines.
Analyzing the above, it can be noted that the prevention and control of coal mine flood disasters is a very important issue. Therefore, the purpose of this study is to quantitatively assess the risk of coal mine flood disasters. To achieve this, it is necessary to complete the following tasks: (1) construct an evaluation model and index system; (2) propose the risk assessment method of coal mine flood disaster; (3) visually display the evaluation results.
2. Literature Review
To effectively prevent coal mine flood disasters, the Chinese government has issued documents such as the “guiding opinions on the prevention of coal mine accidents and disasters caused by rainstorms and floods” and the “notice on the prevention of mine accidents and disasters caused by natural disasters such as rainstorms and floods” [
10], and scholars have also conducted relevant research.
In terms of disaster risk assessment, Shi et al. conducted systematic research on disaster risk science, including regional disaster system, disaster risk assessment, zoning, and disaster emergency management, and pointed out that the generalized disaster risk assessment is to assess a disaster system based on the hazard of disaster-causing factors, the stability of the disaster-prone environment, and the vulnerability of disaster-bearing bodies [
11,
12,
13]. Rachel et al. proposed a hurricane disaster risk index model based on the hazard of disaster causing factors, exposure, vulnerability, emergency response capacity, and resilience based on comparative research on hurricane disaster risk in the coastal areas of the United States [
14]. Hu et al. and Xiao et al. evaluated the regional flood disaster risk by establishing a comprehensive multi-index evaluation system [
15,
16]. Liu et al. established an evaluation index system based on disaster-causing factors, disaster-prone environment, and disaster-bearing body; used the AHP (Analytic Hierarchy Process) method and AHP-entropy weight method to determine the weight; and selected a reasonable flood risk evaluation method after comparison to comprehensively evaluate the flood disaster risk [
17]. Ali et al. quantified risk perception and communication in flood-prone rural areas of District Dera Ghazi Khan, Pakistan, and provided an insight into the need for risk communication for improving the effectiveness of flood risk reduction [
18]. Bernhofen et al. evaluated the usefulness of global data for assessing flood risk in five countries: Colombia, England, Ethiopia, India, and Malaysia. National flood risk assessments are carried out for each of the five countries using six datasets of global flood hazard, seven datasets of global population, and three different methods for calculating vulnerability [
19]. Sairam et al. and Shalikovskiy et al. evaluated the risk of flood disaster in Germany and Russia based on the regional flood model [
20,
21]. Tanaka et al. examined the impact of the river overflow and dam operation of upstream areas on downstream extreme flood frequencies through a case study of the Yodo River basin [
22].
In terms of the risk assessment of disaster-bearing bodies, Wang, Cao and Zhang studied the impact of flooding on a chemical industry park and its internal facilities and established a risk assessment index system for flood disasters in such parks [
23,
24,
25]. Kong et al. studied the current status of design standards for flood control and secondary disasters in chemical parks [
26]. Hu et al. evaluated the flood inflow risk of coal mines near river and lake embankments and established a river burst prediction model and a dike break flood inundation zoning model [
27]. Lyu et al. used the AHP and I-AHP (Interval Analytic Hierarchy Process) methods to conduct a comparative study on flood risk in a subway system [
28,
29]. Wang et al. used the projection pursuit method to evaluate the vulnerability of the subway station project to rainstorm and waterlogging [
30]. Qi et al. proposed a hidden danger screening method for earthquake-induced secondary disasters in coal mines and built a hidden danger screening system for secondary disasters induced by earthquakes in coal mines with the lifeline system as the main line [
31]. In a joint Chinese–Russian study, the authors investigated the manifestation of natural and man-made geodynamic phenomena in the eastern regions of Russia and China [
32]. In a joint Polish-German–Russian study, the authors assessed the risks of developing subvertical disturbance as a result of mining operations, predicted the possibility of the water-protective strata destruction and the likelihood of flooding of a mine that extracts potassium-magnesium salts, as well as proposed ways to reduce the risks of accidents [
33]. Krasyukova et al. proposed a rational approach to control underground mining operations in complex hydrogeological and geomechanical conditions based on risk assessment [
34]. Dudek, based on the finite element method, after calibrating the 3D numerical model using surface subsidence measurements, as well as geological and mining data, simulated the flooding process by changing the density of the medium according to classical soil and rock mechanics principles [
35].
Unfortunately, there has been no systematic study on the risks of coal mine flood disasters, and the existing evaluation system and method need to be improved. Therefore, based on the scientific theory of disaster risks, this study established a coal mine flood disaster risk assessment model and index system that covers the hazard of disaster-causing factors, the stability of the disaster-prone environment, and the vulnerability of the disaster-bearing body. A coal mine flood disaster risk assessment method based on the projection pursuit and fuzzy cluster analysis, which has been applied in Zunyi Coal Mine, Guizhou Province, China, was proposed. Targeted measures were devised based on the assessment results. This study tentatively proposes a flood disaster risk assessment method for coal mines, providing a basis to determine the level of flood disaster risk and to effectively implement flood disaster prevention and control measures. This is of great significance to the sustainable development of energy.
3. Methods
3.1. Assessment Model
The disaster system is a variation system of the Earth’s surface with complex characteristics composed of disaster-causing factors, disaster-prone environment, disaster-bearing body, and disaster situation [
36]. Based on the theory of the disaster system, the risk assessment of coal mine flood disaster includes three elements: the hazard of disaster-causing factors (hazard), the stability of the disaster-prone environment (stability), and the vulnerability of the disaster-bearing body (vulnerability).
Figure 2 shows the assessment model, which can be expressed as follows:
Through data collection, field investigation, and expert discussion, the main disaster-causing factor is found to be rainstorms. This hazard mainly considers the maximum daily rainfall (H
1/mm), rainstorm days (H
2/days), and annual average rainfall (H
3/mm). The stability evaluation of the disaster-prone environment is the sensitivity evaluation of this environment to disaster-causing factors, mainly considering the terrain and river around the mine (S
1), the hydrogeology type of the mine (S
2), the number of wellheads (S
3), the current situation of flood prevention (S
4/years), and drainage capacity (S
5/m
3·h
−1). The vulnerability is mainly determined by two factors. The first one is the fortification level (V
1) of the disaster-bearing body to flood disaster. The less substandard items of fortification, the higher the fortification level and the lower the vulnerability of the disaster-bearing body. The second is the population size (V
2), number of assets (V
3), and production capacity (V
4) exposed to disaster-causing factors in the disaster-prone environment. The higher the number, the higher the vulnerability of the disaster-bearing body.
Figure 3 shows the evaluation index system.
3.2. Projection Pursuit Method
The projection pursuit method is a statistical analysis method used to analyze and process non-normal high-dimensional data. The basic principle is to project the high-dimensional data onto a low-dimensional subspace, find the projection value that allows the projection index function to reach the optimal value, and analyze the characteristics of the high-dimensional data based on the projection value [
37,
38]. Thus, the objective weight of the evaluation index corresponding to the sample set is obtained, mainly including the following steps:
3.2.1. Sample Normalization
Assuming that the index
of the evaluation object
is
, where
is the number of evaluation objects, and
is the number of evaluation indicators. For the index data in the sample to have a unified dimension, the data in the sample are normalized using Equation (2).
Here, is the normalized sample value, and and are the maximum and minimum values of the index in the sample, respectively.
Assuming that
is the best projection direction vector,
is linearly projected onto a 1D projection index value according to Equation (3):
The key to determining the projection index value is to find the optimal projection direction vector that can reflect the characteristics of the high-dimensional data. Therefore, it is necessary to build a projection index function to optimize the projection direction vector.
3.2.2. Constructing Projection Index Function
The standard deviation
and local density
of the projection index value
are used to characterize the conditional constraints during projection.
and
are expressed in Equations (4) and (5), respectively:
Here, is the average value of ; is the distance between the projection index value and , , is the window radius of the local density, and in this study. is the unit step function when , and when , .
The projection index function can be expressed in Equation (6):
3.2.3. Optimizing Projection Index Function
The process of optimizing the projection index function is to find the optimal projection direction vector. The optimal projection direction refers to the unit projection vector that most likely represents the characteristics of the sample, that is, to find the maximum value of the projection index function. Therefore, the objective function can be expressed as in Equation (7):
The constraint condition is , and the DE algorithm is selected to optimize the objective function.
3.2.4. Calculating the Weight of Evaluation Index
Based on the optimized unit projection vector
, the objective weight
of each index can be obtained, as expressed in Equation (8):
3.3. Fuzzy Cluster Analysis
The fuzzy clustering analysis method uses the iterative operation between the membership matrix and the clustering center matrix to find the optimal membership matrix and the optimal clustering center matrix that minimize the square sum of the weighted generalized Euclidean weight distance of the sample set for all categories [
39,
40]. This method has a good clustering effect and is suitable for the evaluation of complex, multidimensional, random flood disaster sample sets.
Suppose that the evaluation set has
samples, forming a set
, and any sample
has
indicators, the vector
formed by its eigenvalues, and the normalized characteristic matrix
is expressed in Equation (9):
Here, is the normalized eigenvalue of the index of the sample.
For
evaluation samples, each sample has
evaluation indices, and a clustering analysis is conducted according to
grades. The fuzzy clustering relative membership matrix
is expressed in Equation (10):
Here, is the relative membership degree of the evaluation sample belonging to category , , is the number of samples, and is the number of classifications.
The fuzzy clustering center matrix
of
categories can be expressed in Equation (11):
Here,
is the relative membership of the
index to the
category, and the generalized Euclidean distance is used to express the similarity between the
sample and category
, as expressed in Equation (12):
Here,
is the
-normalized index eigenvectors of the
sample, and
is the fuzzy clustering center vector of category
. Considering the different weights of different evaluation indicators, Equation (12) is expanded to Equation (13):
Here, is the weight of the evaluation index, , and meets .
The generalized weighted Euclidean distance is expressed in Equation (14):
To minimize the square sum of the generalized weighted Euclidean weight distance, an objective function is constructed, as expressed in Equation (15):
The boundary conditions should be met: , and .
According to the Lagrange function method, the optimal fuzzy clustering center matrix
is expressed in Equation (16):
The level characteristic value of the evaluation sample is expressed in Equation (17):
Based on the size of the level characteristic value, the evaluation samples can be classified.
4. Case Study
4.1. Background
Zunyi City is located in Southwest China, between 106°17′22″–107°26′25″ east longitude and 27°13′15″–28°04′09″ north latitude, with a total area of approximately 30,762 km
2 (
Figure 4). It governs 14 counties, eight of which have coal mines. Zunyi City has a subtropical monsoon climate, which is cool and humid all year round with abundant rainfall. The main natural disasters include floods and geological disasters. The city currently has 35 production mines with a production capacity of approximately 13.5 million tons.
4.2. Evaluation Index Survey
Based on the evaluation index system constructed in
Figure 3, the hazard, stability, and vulnerability of 35 coal mines in Zunyi City were investigated. Among them, the index data of hazard were obtained from local meteorological departments; the literature, terrain, and water system were obtained from remote sensing images and DEM; and the remaining data were collected from the coal mine site.
Table 2,
Table 3 and
Table 4 present the survey results.
The survey results of the evaluation indicators are divided into four grades;
Table 5 presents the grading standards.
4.3. Weight Calculation
(1) The AHP is applied to calculate the weights of the evaluation indicators: hazard, stability, and vulnerability. The judgment matrix is expressed in Equation (18).
Table 6 presents the weights of the hazard, stability, and vulnerability.
(2) Using projection pursuit, the optimal projection direction vectors of each index of the hazard, stability, and vulnerability are calculated. The results are as follows:
According to Equation (8), the weights of each index of the hazard, stability, and vulnerability are shown in
Table 7,
Table 8 and
Table 9.
4.4. Risk Classification
Using the fuzzy clustering analysis, the optimal fuzzy clustering center matrix of the hazard indicators is obtained:
According to Equation (17), the level characteristic value of the hazard of the counties of coal mines in Zunyi City is obtained, as shown in
Figure 5.
Similarly, the optimal fuzzy clustering center matrix of the stability index is obtained:
The level characteristic values of the stability of the coal mines in Zunyi City are shown in
Figure 6.
Similarly, the optimal fuzzy clustering center matrix of the vulnerability index is obtained:
The level characteristic values of the vulnerability of the coal mines in Zunyi City are shown in
Figure 7.
5. Results
5.1. Results of Hazard, Stability, and Vulnerability
After normalizing the level characteristic values of the hazard of the counties of the coal mines in Zunyi City, GIS tools are used for visualization to obtain the spatial distribution map of the hazard levels, as shown in
Figure 8.
Similarly,
Figure 9 show the spatial distribution of the stability level and vulnerability level of the coal mines.
5.2. Results of Coal Mine Flood Disaster Risk in Zunyi City
According to Equation (1), the flood disaster risk for the coal mines of Zunyi City is expressed as in Equation (19):
6. Discussion
1. Among the factors that affect the risk level of coal mine flood disasters, the hazard of the disaster-causing factor has the highest impact, followed by the stability of the disaster-prone environment, and finally, the vulnerability of the disaster-bearing body.
2. In terms of the hazard of the disaster-causing factor, , the maximum daily rainfall has the highest weight. Rainstorms in Zunyi City have evident regional characteristics, with high values in the east and low values in the West. Suiyang County is the most prone to rainstorms and flood disasters. Therefore, an early warning and prevention mechanism for flood disasters should be established for the coal mine; active contact must be maintained with the local meteorological, water conservancy, and other departments. Data pertaining to local precipitation over the years and historical highest flood level should be considered, and inspection and emergency duty in key periods, such as during rainstorms and typhoons, should be strengthened.
3. In terms of the stability of the disaster-bearing environment, , the weight of the terrain and river around coal mines is the highest. The stability of coal mines in the east of Zunyi City is worse than that of western coal mines. The stability of seven coal mines, including Jiayi Coal mine in Xishui County, is poor, and the risk level is high. Therefore, the coal mine personnel should check the catchment, drainage, and leakage from surface water systems, such as mining area, mine field, and surrounding rivers that have an impact on mining and relevant water conservancy projects. The authorities must patrol abandoned shafts, ground collapse pits, mining fissures, boreholes, etc. within the scope of the mine field, and establish drainage, waterproof, and drainage systems.
4. In terms of the vulnerability of the disaster-bearing body, the weight of the flood prevention level in the coal mines is the highest. Huaqiu Coal Mine in Tongzi County, Jiyuan Coal Mine, and Mudanba Coal Mine in Xishui County are highly vulnerable. Therefore, prevention and control measures for flood disasters in these coal mines should be strengthened in accordance with the requirements of relevant standards, specifications, laws, and regulations. Flood control measures, such as building dams and excavating ditches, should be taken. Authorities must block abandoned shafts; reserve necessary emergency water pumps, pipelines, and other flood control and disaster relief equipment and materials; formulate special emergency plans; conduct regular drills; and improve the level of flood prevention.
5. Among the 35 coal mines in Zunyi City, the flood disaster risk level of two coal mines in Suiyang County is high, and the flood disaster risk level of four coal mines in Wuchuan County, Daozhen County, and Zheng’an County is medium-to-high, which is related to the high hazard of disaster-causing factors and the susceptibility to rainstorm and flood disasters in the coal mine location. Because Xing’an Coal Mine in Bozhou district is located in a low-lying area and there are rivers nearby, the number of wellheads is high, and the stability of the disaster-prone environment is poor; therefore, the risk level of flood disaster is medium-high. The flood disaster risk level of 19 coal mines, including Zhongyuan Coal Mine in Xishui County, is medium-low. The flood disaster risk level of nine coal mines, including Guanghua coal mine in Renhuai City, is low.
7. Conclusions
1. In the first level indicators of the risk assessment of flood disaster coal mines, the weight of hazard factors is the largest, and in the second level indicators, the weight of maximum daily rainfall is the largest.
2. To ensure energy sustainability, first, coal mines should regularly carry out flood disaster risk assessments to ascertain the flood disaster risk base of the coal mine. Secondly, an early warning and prevention mechanism for flood disasters should be established for the coal mine, and the coal mine should work alongside the meteorological departments to monitor and predict rainstorms and flooding. Finally, coal mines should reserve necessary emergency water pumps, pipelines, and other flood control and disaster relief equipment and materials, as well as formulate special emergency plans.
3. This study proposed a flood disaster risk assessment method for coal mines, providing a basis to determine the level of flood disaster risk. This is of great significance to the sustainable development of energy. However, this method is only applicable to underground coal mines, not to open-cast coal mines, and the evaluation index system still needs further improvement. In addition, this method can provide a reference for the risk assessment of other industries.


