Abstract
In order to realize the comprehensive utilization of the underground space formed by gypsum mining, with the core goal of building an oil storage depot in the gypsum mine goaf, the designed rock infiltration loading device was used to prepare gypsum rock samples immersed in oil for 0, 15, and 30 days for rock mechanics experiments. The influence of oil immersion on the mechanical behavior of the gypsum ore rock mass was studied, and the damage evolution mechanism of gypsum ore rock was explored through statistical fitting and normalized quantitative evaluation. The results show that, with the increase in oil immersion time, the peak stress and elastic modulus of gypsum rock both tend to decrease, and the decrease degree of each parameter is smaller when the confining pressure is higher. The normalized expression of each parameter of gypsum ore and rock with the oil immersion time was established, the deterioration coefficient of each parameter was defined, and the influence law of the oil immersion time on each parameter was analyzed. With the increase in oil immersion time, the internal friction angle of gypsum ore rock exhibited an increasing trend, while the other parameters exhibited a decreasing trend. The oil immersion time had the greatest influence on the cohesion of gypsum ore rock, followed by peak stress, internal friction angle, and elastic modulus. Moreover, it was further demonstrated that high confining pressure conditions weaken the deterioration effect of oil immersion on gypsum rock, i.e., high confining pressure conditions are more conducive to crude oil storage. The research results herein provide theoretical support for the improvement of the theory of “treatment and utilization synergy” in gypsum mine goaf.
1. Introduction
China is rich in gypsum ore resources, and the total proved reserves of various types of gypsum rank first in the world. The mining of gypsum mines is mostly carried out using the open field method, so a large number of goaves are inevitably formed after mining is completed. With the gradual increase in the exposed area and the influence of surrounding loads, accidents such as pillar deformation and roof collapse are prone to occur in the goaf [1,2,3]. Therefore, the gypsum mine goaf has become a major hidden danger in the field of mine disaster prevention and control and ecological environment governance, and how to control it has become a significant problem for mine safety production [4]. For many years, scholars around the world have been committed to replacing “government” with “management” of goaves, i.e., comprehensive utilization of the underground space of mines, giving full play to the resource attributes of this space [5].
In the historical process of the utilization of abandoned underground mining space, the utilization of salt caverns has the longest history [6]. Since the 1960s, thousands of salt caverns resulting from mining activity all over the world have been reused to store liquid hydrocarbons, gaseous hydrocarbons, and associated products. In 1977, the U.S. Department of Energy (DOE) developed a plan to use salt caverns to store strategic oil, with the ultimate goal of establishing a reserve of 1 billion bbl of crude oil [7]. With the advancement of technology and the urgent need for energy storage, an increasing number of salt caverns are used to store oil, natural gas, etc. [8,9,10]. Furthermore, in Qianjiang, Hubei, China, the deepest salt cavern gas storage facility in Asia is being built [11]. Salt caverns are also used for compressed air energy storage due to their unique characteristics [12]; thus, salt cavern energy storage has also become a key technical support for the world’s energy revolution.
In addition, the underground space formed by coal mining is also widely used in compressed air energy storage and pumped-storage power stations [13]. Spanish scholar Javier Menéndez demonstrated the feasibility of constructing a pumped-storage power station based on the underground voids formed by coal mining in central Asturias [14]. Various scholars have explored the impact of compressed air energy storage in the underground space of coal mines on the energy storage architecture from the perspective of technical feasibility and economic rationality [15]. In August 2019, China also began the construction of the country’s first compressed air energy storage power station based on the empty underground area at the Yungang Coal Mine, Datong, Shanxi Province. By efficiently utilizing clean energy, such as wind and solar energy, China’s energy structure has improved, and the sustainable development of the national economy has been promoted [16].
In recent years, many scholars have put forward the idea of comprehensive utilization of underground space formed by gypsum mining. For example, the use of underground voids in gypsum mines to sequester carbon dioxide helps to ensure the stability of the voids while contributing to the goal of carbon neutrality [17]. As a result of the high strength and rigidity of gypsum rock, the goaf formed by it is characterized by good stability and tightness [18]. Thus, certain scholars have proposed a new idea: using the underground space formed by gypsum mining as a crude oil reserve [10,19]. Wang Hanxun et al. describe a comprehensive idea for the stability evaluation of anhydrite mine-out used as an underground gas storage, including the inversion analysis of contact model parameters of anhydrite rock and numerical analysis based on a discrete element method (DEM) [20]. Based on a case study of the Anhui Hengtai anhydrite mine located in East China, Prof. Bin Zhang formulated a comprehensive field test program to investigate its tightness and stability and evaluate its feasibility for reuse as crude oil storage [21]. At present, underground water-sealed oil storage depots are mostly used for crude oil reserves. Such oil depots are mostly built in granite, and these constructions are significantly more difficult to create [22]. If the construction of crude oil storage based on the underground space of gypsum mines is feasible, it will represent a new way in which anhydrite goaves can be utilized while, at the same time, enriching crude oil storage methods, saving capital related to building storage facilities, and improving China’s energy storage capacity. For these reasons, it is of great strategic significance to ensure energy security.
However, the study of using the underground space formed by gypsum mining for crude oil storage remains in its infancy. For example, during the oil storage process, if the crude oil is immersed in the surrounding rock of the goaf, will the mechanical properties of the rock mass alter under the static pressure of the crude oil? Changes such as this and questions regarding whether the oil–rock coupling environment will affect the stability of the engineering structure are key and must be explored and answered. With the underground space formed by gypsum mining as the object and the construction of oil storage in the gypsum mine goaf as the core goal, the mechanical behavior and damage evolution mechanism of the oil-immersed gypsum ore rock mass were studied at the macro-scale. This study provides theoretical support for the improvement of the theory of “coordinated use of governance” in the goaf of mines.
2. Experimental Pretreatment
2.1. Sample Preparation
The gypsum rock samples were obtained from large rock samples from the −325 m middle section of the Longyuan Xiaxin gypsum mine, Hubei Province, China. The rock mass in this area is milky white or gray and appears to be layered.
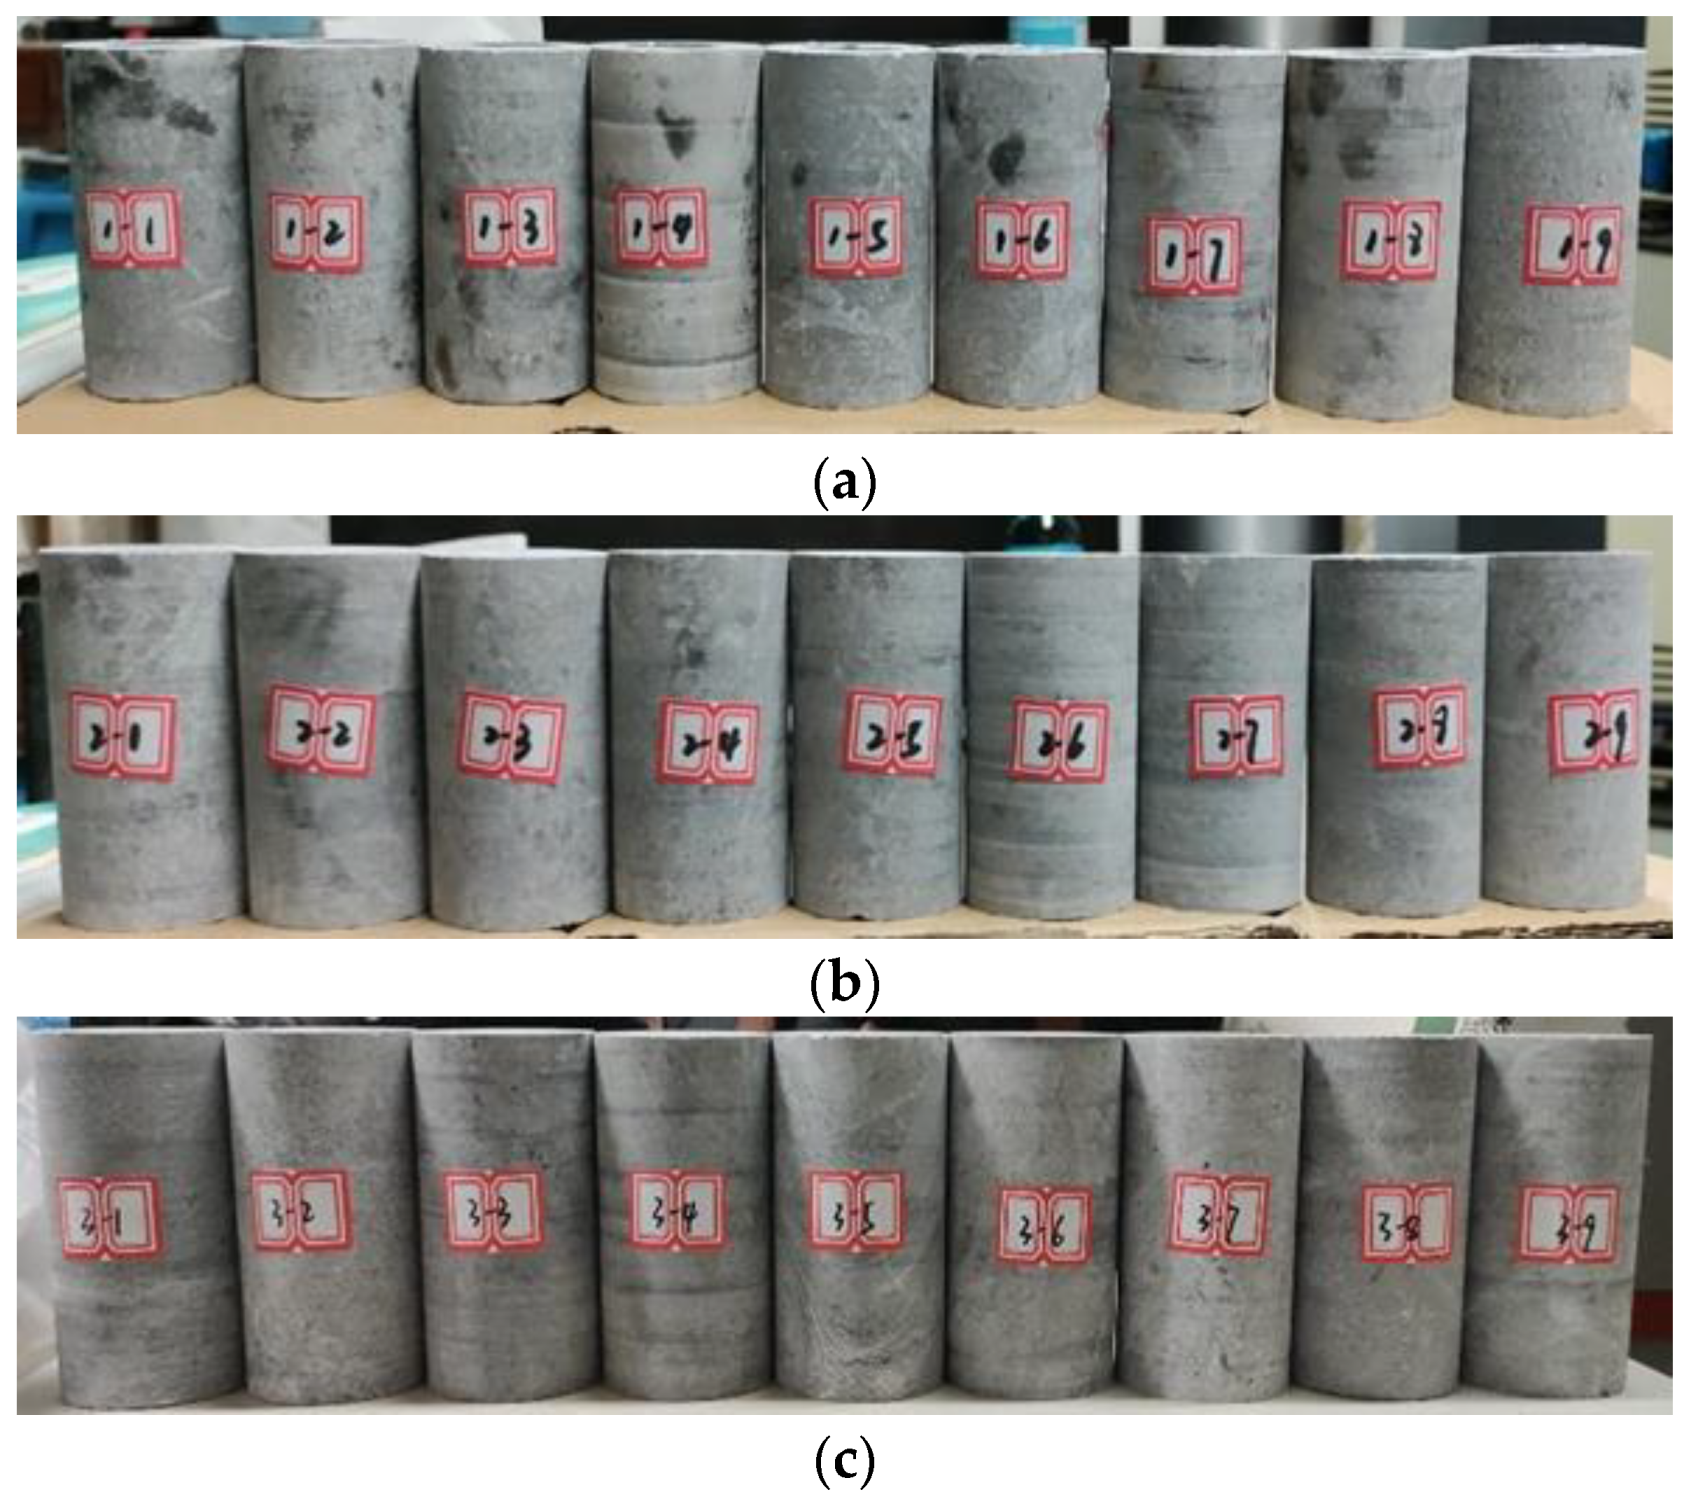
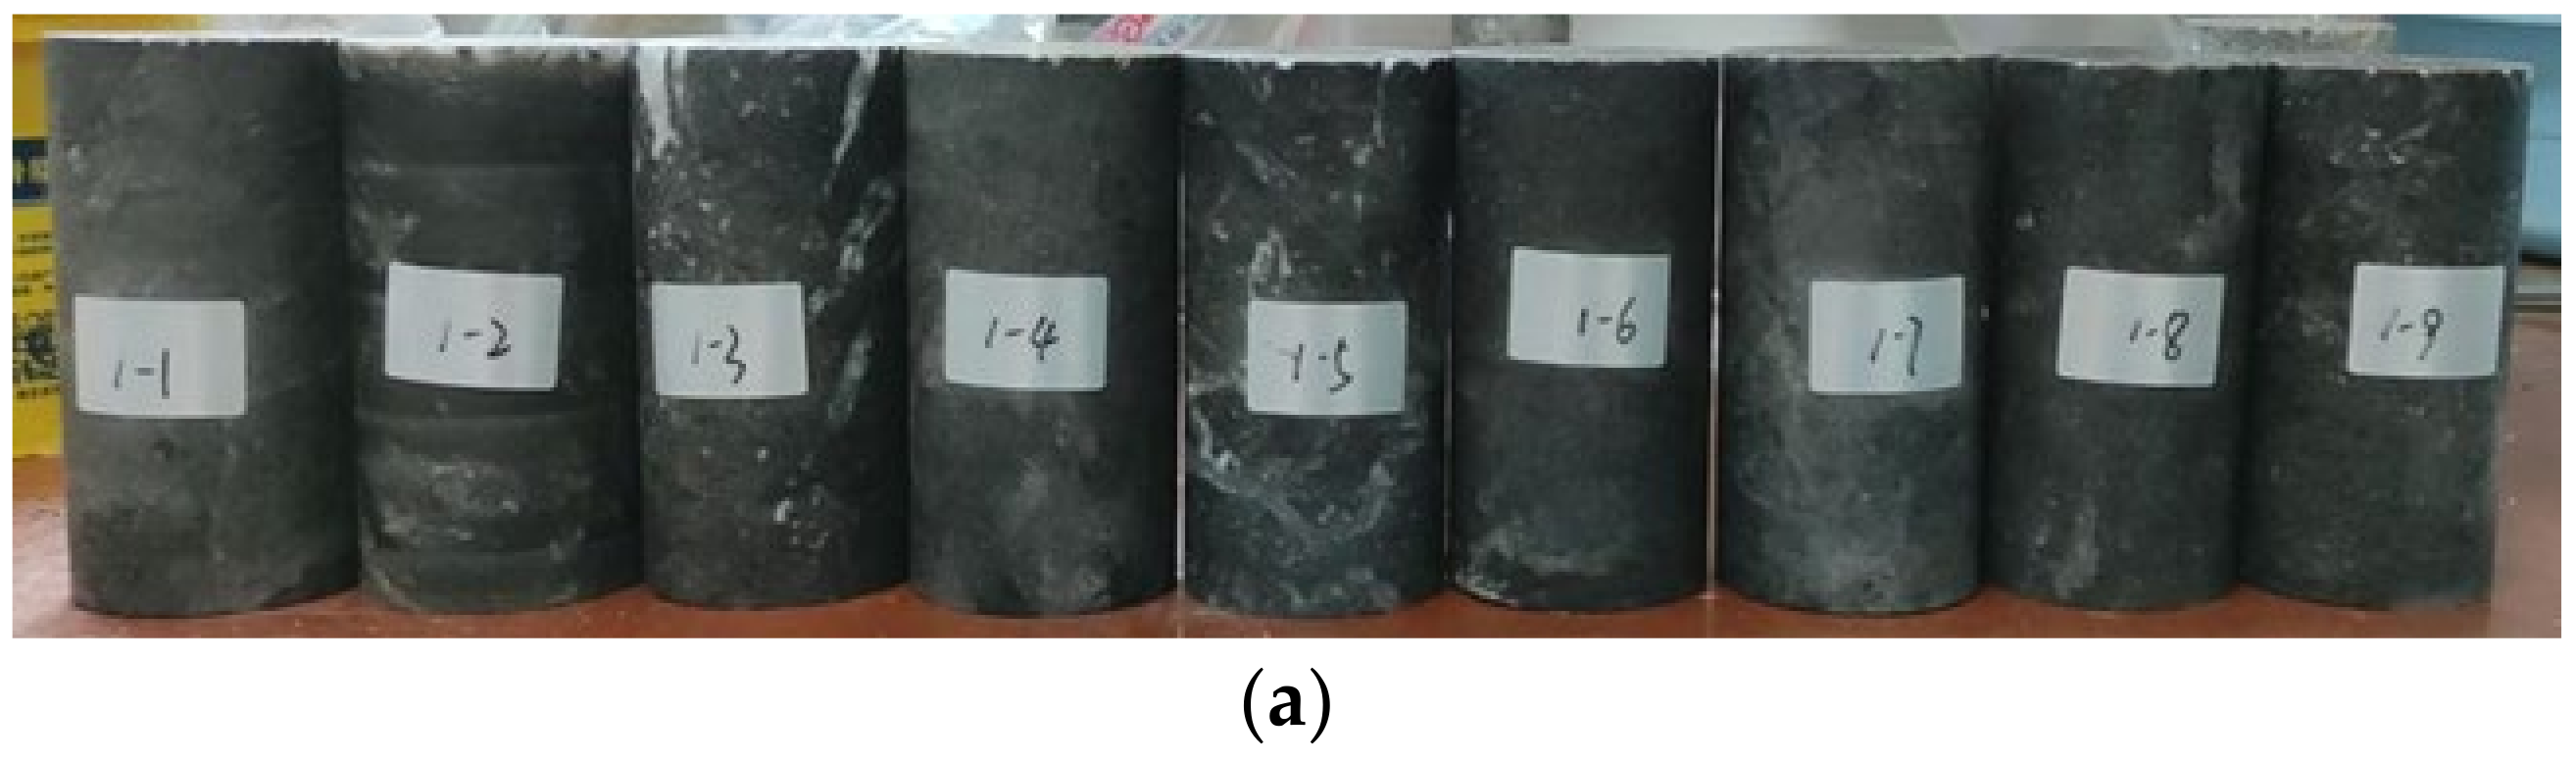
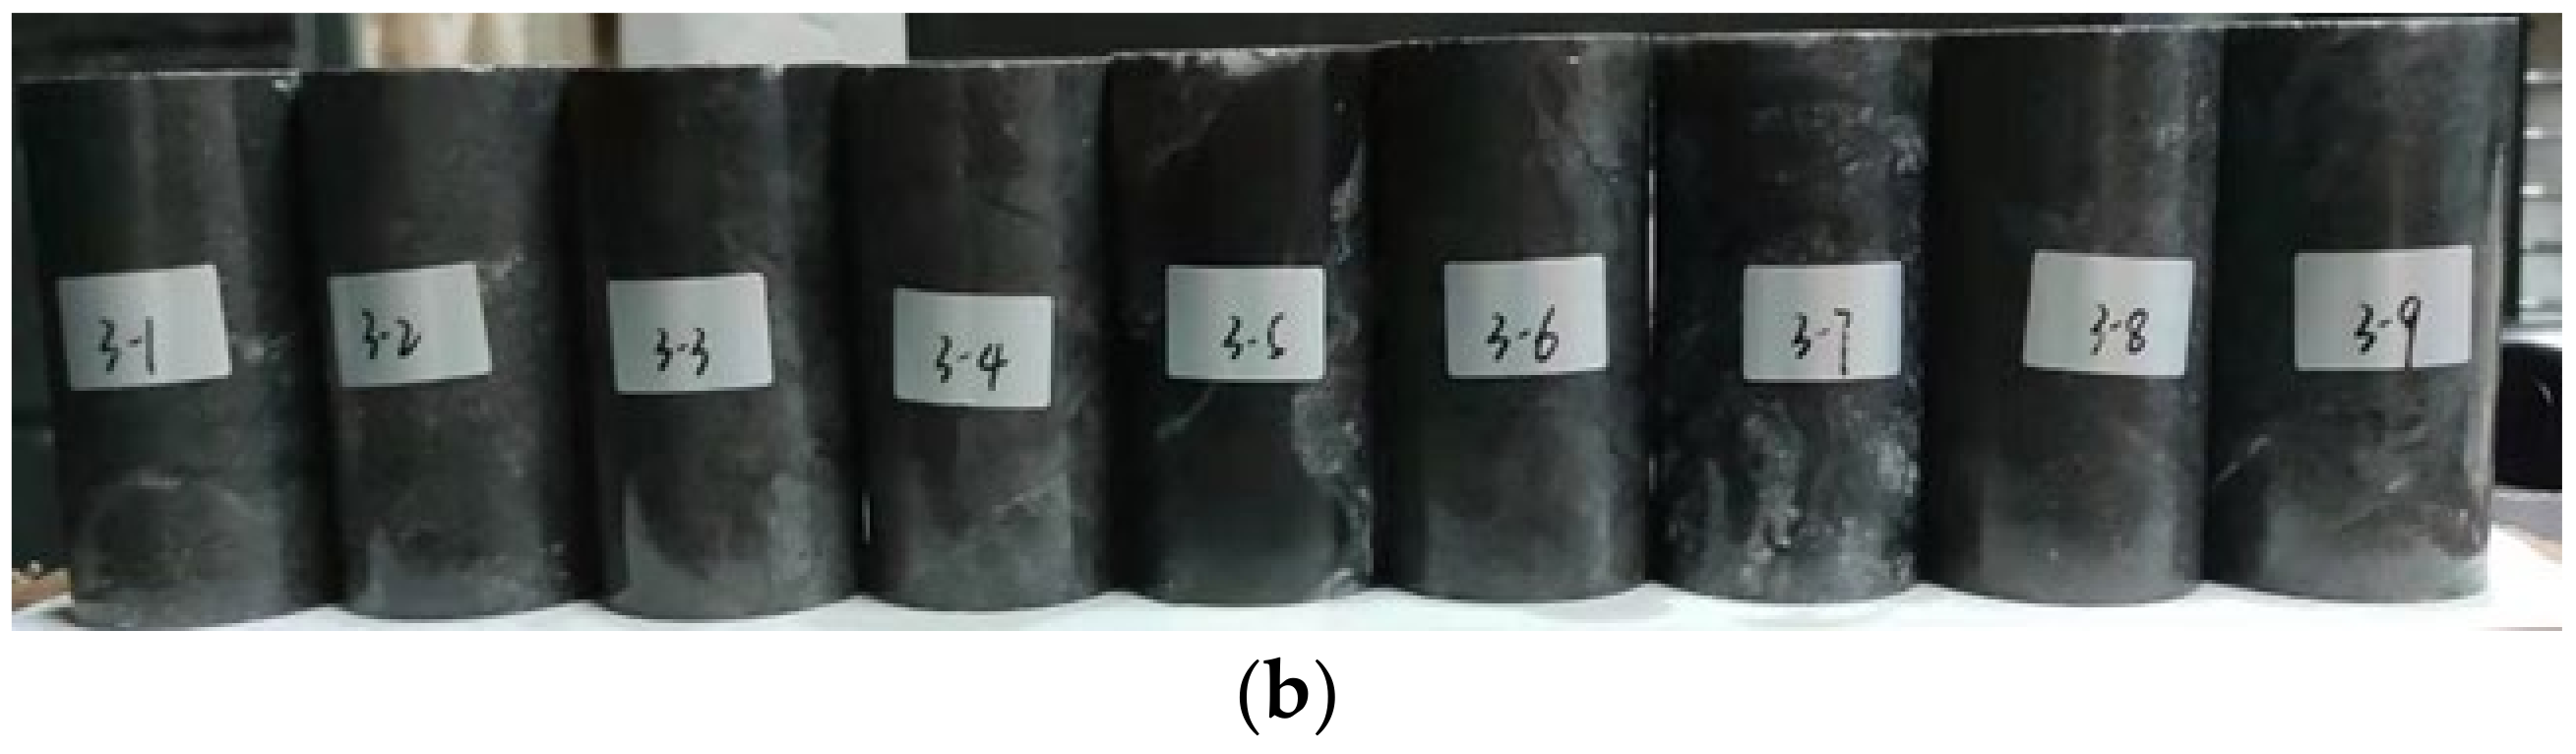
The samples required for the test were prepared by drilling, coring, cutting, and face grinding the rock. To minimize the influence of individual differences between the samples on the test results, the samples were processed into cylindrical samples with a diameter of 50 mm and a height–diameter ratio of 2 ± 0.2. As shown in Figure 1, a total of 27 gypsum rock samples were prepared, which were divided into three groups of nine; the samples were grouped and marked accordingly.

Figure 1.
Processed gypsum rock samples. (a) The first group, (b) the second group, (c) the third group.
2.2. Rock Composition
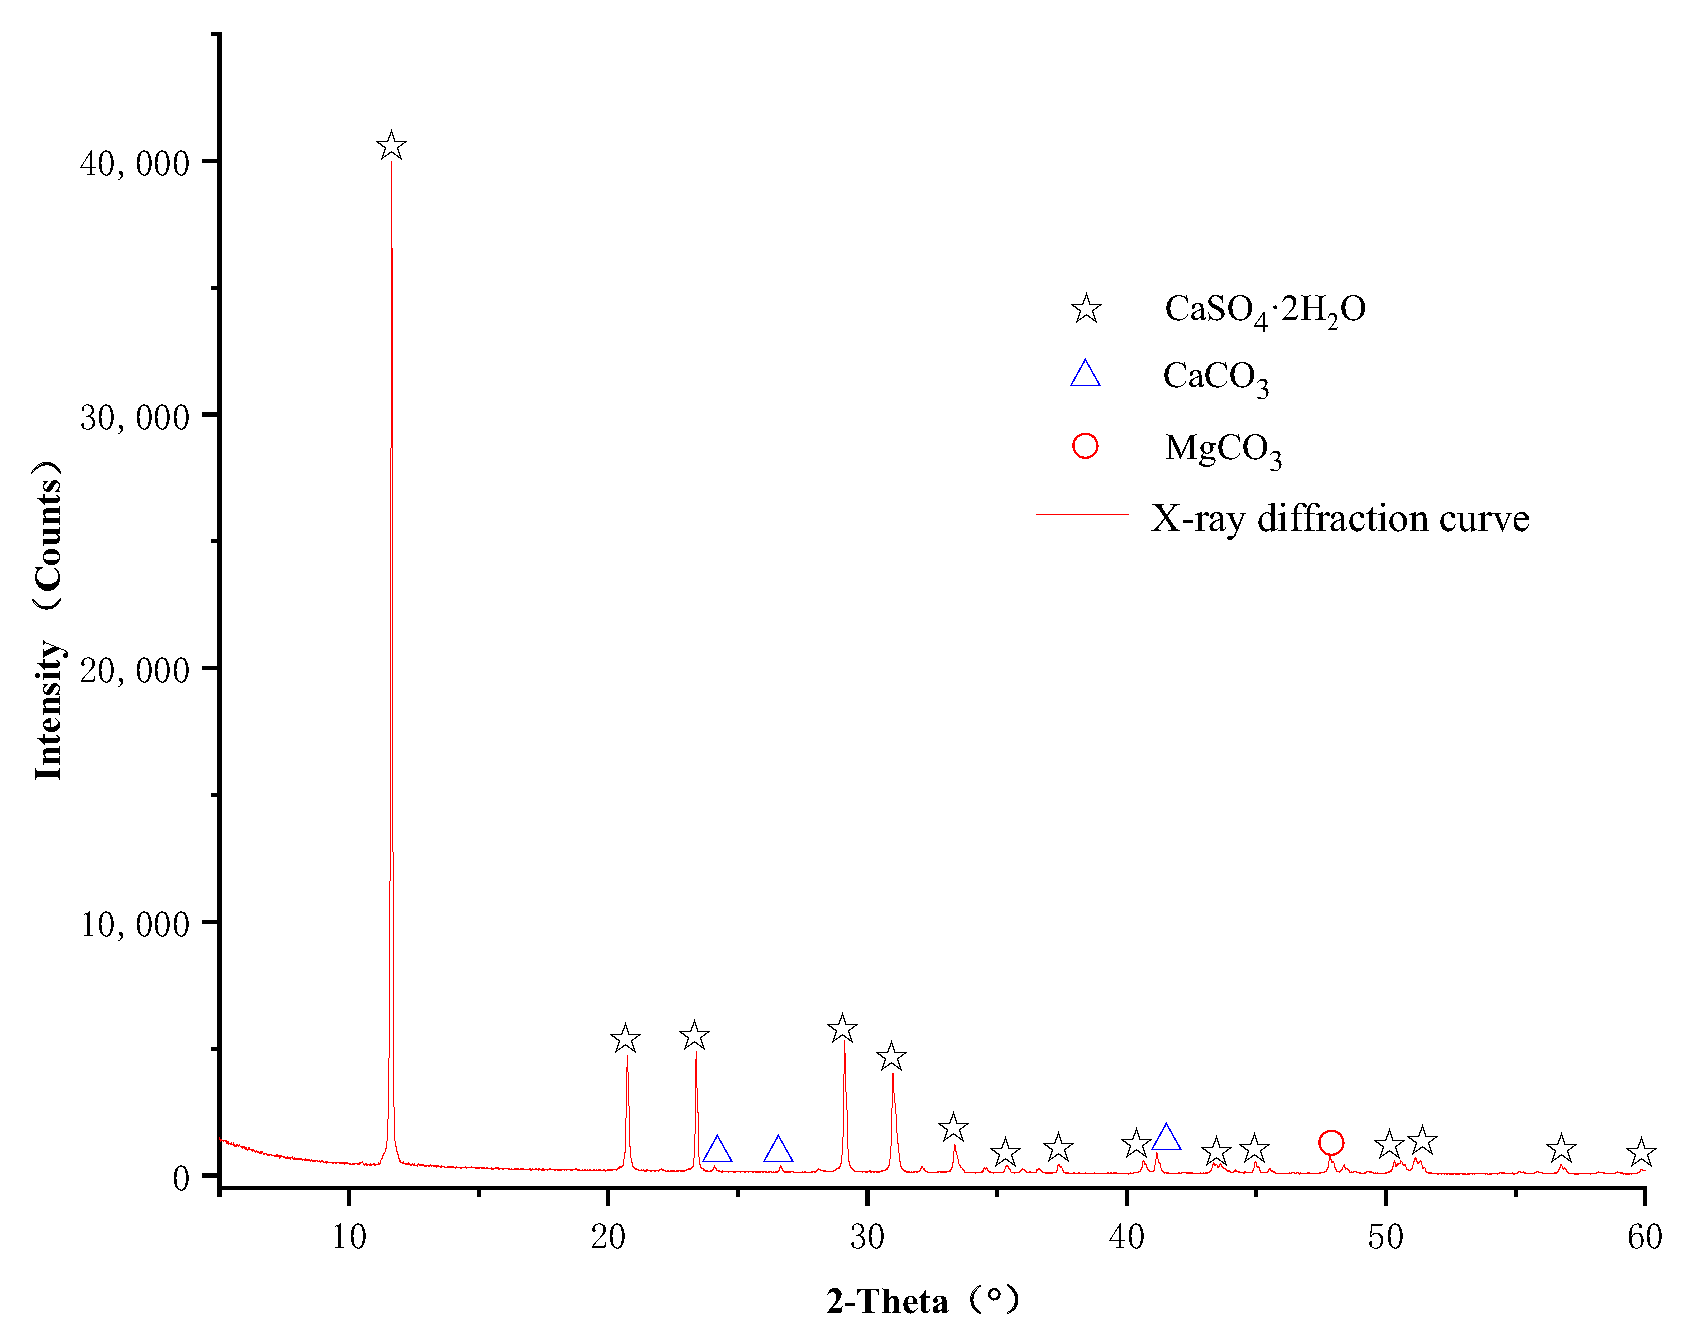
The component and content of gypsum rock were obtained by X-ray diffraction (XRD), as shown in Figure 2. It can be seen from Figure 2 that there are five apparent peaks in the diffraction curve, and the intensity of the prominent peak reaches 39,961 with a diffraction angle of 11.645°. Finally, the X-ray diffraction results show that the main substance of gypsum rock is calcium sulfate dihydrate (CaSO4·2H2O) and contains a small amount of CaCO3 and MgCO3. The spacing between crystal planes of gypsum rock is 7.6921 nm, the grain size is 702 nm, and the crystallinity is 91.2%.
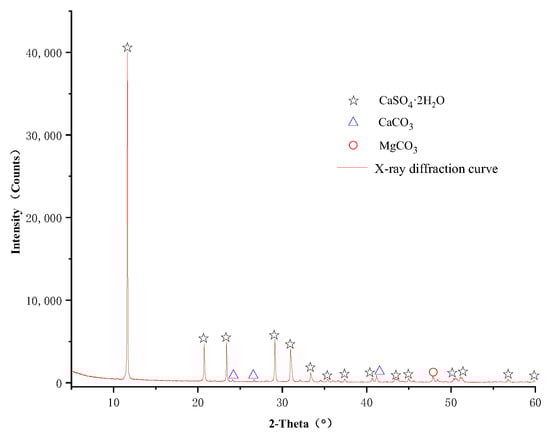
Figure 2.
X-ray diffraction curve.
2.3. Preparation of Oil Immersion Samples
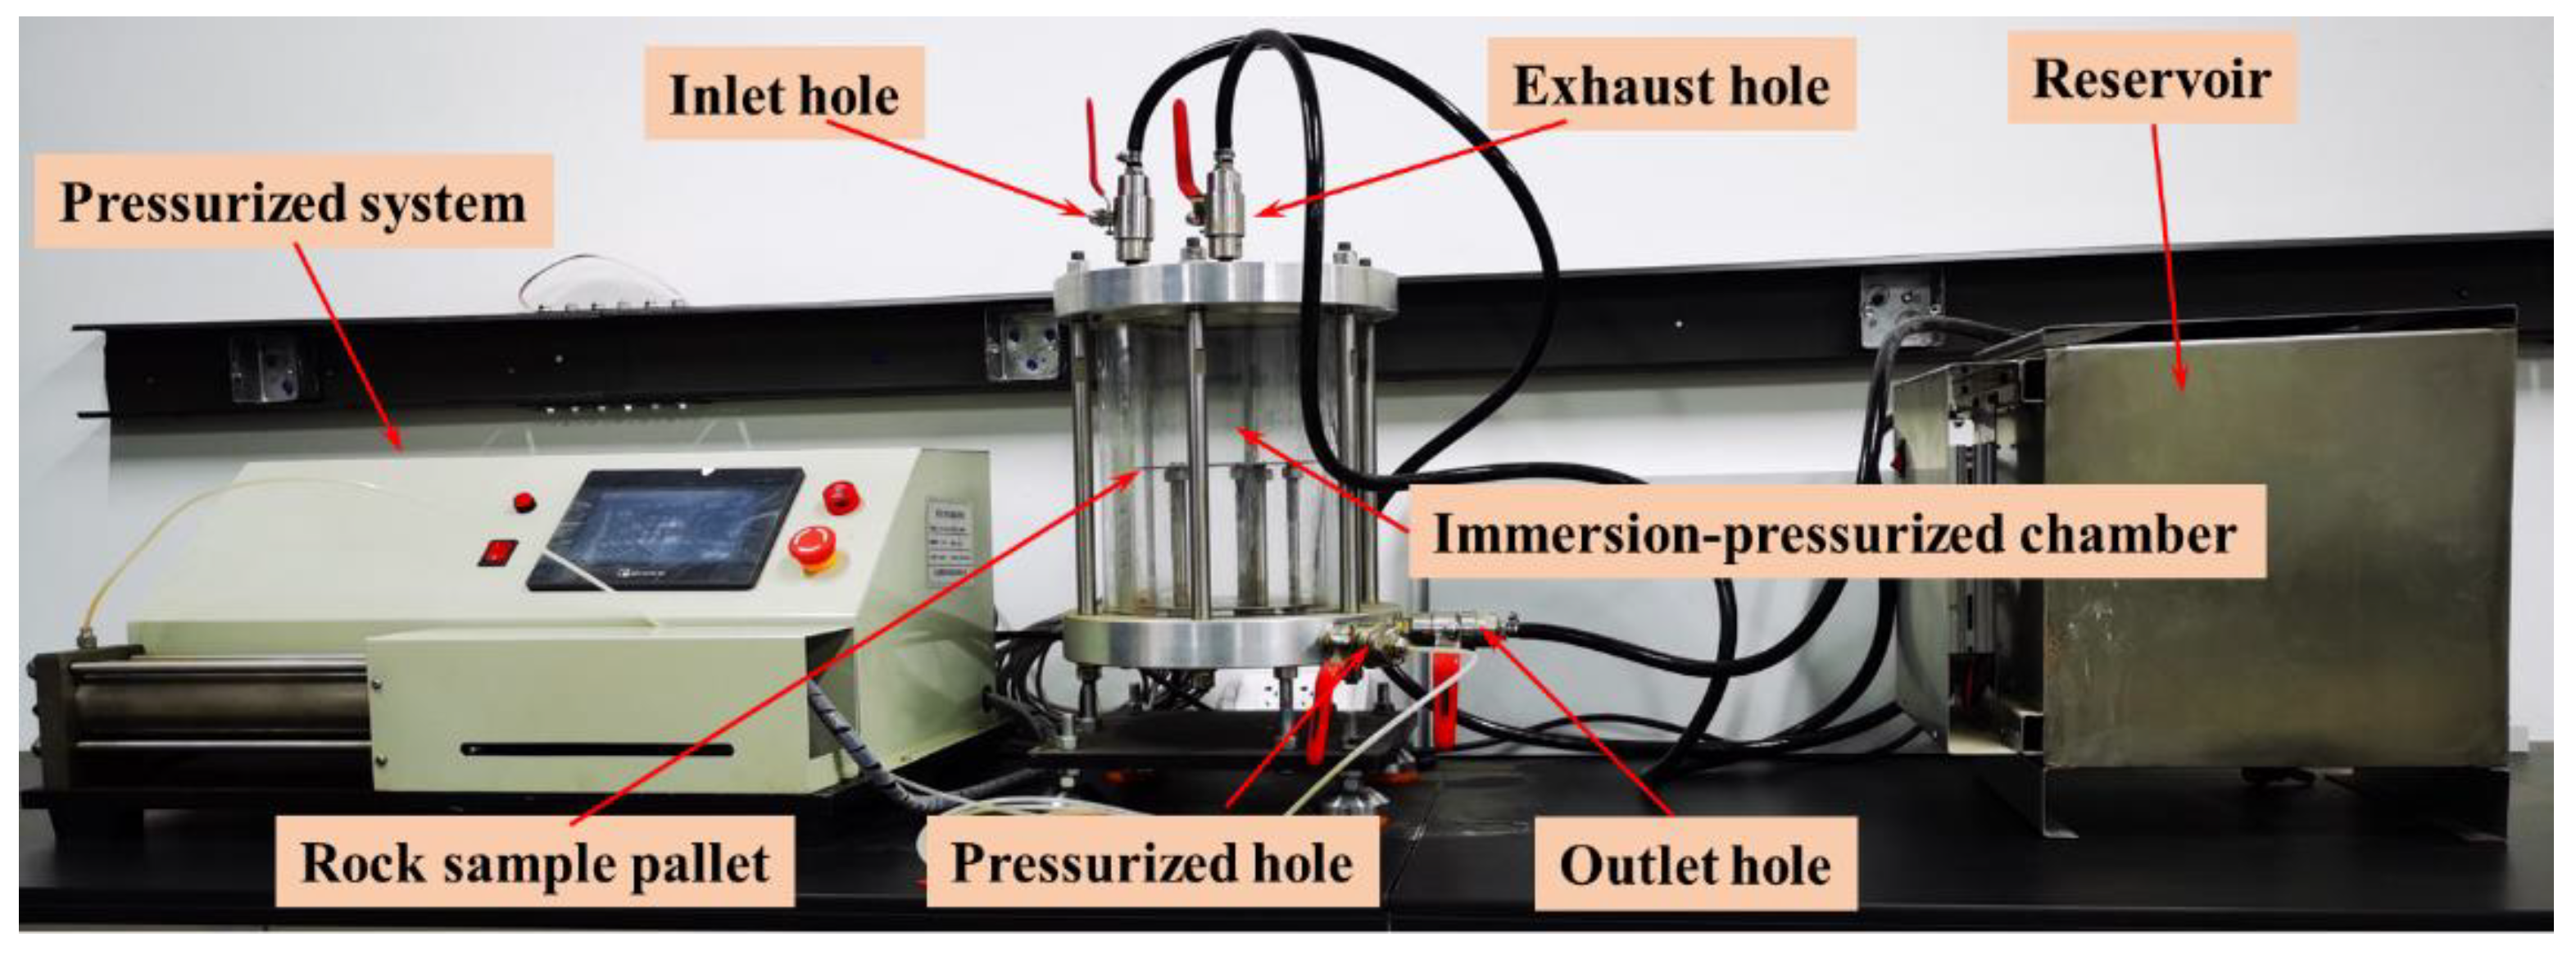
To study the influence of different oil immersion times on the mechanical properties of gypsum rock, a preparation device for oil-immersed gypsum rock samples was customized. Figure 3 shows the rock infiltration loading device system. The confining pressure control precision of the device was 0.01 MPa, and the confining pressure range was 0~2 MPa. A double-layer design was adopted, and six samples could be placed on each layer. They were placed on the base through the support plate and five support rods. Several holes were created on the support plate to facilitate full contact between the sample and the medium. As a result of the difficulty of obtaining crude oil and considering safety, diesel oil was used as the injection medium in the oil immersion process.

Figure 3.
Rock infiltration loading device system.
Before the test, one group of samples was not treated with oil immersion, which was used as the control group, and the other two groups of samples were treated with oil immersion for 15 days and 30 days, respectively. In the process of oil immersion, the gypsum rock sample was placed in the device, and diesel oil was injected. The pressure was set to 1.5 MPa, and the sample was removed at the set soaking time. The samples of each group after oil immersion treatment are shown in Figure 4.
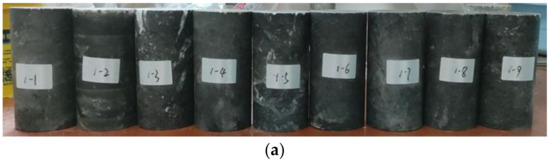

Figure 4.
Gypsum rock samples of each group after oil immersion. (a) Soaking 15 days, (b) soaking 30 days.
2.4. Effects of Oil Immersion on Physical Properties of Gypsum Rock
The basic parameters of the three groups of samples, with oil immersion times of 0, 15, and 30 days, were assessed, including mass and density. Moreover, the influence of oil immersion on the physical properties of the gypsum rock was analyzed. The sample grouping and the averages of the test results are shown in Table 1.

Table 1.
Physical property test results for the gypsum rock samples.
It can be seen from the test results that the densities of all samples before oil immersion were in the range of 2.78~2.95 g/cm, and the average density was 2.87 g/cm. The densities of the samples immersed in oil for 15 days and 30 days were in the range of 2.80~2.90 g/cm, and the average density was 2.88 g/cm. In general, the structure of gypsum rock is compact, and the permeability of oil in gypsum rock is poor. Thus, the density of the samples after oil immersion changed little compared with that before oil immersion, regardless of whether they were immersed in oil for 15 or 30 days.
Similarly, the sonic wave velocity was measured for the samples immersed for 0, 15, and 30 days. The averages of the test results of each group are shown in Table 2. It can be seen from the results that the effects of oil immersion for 15 and 30 days on the longitudinal wave and shear wave velocities of the sample were small, and the influence values are within a reasonable range.
Table 2.
Comparison of wave speed before and after oil immersion of gypsum rock samples.
3. Experimental Process and Result Analysis
3.1. Process of Testing
For the test, we used the MTS 815.04 rock triaxial test system. The maximum load that the device can apply in the axial direction is 2700 kN, and the maximum confining pressure that can be applied is 140 MPa. During the experiment, an axial deformation measurement extensometer with a maximum range of 5 mm was used to measure the axial deformation of the sample during the compression process, and a hoop deformation measurement extensometer with a maximum range of 8 mm was used to measure the hoop deformation of the sample during the compression process.
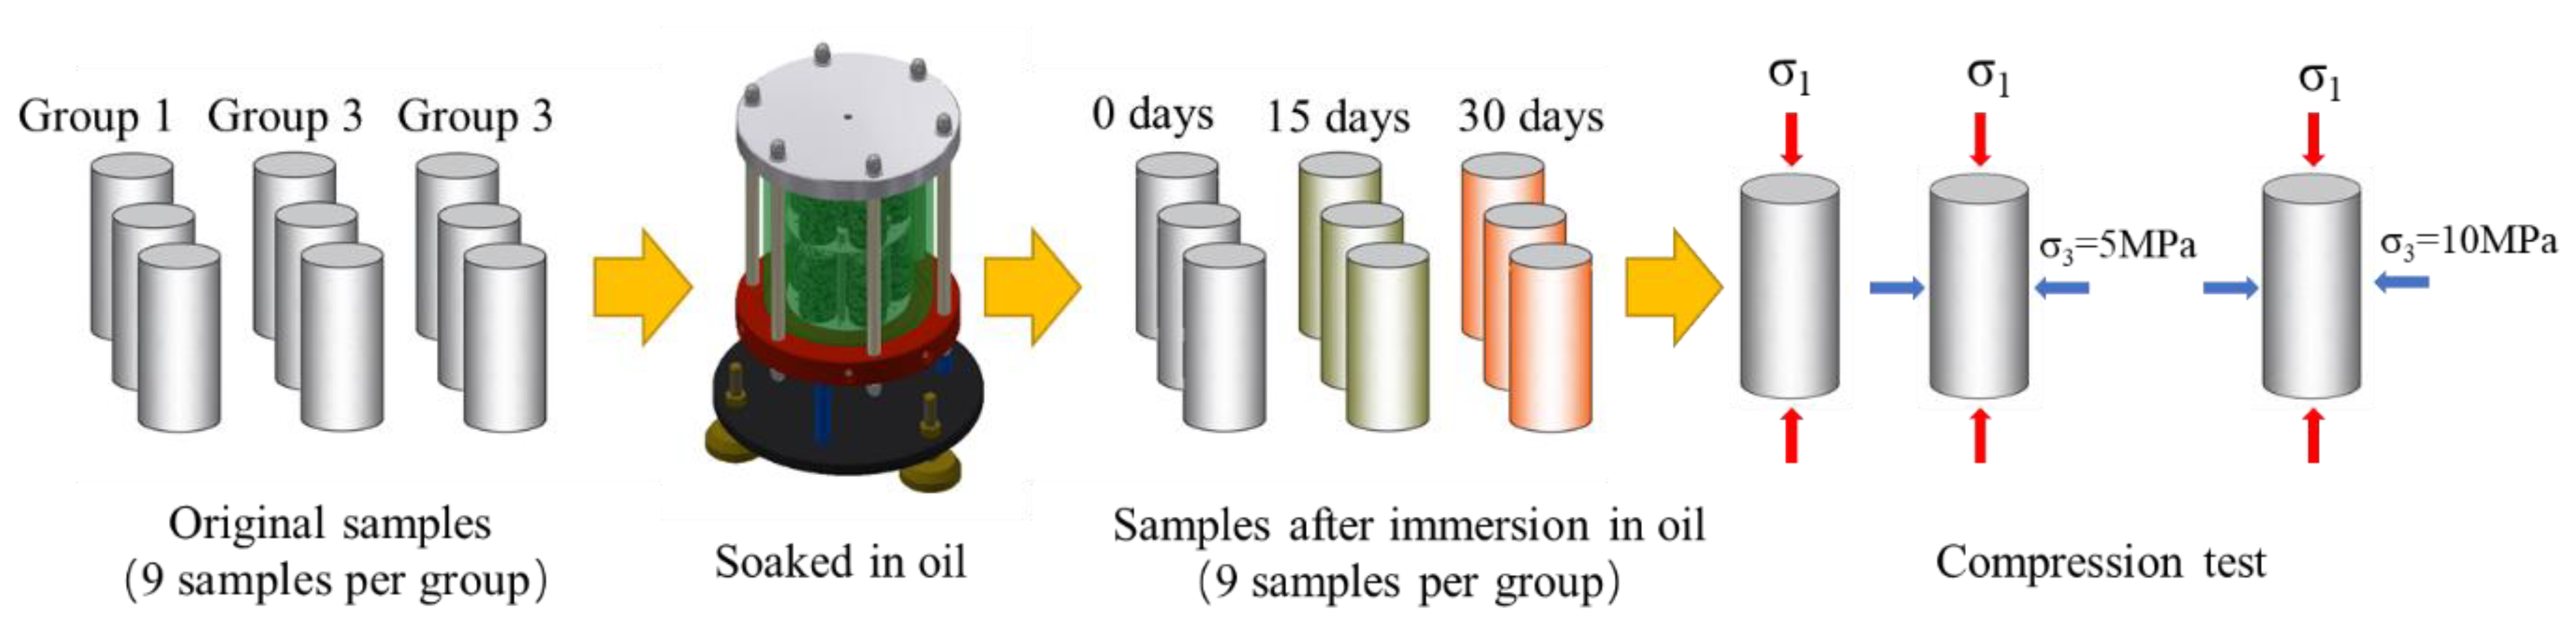
To explore the influence of different oil immersion times on the mechanical properties of gypsum ore rock, three groups of samples with different oil immersion times were used to carry out uniaxial compression and triaxial compression tests. The nine gypsum rock samples with an oil immersion time of 0 days were randomly divided into three groups, with three rock samples in each group. Shaft compression was tested, and test data were recorded. The gypsum rock samples with oil immersion times of 15 and 30 days were analyzed according to the above process so as to explore the changes in the mechanical parameters of gypsum rock samples under different oil immersion times. The experimental process is shown in Figure 5.
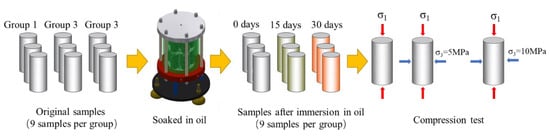
Figure 5.
Schematic diagram of the test process.
3.2. Analysis of Results
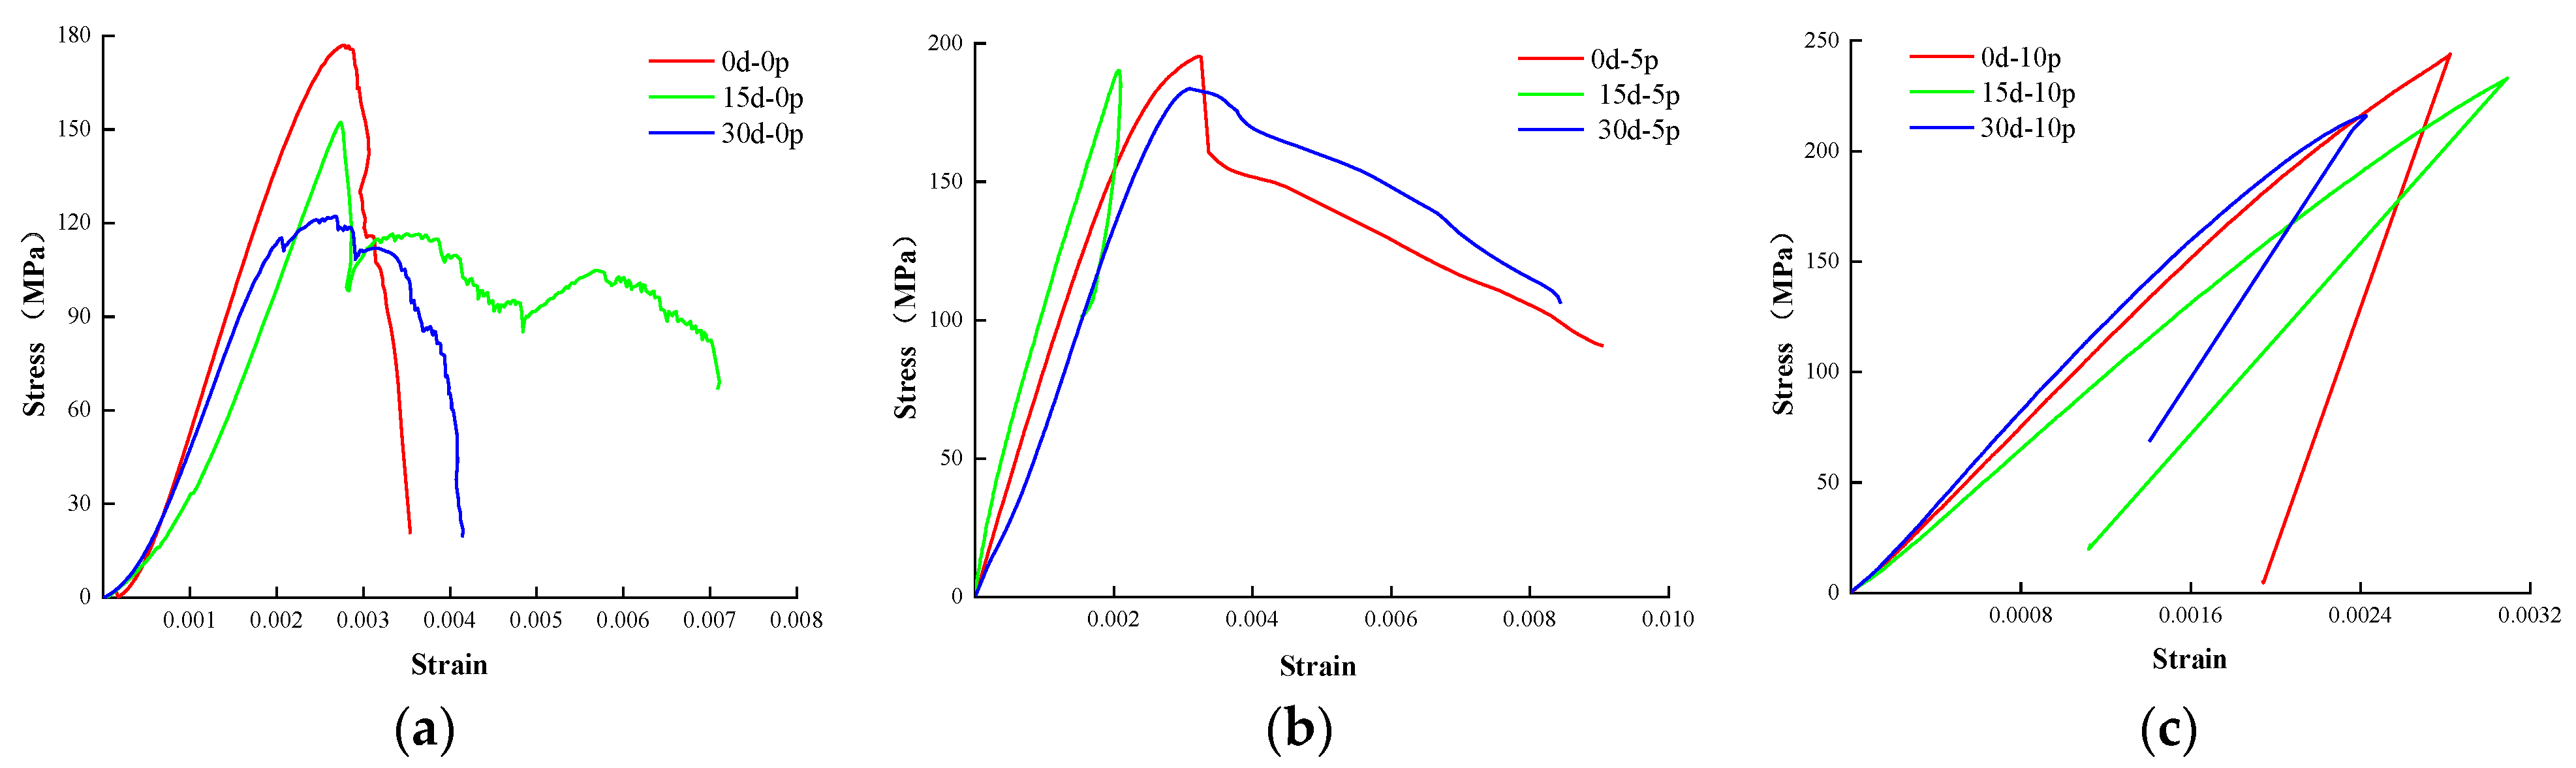
By setting three confining pressure (represented by the symbol σ3) levels of 0, 5, and 10 MPa to carry out the compression tests on the gypsum rock samples, the compressive strength parameters of gypsum rock samples after oil immersion for 0, 15, and 30 days were obtained, including peak stress, elasticity modulus, and Poisson’s ratio. One sample was selected from each group as an example, and the stress–strain curve obtained during the test process is shown in Figure 6.
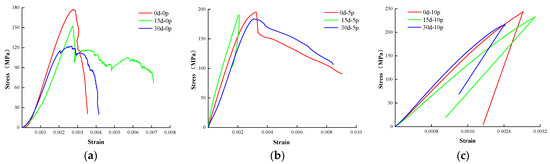
Figure 6.
Stress–strain curve of gypsum specimen with the same confining pressure. (a) σ3 = 0 MPa, (b) σ3 = 5 MPa, (c) σ3 = 10 MPa.
To explore the effect of different oil immersion times on the peak stress, elastic modulus, and Poisson’s ratio of gypsum rock samples with the same confining pressure, the results of each group of tests were plotted in a graph.
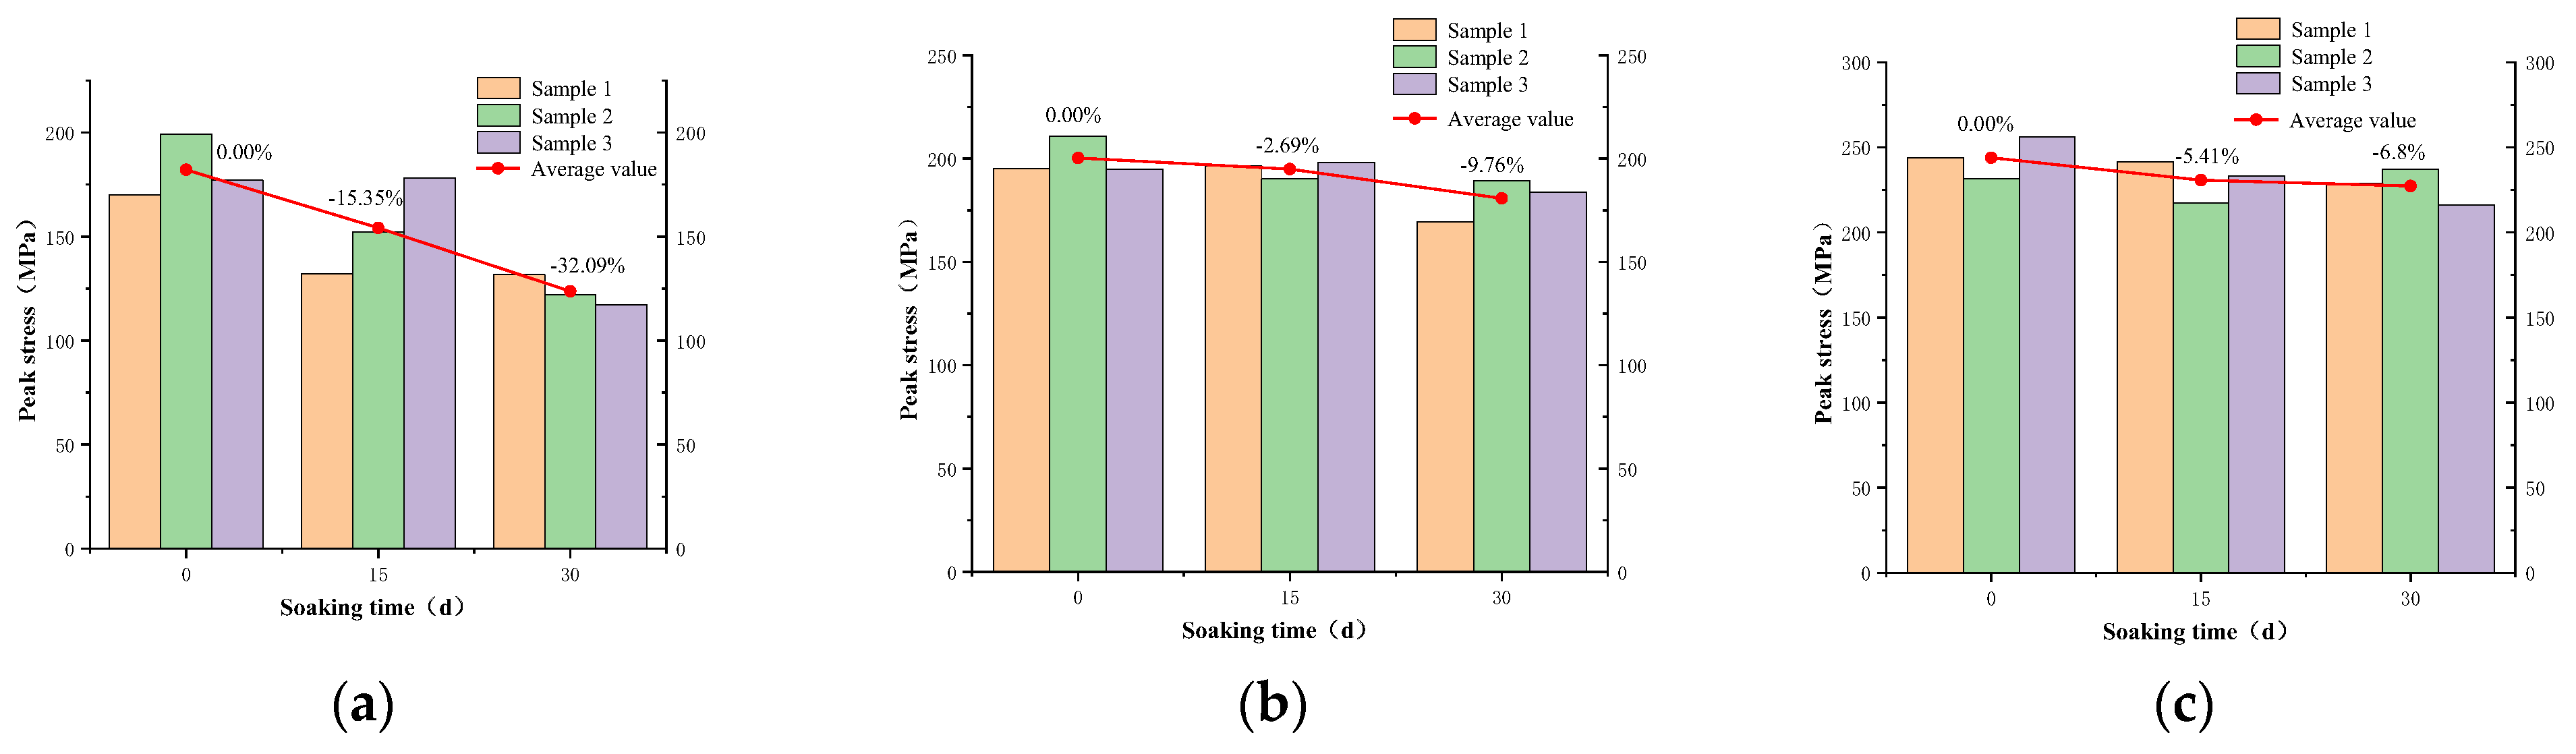
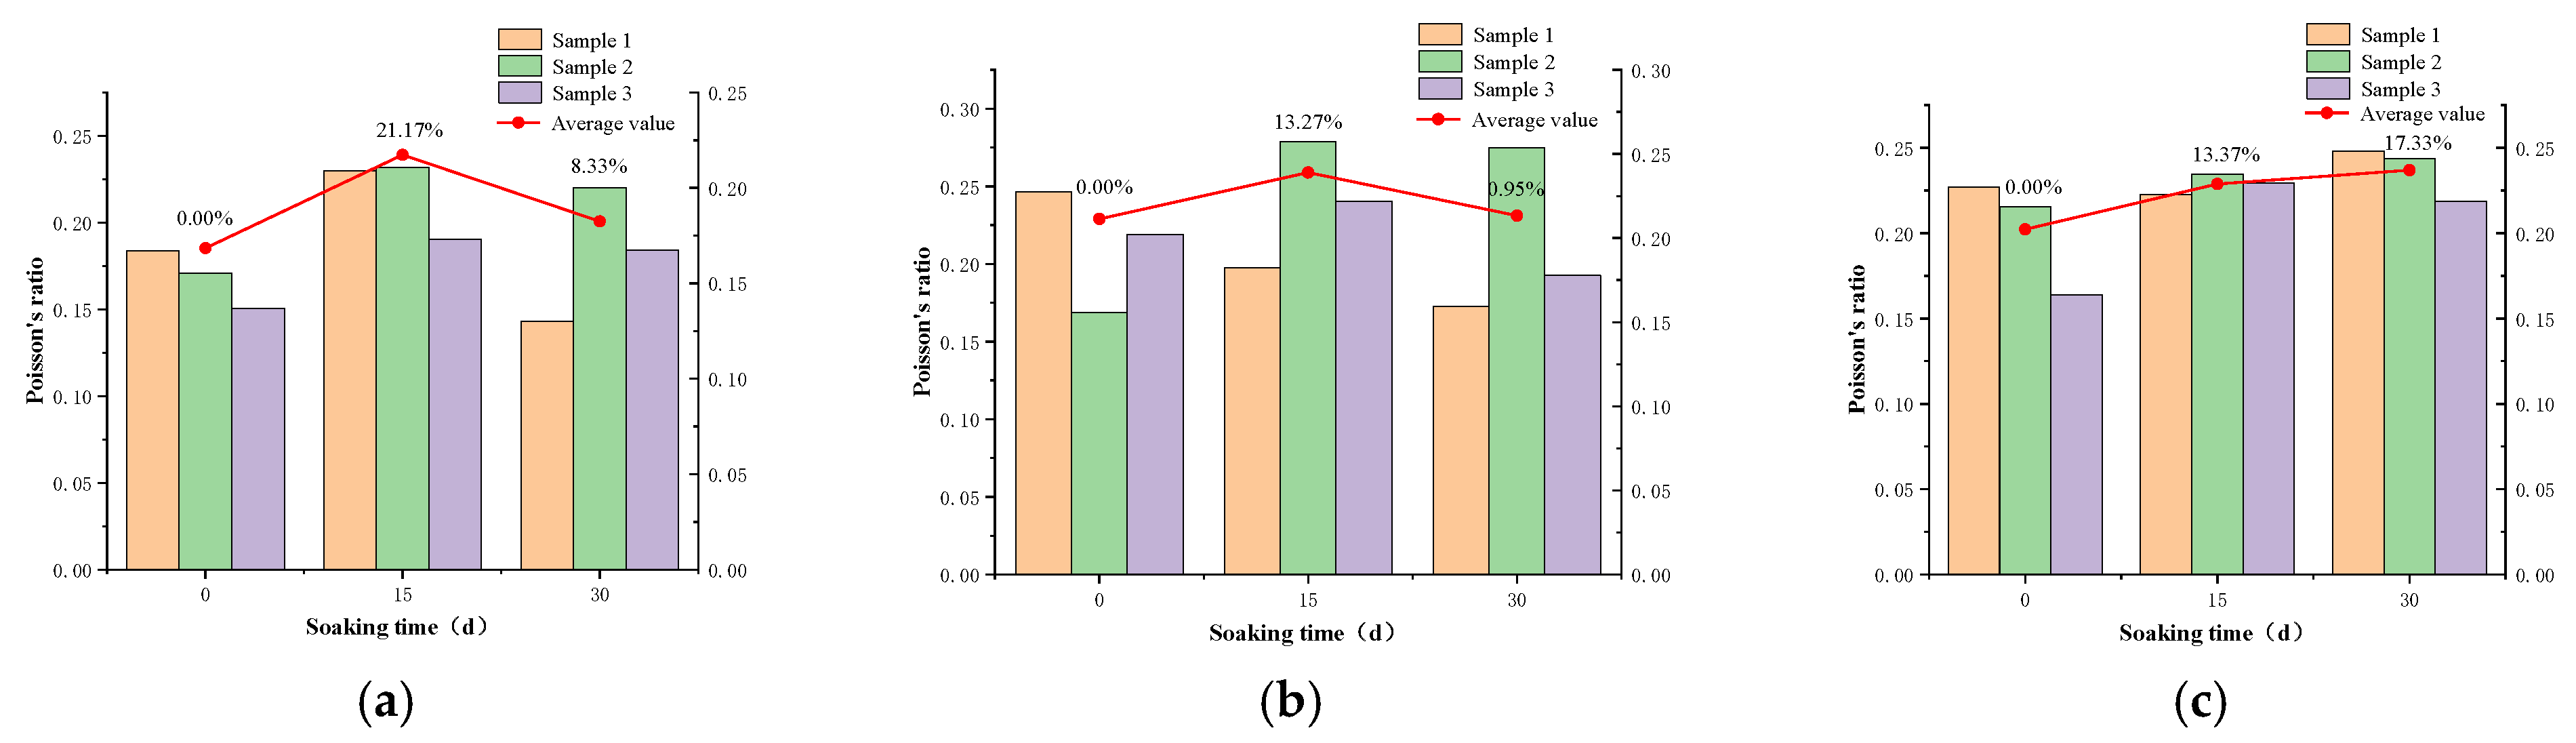
It can be seen from Figure 7, Figure 8 and Figure 9 and Table 3 that, with the increase in oil immersion time, the peak stress of the gypsum rock sample tended to decrease, and when the confining pressure was larger, the peak stress of the gypsum rock with the longer oil immersion time decreased to a lesser extent, i.e., the oil immersion time had a great influence on the pressure. The peak stress for confining gypsum had little effect. The elastic modulus of the gypsum sample decreased with the increase in oil immersion time. The greater the confining pressure, the smaller the decrease in the elastic modulus of the gypsum with the longer oil immersion time, indicating that the oil immersion time had less influence on the elastic modulus of the high confining pressure gypsum sample, i.e., the law is similar to that of the peak strength. Obviously, oil immersion can soften gypsum to a certain extent, but under high confining pressure, because the gypsum crystals are more compact, the oil molecules inside or on the surface of the gypsum are squeezed out, which weakens the softening effect. The Poisson’s ratio of the gypsum rock samples increased to different degrees according to immersion in oil, but the relationship between the change law and the time of oil immersion is not obvious.
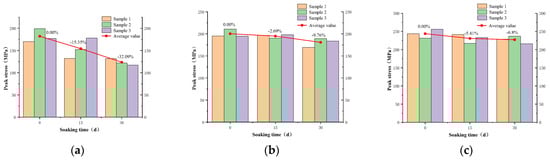
Figure 7.
Effect of different oil immersion times on the peak stress of gypsum with the same confining pressure. (a) σ3 = 0 MPa, (b) σ3 = 5 MPa, (c) σ3 = 10 MPa.
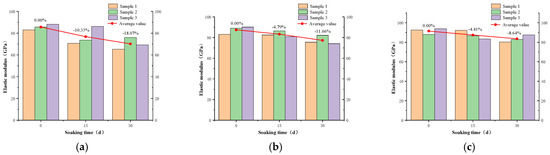
Figure 8.
Effect of different oil immersion times on the elastic modulus of gypsum with the same confining pressure. (a) σ3 = 0 MPa, (b) σ3 = 5 MPa, (c) σ3 = 10 MPa.
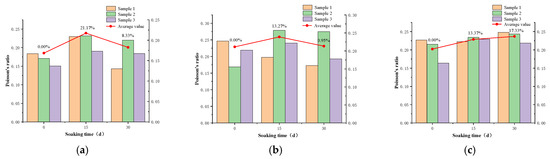
Figure 9.
Effect of different oil immersion times on the Poisson’s ratio of gypsum rock with the same confining pressure. (a) σ3 = 0 MPa, (b) σ3 = 5 MPa, (c) σ3 = 10 MPa.
Table 3.
Mechanical parameters of gypsum rock with different confining pressures.
3.3. Law of Mechanical Damage and Deterioration of Oil-Impregnated Gypsum Rock
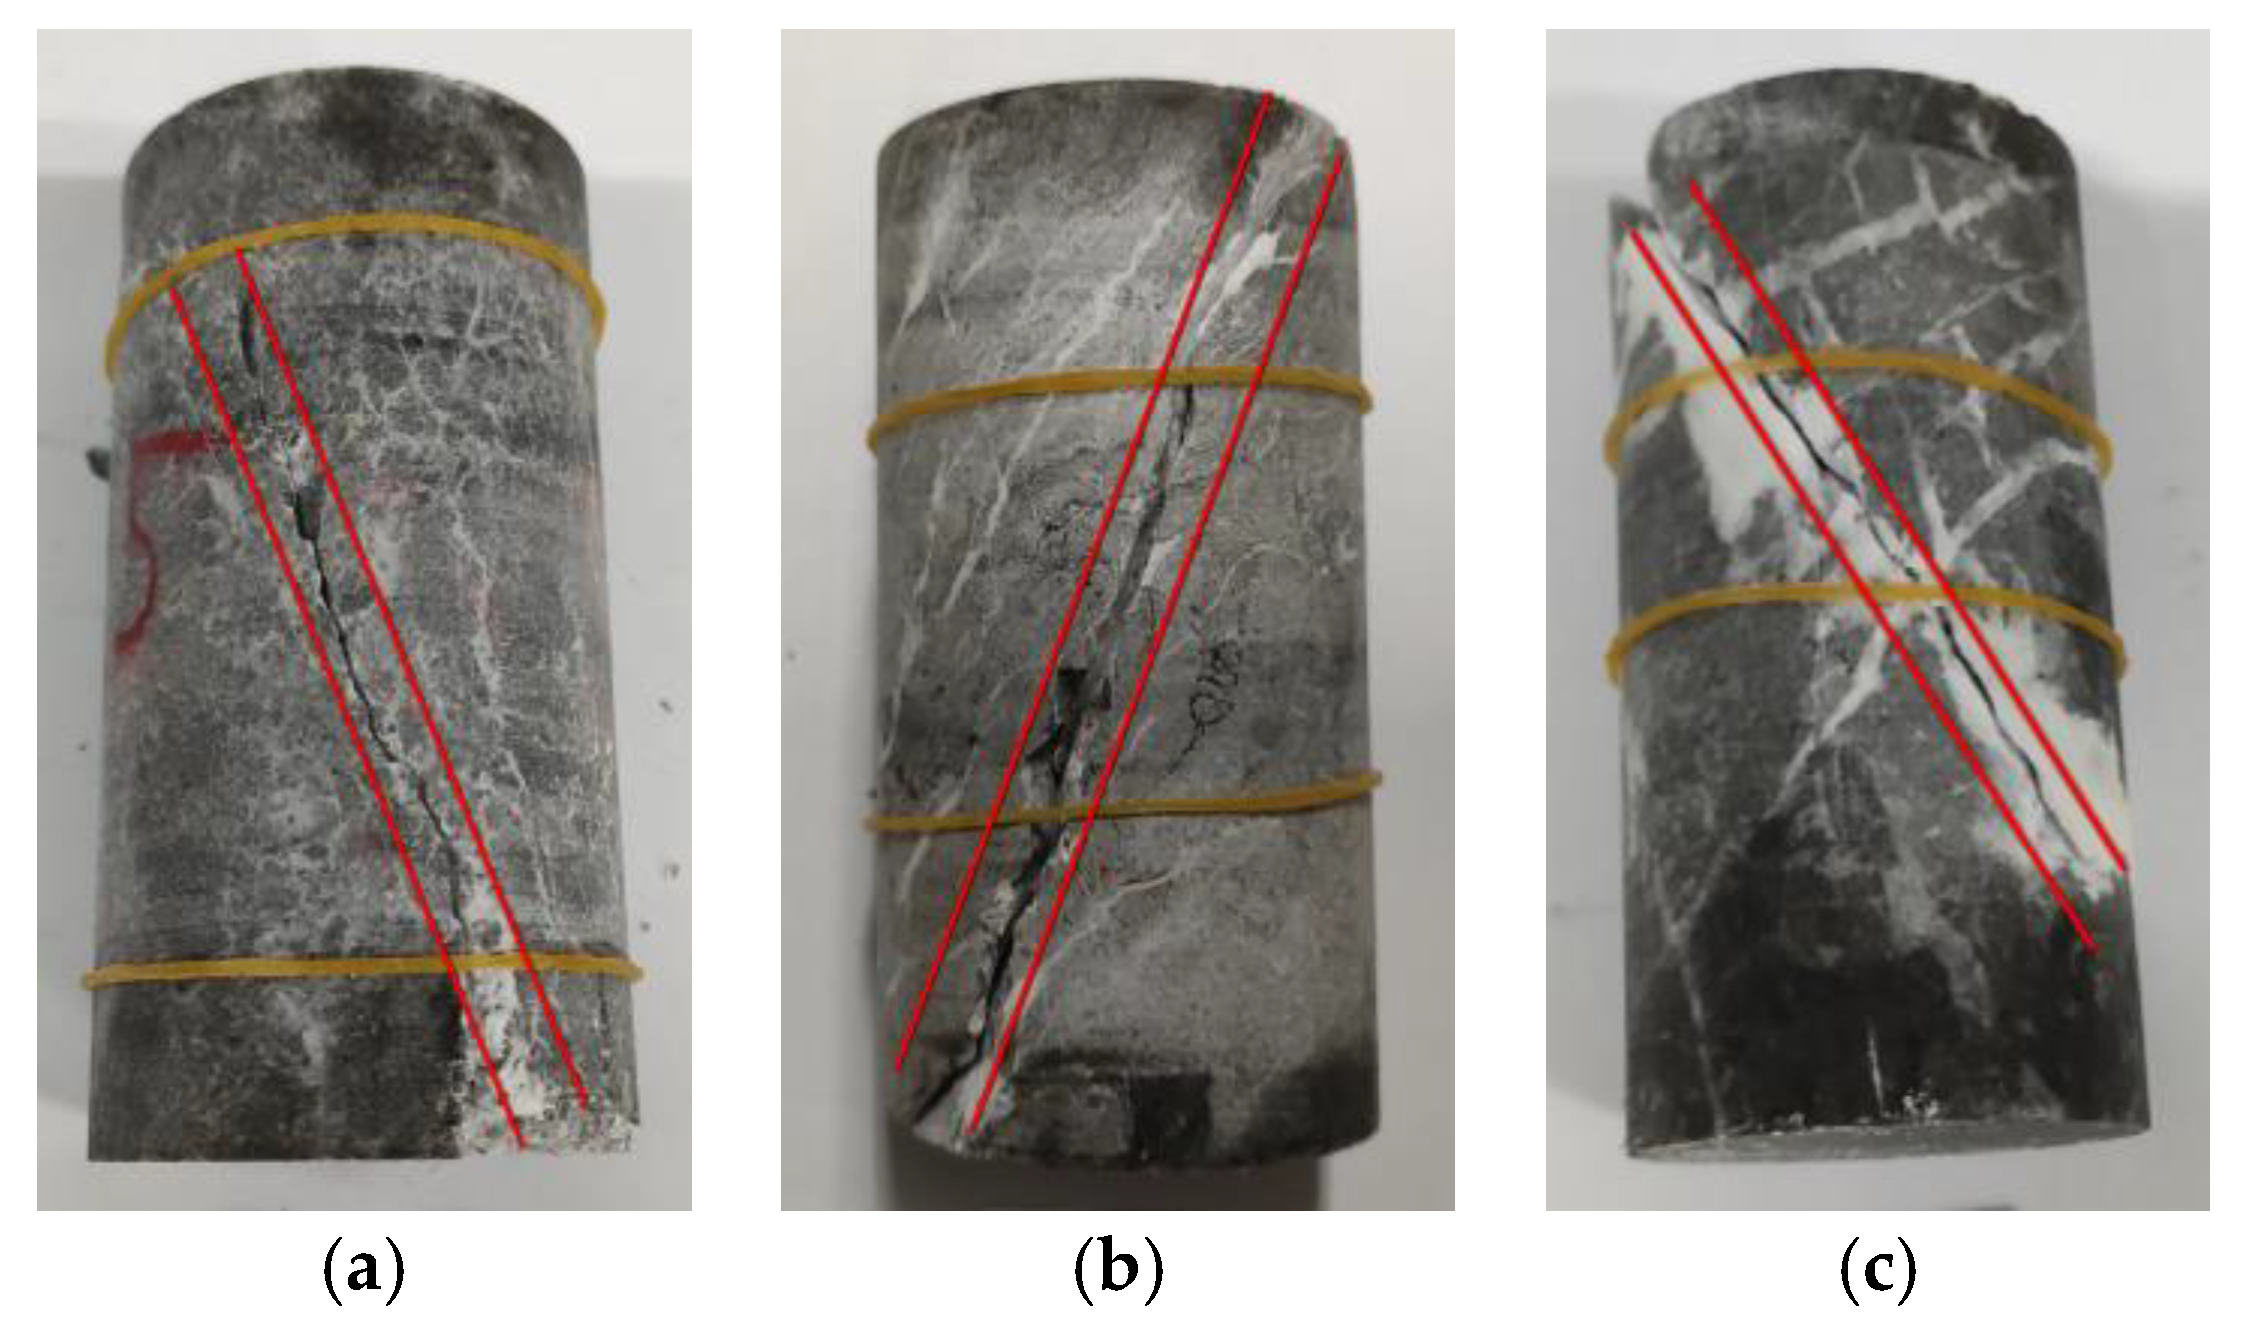
Figure 10 shows the partial failure of the samples with different oil immersion times. From the analysis of the failure modes of the samples, the failure of each type of sample was shear failure, so the M-C strength criterion can be used to characterize the strength law [23]. It can be seen from the previous analysis that, during the loading process of the gypsum rock sample, the peak strength under various confining pressure conditions tended to decrease with the increase in the oil immersion time. Therefore, the internal friction angle and cohesive force of the rock can be calculated using the Mohr–Coulomb strength criterion [24].
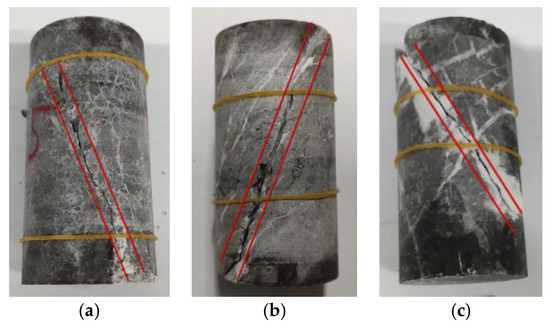
Figure 10.
Partial gypsum specimen failure mode. (a) Soaking 0 days, (b) soaking 15 days, (c) soaking 30 days.
The M-C strength criterion considers that rock mainly fails due to shear failure, and its rock strength criterion is expressed by the following formula:
In the formula, is the shear stress on the shear failure surface, is the normal stress on the shear failure surface, is the cohesive force of the rock, and is the internal friction angle.
In general, the M-C criterion can be expressed by the Mohr limit stress circle [25], and under the condition of conventional triaxial compression, it can be obtained by theoretical calculus as follows:
In the formula, is the peak stress of the rock, is the uniaxial compressive strength of the rock, and is the confining pressure.
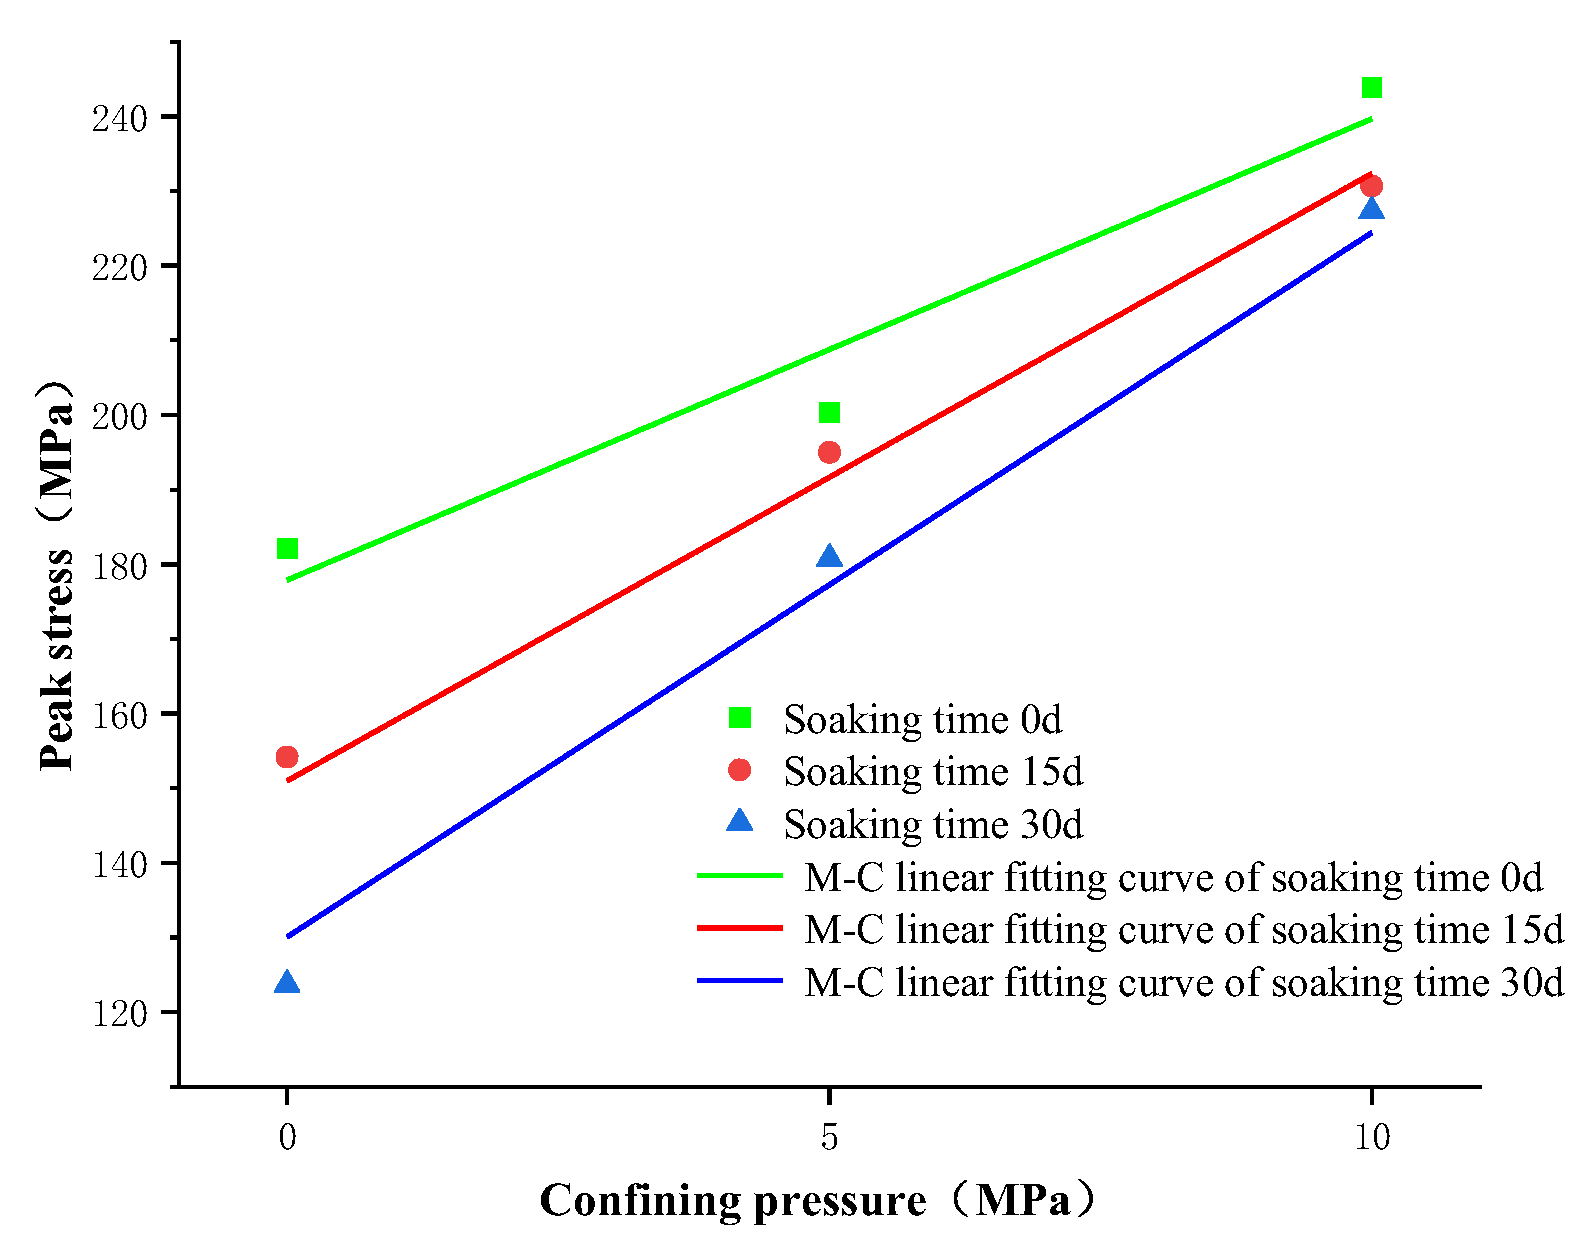
Therefore, linear fitting was performed using the peak stress data of gypsum rock immersed in oil for 0, 15, and 30 days under different confining pressure conditions, and the results are shown in Figure 11.
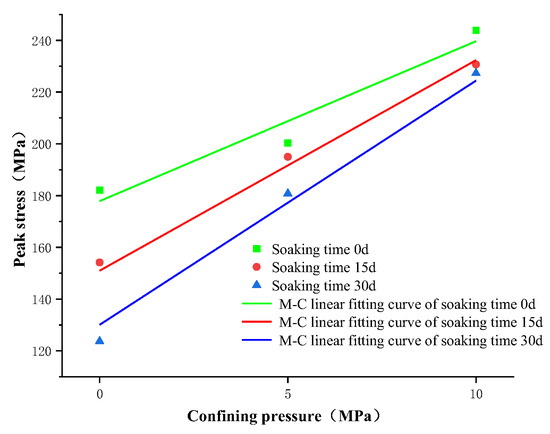
Figure 11.
M-C linear regression curve of gypsum rock samples with different oil immersion times.
The M-C linear regression fitting equations of gypsum rock samples with different oil immersion times are as follows.
Oil immersion 0 days:
Oil immersion 15 days:
Oil immersion 30 days:
The internal friction angle and cohesion of gypsum rock samples with different oil immersion times were calculated using the formulae [26,27]. The M-C strength criterion parameters of gypsum rock samples with different oil immersion times are shown in Table 4. It can be seen that, with increasing oil immersion time, the cohesive force of the gypsum rock sample exhibited a decreasing trend, while the internal friction angle exhibited an increasing trend with the increase in oil immersion time. The internal friction angle increased by 12.17% after oil immersion for 15 days, the rock cohesion decreased by 40.83% after oil immersion for 30 days, and the internal friction angle increased by 16.81% after oil immersion for 30 days.
Table 4.
Gypsum rock M-C strength criterion parameters.
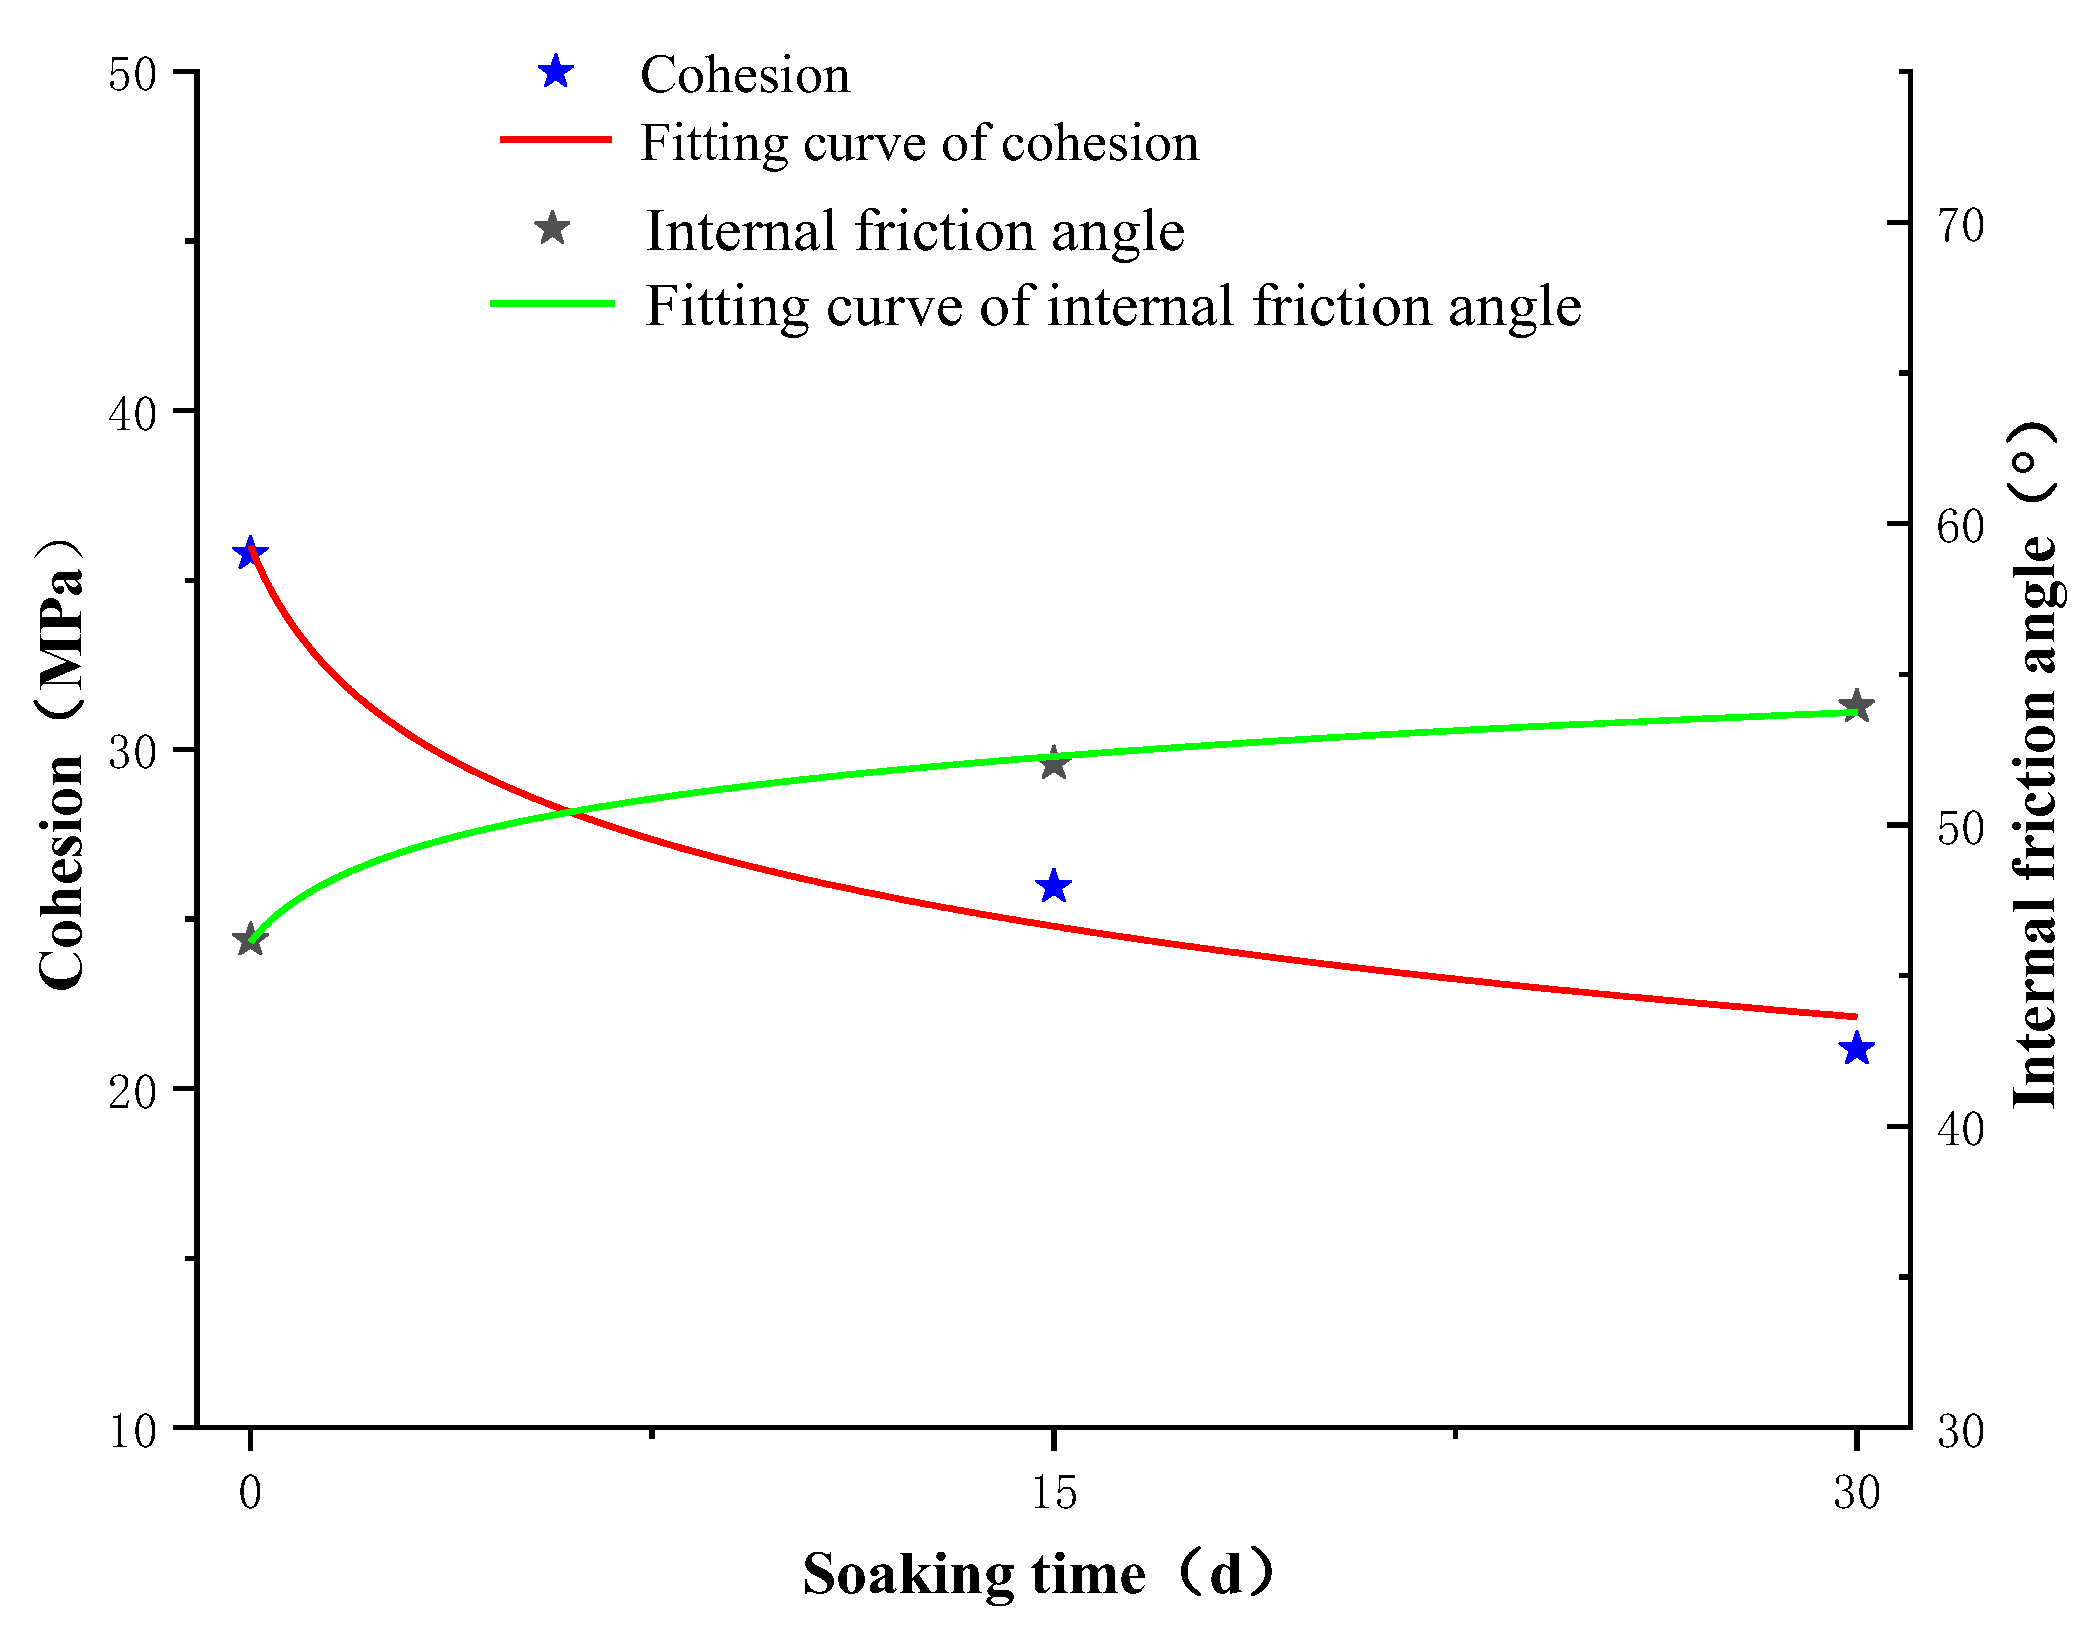
As the various functions of the cohesion c and the angle of internal friction φ of the gypsum rock samples with respect to the oil immersion time were continuous, nonlinear fitting of the changes in the cohesion force and the angle of internal friction with respect to the oil immersion time could be performed. The fitting results are shown in Figure 12.
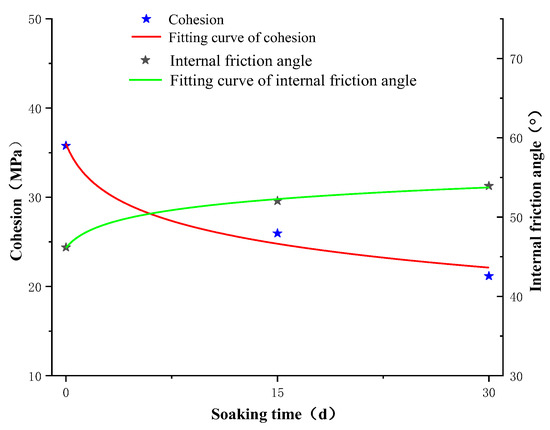
Figure 12.
Variation curves of cohesion and internal friction angle with oil immersion time.
The mathematical relationship obtained by the fitting is as follows:
In the formula, is the functional relationship between the cohesion of the gypsum rock sample and the oil immersion time t, is the functional relationship between the internal friction angle of the gypsum rock sample and the oil immersion time, and R2 is the correlation coefficient of the fitted curve.
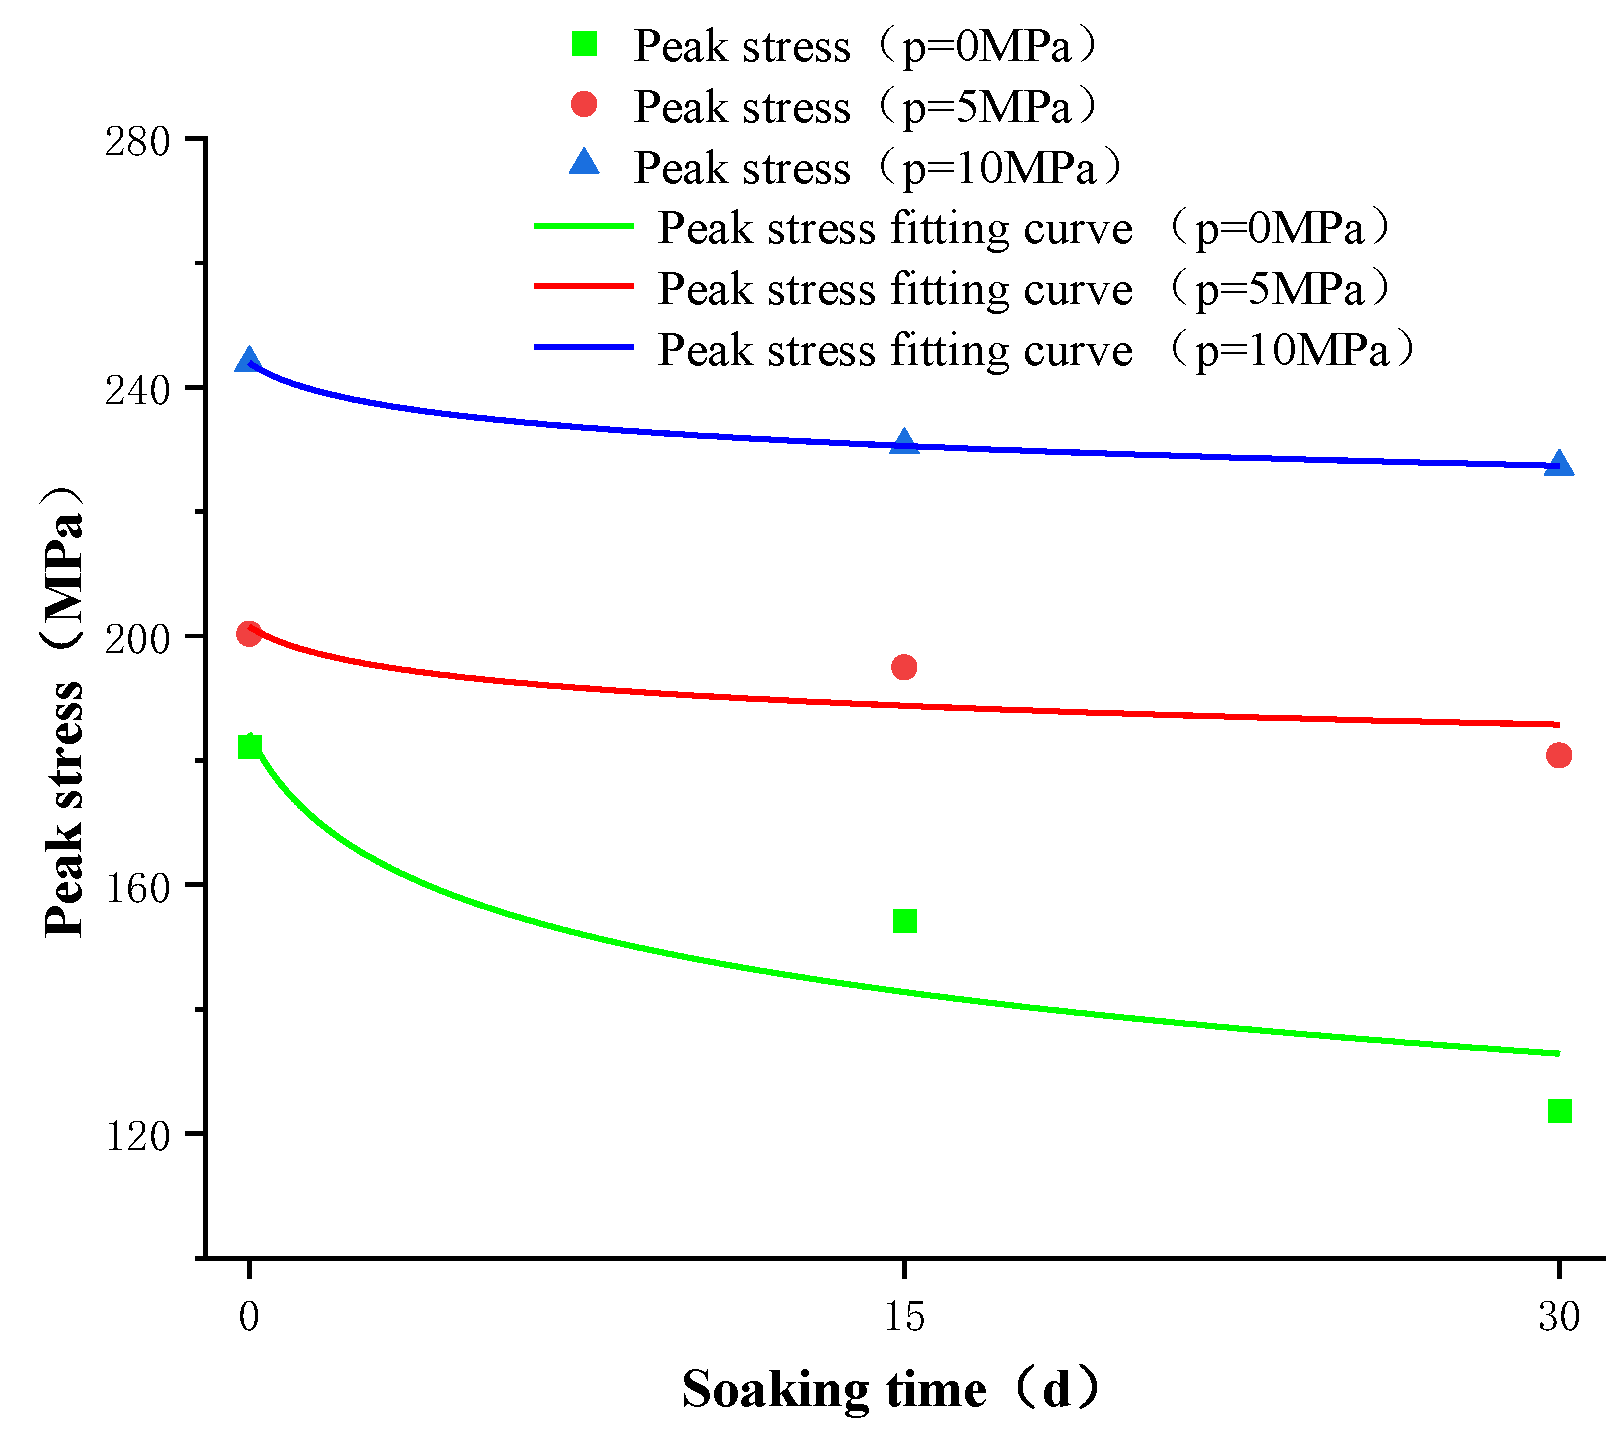
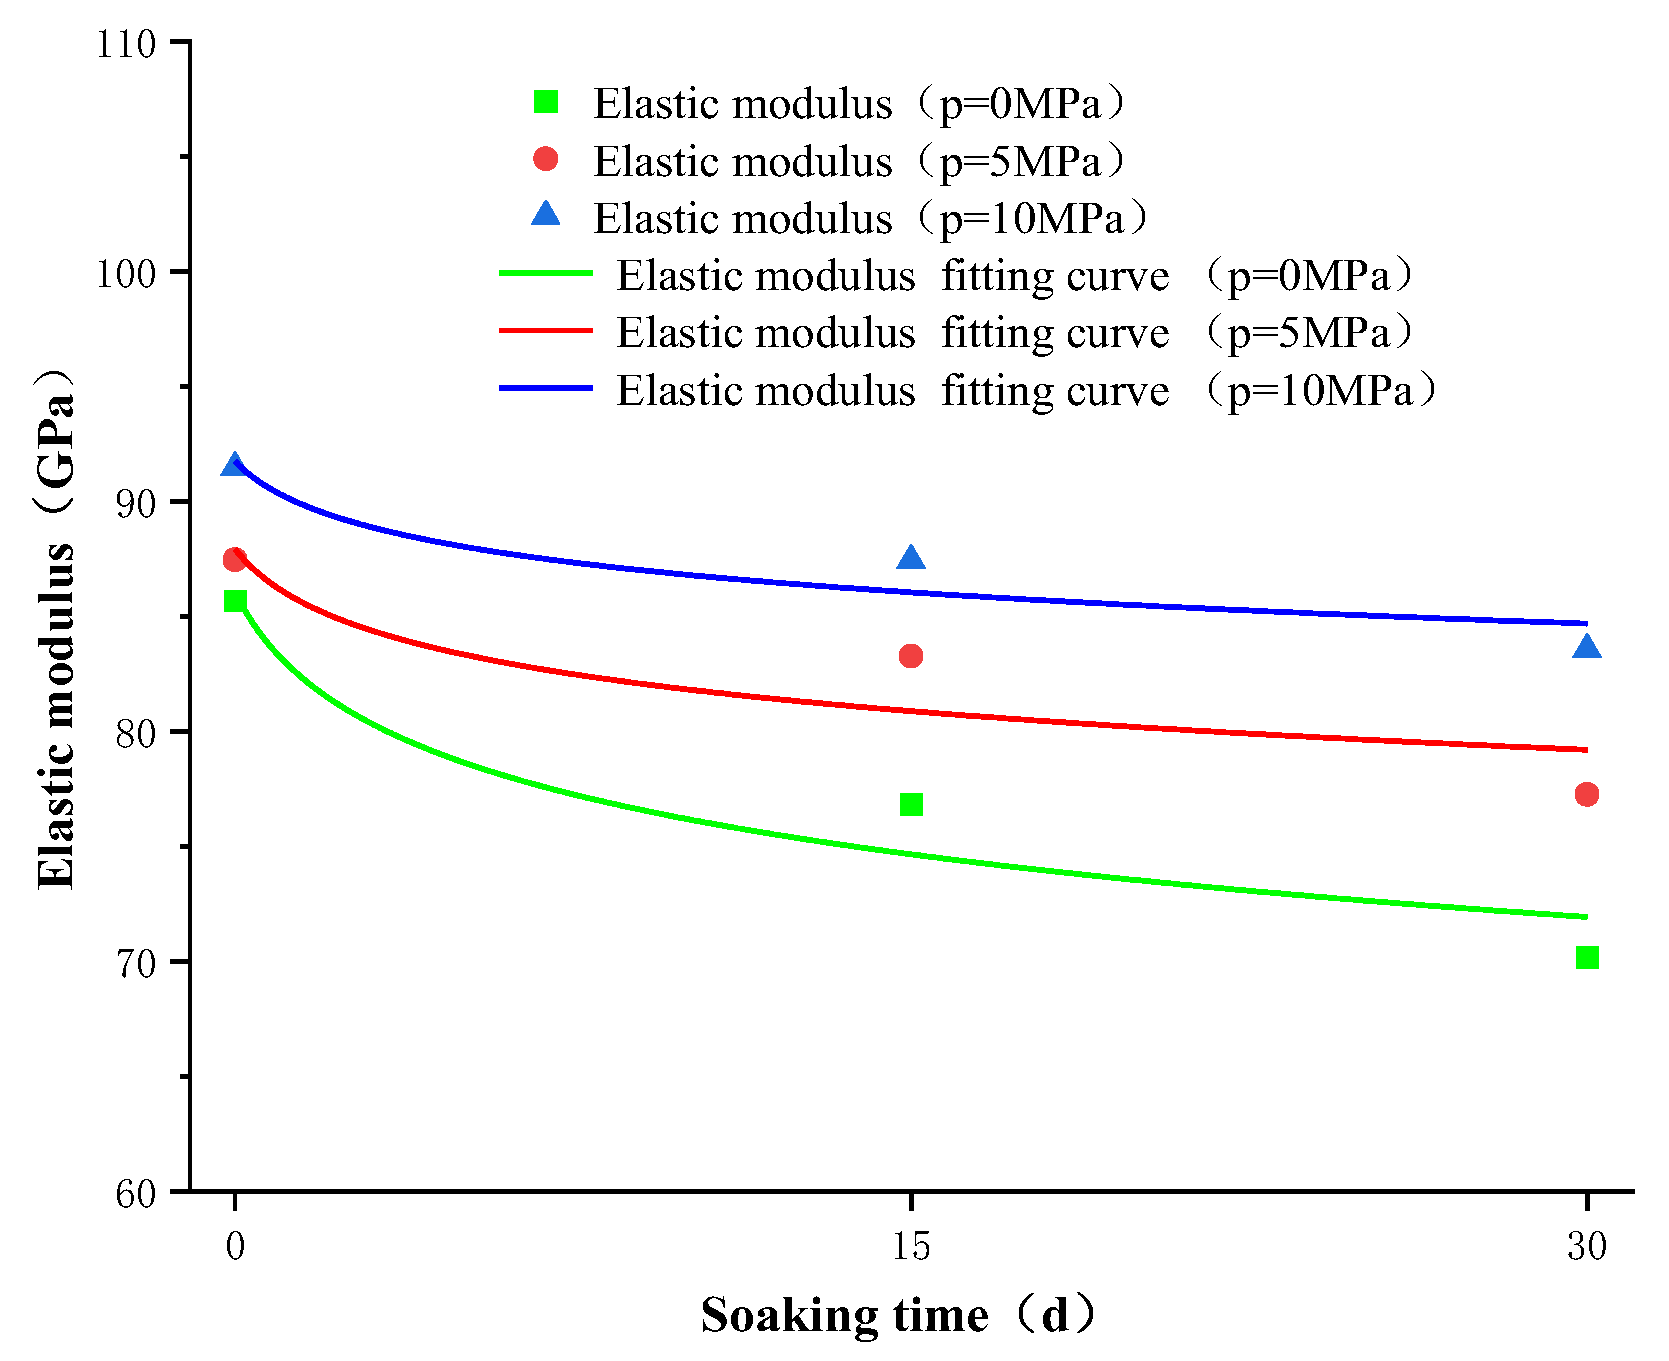
Similarly, it was assumed that the peak stress and elastic modulus of the gypsum rock samples were also continuous with the oil immersion time. The average value of the rock mechanical parameters of each group of samples was fitted with a logarithmic function, and the fitting results are shown in Figure 13 and Figure 14.
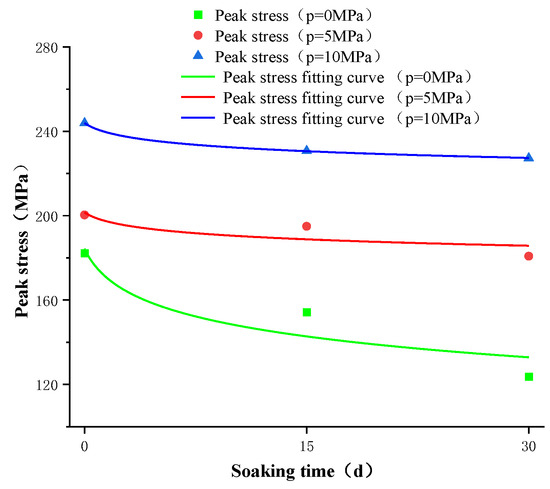
Figure 13.
Fitting curve of peak stress of gypsum specimen with oil immersion time.
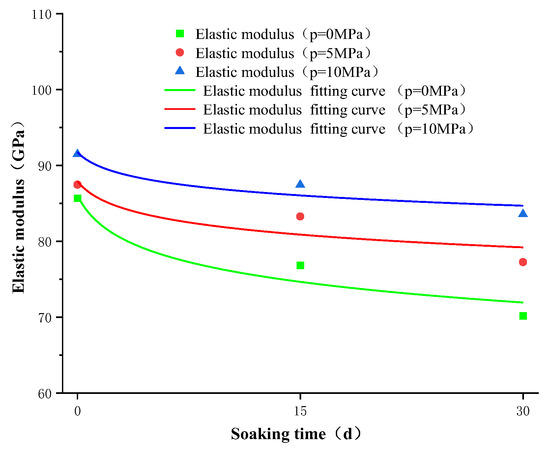
Figure 14.
Fitting curve of elastic modulus of gypsum rock samples with oil immersion time.
The mathematical relationships obtained by the fitting are as follows:
In the formula, are the peak stresses of the gypsum rock samples under the confining pressures of 0, 5, and 10 MPa, respectively, after immersion in oil for t days; are the initial values of peak stress of the gypsum rock samples under the confining pressures of 0, 5, and 10 MPa, respectively, after immersion in oil for t days are the elastic moduli of the gypsum rock samples under the confining pressures of 0, 5, and 10MPa, respectively, after immersion in oil for t days; are the initial values of the elastic modulus of the gypsum rock samples under the confining pressures of 0, 5, and 10MPa, respectively, after immersion in oil for t days, and R2 is the correlation coefficient.
Combining the above analysis and fitting function, the variation law of the mechanical parameters of the gypsum rock samples with the oil immersion time t was obtained. The damage change for the oil-immersed gypsum rock was obtained using the derivation of the oil immersion time t, the fitting expression, and rate function [28].
By normalizing the above equations, the following expressions were obtained:
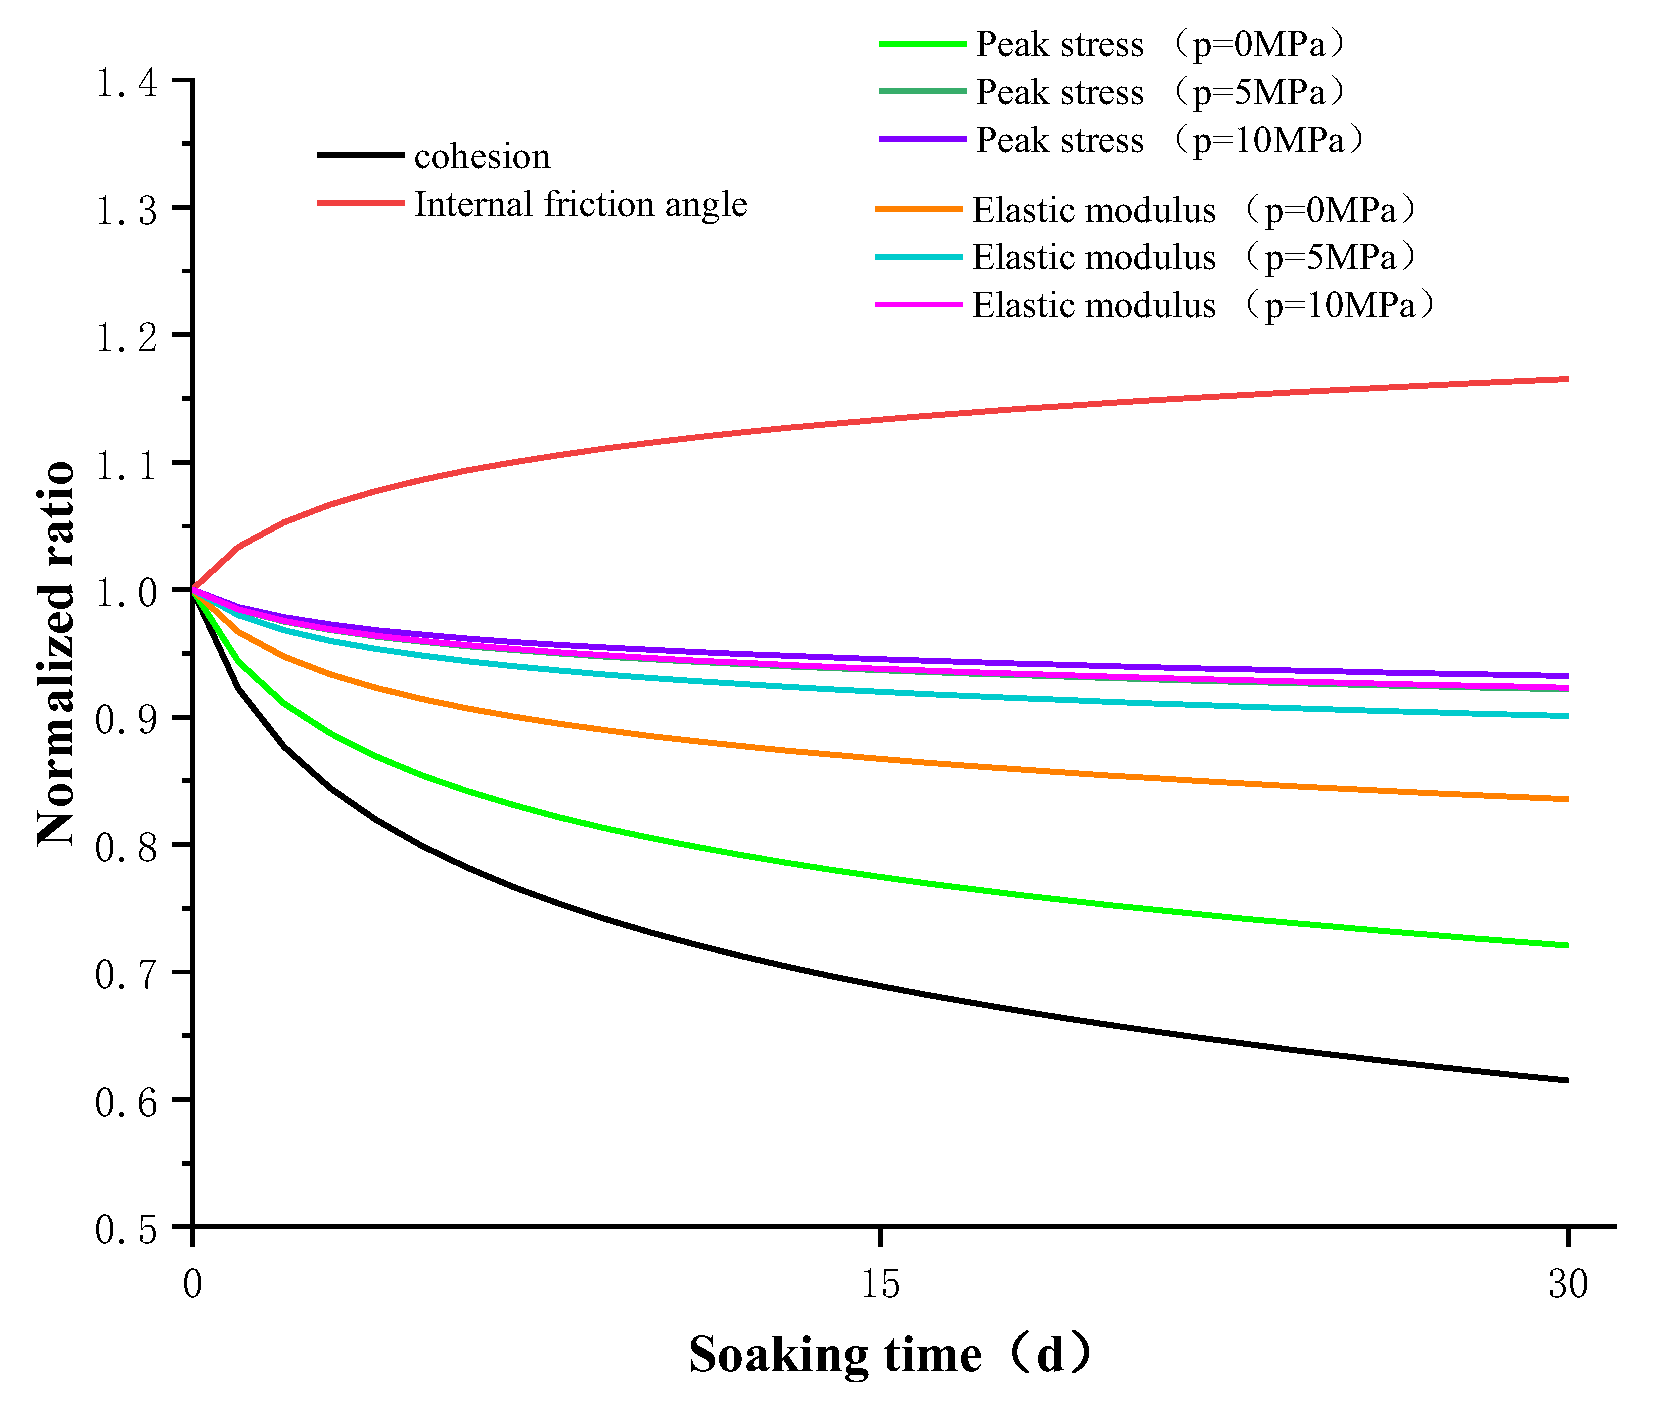
The relationship between the normalized functions of the above formulae and the oil immersion time was plotted, as shown in Figure 15.
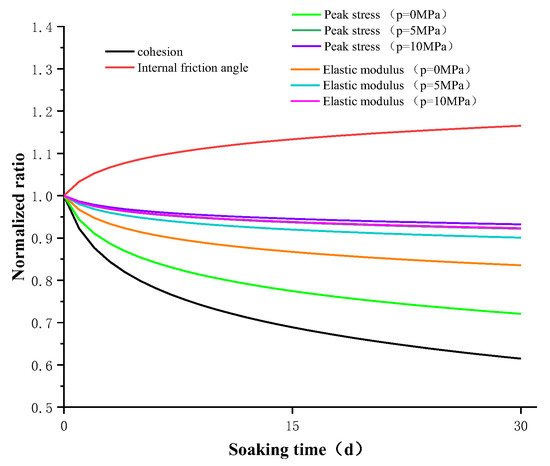
Figure 15.
The relationship between the normalized value of each parameter and the oil immersion time.
It can be seen from Figure 15 that, except for the internal friction angle, which increased with increasing oil immersion time, all the other parameters exhibited a decreasing trend with increasing oil immersion time. Moreover, with the increase in confining pressure, the effect of oil immersion time on the compressive strength and elastic modulus of the sample exhibited a decreasing trend, indicating that the effect of oil immersion under high confining pressures had less influence on each parameter.
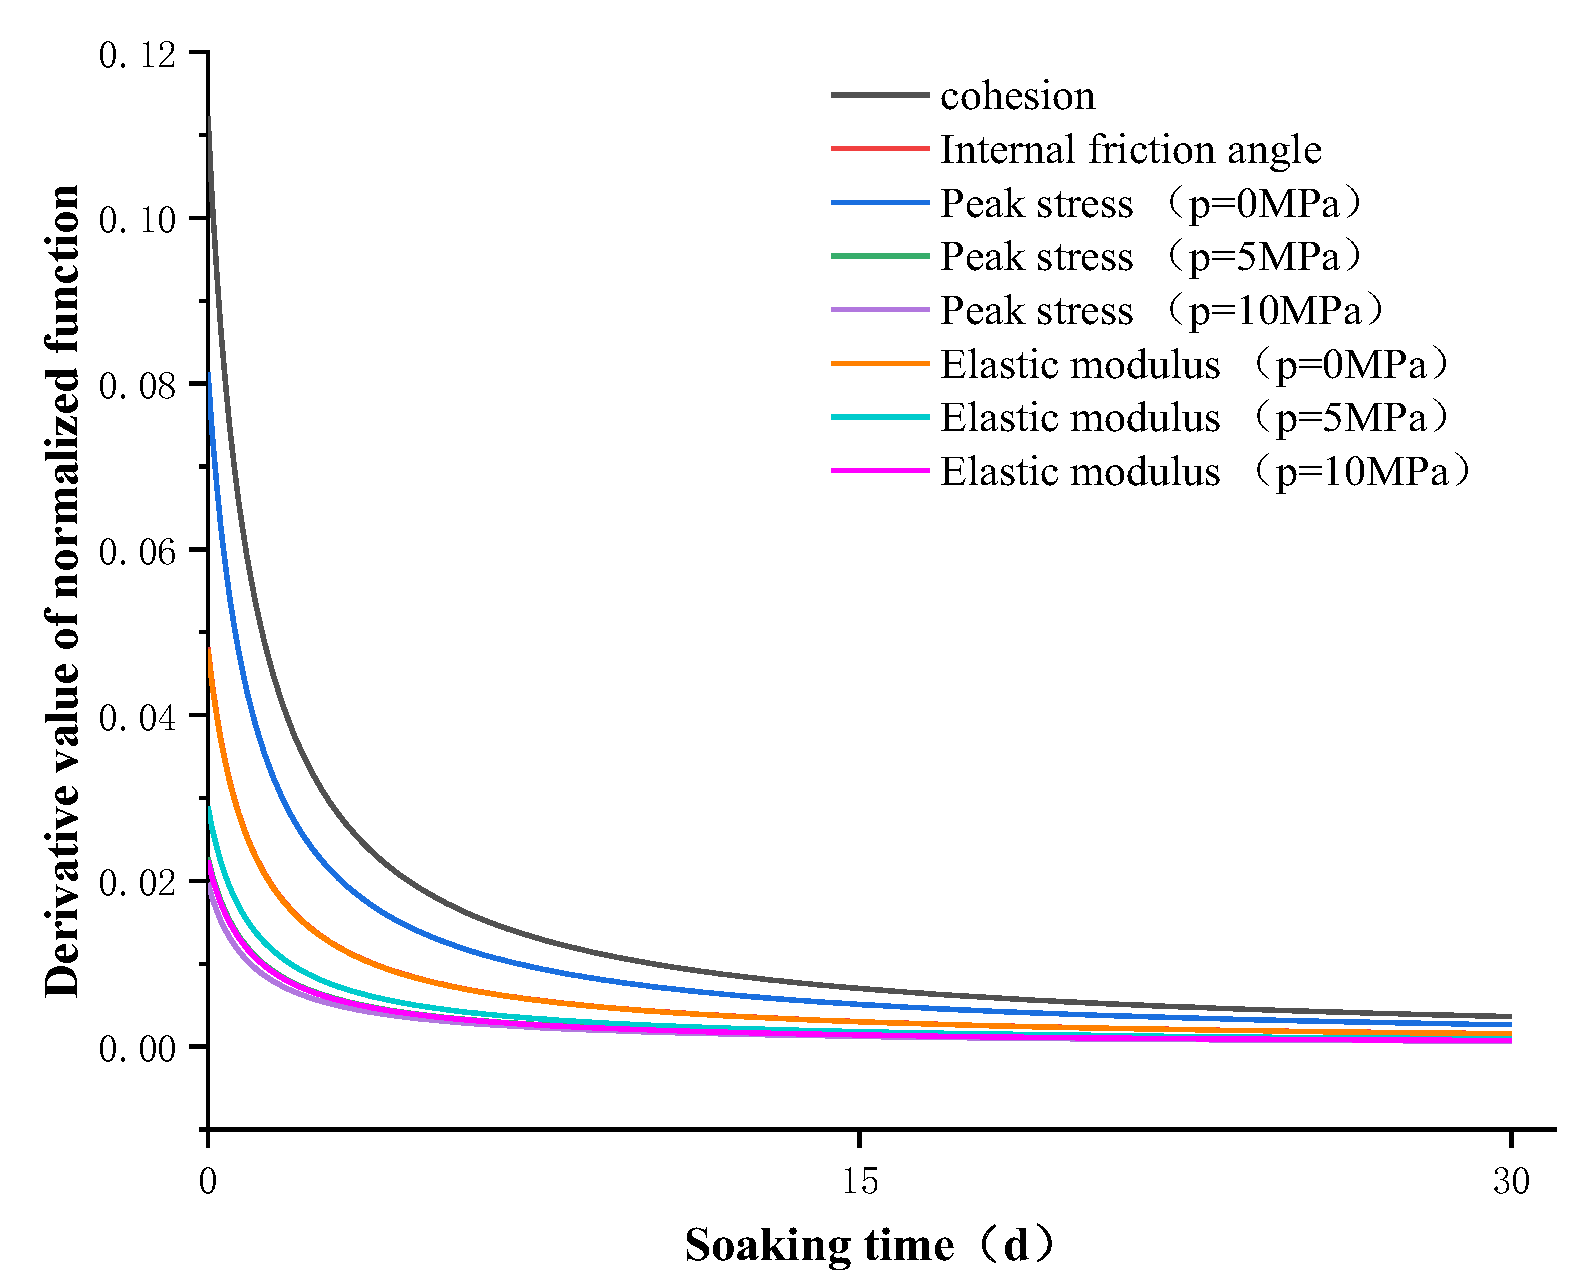
Taking the derivation of the normalized functional formula and the absolute value, the following formulae were obtained:
The above formulae were plotted, as shown in Figure 14.
Figure 16 shows the change rate of each mechanical parameter of the gypsum rock samples with the oil immersion time. Obviously, when ln(t + 1) was used as the fitting function, the larger the absolute coefficient value, the larger the value when the oil immersion time increased, and the rate of change (slope) increased with the oil immersion time. The rate of change gradually decreased to approximate a straight line. Therefore, the absolute value of the ln(t + 1) term coefficient is defined as the oil immersion time degradation coefficient CDW, and the following formula is the unified expression of the above formula:
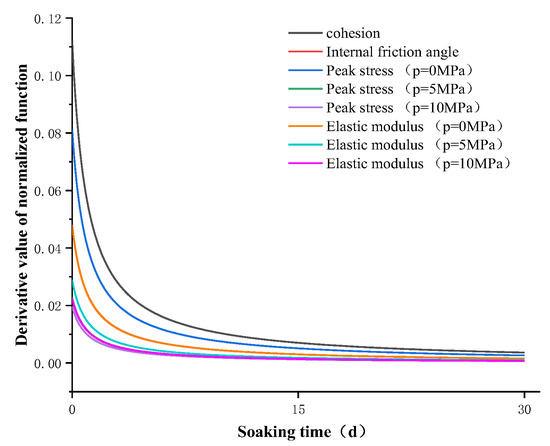
Figure 16.
The relationship between the normalized function derivative and oil immersion time.
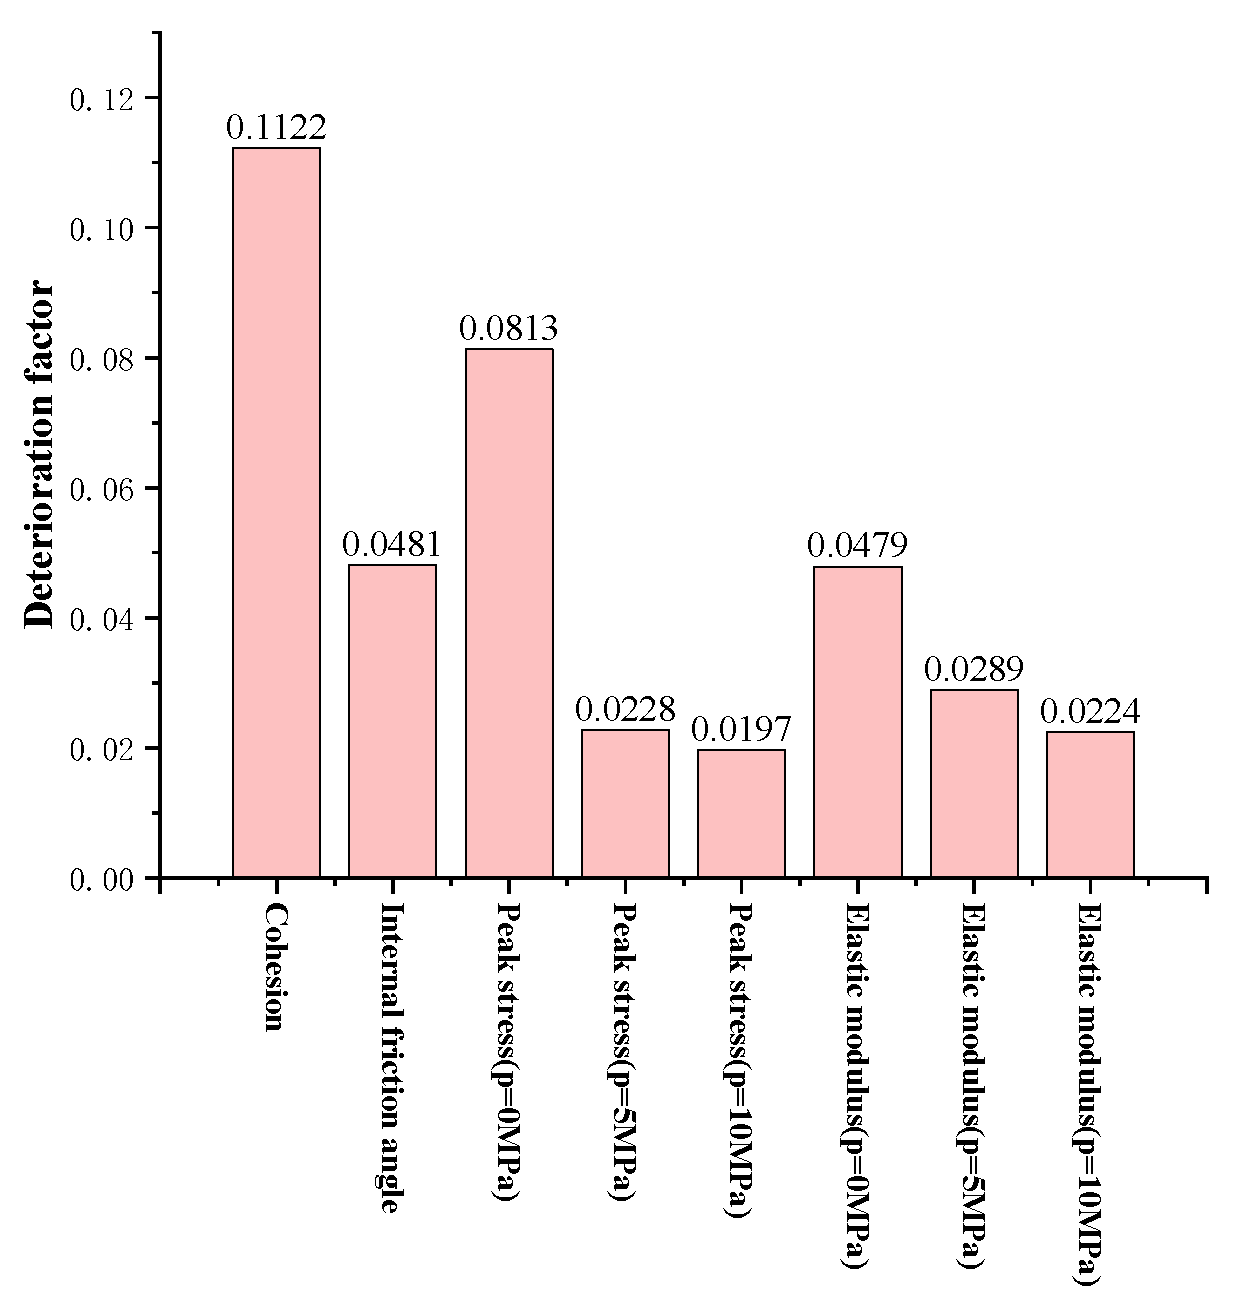
According to the above formula, the degradation coefficient CDW of each parameter of the gypsum rock sample with the oil immersion time was obtained, as shown in Figure 17:

Figure 17.
Deterioration coefficients for different mechanical parameters (CDW).
By comparing the deterioration coefficients, it can be concluded that the oil immersion time had the most obvious deterioration effect on the cohesion. With the increase in the loading confining pressure, the deterioration coefficient of the oil immersion time on peak stress and elastic modulus decreased. This indicates that the oil immersion time had little effect on the deterioration of the gypsum rock samples under high confining pressure. Moreover, it further shows that the high confining pressure state is more favorable for crude oil storage.
4. Conclusions
Using macroscopic mechanical test methods, gypsum rock samples after oil immersion for 0, 15, and 30 days were subjected to compression tests under confining pressures of 0, 5, and 10 MPa. Thereafter, the influence laws for the mechanical properties and rock damage evolution characteristics were obtained. The main conclusions are as follows:
- (1)
- The effect of different oil immersion times on the mechanical properties of gypsum rock samples was studied. With increasing oil immersion time, the peak stress of gypsum rock tended to decrease. When the confining pressure was higher, the peak stress of the samples with a longer oil immersion time decreased to a lesser extent, indicating that the oil immersion time affected the peak stress of gypsum rock under high confining pressure. The elastic modulus decreased with increasing oil immersion time. When the confining pressure was higher, the elastic modulus of gypsum with a longer oil immersion time decreased to a lesser degree, indicating that the oil immersion time affected the high confining pressure gypsum rock samples. The effect of elastic modulus was also smaller, and the law was shown to be similar to that of peak strength. This indicates that the oil immersion time can soften the gypsum rock to a certain extent, and the high confining pressure makes the gypsum crystals more compact. This causes the oil molecules inside or on the surface of the gypsum to be squeezed out, which reduces the softening effect.
- (2)
- The damage evolution characteristics of rocks as related to oil immersion time were revealed. Using statistical fitting, the normalized expressions of rock parameters with oil immersion times were established, and the deterioration coefficient was defined to evaluate the influence of oil immersion time on each parameter. The calculation results indicate that, as compared with 0 days of oil immersion, the internal friction angle increased by 12.17% after 15 days of oil immersion, while the internal friction angle increased by 16.81% after 30 days of oil immersion, and the cohesion decreased by 27.45% after 15 days of oil immersion. Moreover, cohesion was reduced by 40.83% after 30 days of oil immersion. In general, except for the internal friction angle, which increased with the increase in oil immersion time, the other parameters exhibited a decreasing trend with the increase in oil immersion time. The effects of oil immersion on the mechanical parameters of gypsum rock differed. Under a confining pressure of 0 MPa, the cohesion force had the greatest influence on the parameters, followed by peak stress, internal friction angle, and elastic modulus. The analysis results under confining pressures of 5 and 10 MPa show that the influence of oil immersion time weakened with the increase in confining pressure, as regards both peak stress and elastic modulus, which further indicates that the high confining pressure state is more effective for crude oil reserves.
Author Contributions
Methodology, Y.G. and G.R.; validation, Y.G. and L.Z.; formal analysis, Y.G.; investigation, C.Z.; data curation, C.Z. and L.Z.; writing—original draft preparation, Y.G.; writing—review and editing, Y.G., G.R. and C.Z.; funding acquisition, G.R. All authors have read and agreed to the published version of the manuscript.
Funding
This research was funded by the National Natural Science Foundation of China, grant number 52174087.
Institutional Review Board Statement
Not applicable.
Informed Consent Statement
Not applicable.
Data Availability Statement
Not applicable.
Conflicts of Interest
The authors declare no conflict of interest.
References
- Zhou, Y.; Li, M.; Xu, X.; Li, X.; Ma, Y.; Ma, Z. Research on Catastrophic Pillar Instability in Room and Pillar Gypsum Mining. Sustainability 2018, 10, 3773. [Google Scholar] [CrossRef]
- Fischer, A.; Hartlieb, P.; Daul, J. Abbauplanung der Schwebenrückgewinnung im Gipsbergbau Preinsfeld. Berg Huettenmaenn Mon. 2020, 165, 270–273. [Google Scholar] [CrossRef]
- Shun, P. Investigation of Instability and Blasting Caving Technology of Composite Support Structure in the Goaf of Gypsum Mine. Geotech. Geol. Eng. 2021, 15, 4377–4391. [Google Scholar] [CrossRef]
- Du, Z.; Liu, Z.; Liu, R.; Wang, S.; Li, F. Influencing Factors for the Instability and Collapse Mode of the Goaf Structure in a Gypsum Mine. Adv. Civ. Eng. 2021, 2021, 1–12. [Google Scholar] [CrossRef]
- Xie, H.; Zhao, J.W.; Zhou, H.W.; Ren, S.H.; Zhang, R.X. Secondary Utilizations and Perspectives of Mined Underground Space. Tunn. Undergr. Space Technol. 2020, 96, 103129. [Google Scholar] [CrossRef]
- Istvan, J.A.; Evans, L.J.; Weber, J.H.; Devine, C. Rock Mechanics for Gas Storage in Bedded Salt Caverns. Int. J. Rock Mech. Min. Sci. 1997, 34, e1–e142. [Google Scholar] [CrossRef]
- Martinez, J.D. Energy Programs--A Contribution to Knowledge About Salt Domes: ABSTRACT. Bulletin 1986, 70, 227–238. [Google Scholar] [CrossRef]
- Liang, G.; Huang, X.; Peng, X.; Tian, Y.; Yu, Y. Investigation on the Cavity Evolution of Underground Salt Cavern Gas Storages. J. Nat. Gas Sci. Eng. 2016, 33, 118–134. [Google Scholar] [CrossRef]
- Ma, X.; Xu, Z.; Chen, L.; Shi, X. Creep Deformation Analysis of Gas Storage in Salt Caverns. Int. J. Rock Mech. Min. Sci. 2021, 139, 104635. [Google Scholar] [CrossRef]
- Liu, S.; Wang, H.; Du, A.; Zhang, B. Tightness Analysis of Anhydrite Mine-Out Used for Underground Crude Oil Storage Considering Seepage–Stress Coupling: A Case Study. Energies 2022, 15, 2929. [Google Scholar] [CrossRef]
- Wang, T.T.; Ma, H.L.; Shi, X.L.; Yang, C.H.; Zhang, N.; Li, J.L.; Ding, S.L.; Daemen, J.J.K. Salt Cavern Gas Storage in an Ultra-Deep Formation in Hubei, China. Int. J. Rock Mech. Min. Sci. 2018, 102, 57–70. [Google Scholar] [CrossRef]
- Khaledi, K.; Mahmoudi, E.; Datcheva, M.; Schanz, T. Stability and Serviceability of Underground Energy Storage Caverns in Rock Salt Subjected to Mechanical Cyclic Loading. Int. J. Rock Mech. Min. Sci. 2016, 86, 115–131. [Google Scholar] [CrossRef]
- Zhang, C.; Wang, F.; Bai, Q. Underground Space Utilization of Coalmines in China: A Review of Underground Water Reservoir Construction. Tunn. Undergr. Space Technol. 2021, 107, 103657. [Google Scholar] [CrossRef]
- Menéndez, J.; Loredo, J.; Galdo, M.; Fernández-Oro, J.M. Energy Storage in Underground Coal Mines in NW Spain: Assessment of an Underground Lower Water Reservoir and Preliminary Energy Balance. Renew. Energy 2019, 134, 1381–1391. [Google Scholar] [CrossRef]
- Qin, C.; Loth, E. Isothermal Compressed Wind Energy Storage Using Abandoned Oil/Gas Wells or Coal Mines. Appl. Energy 2021, 292, 116867. [Google Scholar] [CrossRef]
- Jiang, D.; Chen, S.; Liu, W.; Ren, Y.; Guo, P.; Li, Z. Underground Hydro-Pumped Energy Storage Using Coal Mine Goafs: System Performance Analysis and a Case Study for China. Front. Earth Sci. 2021, 9, 760464. [Google Scholar] [CrossRef]
- Hangx, S.J.T.; Spiers, C.J.; Peach, C.J. The Effect of Deformation on Permeability Development in Anhydrite and Implications for Caprock Integrity during Geological Storage of CO2: Effect of Deformation on Permeability Development in Anhydrite. Geofluids 2010, 10, 369–387. [Google Scholar] [CrossRef]
- Guo, Y.; Yang, C. Experimental investigation on strength and deformation properties of anhydrite under conventional triaxial compression. Rock Soil Mech. 2010, 31, 1776–1780. [Google Scholar] [CrossRef]
- Wang, H.; Zhang, B.; Wang, L.; Yu, X.; Shi, L.; Fu, D. Experimental Investigation on the Long-Term Interactions of Anhydrite Rock, Crude Oil, and Water in a Mine-out Space for Crude-Oil Storage. Eng. Geol. 2020, 265, 105414. [Google Scholar] [CrossRef]
- Wang, H.; Zhang, B.; Xu, N.; Yu, X. Stability Analysis of Anhydrite Mine-out as an Underground Gas Storage Based on DEM and Similarity Theory: A Case Study. Bull Eng Geol Env. 2022, 81, 99. [Google Scholar] [CrossRef]
- Zhang, B.; Wang, H.; Wang, L.; Mei, G.; Shi, L.; Xu, N.; Li, J. Large-Scale Field Test on Abandoned Deep Anhydrite Mine-out for Reuse as Crude Oil Storage—A Case Study. Eng. Geol. 2020, 267, 105477. [Google Scholar] [CrossRef]
- Liu, J.; Zhao, X.-D.; Zhang, S.-J.; Xie, L.-K. Analysis of Support Requirements for Underground Water-Sealed Oil Storage Cavern in China. Tunn. Undergr. Space Technol. 2018, 71, 36–46. [Google Scholar] [CrossRef]
- Sofianos, A.I. Tunnelling Mohr–Coulomb Strength Parameters for Rock Masses Satisfying the Generalized Hoek–Brown Criterion. Int. J. Rock Mech. Min. Sci. 2003, 40, 435–440. [Google Scholar] [CrossRef]
- Rafiei Renani, H.; Martin, C.D. Slope Stability Analysis Using Equivalent Mohr–Coulomb and Hoek–Brown Criteria. Rock Mech. Rock Eng. 2020, 53, 13–21. [Google Scholar] [CrossRef]
- Lee, Y.-K.; Pietruszczak, S. Limit Equilibrium Analysis Incorporating the Generalized Hoek–Brown Criterion. Rock Mech. Rock Eng. 2021, 54, 4407–4418. [Google Scholar] [CrossRef]
- Lini Dev, K.; Pillai, R.J.; Robinson, R.G. Drained Angle of Internal Friction from Direct Shear and Triaxial Compression Tests. Int. J. Geotech. Eng. 2016, 10, 283–287. [Google Scholar] [CrossRef]
- Wang, S.; Xu, W.; Sun, M.; Wang, W. Experimental Investigation of the Mechanical Properties of Fine-Grained Sandstone in the Triaxial Cyclic Loading Test. Env. Earth Sci. 2019, 78, 416. [Google Scholar] [CrossRef]
- Zha, F.; Huang, K.; Kang, B.; Sun, X.; Su, J.; Li, Y.; Lu, Z. Deterioration Characteristic and Constitutive Model of Red-Bed Argillaceous Siltstone Subjected to Drying-Wetting Cycles. Lithosphere 2022, 2022, 8786210. [Google Scholar] [CrossRef]

Publisher’s Note: MDPI stays neutral with regard to jurisdictional claims in published maps and institutional affiliations. |
© 2022 by the authors. Licensee MDPI, Basel, Switzerland. This article is an open access article distributed under the terms and conditions of the Creative Commons Attribution (CC BY) license (https://creativecommons.org/licenses/by/4.0/).