Abstract
In recent years, the issue of regional economics and carbon emissions has become a research hotspot in the cross field of economy, environment and ecology. This paper selects the regional economics and carbon emissions related literature collected in the Web of Science (WOS) database as the basis, and uses the bibliometric software Citespace and VOSviewer to visually analyze the time distribution, organization, author and keywords in this research field. This paper provides a more systematic analysis of how different regions of China could achieve carbon emission objectives, from the aspects of regional industrial transformation, energy consumption structure, policy implementation and regional coordinated development. The keywords with high frequency are carbon emissions, economic growth and energy consumption, etc. The research hotspots can be divided into structural decomposition analysis, low-carbon industry transformation path, policy framework and energy efficiency, etc. The results show that future research should strengthen multidisciplinary cross-integration in different universities and institutions. However, based on in-depth analysis, the key factors which affect regional carbon emissions are regional policy implementation, changes in industrial structures, optimization of energy consumption structure and carbon trade market mechanism. Finally, we suggest that institutions and scholars should conduct adequate interdisciplinary and cross-industry cooperation; industrial sector development should consider local endowment; there should greater use of clean energy to optimize the energy consumption structure; and an increase in R&D carbon capture and sequestration technology.
1. Introduction
The emissions of greenhouse gases, especially carbon dioxide (CO2), and the resulting climate change are not only an environmental problem but also an issue related to economic growth and social development [1]. With the increasing attention of all sectors of society to climate change, the environmental problems caused by carbon emissions have become the main factors restricting low-carbon green economics development [2]. Meanwhile, the carrying capacity of the ecosystem has reached the upper limit, and the growth model of an extensive economy, which relies excessively on inputs of resources and energy, is unsustainable. The method to achieve effective carbon emission reduction, under the goal of economic growth, is an important task in promoting sustainable economic and social development [3]. In the future, to meet the challenges associated with climate change and promote the development of economic transition and transformation, green transformation and development under the carbon emission constraint is the only way for sustainable development of the regional economy.
Carbon emission reduction not only means changes in energy structure, industrial structure, and policy regulation, but it is also the driving force of coordinated green and low-carbon development. Taking this development opportunity, different regions may make full use of the differences between the supply and the consumption side of regional energy and resource endowment differences; adjust measures to local conditions; and bring superiority into full play [4]. For example, a resource-centered region may use its advantages to provide the load-centered region with more clean energy and cheap electric energy, promote the transformation of resource superiority into economic superiority, and realize the optimal allocation of resources.
The exploration of the carbon emission reduction path and implementation measures has become a hotspot in current research. From the perspective of energy supply, it is extremely urgent to realize a zero-carbon electrical power system. From the perspective of energy consumption, it is imperative to realize the transformation of energy structure in such fields as industry, transportation and building. Since industrial structures, carbon emission sources and carbon emission reduction technologies in different industries are obviously different, individual industries should, under the background of carbon emission reduction, and according to their respective industrial characteristics and emission characteristics, select their respective specific carbon emission reduction paths [5]. Based on the path exploration in sectors such as the power sector, iron and steel sector, and the building sector, specialists and scholars propose to: build a modern new zero-carbon electric power system; improve the utilization of non-fossil energy, such as hydrogen energy and biomass energy in industrial sectors; take measures such as low-carbon transportation and zero-carbon building; and conduct innovation and R&D of such technological means as low carbon emission reduction.
Regional low-carbon economic development has always been the hotspot of theoretical research and policy research. At present, there is relatively little research on regional carbon emissions. This paper attempts to explore the key direction and path of carbon emission reduction targets at the regional level, thus providing a reference for related research. In terms of regional carbon emission, most of the existing literature review paper focuses more on the causality between environment, energy and economic growth [6]. Some scholars have put forward the corresponding carbon emission reduction path according to the spatial linkage mechanism of carbon emissions, obtaining relational influence factors such as population mobility, economic development, technical progress, urbanization rate and industrial structure [7,8]. In other research interested in the relationship between tourism and environment, research results showed that tourism has direct effects on carbon emissions, and indirect effects on carbon emissions through energy consumption and transportation [9].
This paper provides a more systematic analysis of how different regions of China could achieve carbon emission objectives. From the aspects of regional industrial transformation, energy consumption structure, policy implementation and regional coordinated development. This paper has two innovations. In terms of methodology, most of which only focuses on the analysis of specific problems in a certain industry, we present our findings in a visual form such as information relating to authors, institutions, countries and keywords; then, we analyze hotspots in the research field [10,11]. This paper shows not only descriptive statistics and keyword co-occurrence analysis, but also uses co-authorship analysis, co-citation analysis, burst word analysis and comprehensively analyzes the evolution and future development trend of core and hotspots in the research field of the regional economy and carbon emission. From the perspective of the research, this paper expounds on the impact of industrial structure, energy consumption structure, urbanization, technological innovation, and other problems related to the regional economy on the carbon emissions, and gives a review of the research tools and methods used to study the problems in this field.
2. Methodology
2.1. Data Acquisition
The data used in this paper are all from three citation index databases, i.e., the SCI-EXPANDED, SSCI, and CPCI-S, in the Web of Science databases. The time range for retrieval is 1 January 2000 to 31 December 2021. The retrieval keywords are “carbon emission*” and “regional economic*”, which was retrieved on 1 May 2022, to obtain a record number of 2218 research papers. Each data record mainly includes the author, title, abstract, and citation of the literature. Secondly, we selected the journal type as “articles” or “review articles”, and screened 2207 records for further evaluation. The language type chosen was “English”. The retrieval indicates 2205 pieces of English literature, among which 1368 are published by Chinese scholars and 937 by international scholars. Finally, to ensure the relevance of the literature, the relevant research field selected for this research include “environmental sciences”, “economics”, “ecology”, “regional urban planning”, “geography”, and “management”. The screening indicated 1421 pieces of literature for analysis.
2.2. Bibliometric Methods
In this paper, the software Citespace and VOSviewer is used to conduct the corresponding data mining and quantitative analysis on the cited literature and citations on the topics of “regional economic*” and “carbon emission*” over the past 22 years. This paper selects “title + abstract + keywords” as the text for the software analysis. Citespace is used to conduct the co-word analysis on the keywords, thus clarifying the current situation of regional carbon emission research. The topic clustering advantage of VOSviewer is used to verify the result of Citespace, and to display the research content and results more intuitively.
Bibliometric analysis methods mainly include the following three categories: co-authorship analysis, co-citation analysis and keyword co-occurrence analysis [8]. The co-authorship network analysis is a visualized analysis of the co-authorship network by sorting the publication of literature by various authors in the literature field of the target discipline. Citespace may be used to study information from the author, institution, or country level, and analyze cooperation among scholars in the research field of the regional economy and carbon emissions. Co-citation analysis, which was first proposed by the American information scientist, Small, in 1973, can be used for literature co-citation, author co-citation, and journal co-citation [12]. The co-cited papers usually have a certain similarity in content, which will change with time, and analyzes the development and evolution of a certain field of discipline according to co-cited papers, journals, and authors. In the co-citation analysis, a node represents an article, the size of each node represents the strength of co-citation, and the link between two nodes means that the corresponding two papers are cited by another paper [13]. Keyword co-occurrence analysis uses the frequency of words or phrases in the literature to analyze the core information and the research field, or uses the keywords co-occurrence visualized diagram to observe the hotspot research directions and cutting-edge issues in this research field [14]. Keyword co-occurrence analysis measures the association strength of keywords to reveal the research trend of a certain discipline.
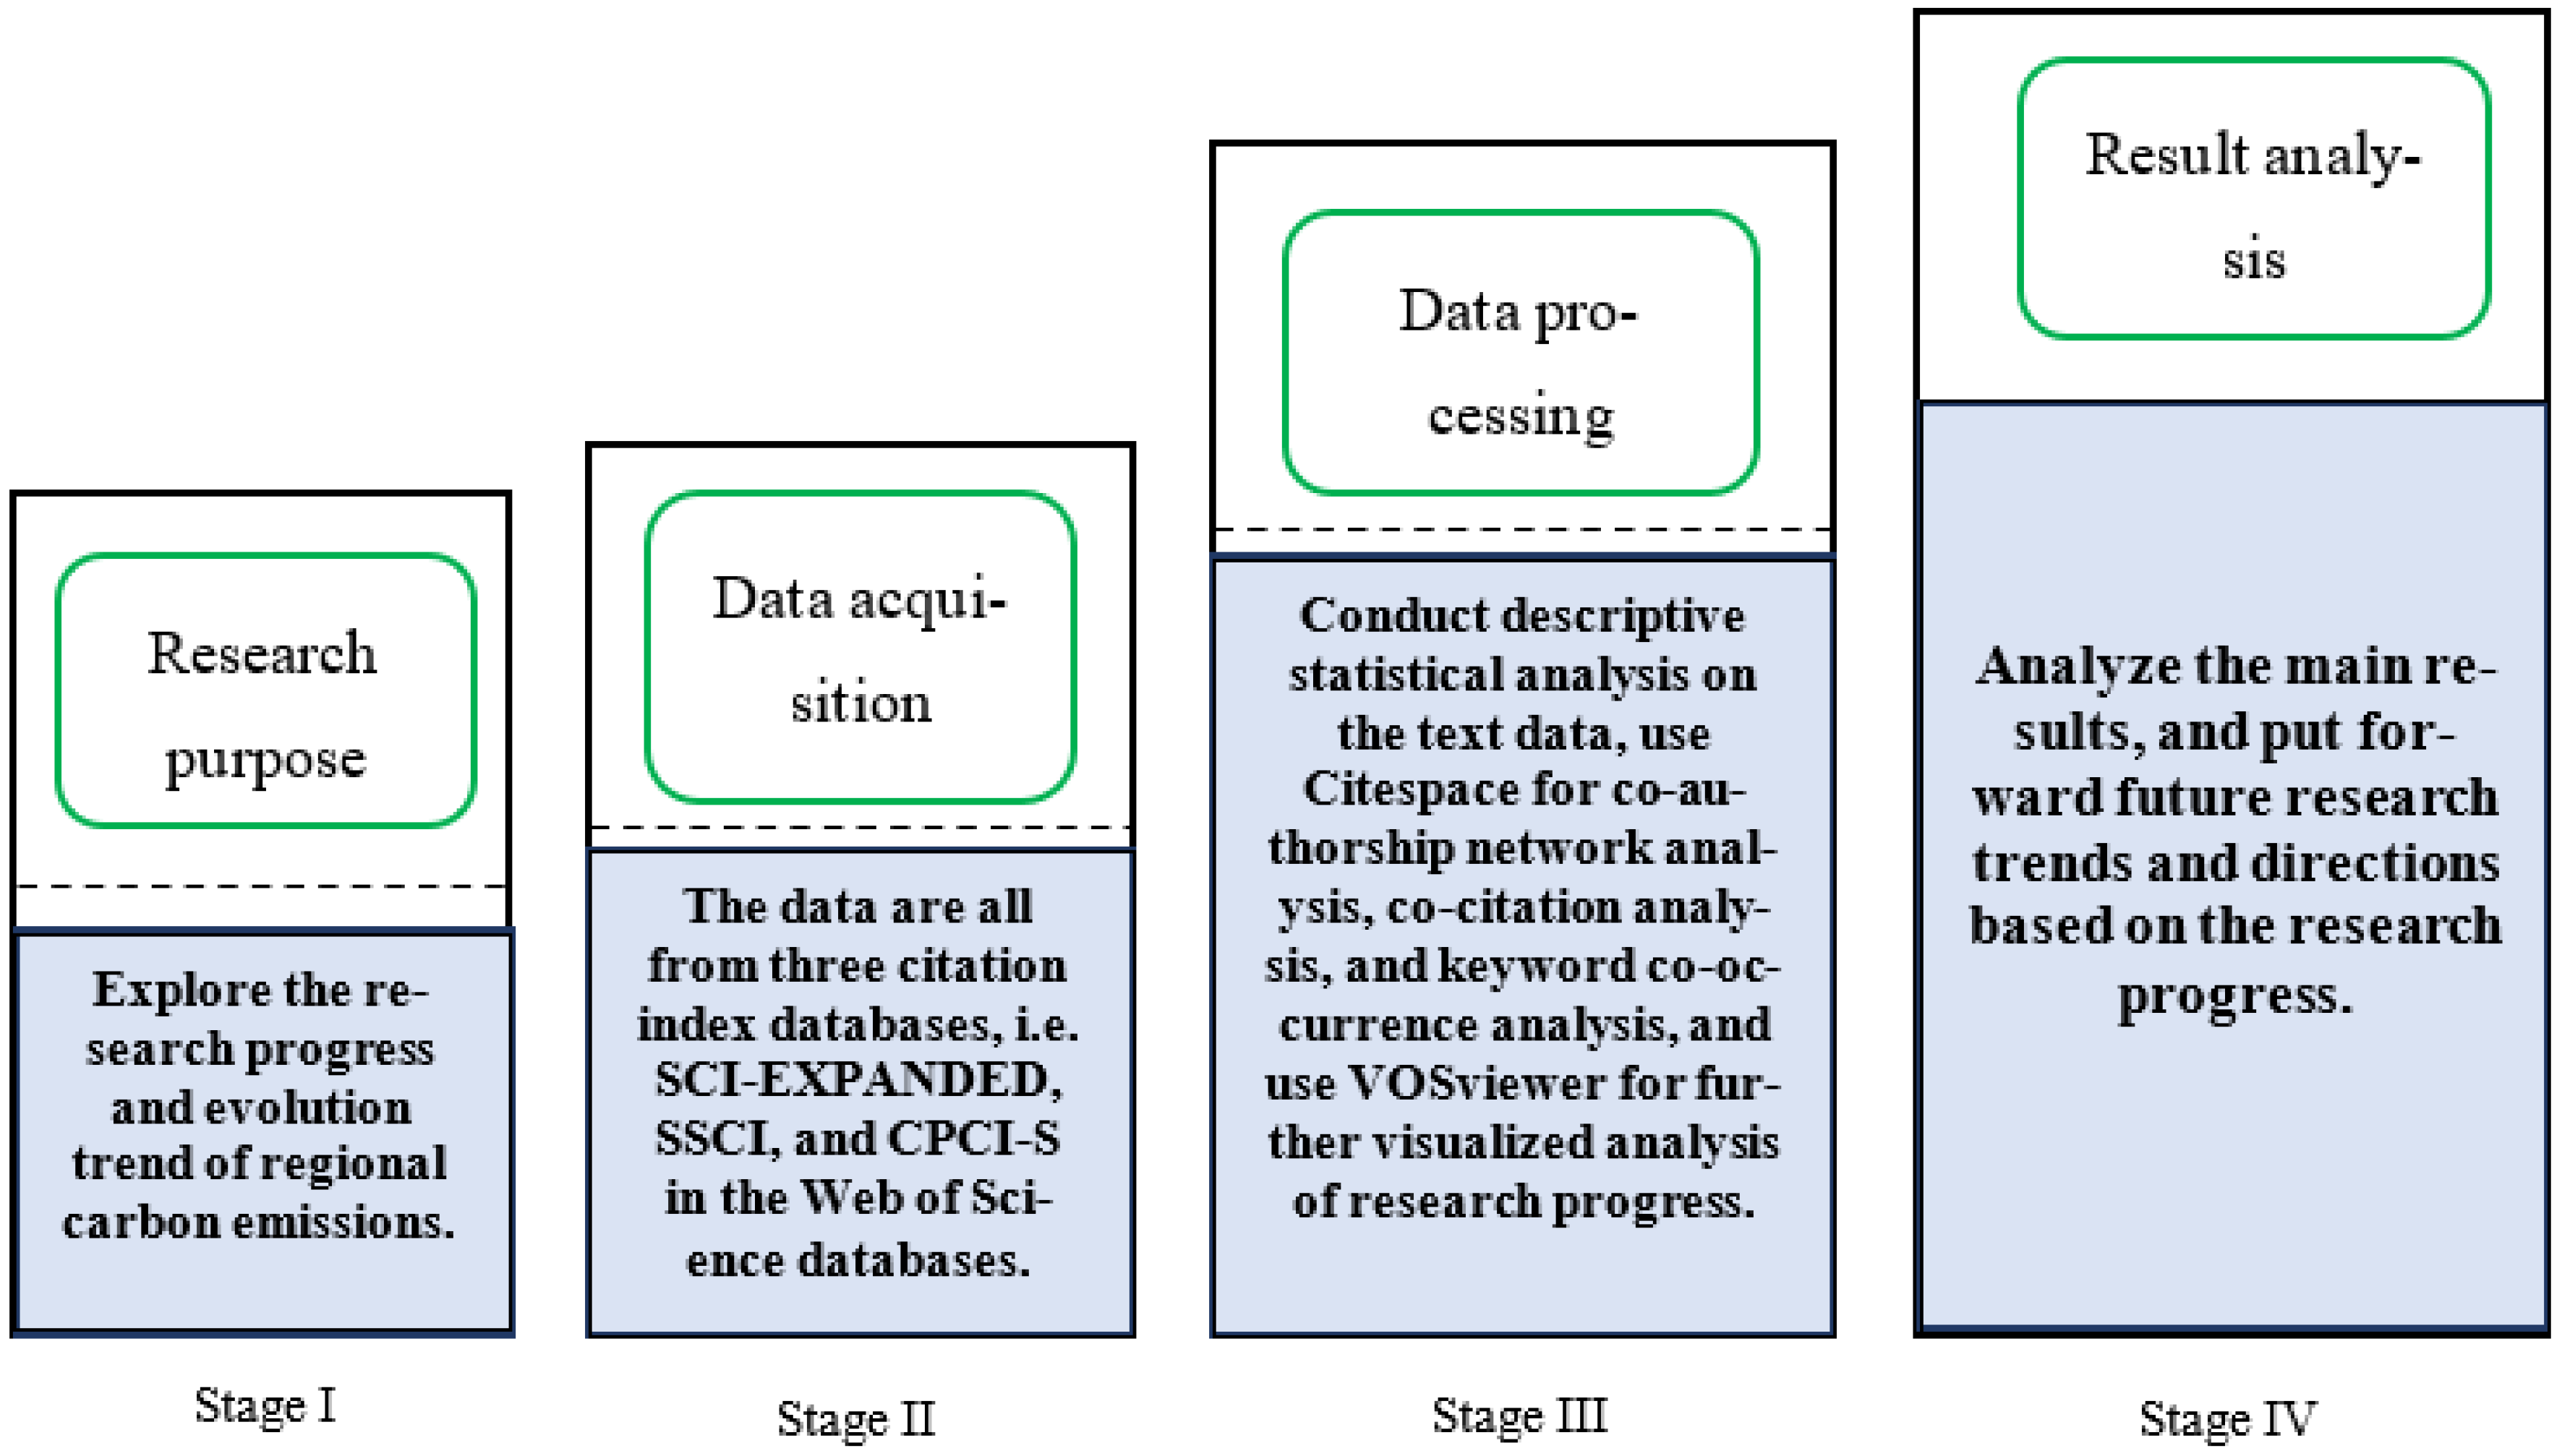
The specific steps of this research are as follows: first, we explore the research progress and evolution trend of regional carbon emissions, obtain and process data from the Web of Science, and conduct descriptive statistical analysis on the data, such as literature, citations, journals, countries and institutions; second, we conduct the text analysis, co-citation analysis and cluster analysis on Citespace, and discuss the frontier hotspots in the theory and practice of the research field of the regional economy and carbon emissions; third, we use VOSviewer to conduct the further visualized analysis of literature data (core tags such as number of published papers, keywords and subject terms), analyze the critical results, and put forward future research trends (Figure 1).
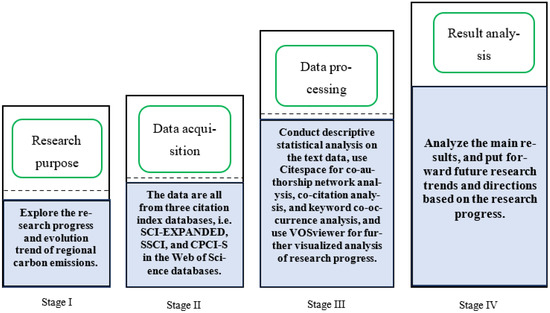
Figure 1.
Research stages.
3. Descriptive Statistical Analysis of Literature
3.1. Number of Published Papers and Publication Trend
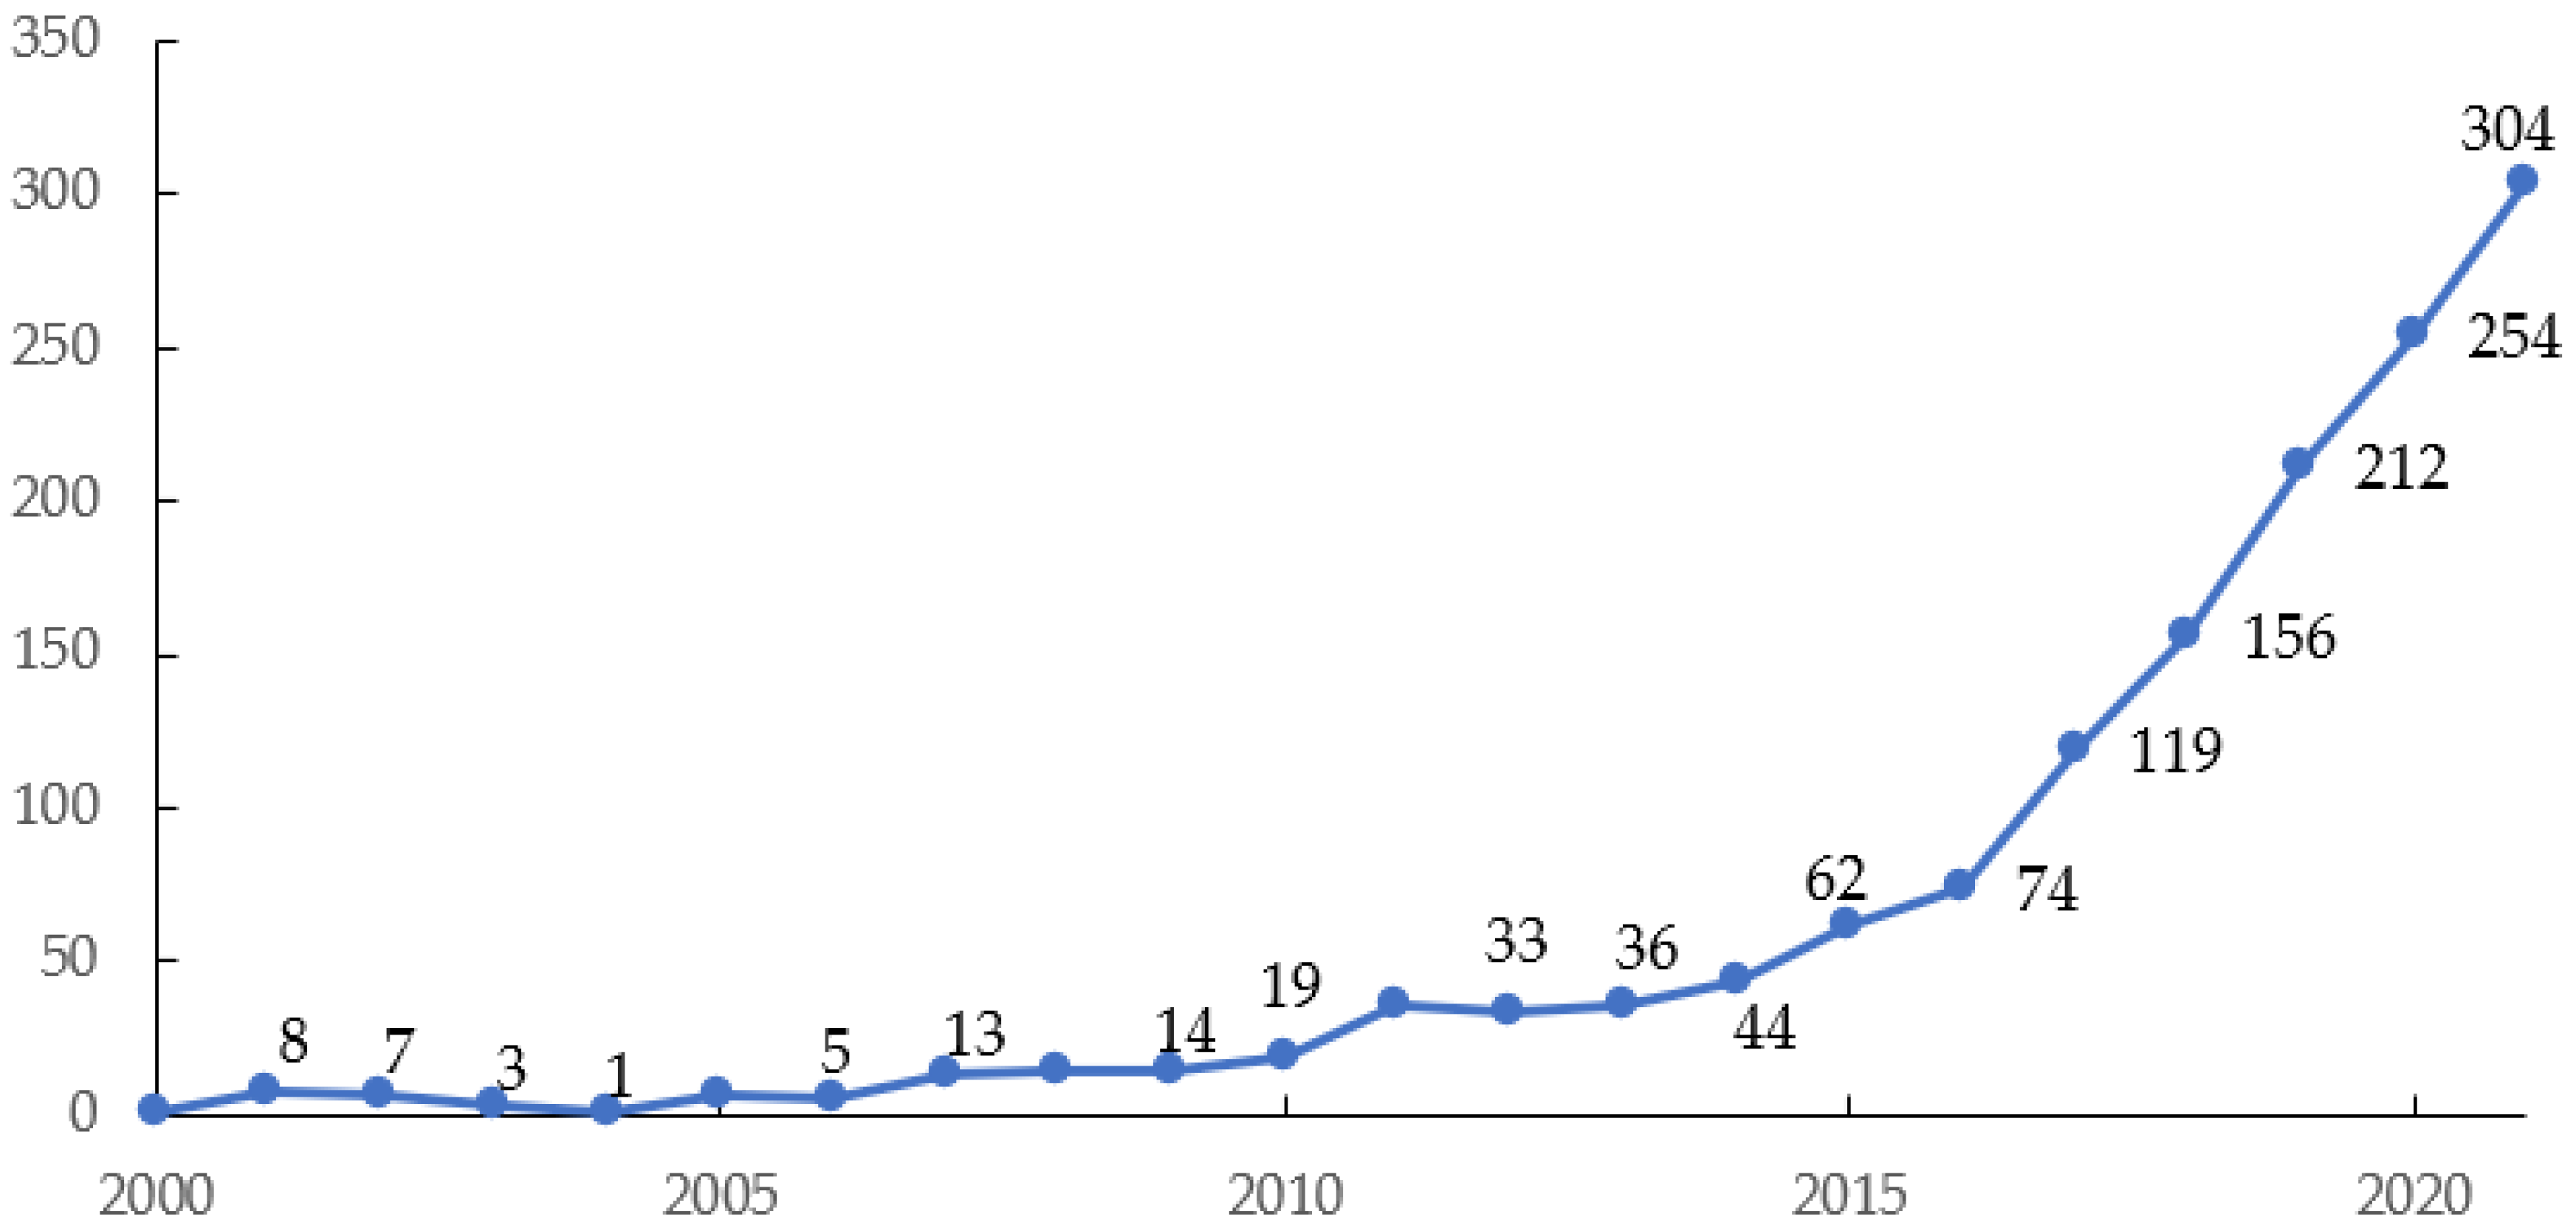
The total number of literatures, as an important indicator, is generally considered to measure the development level of this discipline, as well as the most intuitive indicator to measure scientific achievements [15,16]. Therefore, annual distribution statistics, citation distribution statistics and discipline classification statistics are first conducted for the obtained literature to form a preliminary standing of the research field of regional carbon emissions (Figure 2).
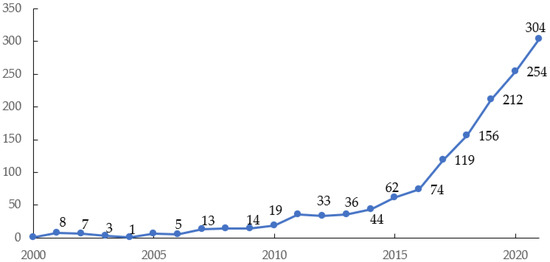
Figure 2.
Distribution of literature in the timeline.
From 2000 to 2021, the number of literature is generally on the rise, and research on regional economics and carbon emissions can be divided into three stages: Stage I is from 2000 to 2010, during which the number of published papers was steady at 8 papers per year; Stage II is from 2010 to 2016, during which the number of published papers rose steadily, while the amplitude of variation of total literature in each year was not large; Stage III is from 2016 to current day, during which the number of published papers rose rapidly and the research results were rather rich, which was related to the official implementation of the Paris Agreement in November 2016. The Paris Agreement has promoted carbon emission-related topics to become the research hotspot of scholars, and multiple thematic areas such as energy structure, industrial structure, carbon market policies and environmental regulations are designed. In September 2020, the Chinese government put forward its carbon peaking and carbon neutrality goals. Under the influence of intensively introduced relevant policies, the scholars shift their attention to the study of specific measures for carbon emission reduction and technological innovation of carbon neutrality in various industries [17] (Figure 3).
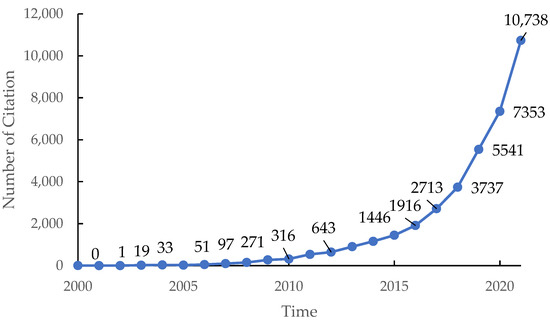
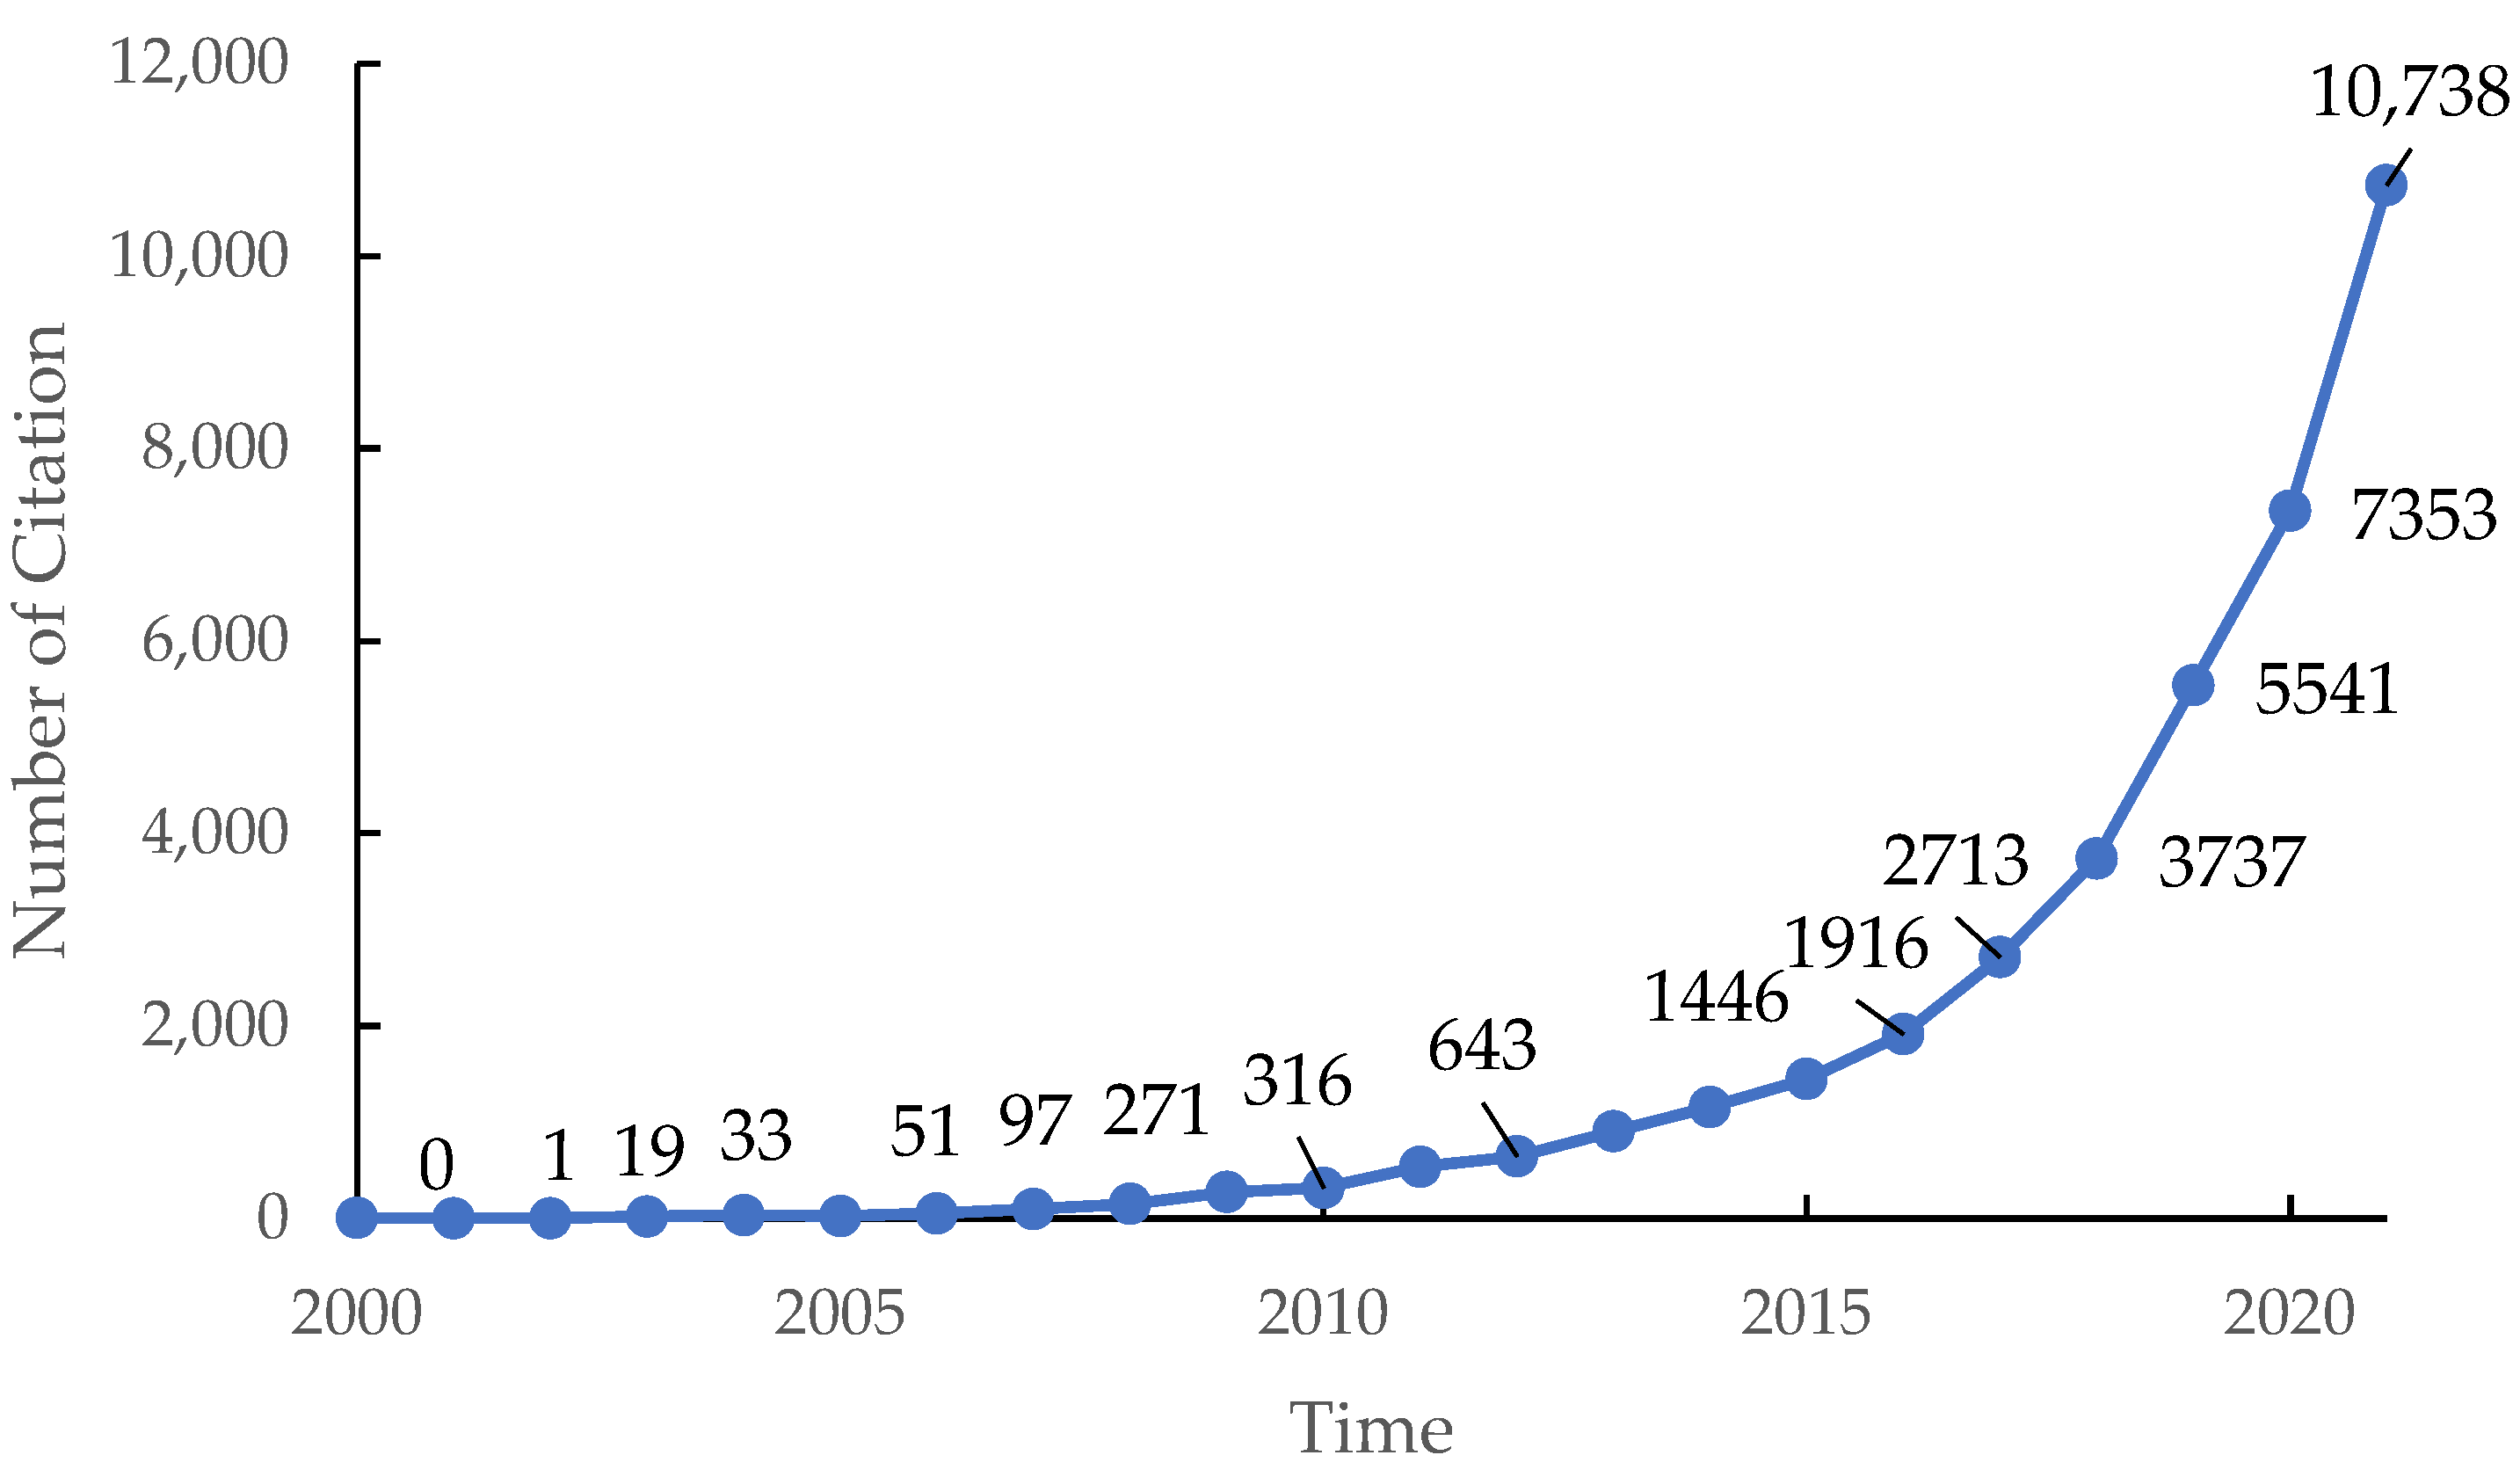
Figure 3.
Number of citations in each year.
As can be seen from the figure, since 2000 the number of cited literature in the research field of regional economics and carbon emissions has increased rapidly every year, especially after 2015. The related literature on the research of regional carbon emissions was cited only four times during the period from 2000 to 2003, among which there was no citation in 2001. Before 2008, the number of citations of relevant literature was no more than 100 times per year. By 2014, the total number of citations of relevant literature in this research field was more than 1000 times every year. Among all literature samples, the most cited literature is a paper by Riahi (2017), which was co-cited 990 times by the end of 2021. Riahi (2017) outlines the shared socioeconomic pathways (SSPs) and their impacts on energy, land use and emissions [18]. Besides Riahi (2017), the highly cited papers and their overviews are shown in Table 1.

Table 1.
Highly cited papers in literature samples.
The disciplines involved in the research of regional economy and carbon emissions are mainly environmental sciences ecology (83.88%), green sustainable science technology (28.50%), engineering environmental (23.08%), environmental studies (22.09%) and economics (18.72%). This also indicates that the research in the field of regional economy and carbon emissions is an interdisciplinary field and has become a research topic of common concern in multiple disciplines, such as environmental science, ecology and economics (Figure 4).
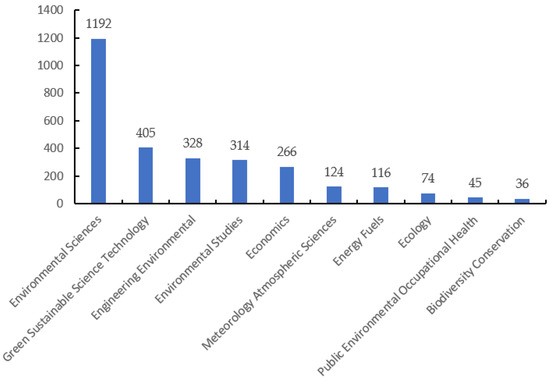
Figure 4.
Distribution of disciplines.
3.2. Analysis of Literature Countries, Institutions and Authors
All the literature comes from 94 countries and regions and includes 1304 from China (excluding Hong Kong, Macao and Taiwan), 396 are from the United States, and 161 are from England. Countries publishing more than 50 papers also include Australia, Germany, the Netherlands, Japan, Canada, Italy, France and Austria. The Asian countries and regions publishing many papers include Pakistan (45 papers), South Korea (33 papers), China Taiwan (28 papers), Singapore (26 papers), Turkey (25 papers), India (20 papers), Malaysia (20 papers), Saudi Arabia (16 papers) and Indonesia (10 papers). The African countries and regions publishing many papers include South Africa (11 papers). The Latin American countries and regions publishing many papers include Brazil (46 papers), and the European countries publishing many papers include Spain (44 papers), Sweden (38 papers), Norway (36 papers), Switzerland (35 papers), Scotland (23 papers), Finland (20 papers), Greece (16 papers), Denmark (15 papers), New Zealand (15 papers), Russia (15 papers), Belgium (11 papers), Czech Republic (11 papers), Ireland (11 papers) and Wales (10 papers) (Figure 5).
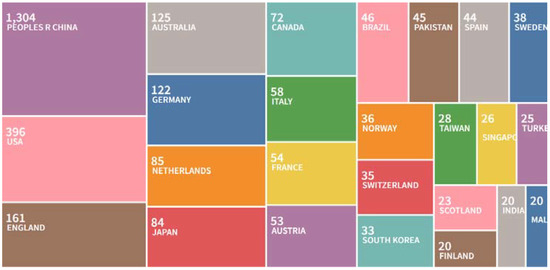
Figure 5.
Distribution of literature by countries/regions—TOP 25 (involving repetitive computation).
It can be seen that China has the strongest research strength in the field of regional carbon emissions, there are no weak countries in the United States and Europe, and some developing countries such as Pakistan and Brazil have rather good research intensity but still have a rather big gap compared with European and American countries.
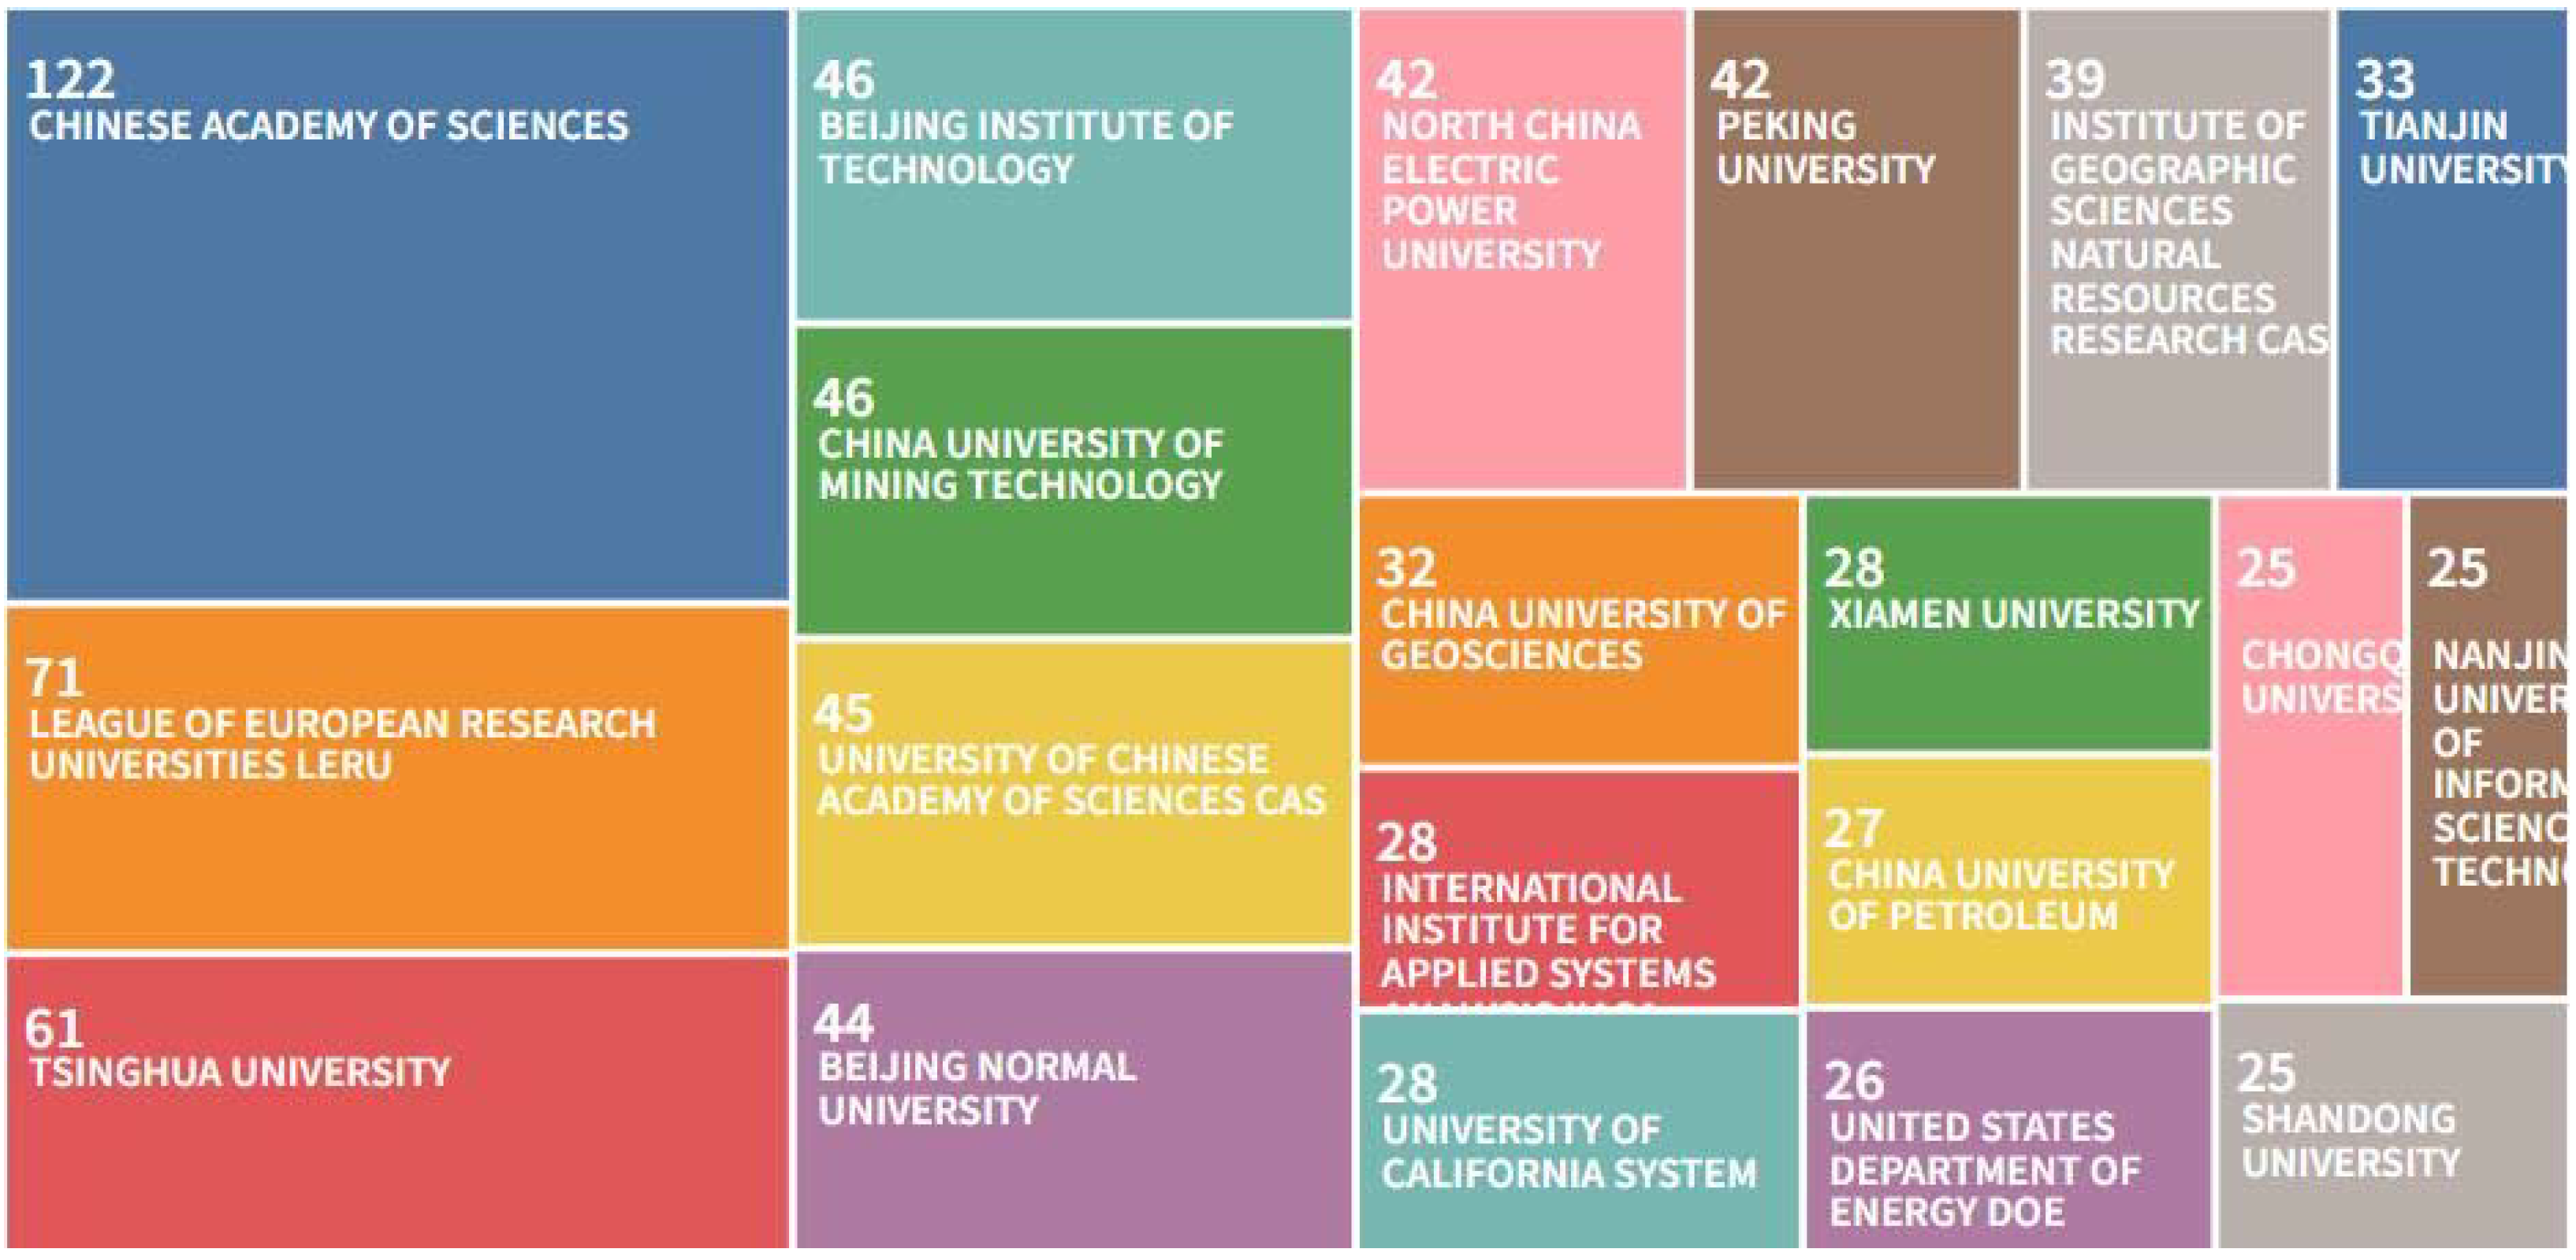
Figure 6 shows that papers mainly come from universities and scientific research institutions in various countries and regions. In terms of the number of published papers, the Chinese Academy of Sciences ranks first, with 122 papers, followed by the League of European Research Universities (LERU), Tsinghua University, Beijing Institute of Technology, China University of Mining and Technology, University of Chinese Academy of Sciences, Beijing Normal University, North China Electric Power University, Peking University and the Institute of Geographic Sciences and Natural Resources Research, CAS. Of the top 10 research institutions, only one is a European research institution, while the remaining research institutions are universities and scientific research institutions in China. The Department of Energy of the United States ranks at number 17, with 26 papers published.

Figure 6.
Distribution of literature by institutions.
Table 2 lists the prolific authors publishing 10 or more papers in this research field, and their institutions. It can be seen that all the prolific authors are from China, and they are employees of universities and scientific research institutions in China, which shows fully that China’s research achievements in this research field are world-leading.
Table 2.
Prolific authors with more than 10 papers.
3.3. Distribution of Literature by Journals
Journals, as one important carrier for knowledge dissemination, are an important embodiment reflecting the quality of discipline research. Research on the relevant distribution of literature by journals can provide scientific research workers with guidance on the timely screening of key information and the selection of a platform for publishing scientific research results [24]. According to the literature sample data, we calculate and determine the top 10 journals in this research field and their impact factors. It can be seen from the results in Table 2 that the impact factors of these journals with a large number of published papers are between 3 and 10, and there are some extremely influential journals in the fields of environmental science, ecological economy, engineering and energy economy. For example, the Journal of Cleaner Production has published many highly cited papers on inter-regional economic development and carbon emission differences (Xu and Lin, 2016; Khan and Jian, 2019) [25,26]. The Energy Policy and the Energy Economics, two journals in the field of energy economy, have also published many highly cited papers about the impact of regional economic development on carbon emissions [4]. Dong and Hochman (2018) used the panel data of 128 countries to analyze the relationship among inter-regional carbon emissions, economic and population development, and renewable energy sources [27]. Zheng, Mi and Wang (2019) used the factor index decomposition method to study the inter-regional economic and social development factors of China on carbon emissions, and discussed it at regional and national levels [28]. To sum up, scholars in the research field of regional carbon emissions have studied similar scientific problems by using different discipline research methods (Table 3).
Table 3.
The number of published papers and their impact factors of top 10 journals.
4. Result Analysis and Discussion
In this section, co-authorship analysis, co-citation analysis and keyword co-occurrence analysis are used to analyze the hotspots and frontier research trends in this research field. Co-authorship analysis is a method to determine the cooperation network of many authors around the world [10], thus investigating cooperation among countries, institutions and individuals in regional carbon emissions. Co-citation analysis establishes the mapping structure to determine the relationship among journals, authors and literature in a specific research field. At the end of this section, the hotspots and frontier problems in the research field are determined by investigating the keywords of the paper.
4.1. Co-Authorship Analysis
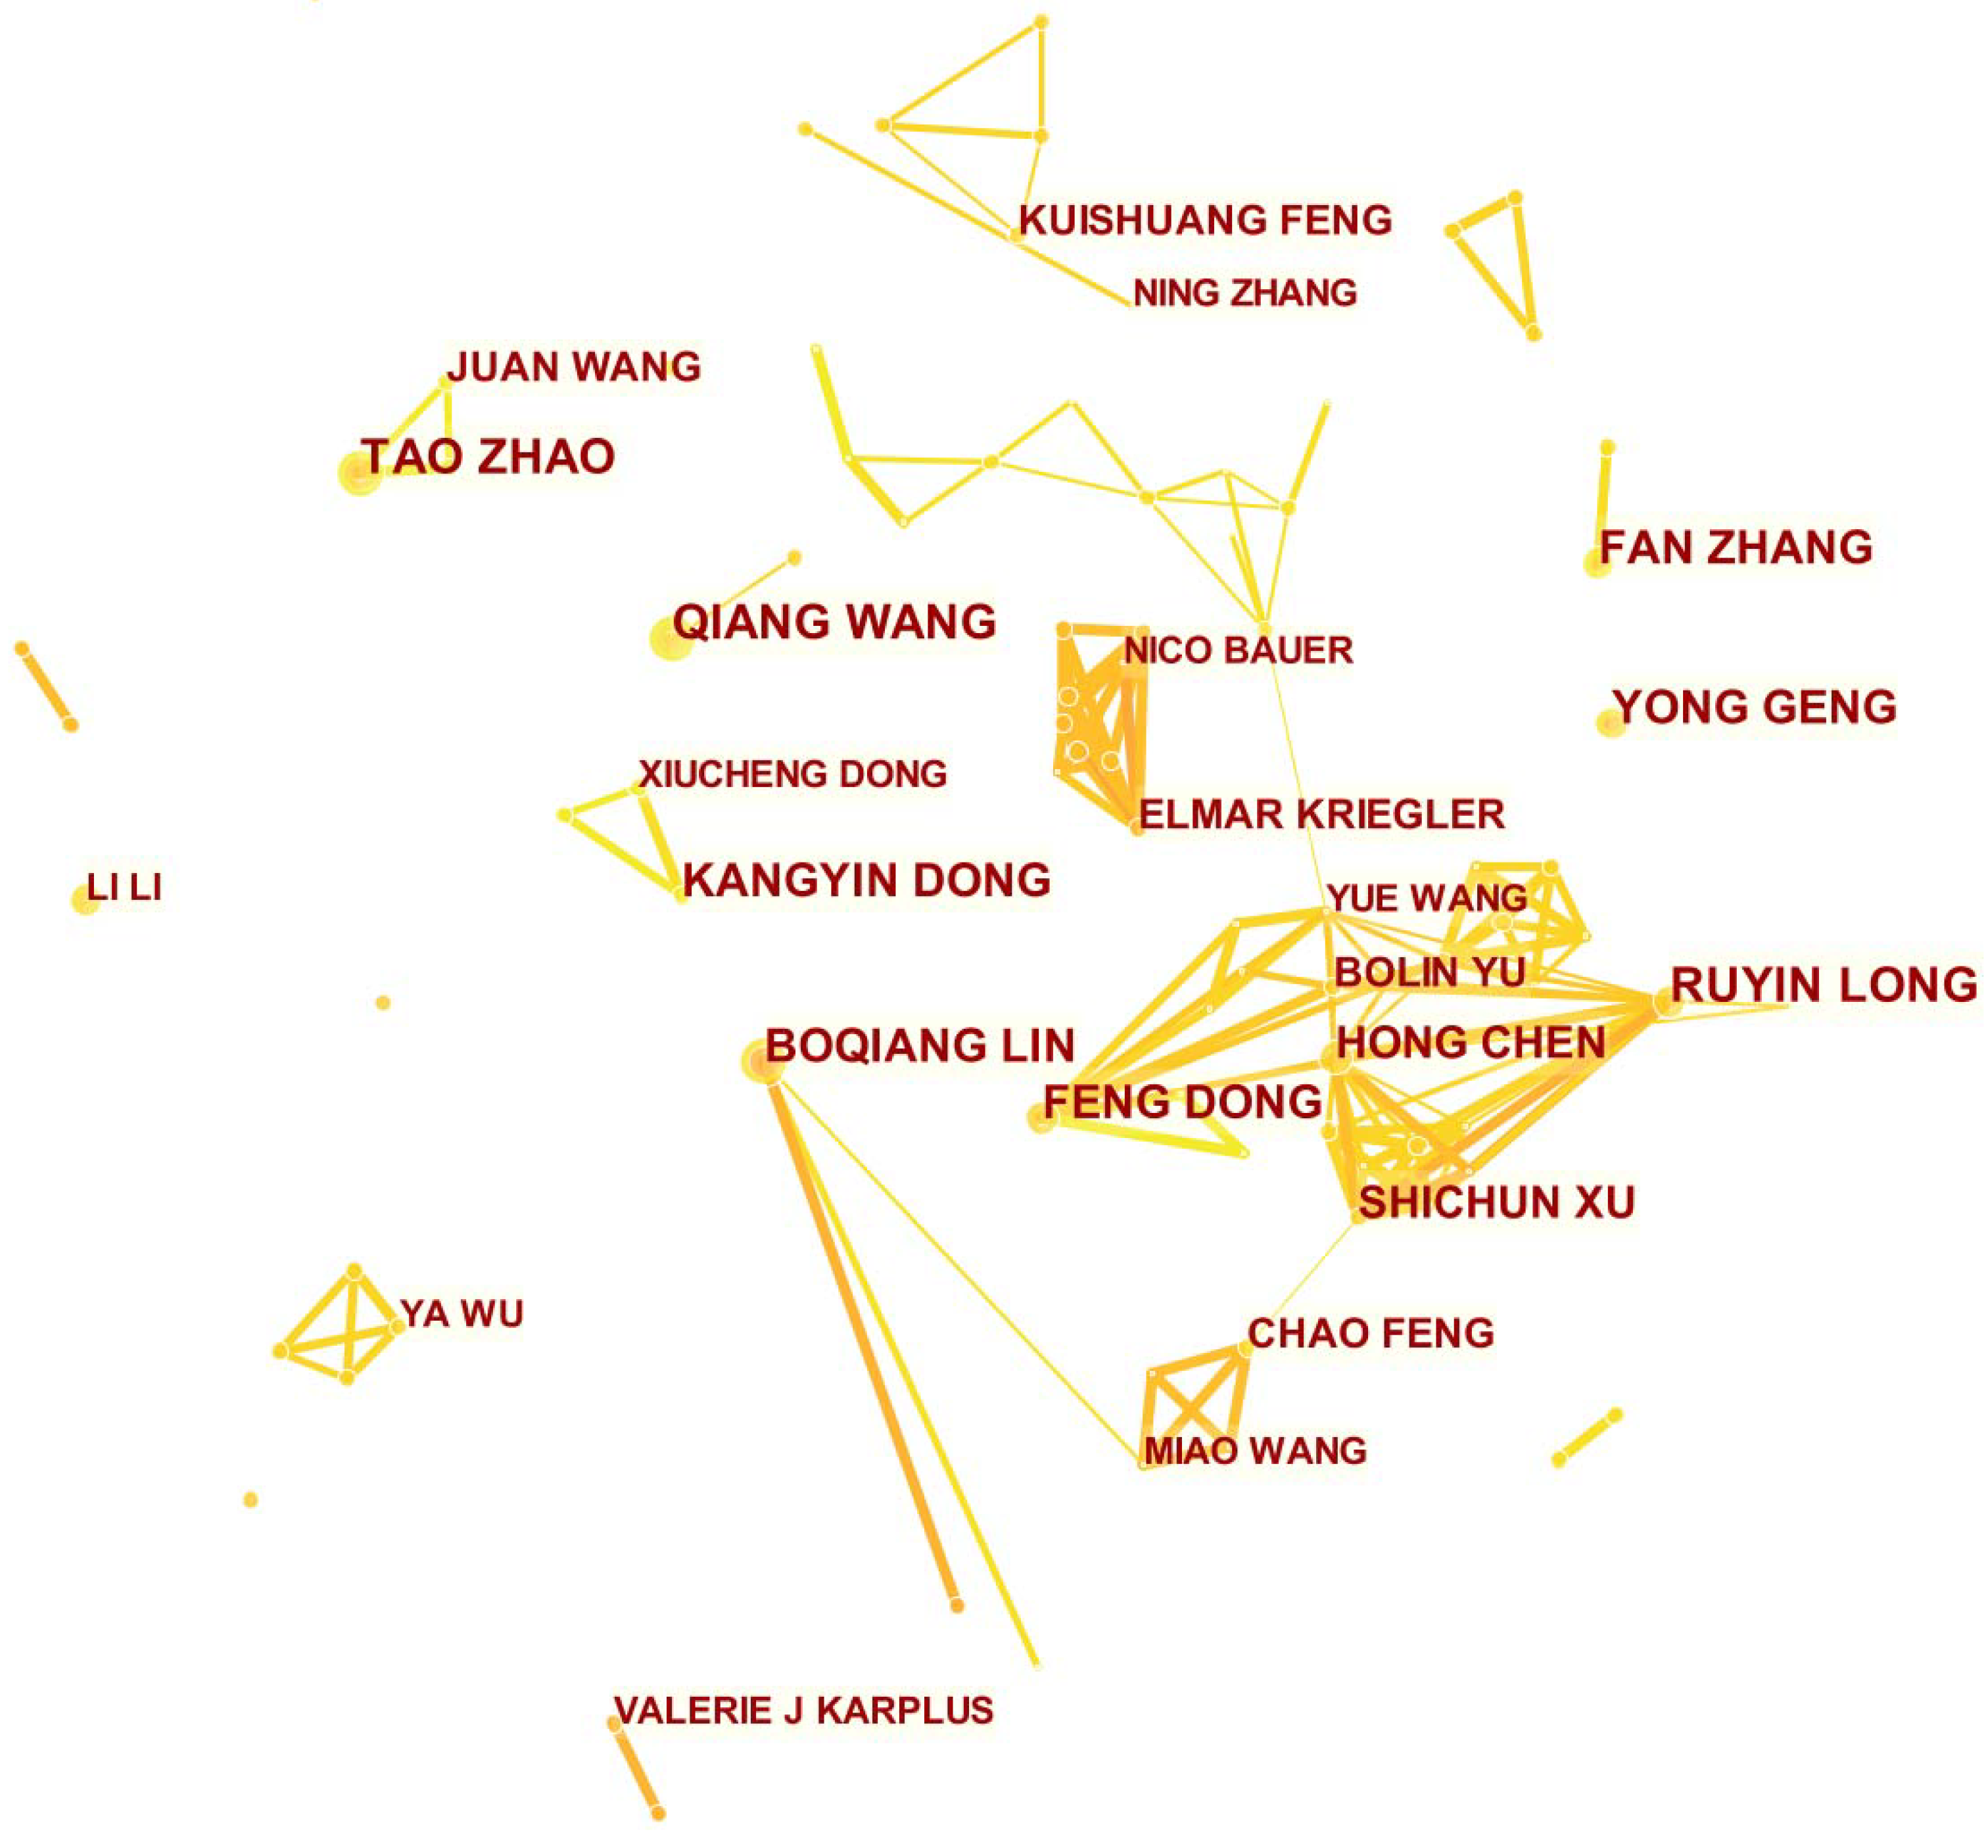
Research collaboration among the researchers was evaluated, as illustrated in Figure 7. The size of a node represents the number of literatures, while the link thickness between two nodes represents the degree of collaboration [1]. There are some isolated sub-networks, which indicates some research groups. As shown in the figure, the sub-network led by Long Ruyin is the largest research group, consisting of 15 nodes. The research direction of the group led by Long Ruyin is mainly the decomposition of impact factors related to carbon emissions and topics related to energy, industry and carbon emission reduction achieved by technical progress. Other authors who have published more than 10 papers include Zhao Tao, Wang Qiang, Geng Yong, Lin Boqiang, Dong Feng, Zhang Fan and Dong Kangyin. Although Elmar Kriegler has only published seven papers, he and the group cooperating with him are the second-largest sub-network consisting of nine nodes, and mainly focus on the research of topics related to climate change policies and carbon emissions in the energy market. It can be seen that, at present, relatively stable research groups have been established in this field and that the cooperation between the groups is not close, which may be caused by the rather wide fields involved in regional economy and carbon emission reduction and the different research directions of individual groups.

Figure 7.
Author co-authorship analysis network map.
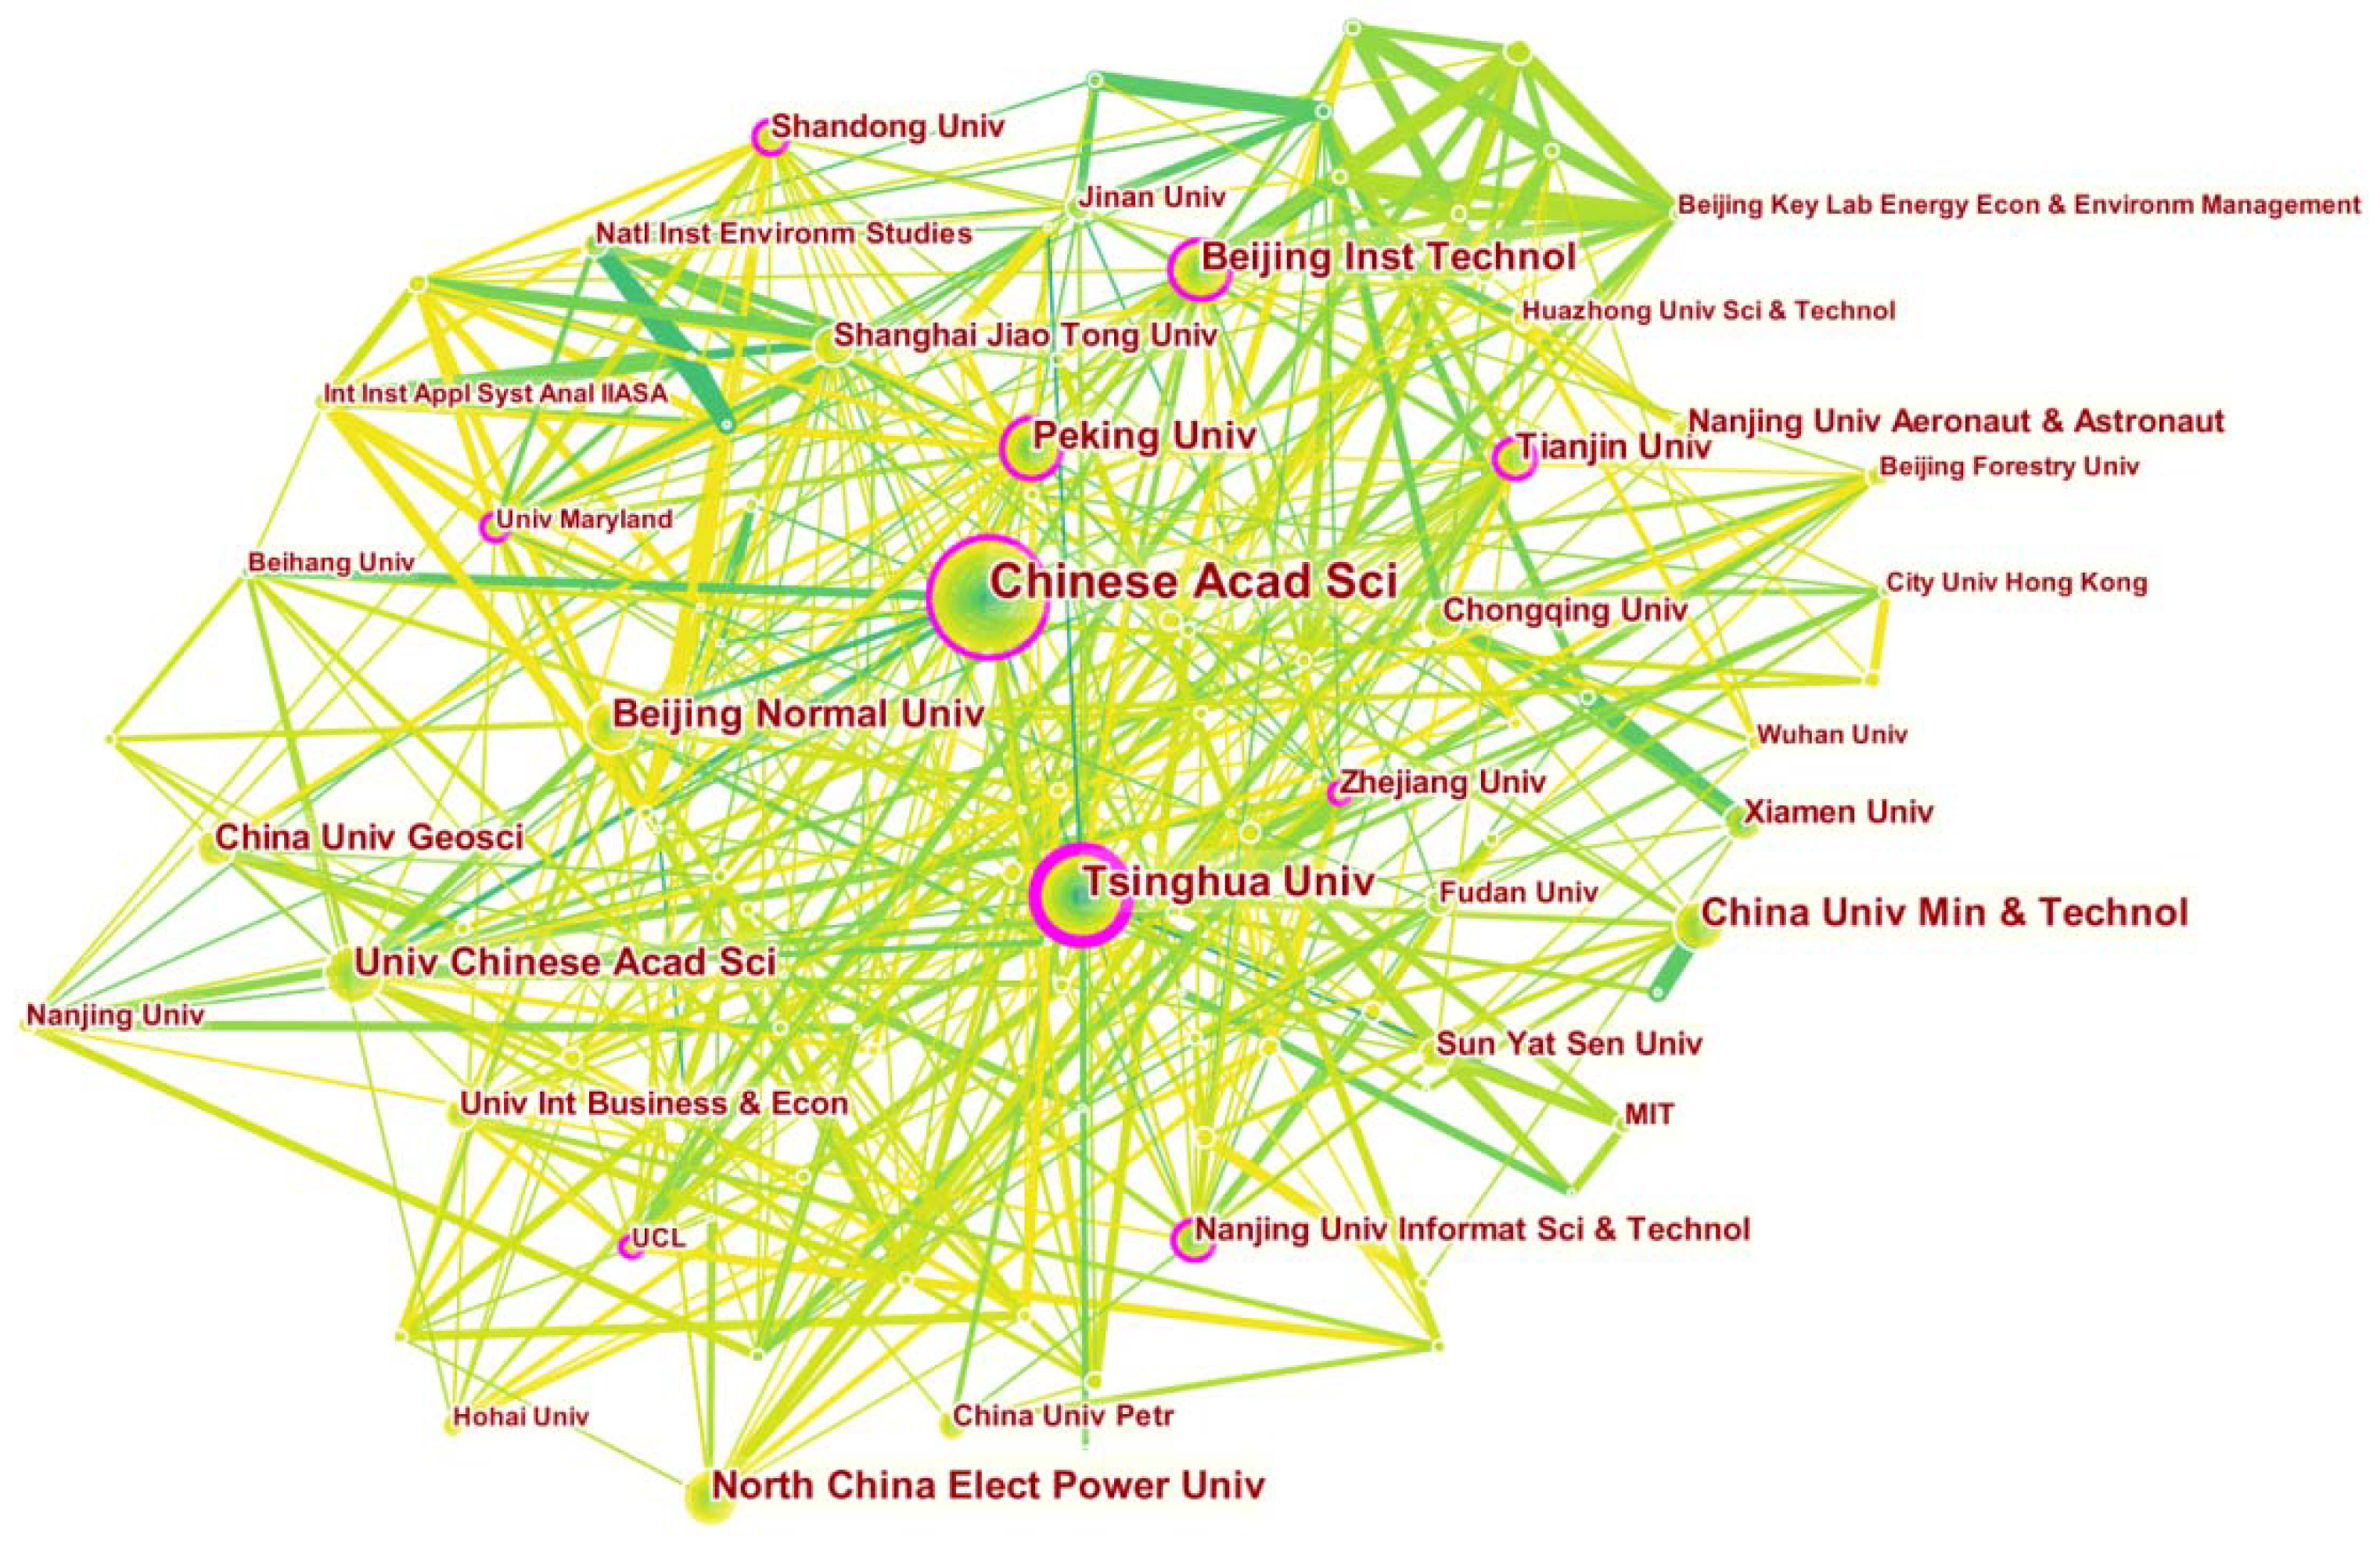
CiteSpace is used to draw a diagram indicating academic cooperation in regional carbon emissions between different institutions. The visualized network is illustrated in Figure 8. Similar to co-authorship analysis, the size of a node represents the number of published papers of an institution, and the distance between nodes represents the cooperation scope between institutions. The institutions that have published 10 or more papers are highlighted. It can be seen from the number and strength of the lines connecting nodes that some institutions have more cooperation with other institutions, such as Tsinghua University, Peking University, Shanghai Jiao Tong University and Shandong University. The link strength in the whole network and sub-network shows that cooperation between different institutions at the internal and internal sub-network level is sufficient. It can be seen that a research institution not only focuses on cooperation with institutions in its own country but also keeps in touch with universities and institutions in other countries. For example, the Chinese Academy of Sciences not only keeps close contact with Chinese universities such as Tsinghua University, Peking University and Beijing Institute of Technology, but also maintains a cooperative relationship with internationally renowned universities such as the National University of Singapore, Massachusetts Institute of Technology (MIT) and University College London (UCL). From the perspective of research content, the research of institutions such as the Chinese Academy of Sciences, Tsinghua University, and the University of Chinese Academy of Sciences mainly focuses on low-carbon development, energy efficiency, carbon emission reduction path and climate change, and the research of institutions such as Xiamen University and Chongqing University mainly focuses on regional economy and clean energy.
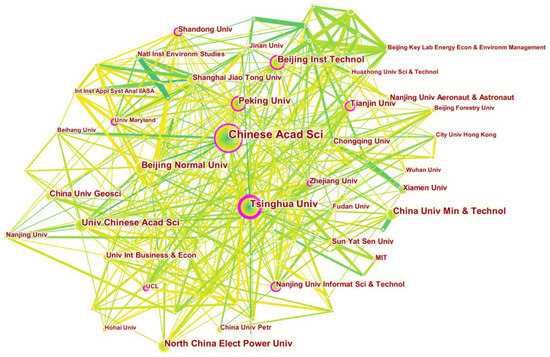
Figure 8.
Institution co-authorship analysis network map.
Table 4 lists the top 20 most prolific institutions according to the number of published papers. It can be seen that the Chinese Academy of Sciences ranks first with 108 research papers, followed by Tsinghua University (55), University of Chinese Academy of Sciences (41) and Beijing Institute of Technology (41). The Chinese Academy of Sciences and Tsinghua University are also the top two in terms of centrality, indicating that they are key nodes in the institutional cooperation network.
Table 4.
Top 20 active institutions of regional economy and carbon emissions-related papers.
The top 20 institutions have published 649 papers, accounting for 45.7% of the total number of published papers (1421). The core research strength in this field mainly comes from Chinese institutions. The Chinese institutions and universities have showed capabilities in R&D skills and profound research in the field of regional economics and carbon emissions.
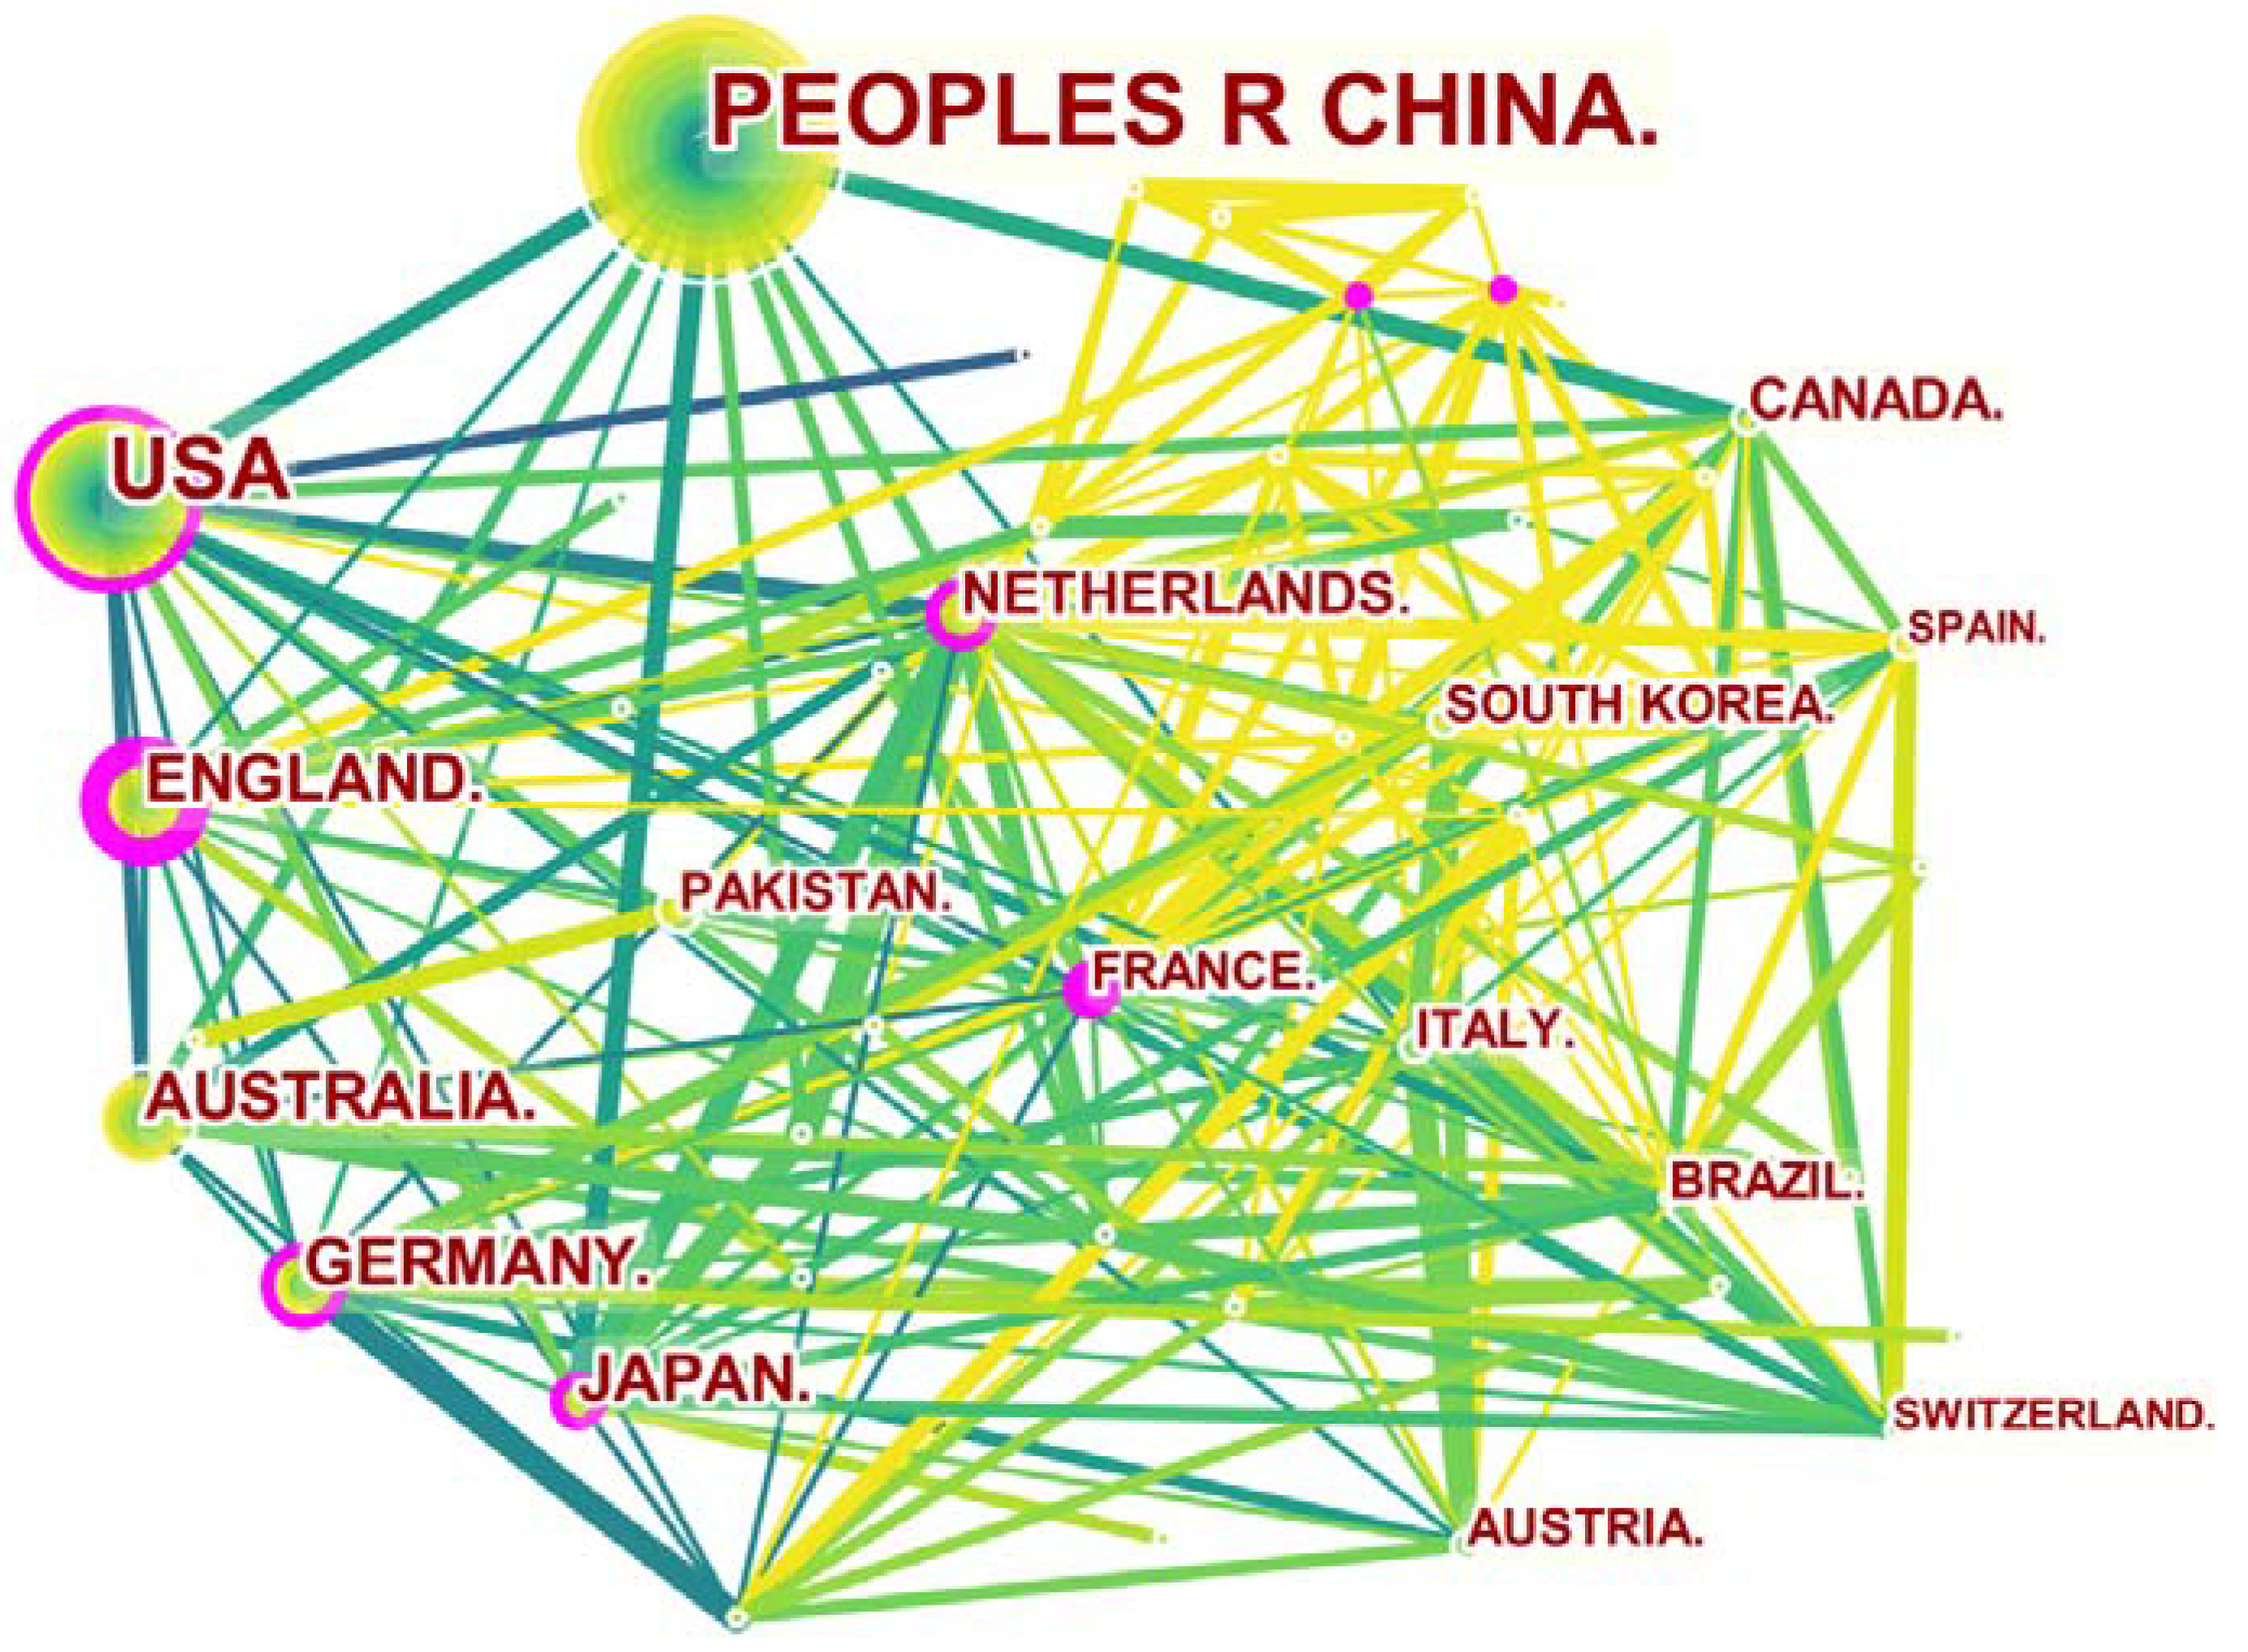
The country co-authorship analysis network for relevant research papers is illustrated in Figure 9, which indicates the cooperation of different countries in this research field. The purple circle around a node represents the high centrality of the country, which indicates that the country acts as a connection point that connects other countries in the network. The larger the purple circle is, the larger the centrality of the country in the visualized map will be. There are eight countries that have purple circles around their nodes, including China (856), the United States (256) and the United Kingdom (88), which indicates that such countries have played a key role in cooperation with other countries.

Figure 9.
Country co-authorship analysis network map.
Table 5 lists the countries that have published 20 or more papers respectively. The cooperation network consists of all relatively concentrated cooperative countries. The top 20 influential countries according to the number of published research papers are shown in Table 5. It can be seen that China and the United States have made great efforts in the research of regional carbon emissions. From the perspective of the number of published basic research papers, the research on regional carbon emissions of China is far ahead of other countries in the world, but China still has to strengthen its cooperation with other countries. Carbon emission reduction is a global goal, which requires China to strengthen its cooperation at the national level.
Table 5.
Top 20 influential countries of regional economics and carbon emissions related papers.
4.2. Co-Citation Analysis
When a paper cites two or more authors or journals, we can say that these disciplines have a co-citation relationship [29]. Generally, three basic types of co-citation analysis are used to identify the relationship and mapping structure among authors, articles and journals. Co-citation analysis establishes a mapping structure to monitor the scientific research field, thus determining the degree of association of journals, authors and articles [30].
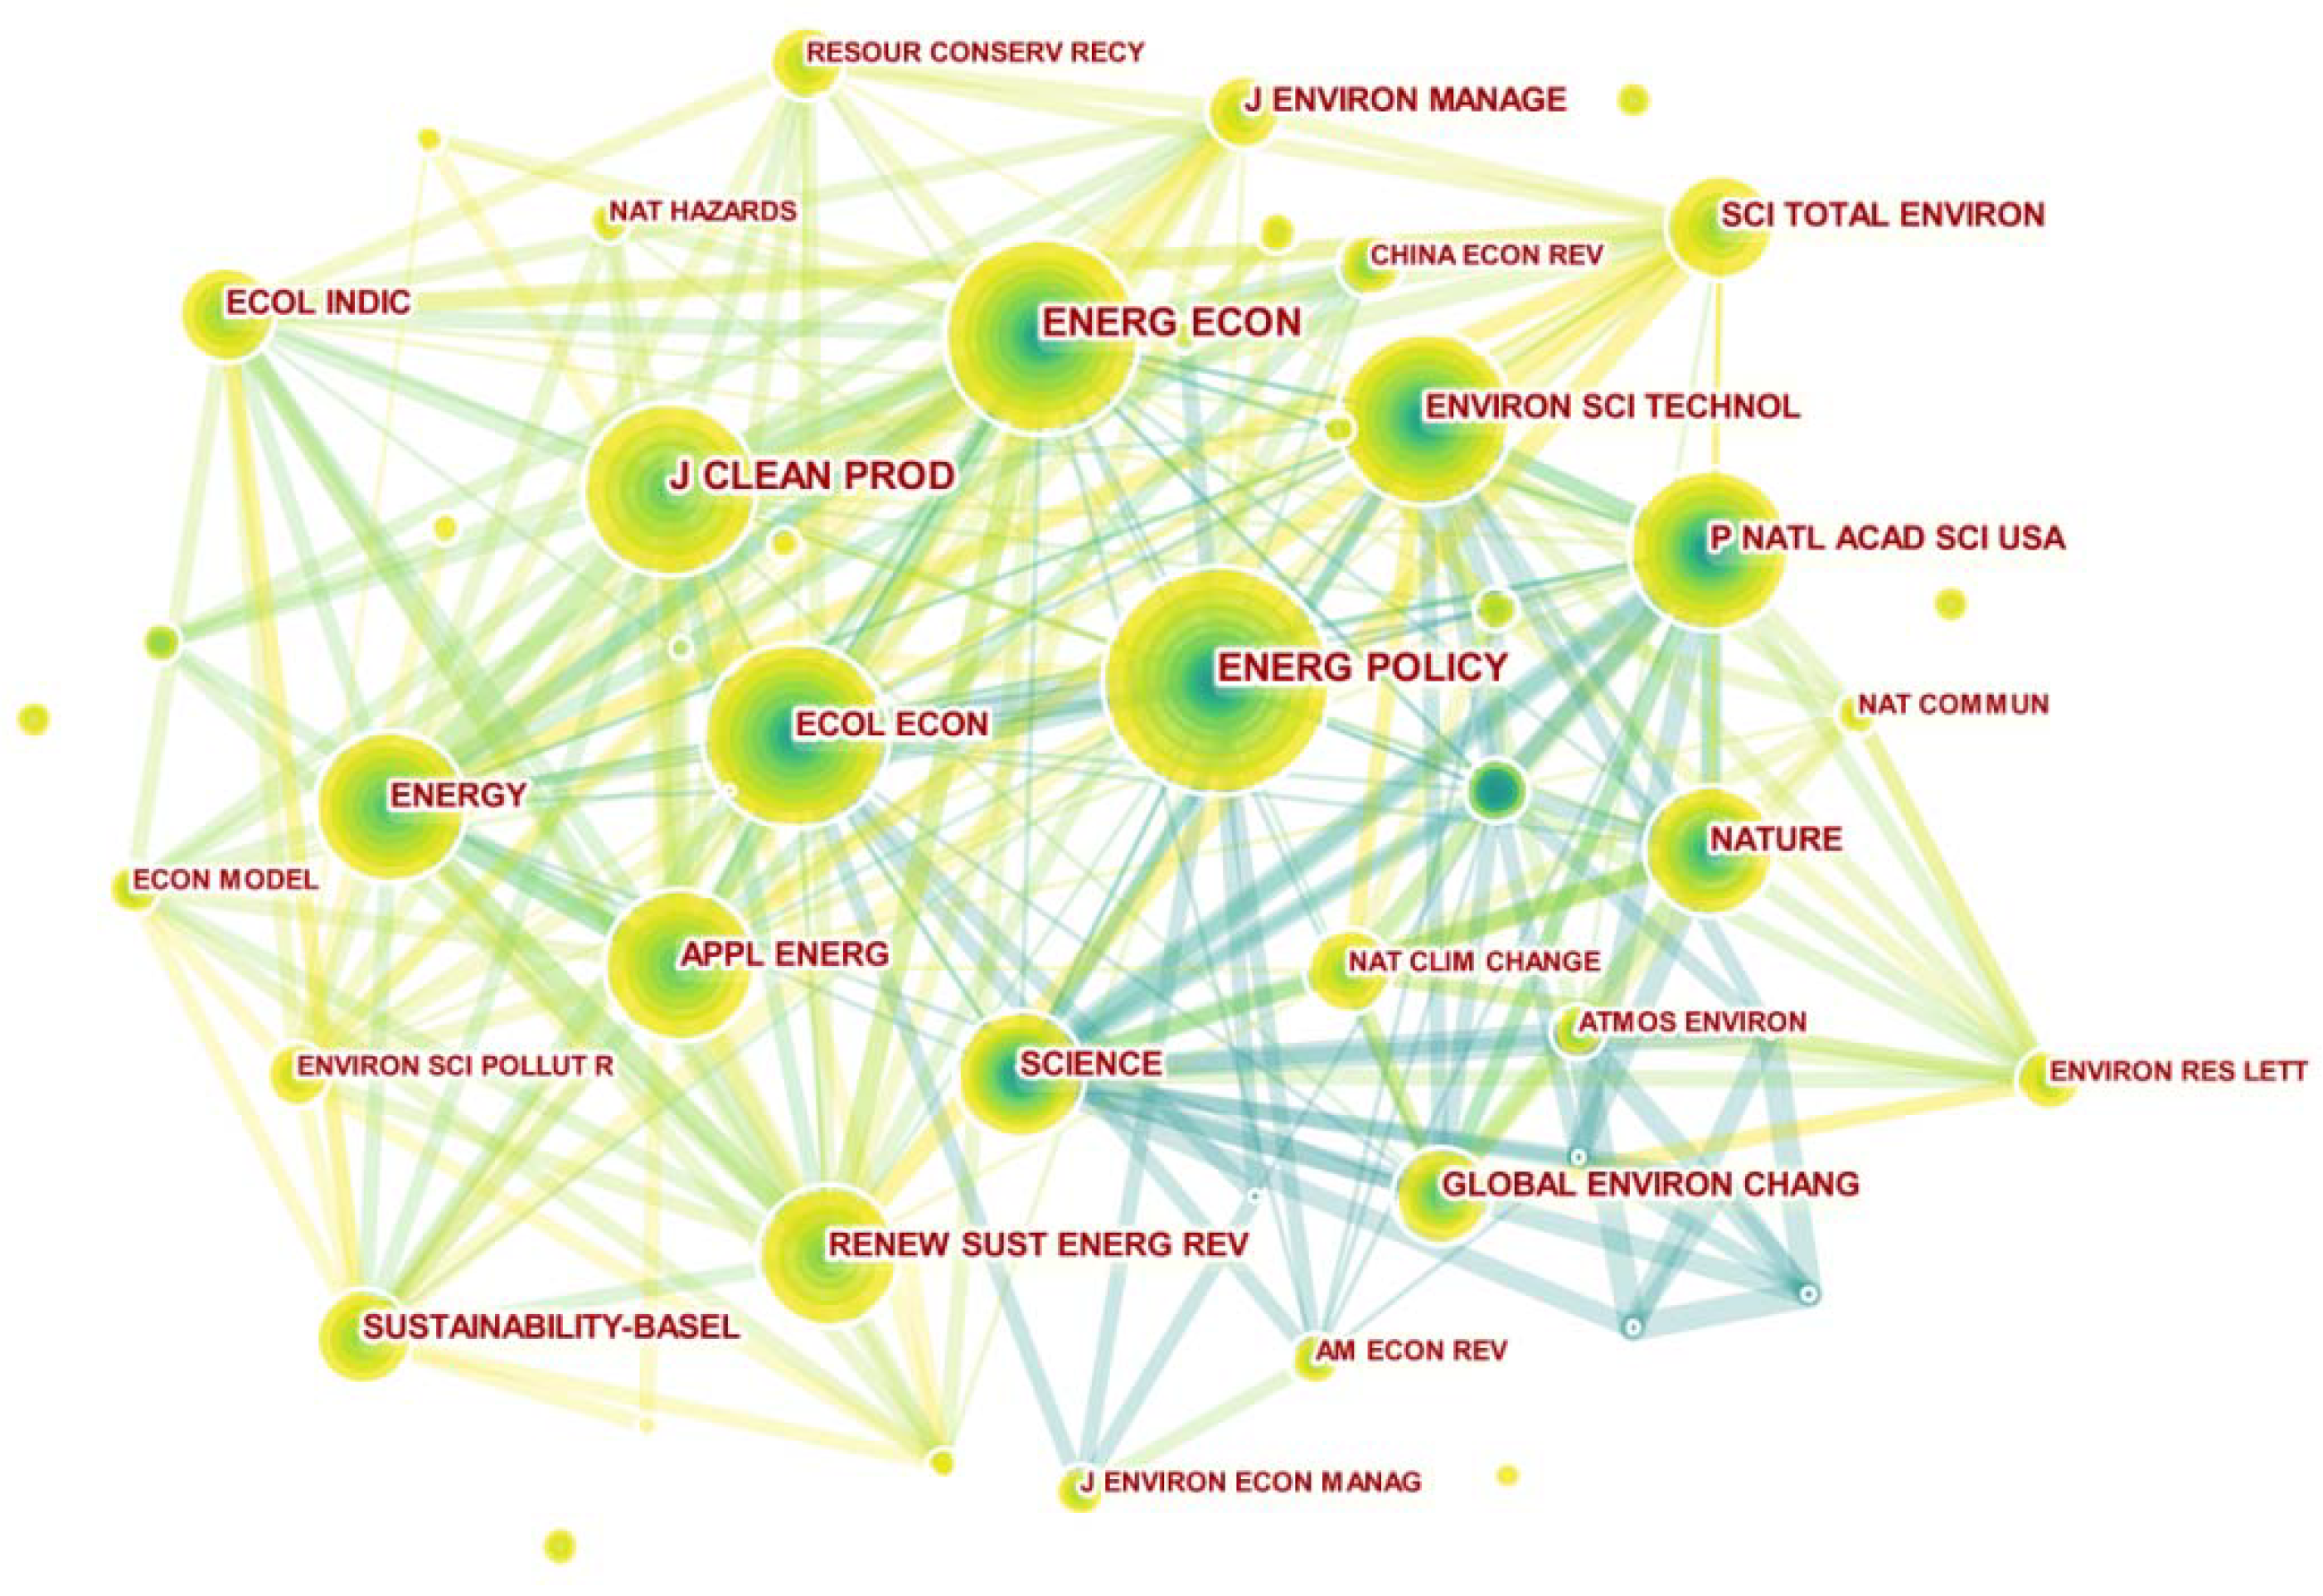
Journal co-citation analysis is usually used to determine the structure of a research field [10,31]. When at least one research paper in each of two journals is cited in another paper, such two journals are co-cited [32]. The journal co-citation network is illustrated in Figure 10, every node represents a journal, and links between nodes indicates the co-citation relationship between literature. The larger the node is, the higher the degree of citation of the journal will be. In Figure 10, the journals with more than 120 citations are highlighted. An extensive network with closed links indicates that the journal co-citation relationship is close, including the Journal of Clean Production, Energy Policy, Energy Economics and Ecology Economics.

Figure 10.
Journal co-citation analysis network map.
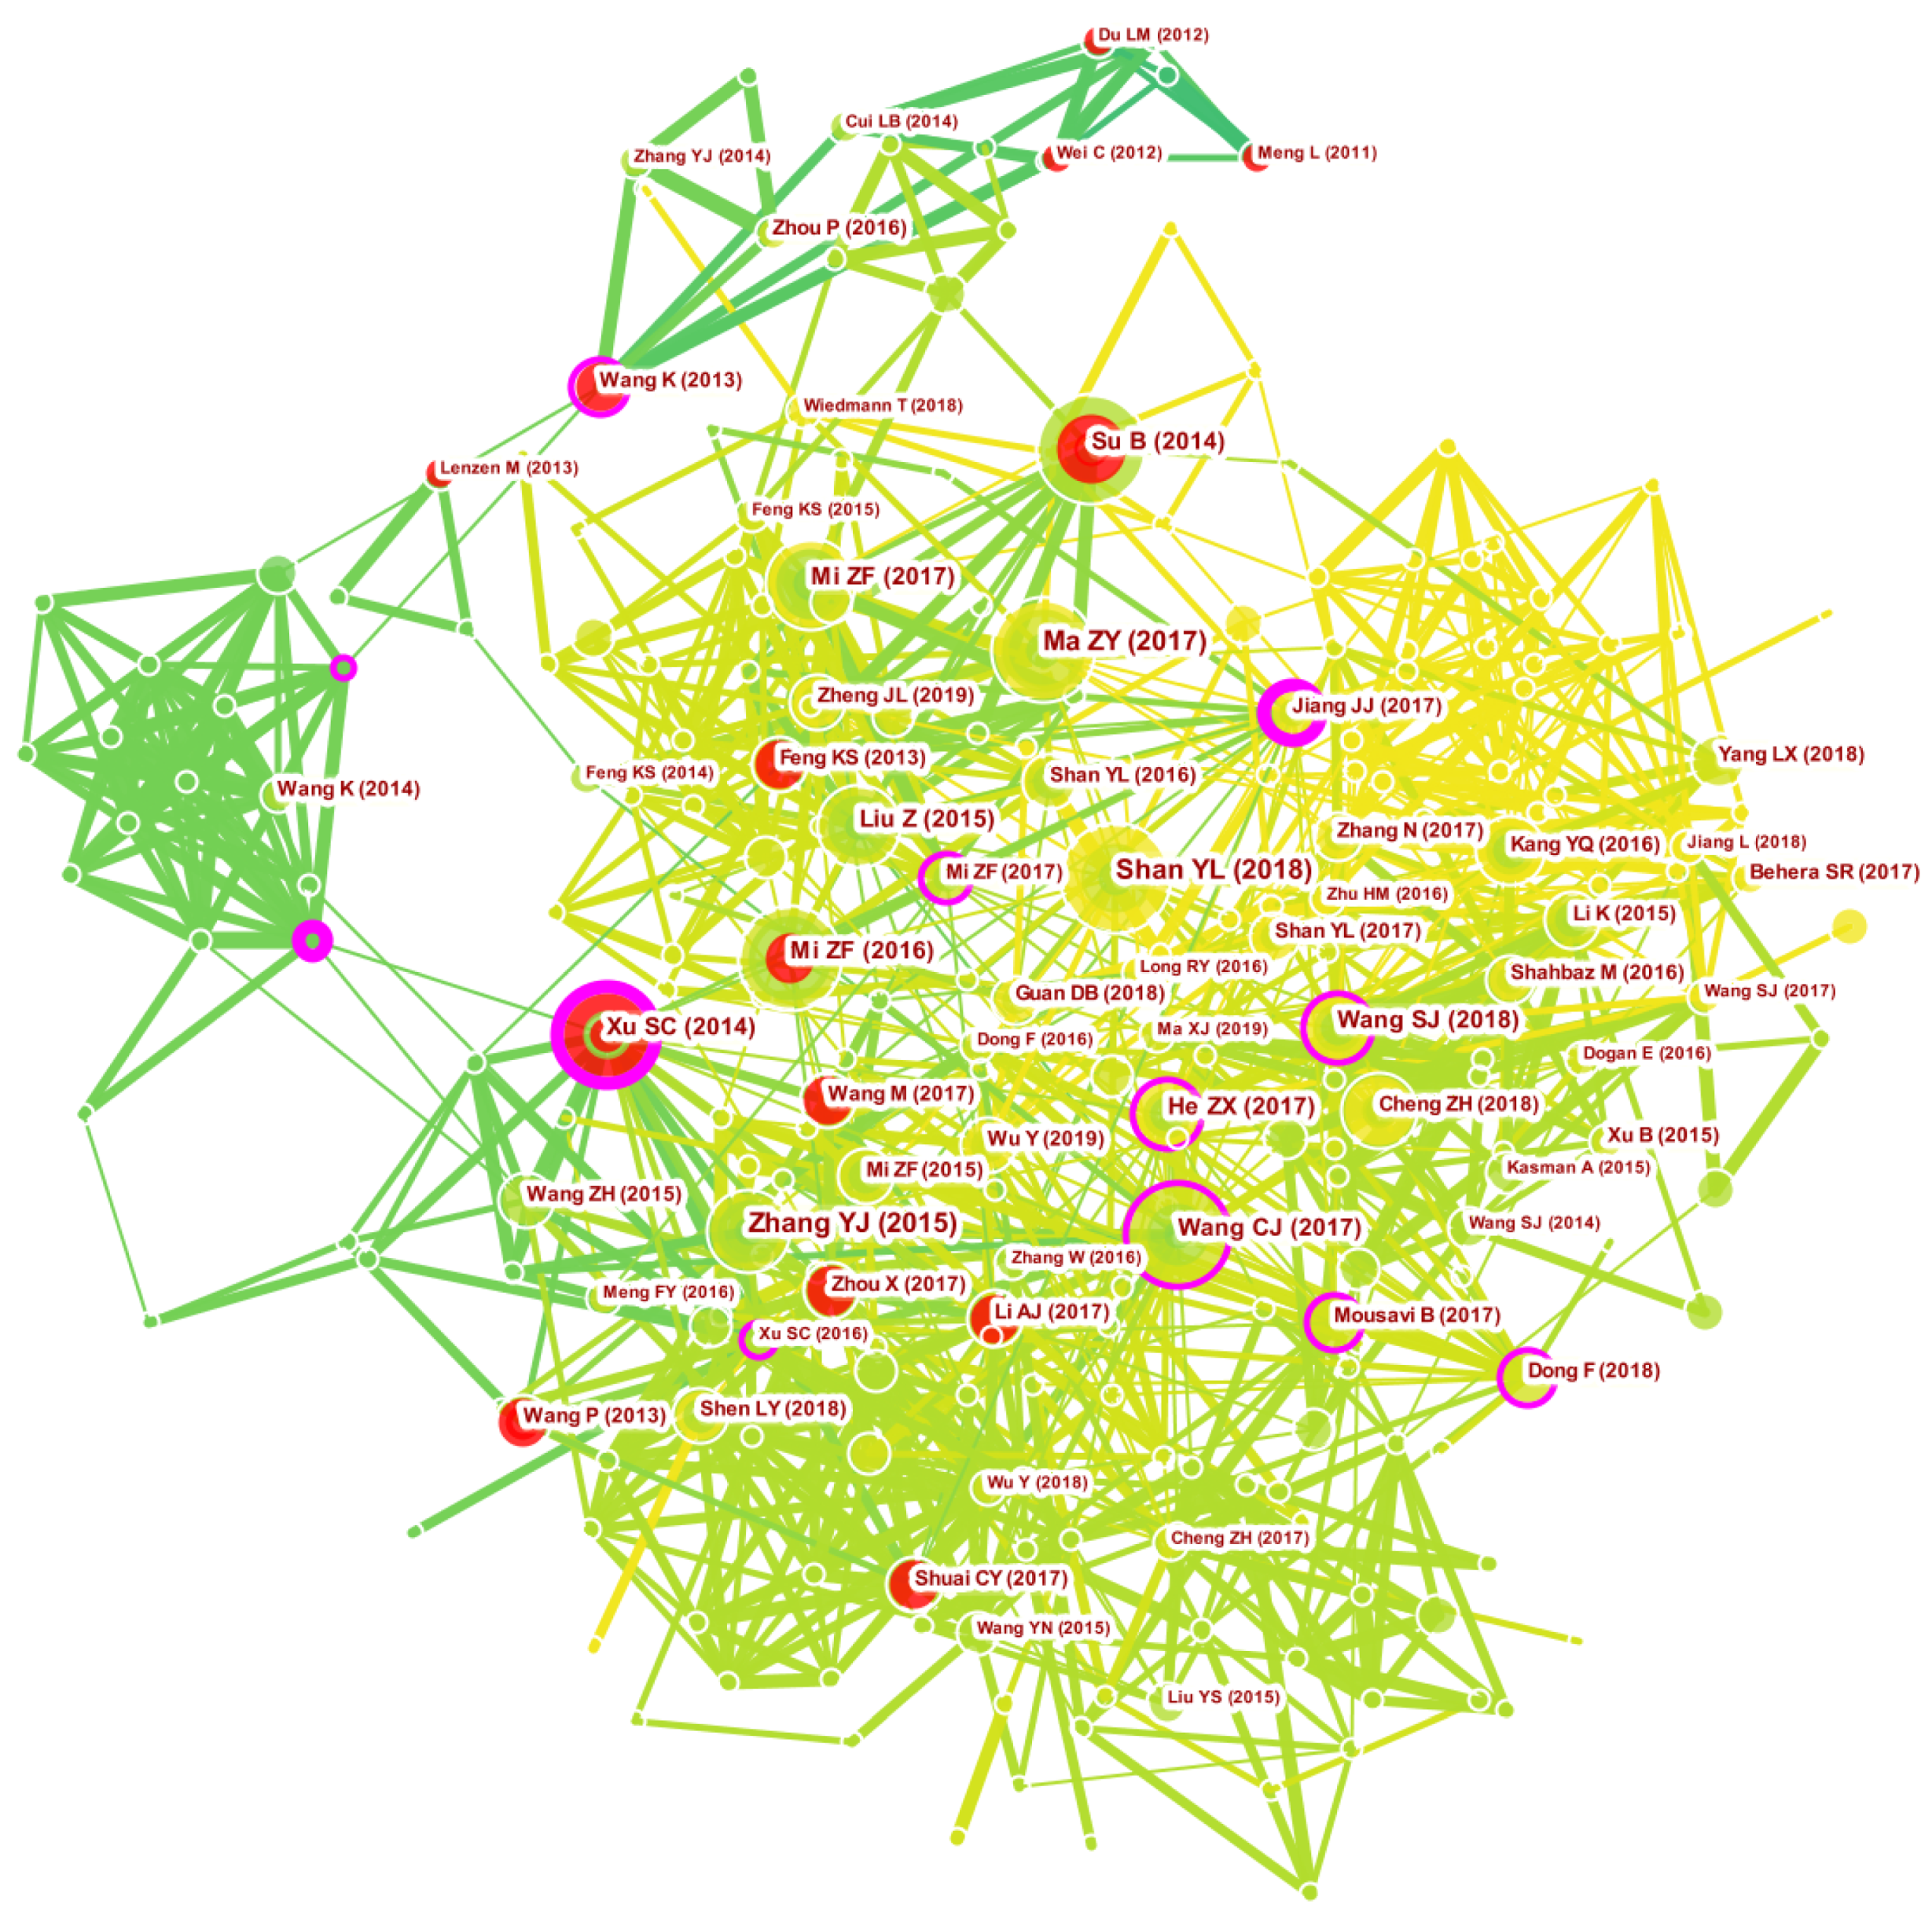
Documents are the main component of a knowledge base or database. Document co-citation analysis is to evaluate the evolution and mapping of any research field [33]. Figure 11 is a visualized network of the cited documents, in which only the documents that are cited 10 times or more are marked. The figure indicates such information as the first author, the publication year and the DOI of the cited document. The greater the links between the nodes are, the higher the co-citation frequency of the document will be.
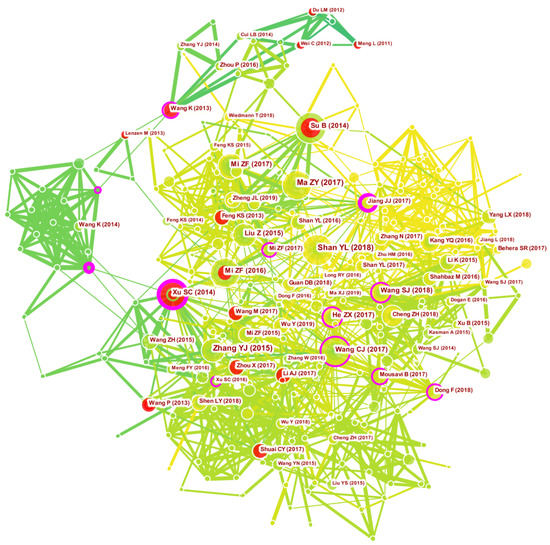
Figure 11.
Document co-citation analysis network map.
Among the literature samples, the most cited documents are Shan YL, 2018, and Zhang YJ, 2015. Accordingly, these two authors are the most cited authors. Document co-citation analysis is helpful to determine the highly cited documents and important research documents and to form the knowledge database of this research field.
Author co-citation analysis is a necessary tool to determine the most prolific authors and check the distribution of highly cited authors. Figure 12 illustrates an author co-citation analysis for regional economics and carbon emissions related discipline. The larger the node, the greater the number of citations of the author will be, therefore the more important the author will be.
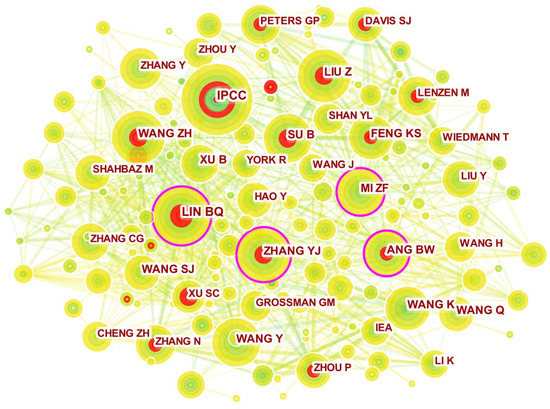
Figure 12.
Author co-citation analysis network map.
Similarly, the smaller the distance between nodes, the closer the research interests of these authors will be. In Figure 12, the authors with 55 or more citations are highlighted. The largest node is IPCC with 184 co-citations, followed by Lin Boqiang, the second most prolific author with 183 co-citations.
The top 20 highly cited authors are ranked according to the citation times of their publications. Such information, together with the number of citations and the centrality, is provided in Table 6. These statistical data show that the work of the above-mentioned authors has made important contributions to the relevant research on regional carbon emissions.
Table 6.
Top 20 active cited authors of regional economy and carbon emissions-related research papers.
4.3. Keywords Co-Occurrence Analysis
Keywords are important information reflecting the research topics and hotspots of the paper, and represent the core content of the research paper. The investigation of knowledge mapping and burst keywords based on keyword co-occurrence can determine the hotspot research field and frontier research topics. Burst keywords are those keywords that have been widely quoted in a certain period of time [34]. In this section, Citespace and VOSviewer are used to conduct co-occurrence, burst and cluster analysis of keywords. The frequency and centrality of keywords are described, and the development process and the frontier topics in the field of regional economy and carbon emissions.
4.3.1. Research Hotspot Topics
In this section, Citespace and VOSviewer are used, respectively, to analyze the keyword co-occurrence, as illustrated in Figure 13 and Figure 14. Nodes highlight the keywords, and the size of a node reflects the co-occurrence frequency of these keywords. It can be seen from Figure 13 and Table 7 that “carbon dioxide emission” has the highest frequency in the literature, i.e., 807 times, while other expressions with a word frequency of 100 times are “economic growth”, “energy consumption”, “impact”, “consumption”, “China”, “energy” and “climate change”. It can be seen that the research in this field pays high attention to carbon emission, economic development, energy and climate change, especially in the process of carbon peaking and carbon neutrality in China. Energy consumption is an important aspect of reducing carbon emissions and addressing climate change. Traditional energy consumption, which mainly depends on coal, will worsen the climate environment. Therefore, changing the energy consumption structure and improving energy consumption efficiency are important ways to ensure economic development and achieve carbon emission constraints. From the perspective of keyword centrality, the keywords with a centrality of 0.1 or above, which is a rather high centrality, play an important role in the co-occurrence network. The rather high centrality of “economic growth”, “energy consumption”, “consumption” and “energy” further verifies that scholars attach great importance to research on energy consumption. Scholars can achieve sustainable economic development by exploring technological innovation and improving the energy consumption structure.
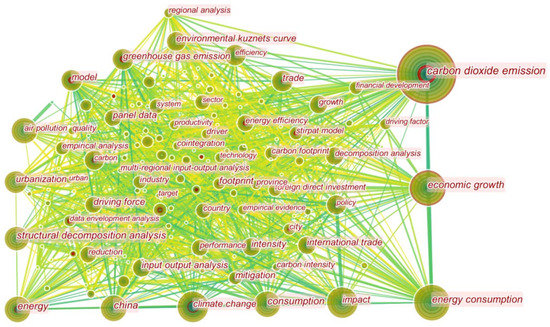
Figure 13.
Keyword co-occurrence analysis map by using Citespace.

Figure 14.
Keyword co-occurrence analysis map by using VOSviewer.
Table 7.
Top 40 keywords ranked by centrality and number of published papers in the field of regional economy and carbon emissions.
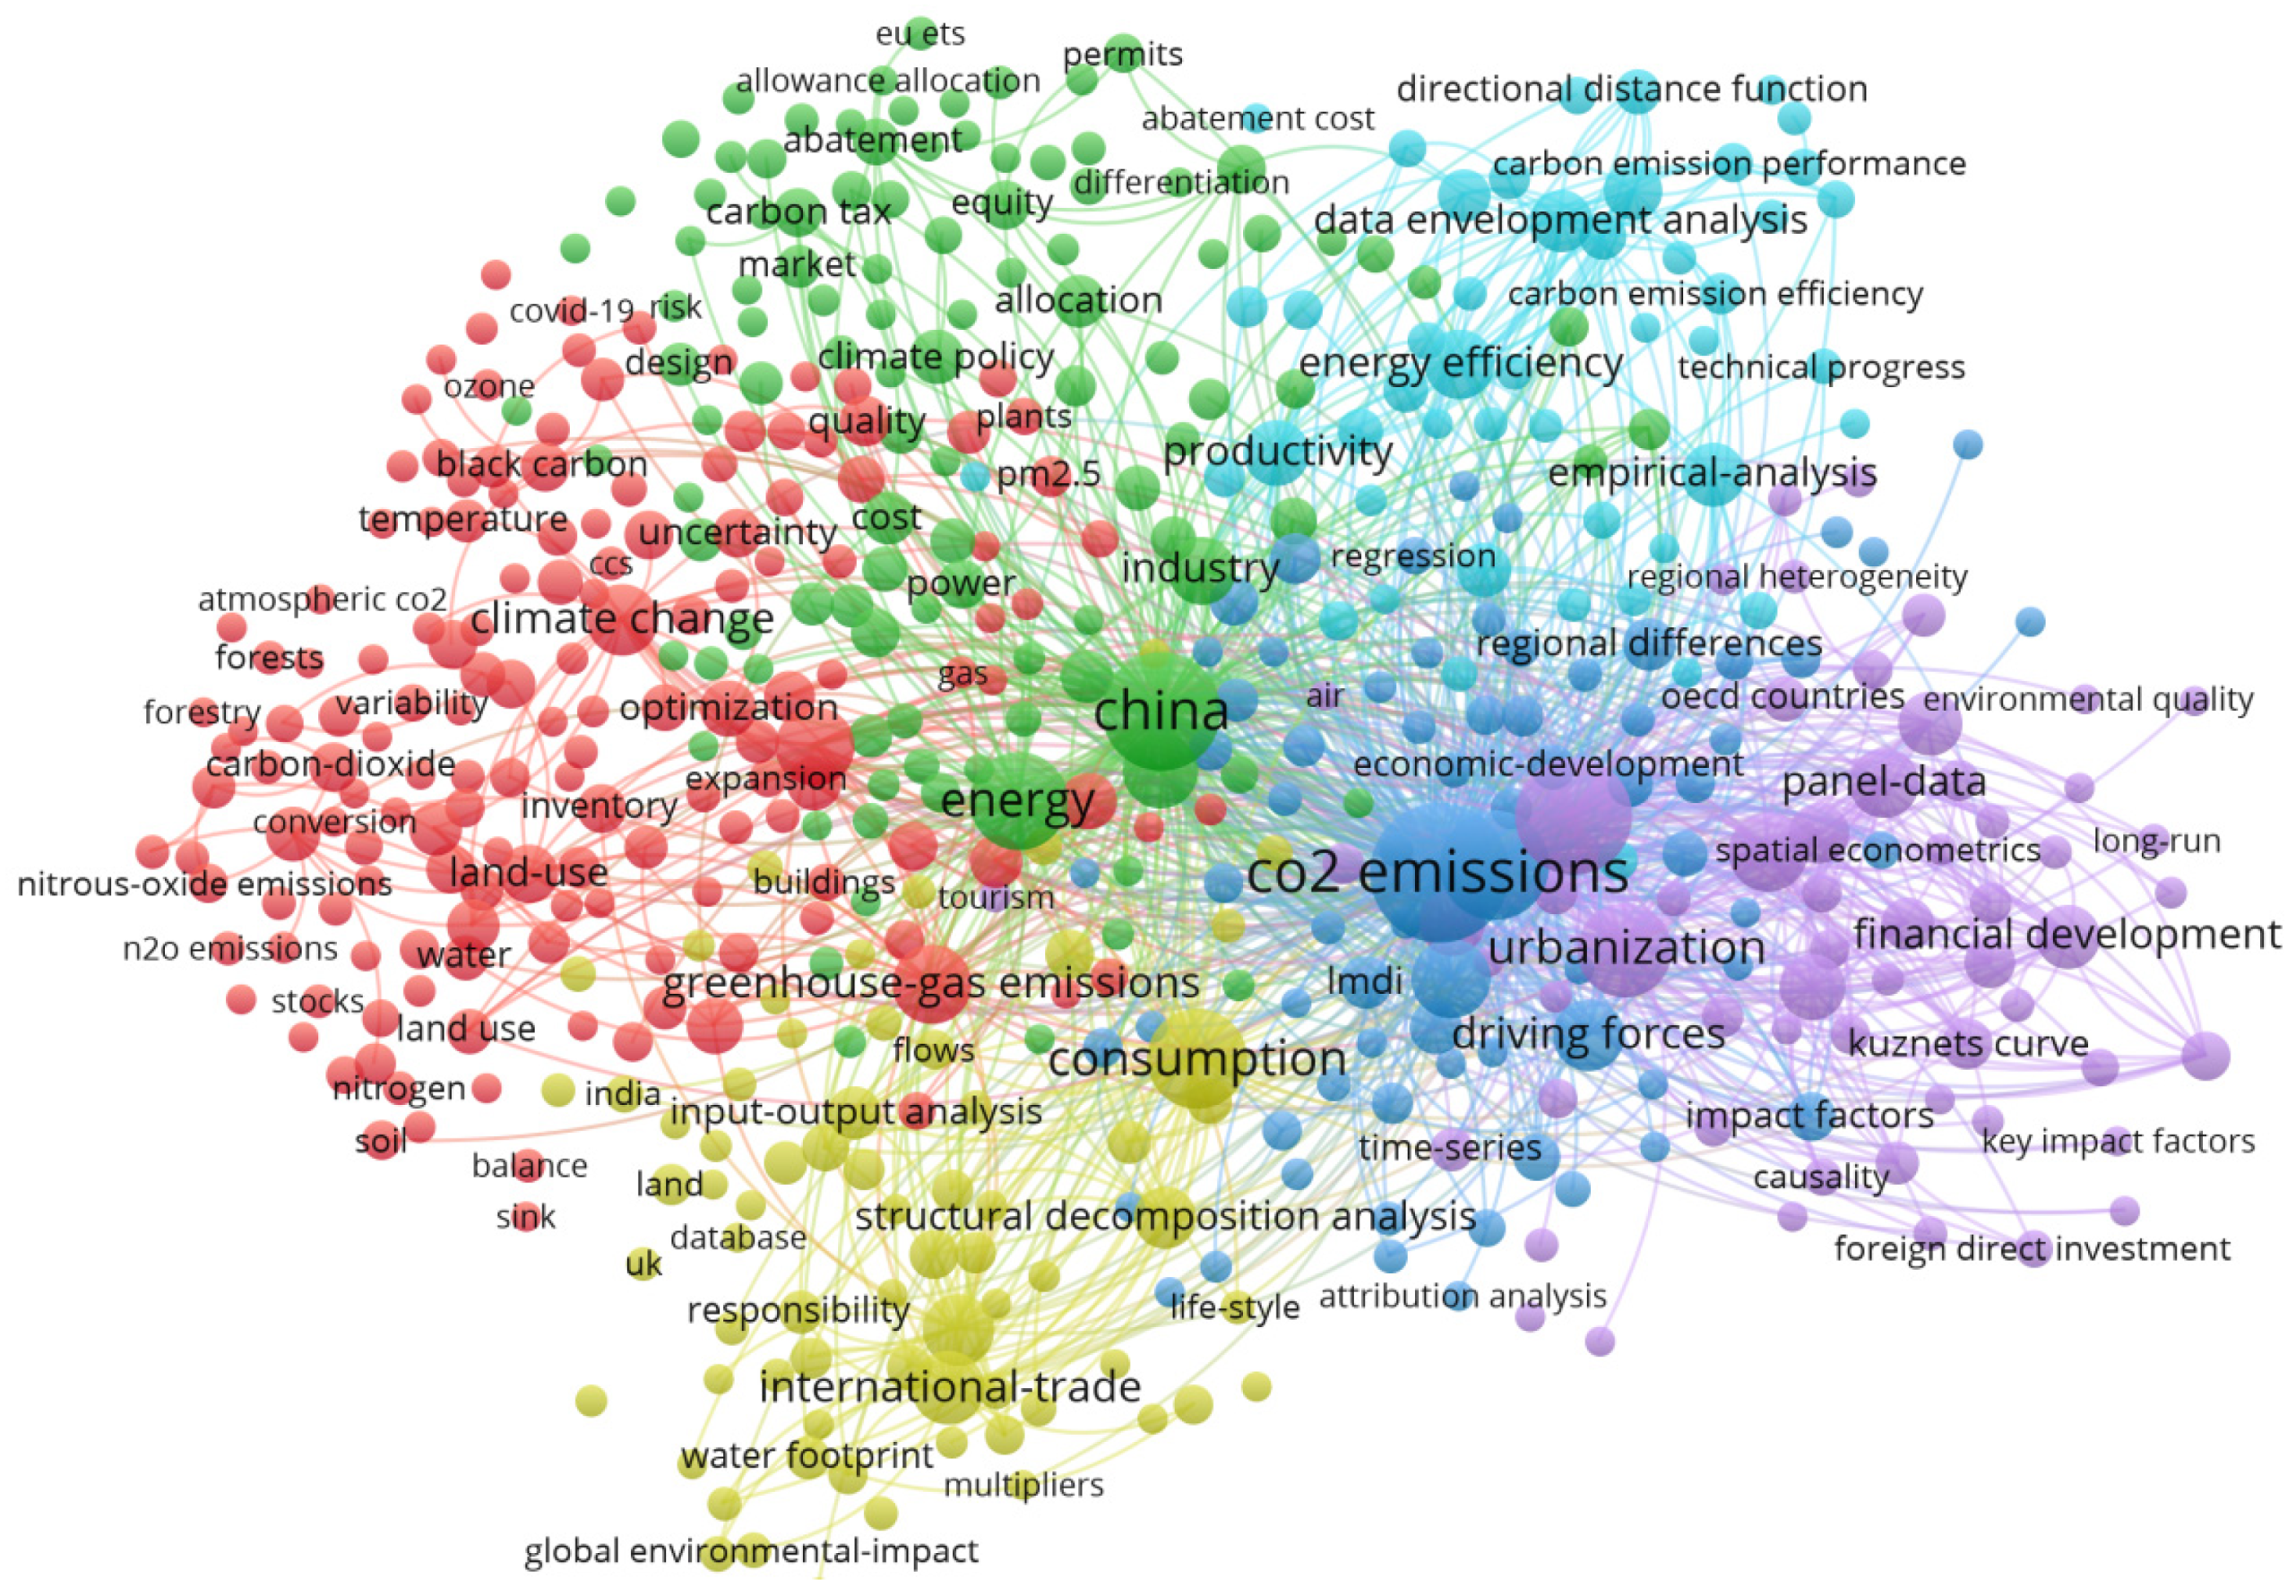
VOSviewer is used to conduct the co-occurrence analysis of keywords. It can be seen from Figure 14 that the keywords with a rather high occurrence frequency in the literature include “CO2 emission”, “China”, “energy”, “consumption”, “economic development”, “urbanization”, “industry” and “land use”, which are similar to the analysis results of Citespace. Carbon emission, energy consumption, economic development and industry are always the focus of attention for scholars. Since the industrial structure of China is dominated by industry, energy consumption is high and the energy consumption structure is dominated by coal, which causes high carbon emissions. Therefore, academic circles generally believe that the main challenge China faces is to achieve the goal of carbon peaking and carbon neutrality, while achieving substantial economic growth. As a developing country, China has a low ability to pay when compared with developed countries in Europe and America, which results in slow energy market reform progress and the backwardness of innovations in low-carbon technology and energy efficiency promotion technology. For a big country like China, regional development varies greatly. The method to coordinate the relationship between regional economics and carbon emissions, and to find a balance point between economic development and carbon emission reduction, is the key point of the next research stage. At present, most of the research is discussion at the macro level. In the future, it is necessary to increase research investment at the specific level of innovations in carbon emission technology.
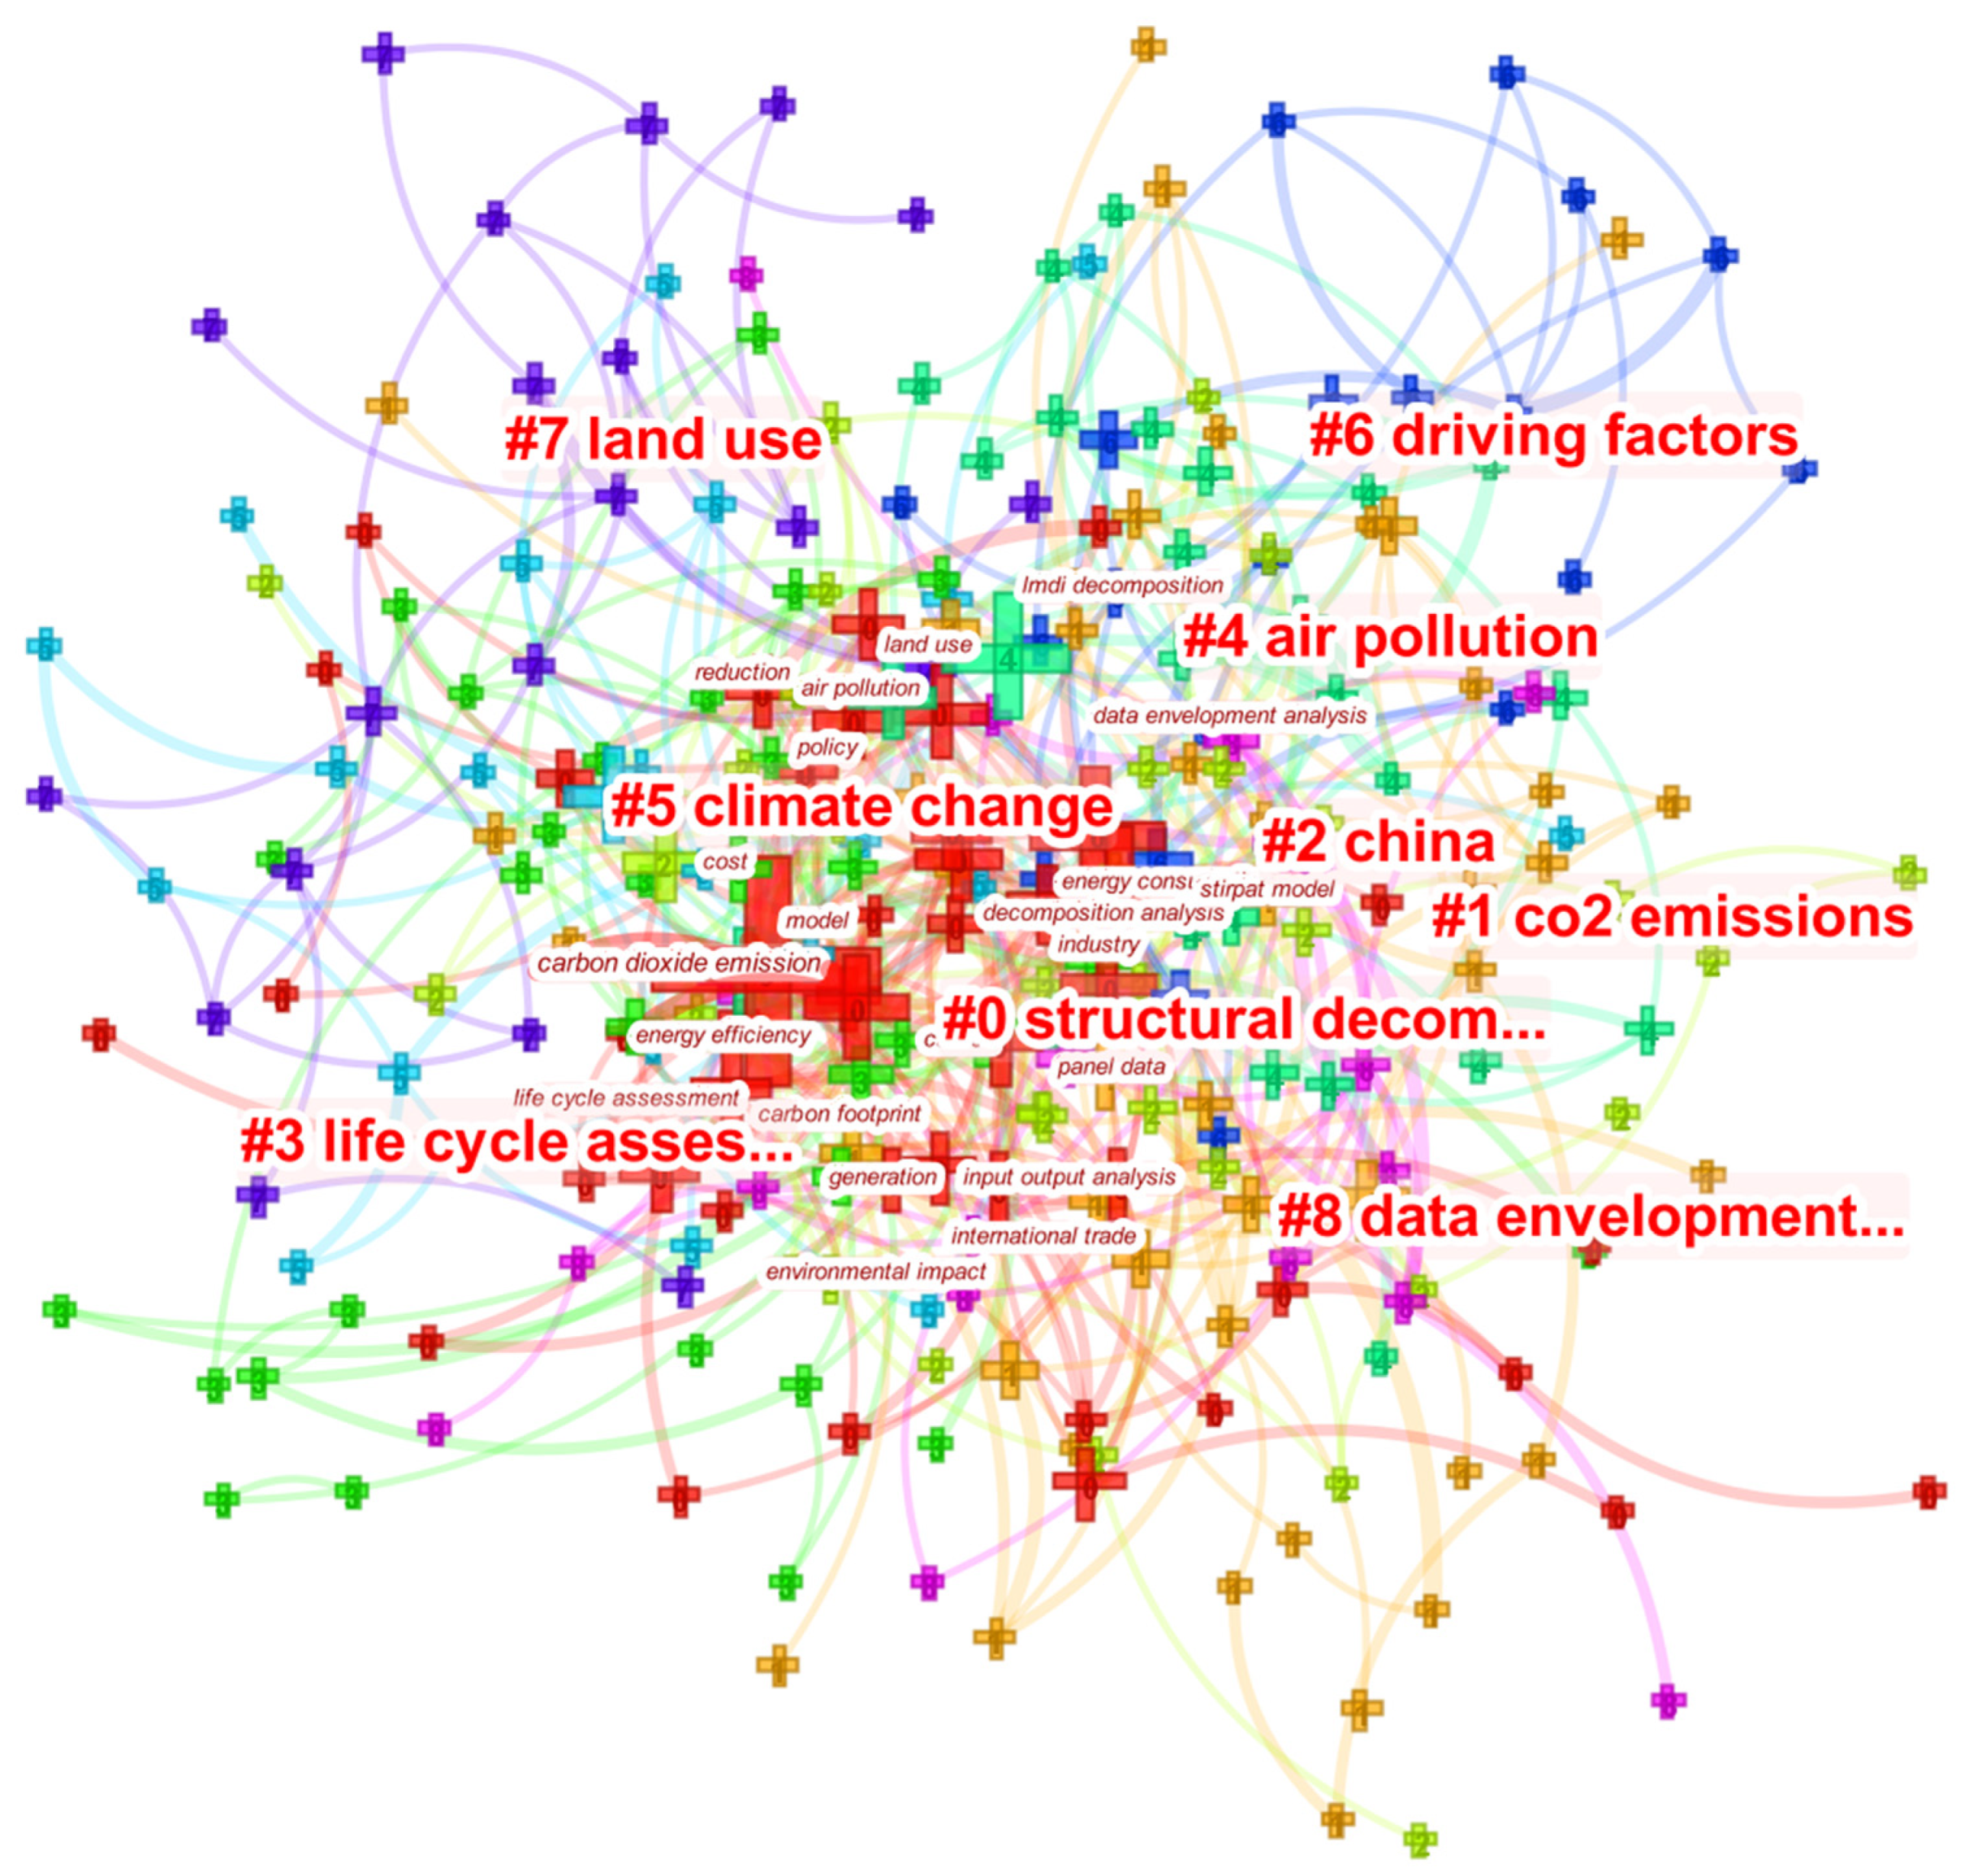
4.3.2. Keyword Cluster Analysis
In this paper, clustering is conducted for the keywords of relevant literature. As a result, nine cluster tags are obtained. The higher the cluster tag is in the ranking, the larger the scale will be, and the more the keywords will be, as illustrated in Figure 15 and Figure 16. For the convenience of discussion, we selected the top three largest-scale clusters for analysis, described the evolution sequence of keywords in each cluster, and used important citations to sort the development process of this cluster.
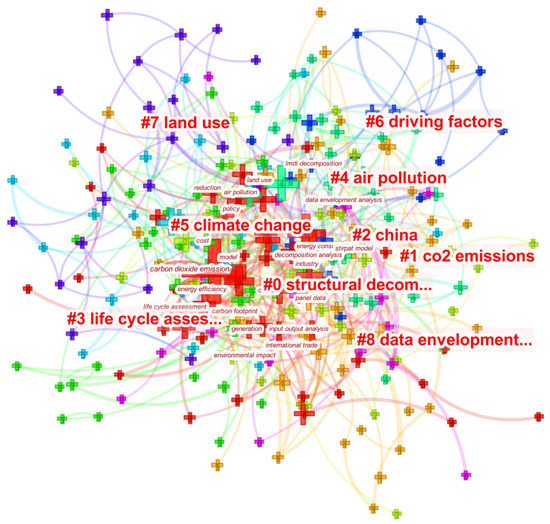
Figure 15.
Cluster analysis of keyword network.

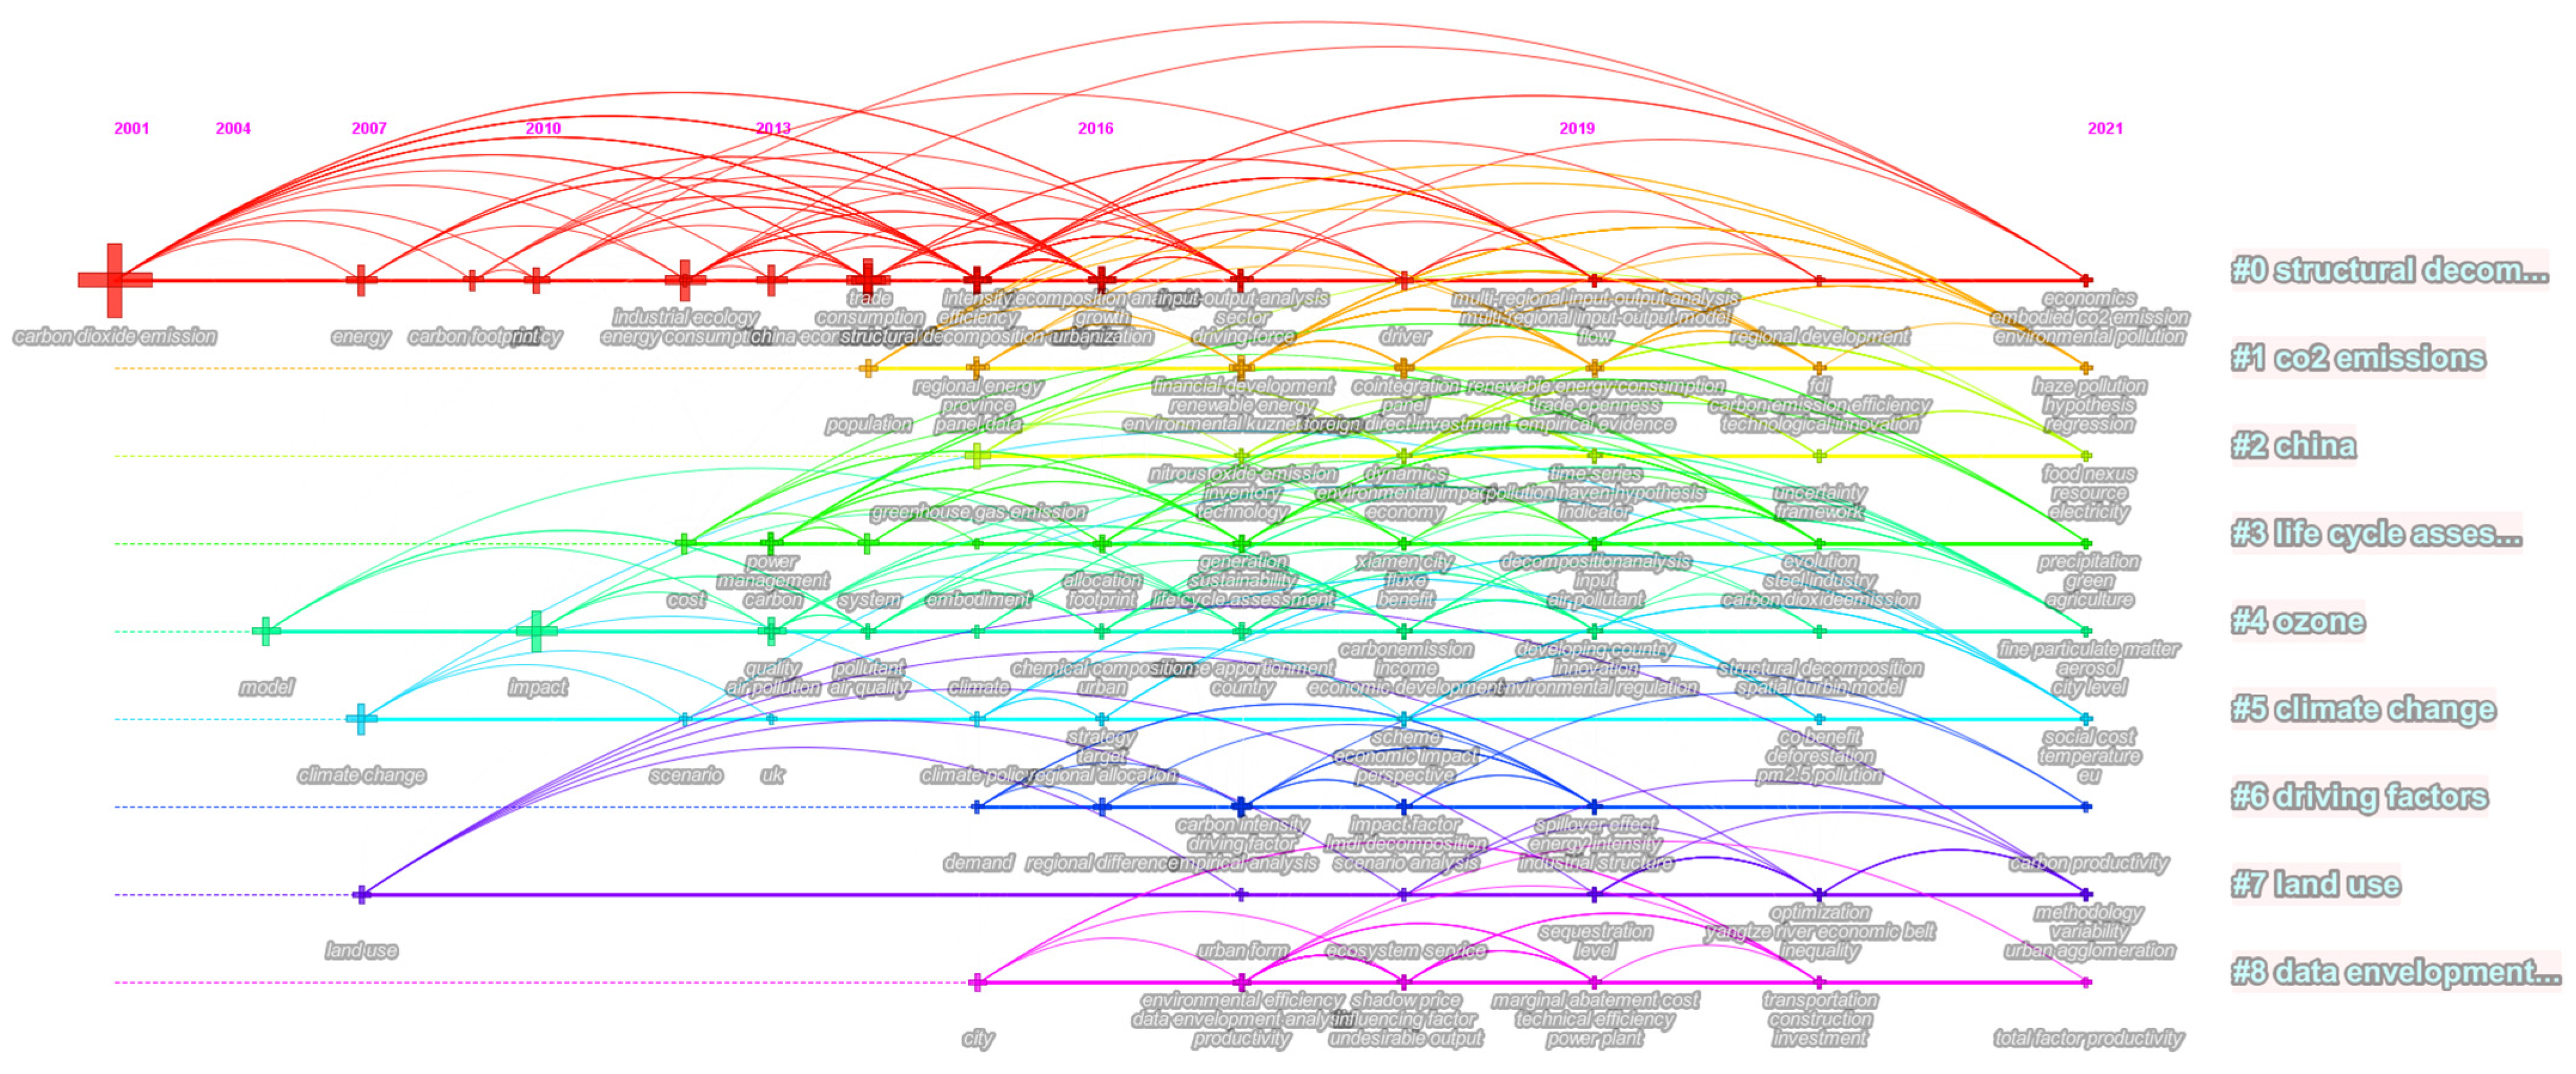
Figure 16.
Timeline view of keyword network.
The largest cluster (#0) is structural decomposition analysis (SDA). It has 46 members and the keywords according to the evolution sequence from left to right are as follows: carbon dioxide emission; energy; carbon footprint; industrial ecology; trade; decomposition analysis; multi-regional input-output analysis; and regional development. According to the characteristics of Asia, Kurokawa updates the emissions of major air pollutants and greenhouse gases by different industries and fuel types, providing the data foundation for the research of environmental economics [22]. Dong uses the SDA structural analysis method to decompose the impact factors of regional carbon emission intensity in China. The results indicate that various factors, such as energy structure, technical progress and urbanization, will affect the carbon emission intensity [35]. Hong, based on multi-regional input-output tables, conducts the structural path analysis (SPA) to quantify the environmental impact transfer in the entire supply chain. It indicates that direct resource input, along with on-site construction, consumes the highest amount of energy in the supply chain [36]. The most relevant citer to the cluster is Wang and Zhan (2019), which uses the input-output model to calculate the carbon emissions of household consumption in the Beijing-Tianjin-Hebei region, using SDA to discuss the factors influencing carbon emissions, and makes a contribution to the carbon emission reduction strategy in Beijing-Tianjin-Hebei region [37].
The second-largest cluster (#1) is CO2 emission. It has 45 members, and the keywords according to the evolution sequence from left to right are as follows: population; regional energy; renewable energy; trade openness; technological innovation; and haze pollution. Lin and Wang use the modified STIRPAT model to analyze the impacts of urbanization and economic development on carbon emissions, and quantitatively calculate the actual contribution rate of each driving force from 1991 to 2013. This research is helpful to understand the emission characteristics and key driving forces, thus providing appropriate policy recommendations [38]. Han uses the spatial panel model to discuss the spatial spillover effects and threshold characteristics of scientific and technological innovation, uses the thresholds to classify the heterogeneity of scientific and technological innovation capacity in different regions to the carbon emissions, and explores the low-carbon path of regional scientific and technological innovation [39]. The most relevant citer to the cluster is Mele and Magazzino (2020), which uses the machine learning method LSTM to analyze the relationship between the steel industry, air pollution and economic growth. In the long term, pollution emission reduction has a significant impact on sustainable economic development. Therefore, green, and low-carbon development, is an economic development path responsible for the next generation [40].
The third-largest cluster (#2) is China. It has 33 members, and the keywords according to the evolution sequence from left to right are as follows: green gas emission; technology; environmental impact; pollution haven hypothesis; uncertainty; and electricity. Tan and Zheng states that since the regional difference is large in China, the impact factors of carbon emissions in different regions are different. Industrial structure optimization reduces the national carbon emissions in China but increases regional carbon emissions in the northeast and northwest of China. Therefore, it is necessary for various regions in China to cooperate in carbon emission reduction [41]. The research of Ji finds that renewable energy sources, carbon capture and carbon sequestration technologies are effective technologies to reduce traditional energy consumption and promote carbon emission reduction, and provide different combined power generation technology schemes under different policies for regions with different development levels [42]. Zhao and Liu find that the different environmental regulation intensity in different regions in China leads to the carbon emission transfer among different regions, i.e., the “carbon havens effect”. The impacts of environmental regulation on carbon emissions include direct impacts and indirect impacts causing industrial transfer. Therefore, it is necessary to consider the implementation intensity of environmental regulation in different regions according to regional conditions [43]. The most relevant citer to the cluster is Zapata and Yang 2018, which uses the simulation of greenhouse gas emissions and human mortality to 2050 in California, in different scenarios, to estimate the public health benefits and costs, and provide a scientific basis for the local governments of California to adopt low-carbon energy development policy [44].
4.3.3. Frontier Problems in the Research Field
Burst analysis can display the vocabularies with the highest occurrence frequencies in the keywords and the time intervals for the occurrence of such vocabularies. Burst strength represents the occurrence frequency of a vocabulary. Burst keywords with a higher strength can, to a certain extent, reveal the frontier problems in this field and the evolution of research problems with time. Table 8 lists the top 21 burst keywords that are most frequently cited in regional carbon emission research. As can be seen from Table 8, there are three stages of the research hotspots in the field of regional economy and carbon emissions. Stage I is from 2000 to 2010, during which the burst words were “carbon dioxide emission”, “climate change”, “energy”, “carbon footprint” and “policy”. This indicates that in the early 21st century, researchers paid more attention to policy development trends in the fields of carbon emissions, climate change, energy and carbon footprint, reflecting the importance of the development of policies for regional economy and carbon emissions. Stage II is from 2011 to 2015, during which the burst words were “cost”, “industrial ecology”, “carbon”, “trade”, “climate policy”, “energy efficiency”, “mitigation”, “city”, “demand” and “greenhouse gas emission”. The research literature in this stage mainly focused on the industrial ecosystem, carbon emission cost and trading, and other topics, and began to deeply study the fields of climate policy and energy efficiency, which was helpful to promote the low-carbon transition of high energy-consuming industries and to improve energy efficiency. Stage III is from 2016 onwards, during which the burst words were “regional allocation”, “strategy”, “input-output analysis”, “data envelopment analysis”, “undesirable output” and “impact factor”. The research hotspots in this stage were mainly further refined research of the impact factors of carbon emissions in various regions. Since there is heterogeneity in the carbon emissions in different regions, the methods to design the carbon emission reduction path in each region more accurately have become the research focus. Various economic and statistical research methods, such as spatial econometric model, regional distribution, input-output model analysis and data envelopment analysis (DEA), which also indicates that climate and environmental problems will cross and integrate with other disciplines and that the economic models will be used to study the environmental and climate problems. The burst words in Stage ΙΙΙ are relatively new research hotspots and may become research focuses in the future.
Table 8.
Top 21 keywords with the most robust citation burst from 2000 to 2021.
5. Conclusions and Outlook
5.1. Research Conclusions
In this paper, relevant literature on regional economy and carbon emissions since 2000 were selected as research samples from the Web of Science databases. Citespace and VOSviewer are used to conduct the analysis of co-authorship, co-citation, keyword co-occurrence, cluster and burst analysis. Research status of the relevant fields of regional economy and carbon emission was sorted, and future key research directions are predicted according to the hotspot research field.
From the perspective of the variation trend of the number of published papers, the number of published papers for the relevant literature in the field of regional economy and carbon emissions shows a growth trend year by year. Especially since the official implementation of the Paris Agreement in 2016, there has been a blowout growth in the number of published papers, and the depth and width of the research results have been expanded. Chinese scholars and research institutions have made the most achievements in the research field of regional economy and carbon emissions, and have more papers than the scholars and institutions in the developed countries of Europe and America. However, the top five highly cited papers in the literature samples are published by scholars from Austria, the United States, Japan and Australia. It indicates that the developed countries in Europe and America have begun their research in this research field much earlier, while China has paid more attention to the research field which is related to the goal of carbon peaking and carbon neutrality, set by the government of China.
From the perspective of the author cooperation network, relatively stable research groups have been formed for the research on relevant topics. For example, the group with Long Ruyin as the core mainly conducts research on the decomposition of impact factors of carbon emissions and the relevant topics of energy, industry and carbon emission reduction achieved by technical progress. The research group with Lin Boqiang as the core mainly conducts research on regional economy and energy policy. There are also other research groups, such as the research group with Elmar Kriegler as the core, and the research group with Zhao Tao as the core. However, there is a lack of cooperation among these groups.
From the perspective of keyword co-occurrence and clustering mapping, high-frequency words used in the literature mainly focus on carbon emissions, economic development, energy consumption, urbanization, industry, policy and other issues; at the medium-micro level, the focus is on technological innovation and method application, such as carbon footprint, renewable energy sources, factor decomposition analysis and input-output analysis. From the perspective of clustering results and topic evolution, “structural decomposition analysis” and “CO2 emission” are two relatively large-scale clusters. The relevant literature mainly focuses on the macroscopic analysis of a low-carbon economy and the implementation effect of climate change policies. The research concentrates on the main factors that affect carbon emissions in different regions, and the methods to reduce the carbon emissions through energy structure optimization, industrial upgrading, reconstruction and transfer, and technological innovations in individual industries. At the same time, at the micro-level, the regional low-carbon development paths are explored by spatial econometric models and input-output models.
From the perspective of keyword burst, the time intervals for the occurrence of keyword burst in the relevant literature can be divided into three stages, and the research hotspots in such stages are different. In Stage I, scholars paid more attention to policy development related to climate change and carbon emissions. In Stage II, scholars paid more attention to the methods to improve energy efficiency and reduce carbon emissions in various aspects such as industry, energy, cities and trade. In Stage III, scholars mainly used traditional economic analysis models to study low-carbon problems, representing the future key research direction.
5.2. Research Deficiencies and Outlook
Institutions and scholars, both in developing countries and developed countries, are concerned about problems in the field of regional economy and carbon emissions, and the research results are rich. However, there is little cooperation between individual institutions and scholars, and there is a lack of regular exchanges and stable cooperation channels between research groups. In the field of regional economy and carbon emissions, the core factor of carbon emission reduction is technological innovation [5]. Therefore, research on technological innovations for low-carbon and carbon emission reduction needs to be strengthened. Different regions are at different development stages, so the carbon emission reduction strategies to be implemented shall also be adjusted according to local conditions.
At present, because of the limitation of bibliometric tools, this paper only used sample from WOS, in which papers are in English. In future study, we could add papers in Chinese to conduct more comprehensive results by adding data from CNKI. To analyze the progress of relevant literature, considering the availability and authority of data, this paper uses Citespace and VOSviewer to conduct the visualized analysis of sample data in the WOS. Although the core literature of 21 years has been selected in the samples to the maximum extent, research in this field develops and evolves continuously. For research on the topics of regional economy and carbon emissions, there will be more analyses that are more comprehensive and offer more objective conclusions.
According to the research results of this paper and the research progress of literature in the field of the regional economy and carbon emissions, this paper predicts several research hotspots in the future:
- Interdisciplinary integration. The carbon emission problem is a systematic problem that involves the environment, ecology, economy, society and other fields. The carbon emission reduction goal requires the joint efforts of all walks of life. Based on the analysis of the institutional cooperation network and the author cooperation network, most of the literature is in the field of ecological environment, and the research is based on a certain region or certain country, which lacks universality. There are great differences in resources and environment between regions/countries [45]. To better study the problems in this field, the institutions and scholars should conduct adequate interdisciplinary and cross-industry cooperation, promote the transformation and reform in individual regions and industries, and achieve the carbon emission reduction goal more quickly. The government should consider regional difference fully when formulating carbon emission reduction policies, since there are different regions with different levels of development in China [8,46].
- Construction of carbon trading market. The carbon trading market is an important way to realize carbon emission reduction by using the market mechanism. As a market-oriented emission reduction policy tool, changes in the carbon trading market will inevitably lead to changes in the external competitive environment of enterprises. The establishment of a new system generates new rules of the game, and the macro-level policy environment. Changes have led to the creation of a niche space for new technologies at the micro level [47,48]. The design of the carbon trading mechanism can greatly affect the carbon emission price and further affect carbon emission efficiency. The European Union was the first to establish a carbon trading market and is a market with a relatively mature carbon trading system at present. The methods to improve the existing carbon trading system according to the resource endowment characteristics of each region to achieve the carbon emission reduction effect are the key research directions in the future.
- Further refinement of impact factors of carbon emissions. It is believed that the industrial structure, energy intensity, energy consumption structure and technological innovation are important factors affecting carbon emissions [8], but there is a lack of in-depth research. Factors such as industrial structure and energy efficiency vary greatly in different regions, and the impact paths include both direct impacts and indirect impacts. Energy-intensive sectors are the main source of direct carbon emission, such as electricity and cement. Real-estate and building related sectors have indirect effect on carbon emissions [49]. Therefore, businesses in those industrial sectors could optimize their industrial structure, and optimize the energy consumption structure. In the future, we shall further explore the impact of factors such as industry, population, technology and energy on carbon emissions from the perspective of space and resources, and formulate appropriate carbon emission reduction policies and methods for individual regions.
- Innovative development of carbon emission reduction technology and carbon sequestration technology. To achieve the goal of carbon emission reduction, most studies think that the most direct method is to control the sources of carbon emissions through technologies such as carbon capture and carbon sequestration technologies, and to offset the carbon dioxide already produced by adding carbon sinks and other carbon offset methods [50,51]. Future research focuses also include the R&D and implementation of zero carbon emission technology, and the rational formulation of regional carbon offset strategies.
Author Contributions
Data curation, Z.D.; Formal analysis, L.Z.; Methodology, L.Z.; Software, L.Z.; Supervision, J.D., Z.D. and X.L.; Validation, Z.D.; Visualization, L.Z.; Writing—original draft, L.Z.; Writing—review & editing, J.D. and X.L. All authors have read and agreed to the published version of the manuscript.
Funding
This research received no external funding.
Conflicts of Interest
The authors declare no conflict of interest.
References
- Zhang, Y.G. Structural decomposition analysis of sources of decarbonizing economic development in China: 1992–2006. Ecol. Econ. 2009, 68, 2399–2405. [Google Scholar] [CrossRef]
- Fan, F.Y.; Lei, Y.L. Decomposition analysis of energy-related carbon emissions from the transportation sector in Beijing. Transp. Res. Part D Transp. Environ. 2016, 42, 135–145. [Google Scholar] [CrossRef]
- Wang, F.; Wang, G.; Liu, J. How does urbanization affect carbon emission intensity under a hierarchical nesting structure? Empirical research on the China Yangtze River Delta urban agglomeration. Environ. Sci. Pollut. Res. 2019, 26, 31770–31785. [Google Scholar] [CrossRef] [PubMed]
- Zhang, Y. Spillover and Feedback Effects in Low Carbon Development; Springer Books; Springer: Berlin/Heidelberg, Germany, 2021; ISBN 978-981-16-4971-4. [Google Scholar]
- Sun, X.; Ma, X.; Shi, F.; Han, M.; Xie, H.; He, Y. Decomposition of China’s regional carbon emission paths: An analysis of environmental input and output considering regional development differences. Environ. Sci. Pollut. Res. 2022. [Google Scholar] [CrossRef]
- Sofien, T.; Anis, O. Literature survey on the relationships between energy, environment and economic growth. Renew. Sustain. Energy Rev. 2017, 69, 1129–1146. [Google Scholar]
- Dong, F.; Hua, Y.; Yu, B. Peak Carbon Emissions in China: Status, Key Factors and Countermeasures—A Literature Review. Sustainability 2018, 10, 2895. [Google Scholar] [CrossRef]
- Chen, J.Q.; Lian, X.Y.; Su, H.N.; Zhang, Z.Y.; Ma, X.J.; Chang, B.S. Analysis of China’s carbon emission driving factors based on the perspective of eight major economic regions. Environ. Sci. Pollut. Res. 2020, 28, 8181–8204. [Google Scholar] [CrossRef]
- Shahbaz, M.; Bashir, M.F.; Bashir, M.A.; Shahzad, L. A bibliometric analysis and systematic literature review of tourism-environmental degradation nexus. Environ. Sci. Pollut. Res. 2021, 28, 58241–58257. [Google Scholar] [CrossRef] [PubMed]
- Wu, H.; Wang, Y.; Tong, L.; Yan, H.; Sun, Z. The Global Research Trends and Hotspots on Developmental Dysplasia of the Hip: A Bibliometric and Visualized Study. Front. Surg. 2021, 8, 671403. [Google Scholar] [CrossRef] [PubMed]
- Ali, A.; Ammar, A.; Muhammad, S.K.; Li, H.; Zutao, Z.; Asif, A. Knowledge structuring for enhancing mechanical energy harvesting (MEH): An in-depth review from 2000 to 2020 using CiteSpace. Renew. Sustain. Energy Rev. 2021, 150, 111460. [Google Scholar]
- Henry, S. Co-citation in scientific literature: A new measure of the relationship between two documents. J. Am. Soc. Inf. Sci. 1973, 24, 265–269. [Google Scholar]
- Leng, S.; Gao, X.; Pei, T. The Geographical Sciences during 1986–2015; Springer Geography; Springer: Singapore, 2017. [Google Scholar]
- Li, S.; Wu, N.; Wu, J.; Feng, Q.; Fu, Z.; Yang, B. Analysis of research hotspots and trends of China’s industrial transfer based on Citespace. J. Environ. Eng. Technol. 2021, 11, 599–608. [Google Scholar]
- Chen, K.; Guan, J. A bibliometric investigation of research performance in emerging nanobiopharmaceuticals. J. Informetr. 2011, 5, 233–247. [Google Scholar] [CrossRef]
- Yuan, B.-Z.; Sun, J. Bibliometric Analysis of Rice and Climate Change Publications Based on Web of Science. Theor. Appl. Climatol. 2021. [Google Scholar] [CrossRef]
- Duan, H.; Zhou, S.; Jiang, K.; Bertram, C.; Harmsen, M.; Kriegler, E.; Vuuren, D.P.; Wang, S.; Fujimori, S.; Tavoni, M.; et al. Assessing China’s efforts to pursue the 1.5 °C warming limit. Science 2021, 372, 378–385. [Google Scholar] [CrossRef]
- Riahi, K.; Van Vuuren, D.P.; Elmar, K.; Jae, E.; Brian, C.O. The Shared Socioeconomic Pathways and their energy, land use, and greenhouse gas emissions implications: An overview. Glob. Environ. Chang. 2017, 42, 153–168. [Google Scholar] [CrossRef]
- Thomson, A.M.; Calvin, K.V.; Smith, S.J. RCP4.5: A pathway for stabilization of radiative forcing by 2100. Clim. Change 2011, 109, 77–94. [Google Scholar] [CrossRef]
- Lal, R. Soil degradation by erosion. Land Degrad. Dev. 2001, 12, 519–539. [Google Scholar] [CrossRef]
- Wiedmann, T.; Lenzen, M.; Turner, K.; Barrett, J. Examining the global environmental impact of regional consumption activities—Part 2: Review of input–output models for the assessment of environmental impacts embodied in trade. Ecol. Econ. 2007, 61, 15–26. [Google Scholar] [CrossRef]
- Kurokawa, J.; Ohara, T.; Morikawa, T.; Hanayama, S.; Janssens-Maenhout, G.; Fukui, T.; Kawashima, K.; Akimoto, H. Emissions of air pollutants and greenhouse gases over Asian regions during 2000–2008: Regional Emission inventory in ASia (REAS) version 2. Atmos. Chem. Phys. 2013, 13, 11019–11058. [Google Scholar] [CrossRef]
- Narayan, P.K.; Narayan, S. Carbon dioxide emissions and economic growth: Panel data evidence from developing countries. Energy Policy 2010, 38, 661–666. [Google Scholar] [CrossRef]
- Zhang, S.; Xuan, Y.; Qiu, L.; Liu, N. Status and Characteristics of COVID-19 Academic Research Based on Social Network Analysis and Bibliometrics. J. Beijing Univ. Posts Telecommun. 2020, 22, 87–98. [Google Scholar]
- Xu, B.; Lin, B. Factors affecting carbon dioxide (CO2) emissions in China’s transport sector: A dynamic nonparametric additive regression model. J. Clean. Prod. 2015, 101, 311–322. [Google Scholar] [CrossRef]
- Khan, S.; Abdul, R.; Jian, C.; Zhang, Y.; Golpîra, H.; Kumar, A.; Sharif, A. Environmental, social and economic growth indicators spur logistics performance: From the perspective of South Asian Association for Regional Cooperation countries. J. Clean. Prod. 2019, 214, 1011–1023. [Google Scholar] [CrossRef]
- Dong, K.; Hochman, G.; Zhang, Y.; Sun, R.; Li, H.; Liao, H. CO2 emissions, economic and population growth, and renewable energy: Empirical evidence across regions. Energy Econ. 2018, 75, 180–192. [Google Scholar] [CrossRef]
- Zheng, J.; Mi, Z.; Coffman, D.; Milcheva, S.; Shan, Y.; Guan, D.; Wang, S. Regional development and carbon emissions in China. Energy Econ. 2019, 81, 25–36. [Google Scholar] [CrossRef]
- Chang, Y.W.; Huang, M.H.; Lin, C.W. Evolution of research subjects in library and information science based on keyword, bibliographical coupling, and co-citation analyses. Scientometrics 2015, 105, 2071–2087. [Google Scholar] [CrossRef]
- Behrend, J.; Eulerich, M. Exploring the Scientific Landscape of Internal Audit Research: A Bibliometric Analysis. 2018. Available online: https://ssrn.com/abstract=3178362 (accessed on 2 April 2022).
- Hu, C.P.; Hu, J.M.; Gao, Y. A journal co-citation analysis of library and information science in China. Scientometrics 2011, 86, 657–670. [Google Scholar] [CrossRef]
- McCain, K.W. Mapping Economics through the Journal Literature: An Experiment in Journal Cocitation Analysis. J. Am. Soc. Inf. Sci. 1991, 42, 290–296. [Google Scholar] [CrossRef]
- Liao, H.; Tang, M.; Luo, L.; Li, C.; Chiclana, F.; Zeng, X.-J. A Bibliometric Analysis and Visualization of Medical Big Data Research. Sustainability 2018, 10, 166. [Google Scholar] [CrossRef]
- Yu, D.; Xu, Z.; Pedrycz, W.; Wang, W. Information sciences 1968–2016: A retrospective analysis with text mining and bibliometric. Inf. Sci. 2017, 418–419, 619–634. [Google Scholar] [CrossRef]
- Dong, F.; Long, R.; Yu, B.; Wang, Y.; Li, J.; Wang, Y.; Dai, Y.; Yang, Q.; Chen, H. How can China allocate CO2 reduction targets at the provincial level considering both equity and efficiency? Evidence from its Copenhagen Accord pledge. Resour. Conserv. Recycl. 2018, 130, 31–43. [Google Scholar] [CrossRef]
- Hong, J.; Shen, Q.; Xue, F. A multi-regional structural path analysis of the energy supply chain in China’s construction industry. Energy Policy 2016, 92, 56–68. [Google Scholar] [CrossRef]
- Wang, C.; Zhan, J.; Li, Z.; Zhang, F.; Zhang, Y. Structural decomposition analysis of carbon emissions from residential consumption in the Beijing-Tianjin-Hebei region, China. J. Clean. Prod. 2019, 208, 1357–1364. [Google Scholar] [CrossRef]
- Lin, S.; Wang, S.; Marinova, D.; Zhao, D.; Hong, J. Impacts of urbanization and real economic development on CO2 emissions in non-high income countries: Empirical research based on the extended STIRPAT model. J. Clean. Prod. 2017, 166, 952–966. [Google Scholar] [CrossRef]
- Han, B. Research on the influence of technological innovation on carbon productivity and countermeasures in China. Environ. Sci. Pollut. Res. 2021, 28, 16880–16894. [Google Scholar] [CrossRef] [PubMed]
- Mele, M.; Magazzino, C. A Machine Learning analysis of the relationship among iron and steel industries, air pollution, and economic growth in China. J. Clean. Prod. 2020, 277, 123293. [Google Scholar] [CrossRef]
- Tan, Q.; Zheng, J.; Ding, Y.; Zhang, Y. Provincial Carbon Emission Quota Allocation Study in China from the Perspective of Abatement Cost and Regional Cooperation. Sustainability 2020, 12, 8457. [Google Scholar] [CrossRef]
- Ji, L.; Huang, G.H.; Niu, D.X.; Cai, Y.P.; Yin, J.G. A Stochastic Optimization Model for Carbon-Emission Reduction Investment and Sustainable Energy Planning under Cost-Risk Control. J. Environ. Inform. 2020, 36, 107–118. [Google Scholar] [CrossRef]
- Zhao, X.; Liu, C.; Sun, C.; Yang, M. Does stringent environmental regulation lead to a carbon haven effect? Evidence from carbon-intensive industries in China. Energy Econ. 2020, 86, 104631. [Google Scholar] [CrossRef]
- Zapata, C.B.; Yang, C.; Yeh, S.; Ogden, J.; Kleeman, M.J. Low-carbon energy generates public health savings in California. Atmos. Chem. Phys. 2018, 18, 4817–4830. [Google Scholar] [CrossRef]
- Long, R.; Gan, X.; Chen, H.; Wang, J.; Li, Q. Spatial econometric analysis of foreign direct investment and carbon productivity in China: Two-tier moderating roles of industrialization development. Resour. Conserv. Recycl. 2020, 155, 104677. [Google Scholar] [CrossRef]
- Cheng, X.; Long, R.; Chen, H. Obstacle diagnosis of green competition promotion: A case study of provinces in China based on catastrophe progression and fuzzy rough set methods. Environ. Sci. Pollut. Res. 2018, 25, 4344–4360. [Google Scholar] [CrossRef]
- Meyer, J.; Rowan, B. Institutionalized organizations: Formal structure as myth and ceremony. Am. J. Sociol. 1977, 83, 340–363. [Google Scholar] [CrossRef]
- Rotmans, J.; Kemp, R.; Asselt, A. More evolution than revolution: Transition management in public policy. Foresight 2001, 3, 15–31. [Google Scholar] [CrossRef]
- Li, F.; Hu, J.B. Dynamic analysis of influencing factors of China’s industrial sector embodied carbon emissions: An empirical analysis based on sub-sector data. Econ. Probl. 2021, 11, 77–87. [Google Scholar]
- Kriegler, E.; Bauer, N.; Popp, A. Fossil-fueled development (SSP5): An energy and resource intensive scenario for the 21st century. Glob. Environ. Chang. 2017, 42, 297–315. [Google Scholar] [CrossRef]
- Kriegler, E.; Riahi, K.; Bauer, N.; Schwanitz, V.J. Making or breaking climate targets: The AMPERE study on staged accession scenarios for climate policy. Technol. Forecast. Soc. Chang. 2015, 90, 24–44. [Google Scholar] [CrossRef]


Publisher’s Note: MDPI stays neutral with regard to jurisdictional claims in published maps and institutional affiliations. |
© 2022 by the authors. Licensee MDPI, Basel, Switzerland. This article is an open access article distributed under the terms and conditions of the Creative Commons Attribution (CC BY) license (https://creativecommons.org/licenses/by/4.0/).