Article

Classification of Industrial Heat Source Objects Based on Active Fire Point Density Segmentation and Spatial Topological Correlation Analysis in the Beijing–Tianjin–Hebei Region

1
Aerospace Information Research Institute, Chinese Academy of Sciences, Beijing 100094, China
2
School of Information, Beijing Forestry University, Beijing 100083, China
3
School of Environment and Surveying, China University of Mining and Technology, Xuzhou 221116, China
*
Author to whom correspondence should be addressed.
Sustainability 2022, 14(18), 11228; https://doi.org/10.3390/su141811228
Submission received: 4 August 2022 / Revised: 1 September 2022 / Accepted: 4 September 2022 / Published: 7 September 2022

Abstract

:
The development of industrial infrastructure in the Beijing–Tianjin–Hebei(BTH) region has been accompanied by a disorderly expansion of industrial zones and other inappropriate development. Accurate industrial heat source classification data become important to evaluate the policies of industrial restructuring and air quality improvement. In this study, a new classification of industrial heat source objects model based on active fire point density segmentation and spatial topological correlation analysis in the BTH Region was proposed. First, industrial heat source objects were detected with an active fire point density segmentation method using NPP-VIIRS active fire/hotspot data. Then, industrial heat source objects were classified into five categories based on a spatial topological correlation analysis method using POI data. Then, identification and classification results were manually validated based on Google Earth imagery. Finally, we evaluated the factors influencing the number of industrial heat sources based on an OLS regression model. A total of 493 industrial heat source objects were identified in this study with an identification accuracy of 96.14%(474/493). Compared with results for nighttime fires, the number of industrial heat source objects that were identified was higher, and the spatial coverage was greater; the minimum size of the detected objects was also smaller. Based on the function of the identified industrial heat source objects, the objects in the BTH region were then divided into five categories: cement plants (21.73%), steel plants (53.80%), coal and chemical industry (12.66%), oil and gas developments (7.81%), and other (4.01%). An analysis of their operations showed that the number of industrial heat source objects in operation in the BTH region tended to first rise and then decline during the 2012–2021 period, with the peak being reached in 2013. The results of this study will aid the rationalization of industrial infrastructure in the BTH region and, by extension, in China as a whole.

1. Introduction

High energy-consuming industries provide the primary means of production for the material and technical bases of all sectors of a nation’s economy [1]. They are an essential part of the economy and account for a significant part of a country’s total energy consumption [2,3]. These industries also generate a large amount of waste heat, cause environmental problems such as air pollution, and emit excessive amounts of carbon [4,5]. Data from the International Energy Agency show that China’s CO2 emissions are the highest in the world. In 2021, China’s CO2 emissions accounted for 33% of the global total, of which industrial emissions accounted for more than 70% [6]. Therefore, clarifying the current distribution of industrial heat sources, establishing an inventory of heavy industrial plants, and producing a dataset of industrial heat sources that has a high spatial and temporal accuracy are effective ways of helping the industrial sector reduce its energy consumption intensity. These measures will also provide data support for fulfilling the requirements of the Paris Action Treaty and for achieving the goal of “carbon peaking and carbon neutrality”.
Industrial heat sources are mainly located far from residential areas, and the registration and management of these sources are imperfect. Traditional methods of producing inventories based on manual monitoring are costly in terms of time and labor [7,8,9]. Most factories that consume a lot of energy also release a large amount of heat during their production processes, thus forming industrial thermal anomalies. The location and attributes of industrial heat sources can be determined by analyzing these thermal anomalies [10]. Since the peak wavelength of radiant energy shifts to shorter wavelengths with increasing temperature, and the amount of energy radiated in the infrared region is higher than for features that have ‘normal’ temperatures, satellite remote sensing products that are responsive to high-temperature targets can track these thermal anomalies in time. To date, many studies related to fire point monitoring have been based on satellite thermal anomaly products, and remarkable progress has been made in the monitoring of fires [11,12], biomass burning [13,14], and volcanic activity [15]. Fire point studies related to industrial sources are also producing improved results. Elvidge et al. analyzed global natural gas emission sources based on VIIRS nighttime thermal anomaly data and proposed a method for investigating natural gas flares based on VIIRS data [16]. Zhou [17] and Hao et al. [18] used Landsat data to monitor factory activity and extract areas of industrial thermal pollution. Clustering algorithms such as the k-means algorithm [19], DBSCAN [20], and OPTICS [21] have been used to identify industrial heat sources that cover large areas, but the accuracy of these methods needs to be improved so that they can be applied to the extraction and delineation of heat sources covering smaller areas.
Many researchers have investigated the detection and classification of cement and steel plants, with deep learning being the primary method used for target detection. Using an R-CNN deep learning framework, Xu et al. detected cement plants with an accuracy of 96% [22], and Lu et al. achieved an accuracy of more than 80% using an SSD network to extract steel plants based on GF-1 satellite [23]. However, these methods are time-consuming and require a large number of training samples. Liu et al. proposed an object-oriented analysis method based on VIIRS nighttime thermal anomaly data and the concept of an integrated “time–space–temperature” dimension; using this method, industrial heat source objects were segmented and classified by analyzing their temporal and spatial distribution as well as their temperature characteristics in relation to those of other types of thermal anomaly [24,25]. Ma et al. used an improved k-means algorithm to achieve the identification of industrial heat sources in China and extracted the information parameters related to industrial heat sources [10,26]. However, the granularity of the detection results was not high and some of the “multiple industrial heat source entities in one industrial heat source object” cannot be detected and classified exactly.
In this study, a new classification of industrial heat source objects model based on active fire point density segmentation and spatial topological correlation analysis was proposed to improve the accuracy of the detection and classification of industrial heat source objects. First, VIIRS active thermal anomaly data, which have a high spatial and temporal resolution (375 m), were used in the Beijing–Tianjin–Hebei (BTH) Region. Then, these data were combined with an industrial heat source identification method based on an improved k-means algorithm, together with POI data, Google Earth satellite images, and placename datasets. This method was based on spatial topological correlation analysis, which can, primarily, reduce the number of industrial heat source entities in an industrial heat source object. The BTH region is the most energy-intensive industrial area in China. This study took this region as the study area and classified industrial heat source remote sensing images into five categories based on their characteristics to realize the identification and classification of industrial heat source objects during the period from 2012 to 2021. The results will provide data for the comprehensive utilization of industrial resources and collaborative industrial transformation in the BTH region.

2. Materials and Methods

2.1. Study Area

In this study, the study area consisted of the BTH region of China, which ranges from latitude 36°05′ N to 42°20′ N and from longitude 113°27′ E to 119°50′ E. This area is located on the North China Plain, surrounded by the Taihang Mountains in the west, the Yanshan Mountains in the north, the Bohai Sea in the east, and the central plains of China to the south. It includes two municipalities directly under the control of the central government—Beijing and Tianjin—and 11 prefecture-level cities within Hebei Province. The study area covers a total area of about 227,300 km2 (Figure 1). The Beijing–Tianjin–Hebei region is in the middle of the Bohai economic circle in the Northeast Asian China region; it is the largest and most dynamic economic region in northern China and has a well-established, relatively complete industrial base [27].
The BTH region is rich in iron ore, coal, oil, and other resources [28]. In total, 2,400,000 tons of crude steel were produced in the region in 2019, accounting for nearly a quarter of China’s crude steel production. Along with the transformation of China’s model of economic development, the BTH region has continuously promoted institutional innovation, accelerated industrial collaboration and transfer, optimized the structure and spatial layout of its industries, and formed a network consisting of “one core, two wings, two cities, three axes, four districts, and multiple nodes” as the skeleton and transportation arteries and ecological corridors as the links [29].

2.2. Data Sources

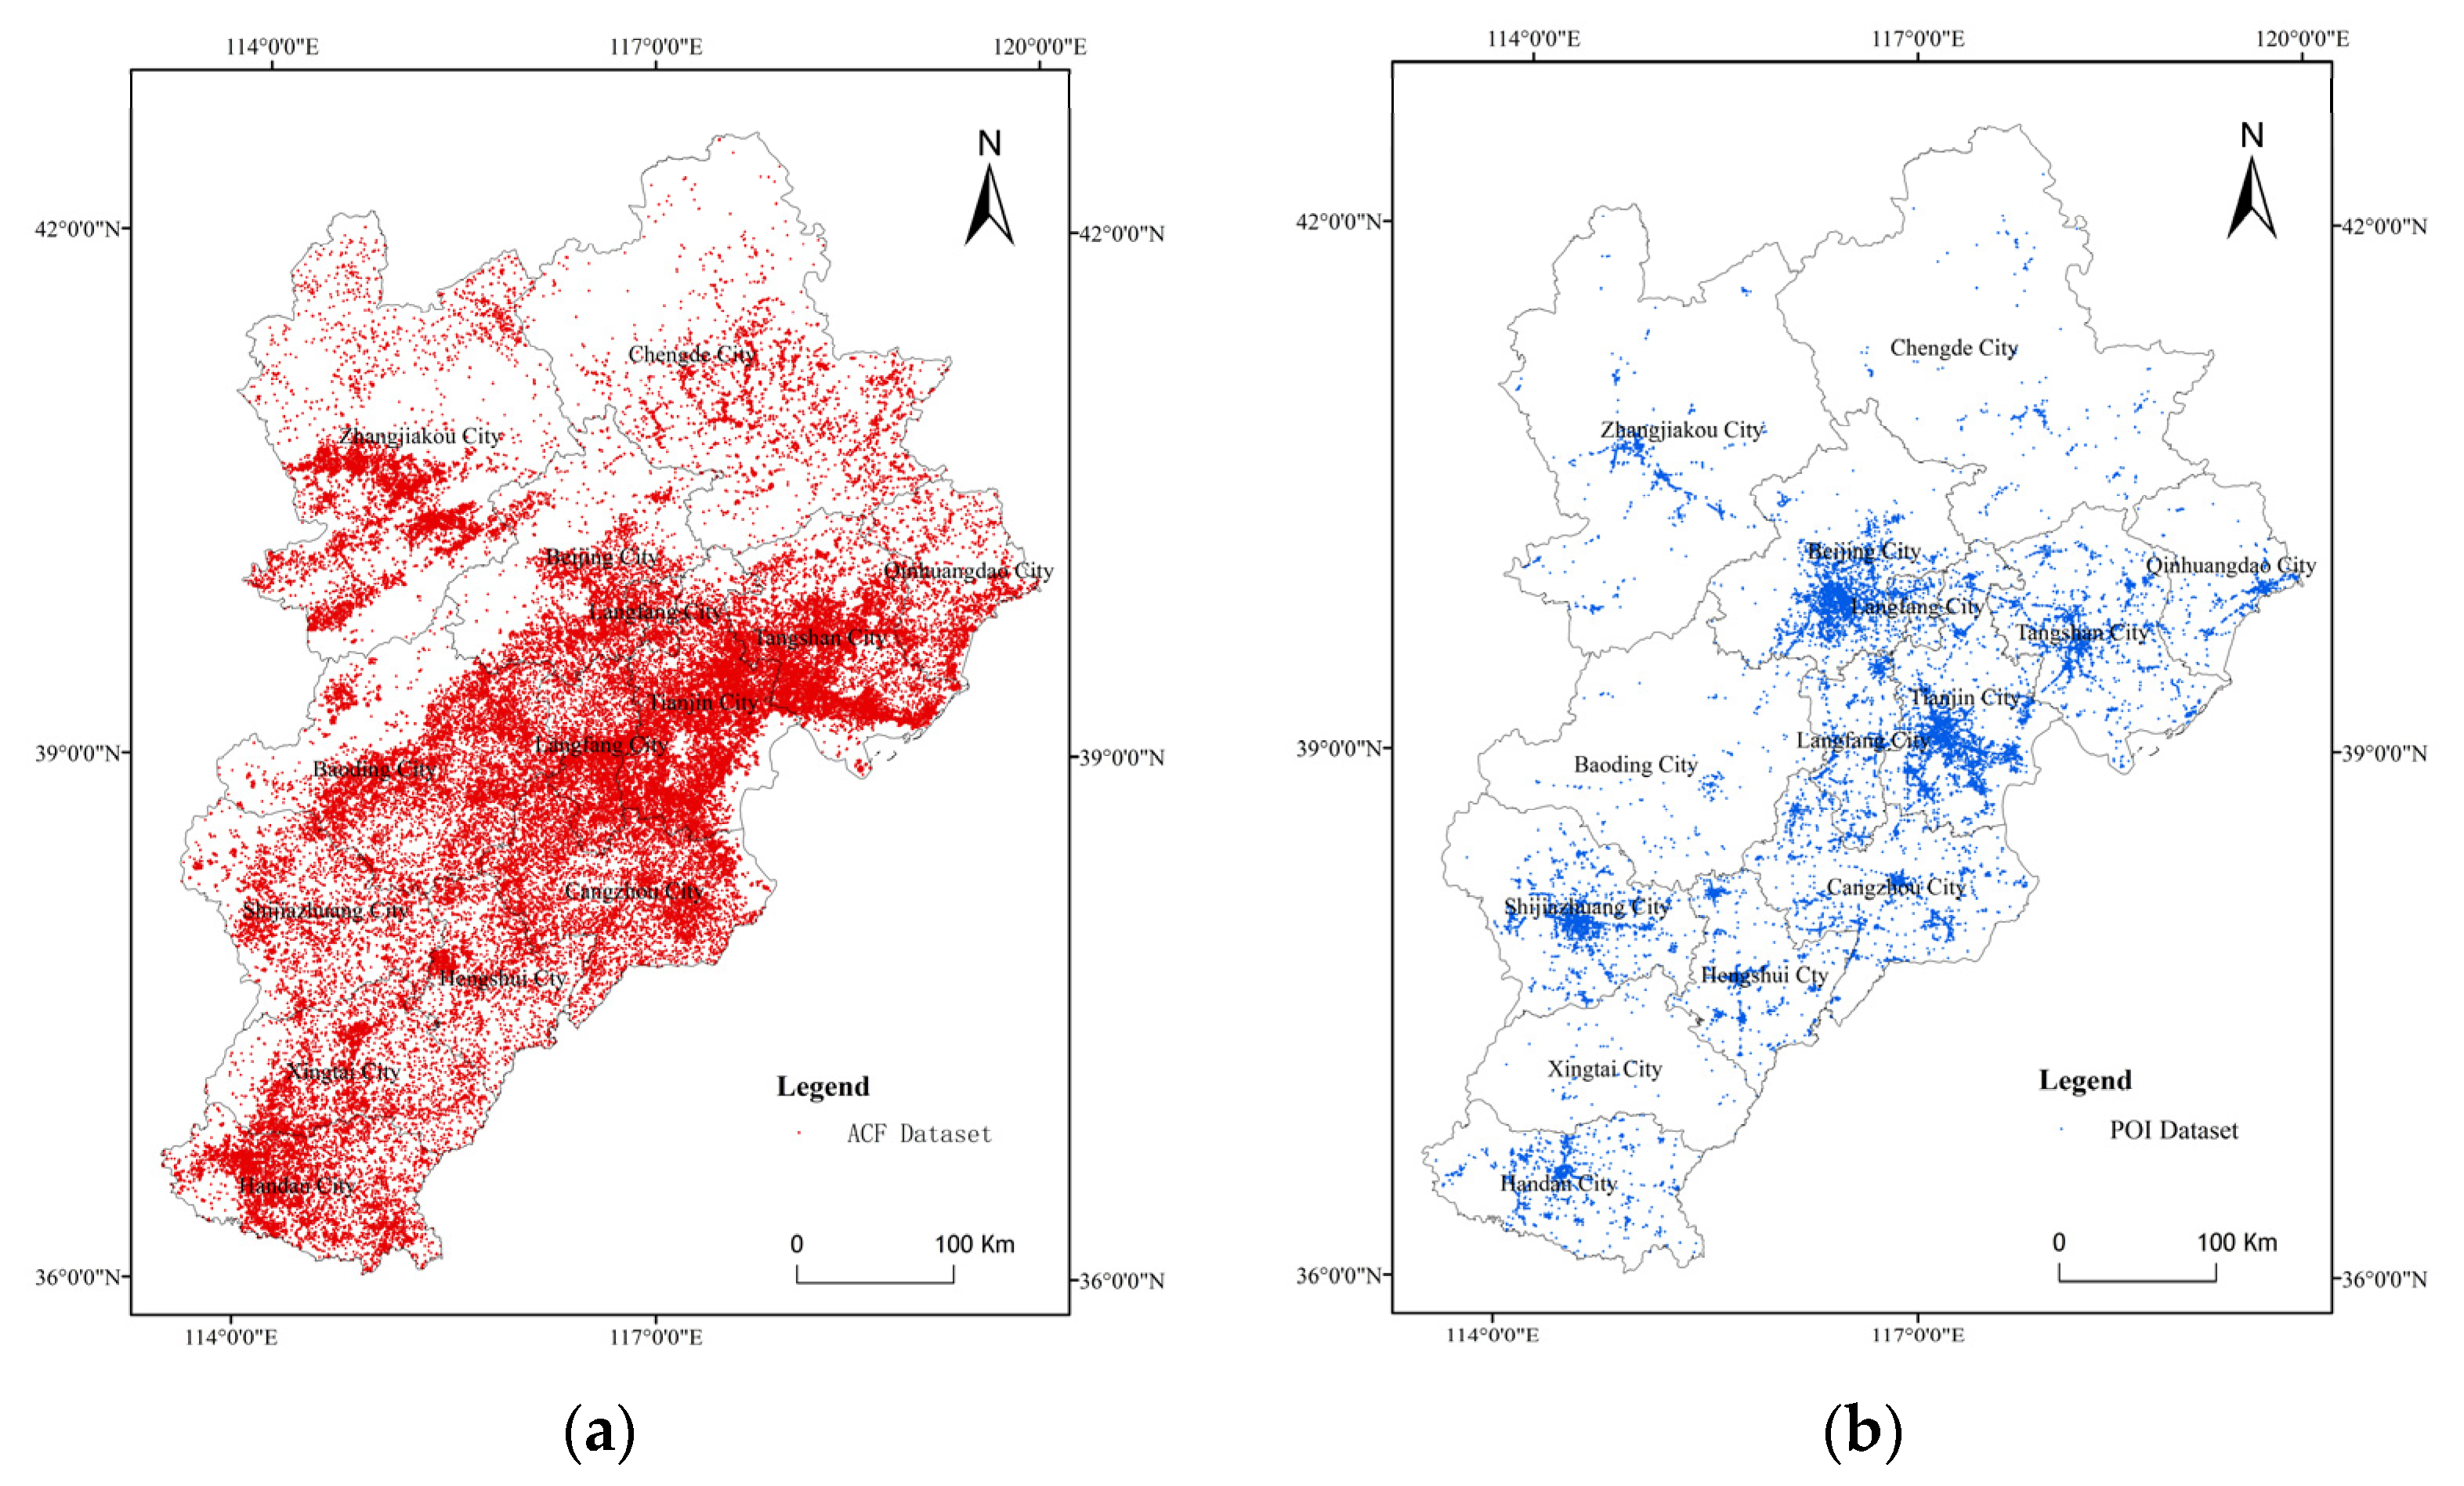
2.2.1. VIIRS Active Fire/Hotspot Data

In this study, 375 m NPP-VIIRS active fire/hotspot data were selected for assessing the distribution and types of industrial heat sources in the BTH region. These data were acquired by the VIIRS (Visible Infrared Imaging Radiometer Suite) sensor on the NOAA-20 and Suomi-NPP (Suomi National Polar-orbiting Partnership) satellites. The Suomi-NPP satellite was launched in October 2011 and became fully operational on 19 January 2012. The VIIRS sensor can be used to monitor anomalous fire sites. The sensor’s spatial resolution of 375 m complements MODIS (Moderate Resolution Imaging Spectroradiometer) fire point data. The VIIRS outperforms other sensors in its ability to detect fires covering relatively small areas: It can recognize thermal anomalies with temperatures of up to 1800 K covering an area of 0.001 m2 and provides improved mapping of larger fires. The sensor also has improved nighttime performance and an increased ability to recognize thermal anomalies in the daytime [10].
We downloaded active fire point data (ACF) covering the period from 20 January 2012 to 31 December 2021 (a total of 505,840 entries) from NASA’s FIRMS (The Fire Information for Resource Management System) website (Figure 2) [30]. As can be seen from Figure 2, the spatial distribution of active thermal anomalies in the BTH region is characterized by local concentrations of anomalies, mainly in the southcentral part of the region, with the most intensive concentrations being in the cities of Tangshan, Tianjin, and Handan.

2.2.2. Auxiliary Data

The WGS_1984_UTM_Zone_50 N projection coordinate system was used for spatial calculation and analysis. Information about the administrative divisions in the BTH region for mapping was obtained from the 2012 data produced by the National Geographic Center based on the GCS_WGS_1984 geographic coordinate system. The Point of Interest (POI) data were downloaded from the National POI Information Database at http://www.poilist.cn/ (Figure 2) (accessed on 31 December 2021) [31]. High-resolution remote sensing data (0.5 m) obtained from Google Earth were used for the validation of the results.

2.3. Identification and Classification of Industrial Heat Sources Based on Active Fire Point Density Segmentation

A total of 474 industrial heat source objects were identified in this study; the methods used to identify and classify these heat sources are described in this section. The processing of the thermal anomaly data and other data consisted of the steps shown in Figure 3.

2.3.1. Data Preprocessing

In this study, NPP-VIIRS active fire/hotspot data acquired from the NASA FIRMS website were used. First, active thermal anomaly data covering the period from 20 January 2012 to 31 December 2021 were downloaded. These were then cropped to fit them to the area covered by the BTH region. Finally, the data were processed according to the administrative divisions within the study region.

2.3.2. Identification of Industrial Heat Source Objects in the BTH Region Based on an Improved Adaptive K-Means Algorithm

In this study, we adopted the improved k-means method proposed by Ma [10] for identifying industrial heat sources from the active thermal anomaly data of the BTH region. This algorithm provided the initial heat source object with an initial partitioning method (such as minimum size and the number of fire points). The heat source object was partitioned iteratively so that each improved partitioning scheme was better than the previous one until a heat source object satisfied the final partitioning condition. Details of the main steps in this process are described below.
Step 1: Segmentation of the long time-series of thermal anomaly data using the improved adaptive k-means algorithm on a county-by-county basis. The set of heat source objects was defined as O i k ( k = { 1 ,   2 ,   3 , , C 0 } , i = { 1 ,   2 ,   3 , , C 1 } ), with C 0 , the initial number of heat source objects, set to 2 based on empirical considerations. C 1 was set to the number of active fire/hotpots data. The threshold for the minimum height and width of a heat source object, B0, was set to 800 m based on experience. Due to the internal variability of the data, outliers can be generated within each heat source object. For each heat source object, the outliers were removed using the triple standard deviation method to produce the preliminary heat source object.
Step 2: Calculation of the intersection rate for each heat source object and the nearest heat source object using the topological association combination model. After this was calculated, multiple heat source objects were merged into one if the intersection rate was greater than 50% and the maximum width and height of the intersecting heat source objects were less than B 0 .
Step 3: Identification of industrial heat source objects based on threshold segmentation. The multi-source features extracted from the heat source objects were analyzed, and an industrial heat source object identification model based on threshold segmentation was constructed. This was subsequently used to identify industrial heat source objects in the BTH region.
Based on these three steps, the 505,840 thermal anomalies that were found earlier were segmented into 493 industrial heat source objects.

2.3.3. Classification of Industrial Heat Source Objects in the BTH Region Using Integrated Multi-Source Information

The industrial heat source objects were classified by overlaying POI datasets and high-resolution image data on the heat source objects that were identified. The main steps in this process were as follows.
Step 1: Based on the keywords listed in Table 1, the POI data were filtered using the category “Company Enterprise”. These data were then overlaid with the high-resolution remote sensing images of the BTH region. Finally, 18,464 valid POI data were obtained.
Step 2: The POI data were converted to vector format and spatially connected to the industrial heat source objects to provide
F ( i , j ) = O ( i , m ) j = 0 n Q t .
where F ( i , j ) ( i = { 1 ,   2 ,   3 , , 493 } , j = { 0 , 1 ,   2 ,   3 , , n } ) represents the jth POI datum corresponding to the ith industrial heat source and O ( i , m )   ( i = { 1 ,   2 ,   3 , , 493 } ) represents the m kilometer buffer created by the ith industrial heat source; based on the general size of large industrial enterprises in China, m was set to 5 in this study. Q t   ( t = { 1 ,   2 ,   3 , , 18,464 } ) represents the POI data contained within O ( i , m ) .
Step 3: The data for which j = 0 were removed from the dataset, and the industrial heat source objects were classified into five categories: cement plants, steel plants, coal chemical industry, oil and gas developments, and other; this classification was based on the broad industrial classification standards used in China and the distribution of the active thermal anomalies. The preliminary classification of industrial heat source objects was realized based on the keywords shown in Table 1.

2.3.4. Validation of the Identified Industrial Heat Source Objects and the Classification Results

The remote sensing image characteristics of the five categories of industrial heat source objects are as follows. Examples of each type of object are also shown in Figure 4.
(1)
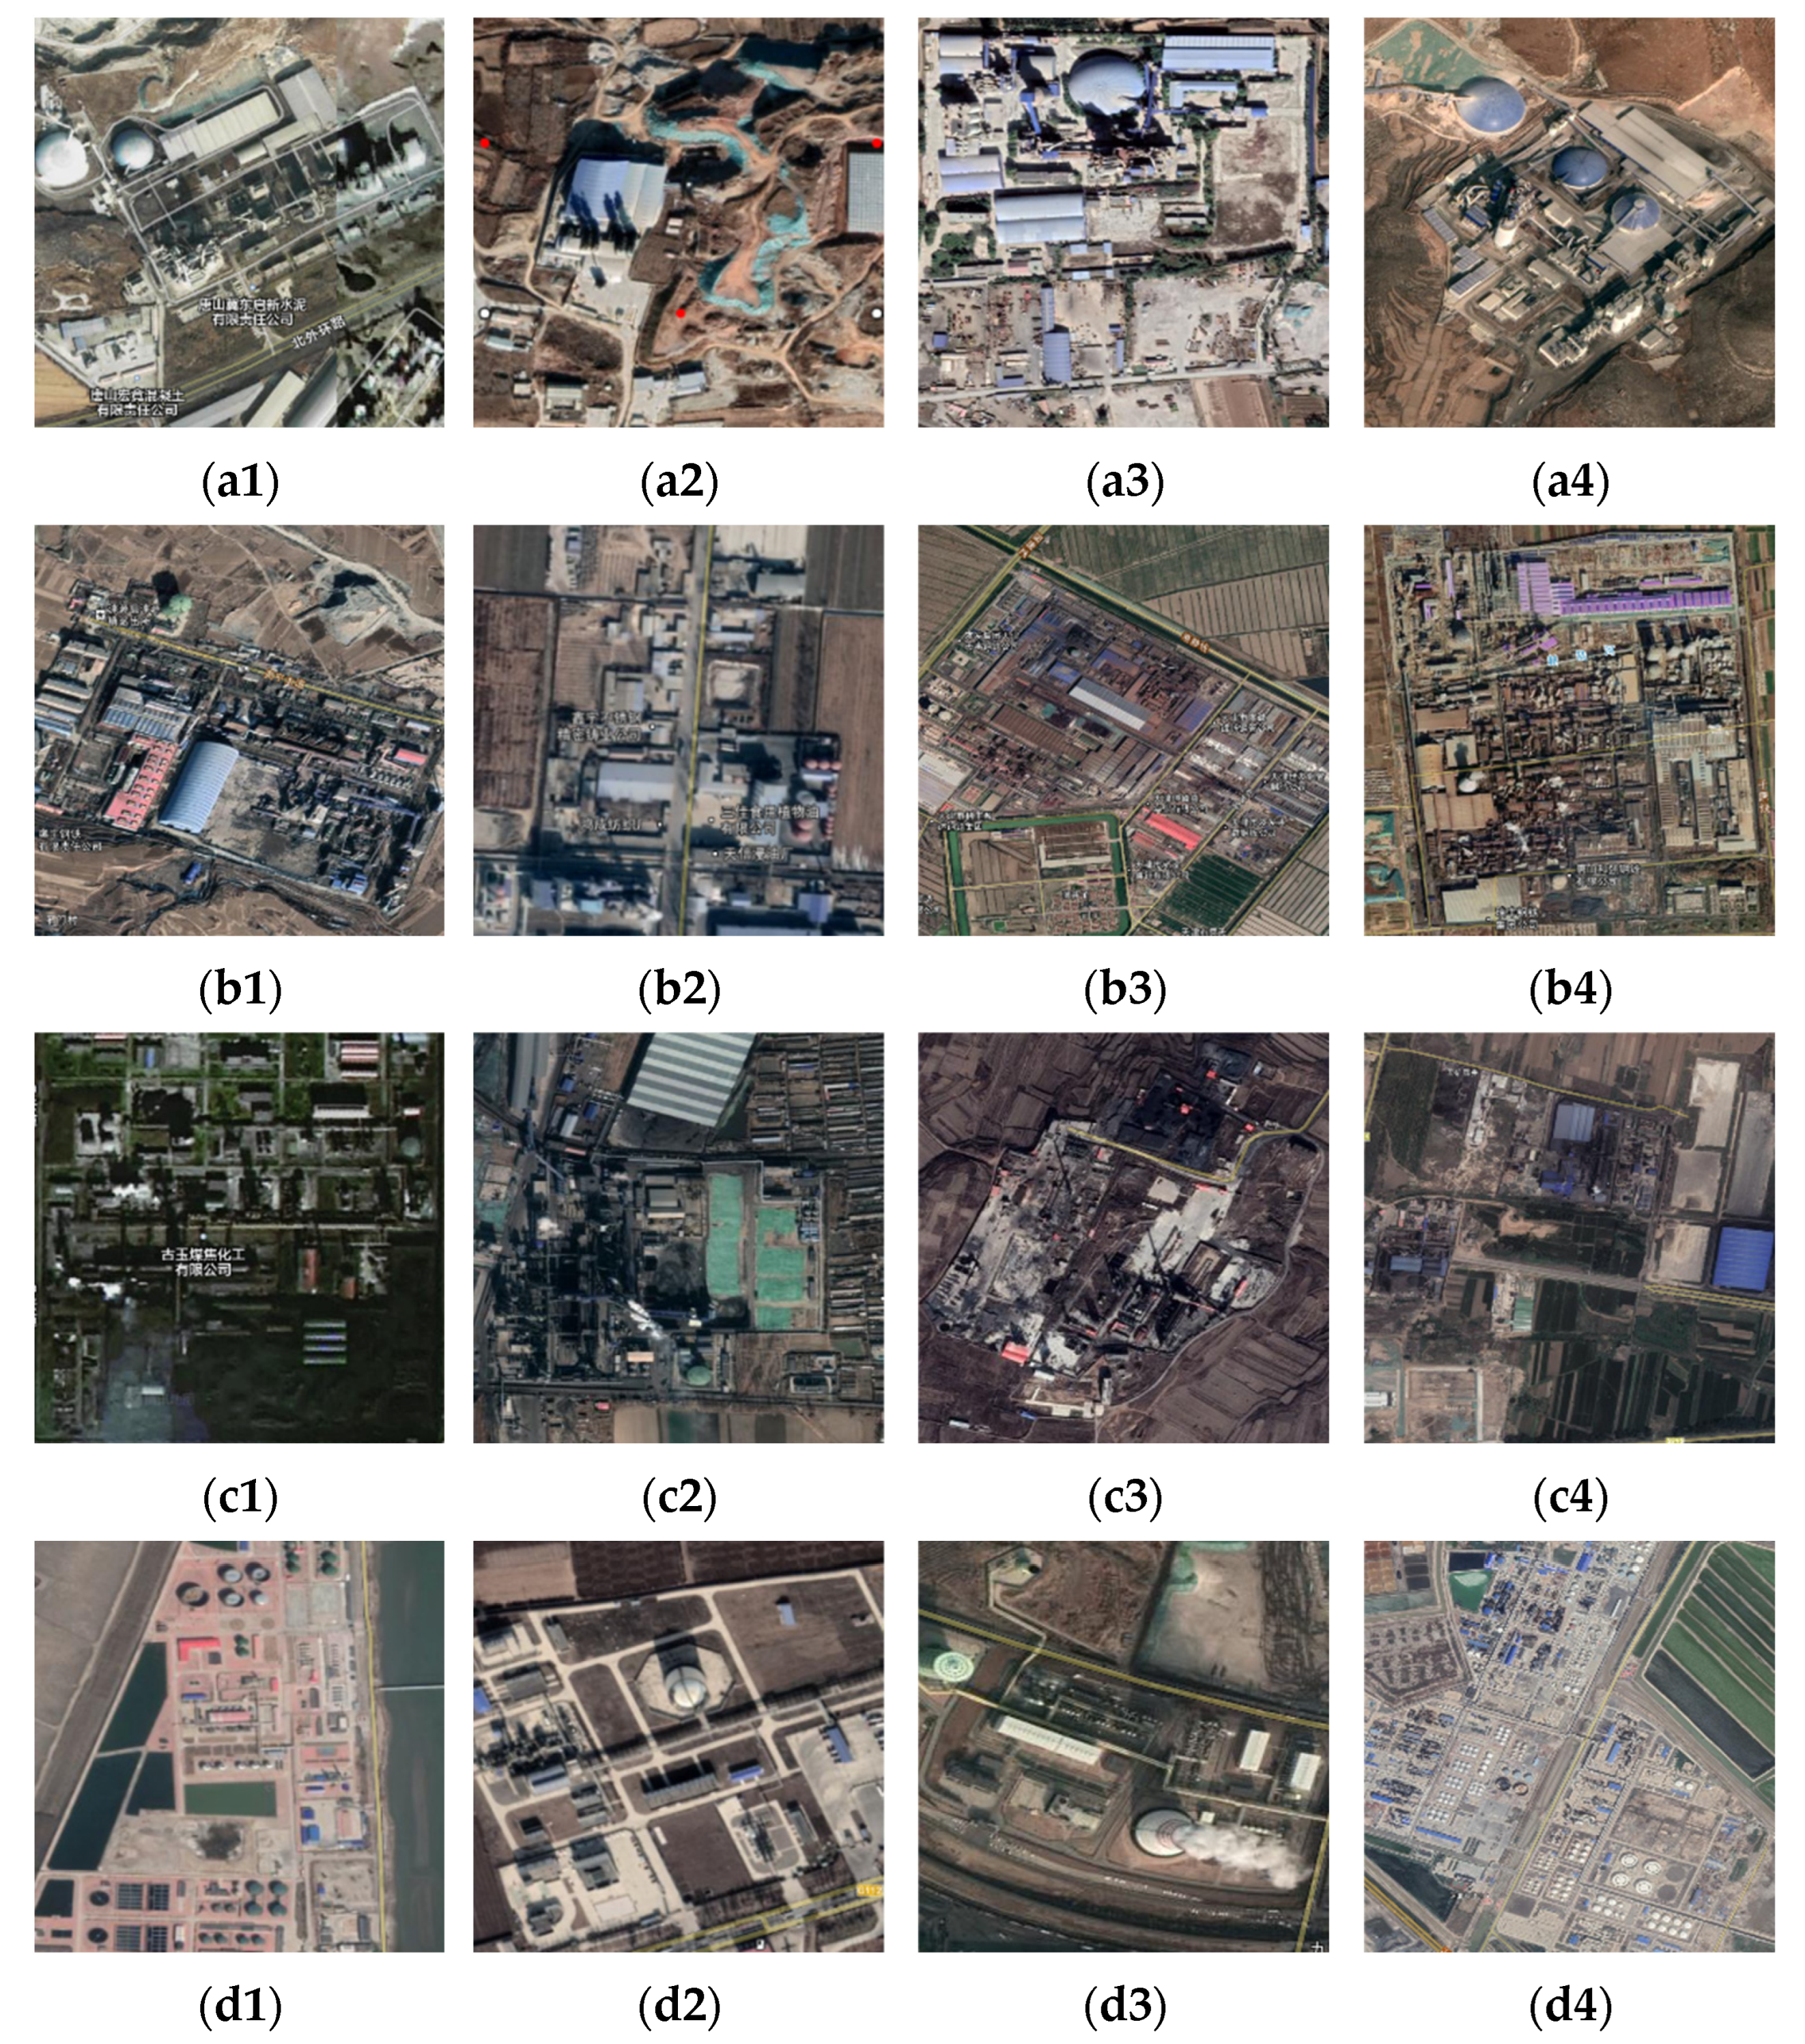
Objects belonging to the cement plant category are mostly found in mountainous areas and include long rotary kilns, dome-shaped raw material pre-homogenization pile units, and material delivery belts.
(2)
Objects belonging to the steel plant category include steel manufacturing and casting facilities that have obvious steel-frame structures, as well as blast furnaces and gas tanks.
(3)
The coal and chemical industry category includes coal kilns and coal stockpiles, with black areas corresponding to coal stockpiles or obvious signs of excavation.
(4)
Objects belonging to the oil and gas development category are generally located away from residential areas and include surface oil and gas platforms, oil wells, and oil and gas pipelines.
(5)
The objects belonging to the “other” category, include objects where the type of heat source object cannot be identified because of missing POI data or because the resolution of the remote sensing images is insufficient. This category also includes objects that do not belong to any of the above categories that are too small to be assigned to another category.
The identified and classified industrial heat source objects found in the BTH region were overlaid onto Google Earth imagery. The classification results were verified based on the characteristics of various types of industrial heat sources in remote sensing imagery; historical remote sensing imagery was also used to track the operation of plants and mines each year during the study period. Field visits were made to verify the identification of individual objects in areas where up-to-date remote sensing imagery was not available.

2.3.5. Evaluation of the Factors Influencing the Number of Industrial Heat Sources Based on OLS Regression Model

There are many factors that can affect the number of industrial heat sources in a particular region. In this study, the number of industrial heat sources was used as the explained variable, and the level of energy consumption (EC), strength of environmental regulation (ER), degree of openness to the outside world (OP), enterprise sizes (ES), and Research and Experimental Development intensity(RD) were taken as explanatory variables in analyzing the relationship between the number of industrial heat sources and economic and environmental indicators in the BTH region. The econometric regression model that was used can be expressed as
I H i t = α + β 1 E C i t + β 2 E R i t + β 3 O P i t + β 4 E S i t + β 5 R D i t + ε ,
where the subscripts i and t represent the study area and year, respectively; α represents the intercept; β represents the regression coefficient for each variable; and ε is the residual term. The explanatory variables are described below.
The energy consumption level (EC) is the primary indicator representing energy consumption as well as the status of energy conservation and reduction in consumption. In this study, the energy consumption value per unit of GDP (tons of standard coal/10,000 CNY) was used to represent the energy consumption level. The environmental regulation (ER) variable reflects the extent to which various environmental protection policies have been implemented; in this study, the ratio of the completed investment in industrial pollution control to the GDP of the secondary industry was used to represent this. Openness to the outside (OP) indicates the degree of openness of the economy and market; here, this was represented by the ratio of total exports and imports to the total GDP. The enterprise scale (ES) relates to the concentration of production factors and products and can be expressed as the number of energy-intensive enterprises. Finally, the R&D intensity (RD) reflects the level of technological innovation of enterprises; in this study, the share of total GDP accounted for by R&D investment was used to represent this.
Most of the data relating to the indicators used in the regression model were obtained from the Beijing Statistical Yearbook, Tianjin Statistical Yearbook, and Hebei Statistical Yearbook [32,33,34]. The IH and ES variables were processed logarithmically to eliminate the effects of heteroskedasticity. Since the above data are short panel data, an OLS regression model was selected for the regression analysis.

3. Results

3.1. Analysis of the Results of the Industrial Heat Source Identification in the BTH Region

A total of 493 industrial heat source objects were initially identified in this study; the spatial distribution of these objects is shown in Figure 5a. Following the manual verification of the objects using Google Earth imagery and field surveys, the number of objects verified as being industrial heat sources was 474 (Figure 5b), giving an accuracy rate of 96.14%. Of the 19 unverified objects, 31.58% were in Beijing, 52.63% were in Hebei, 15.79% were in Tianjin; these were mainly enterprises that were in operation before 2017 that have since been demolished and rebuilt and for which no historical remote sensing images were available, making it difficult to check the original sources. The spatial distribution of industrial heat source objects in the BTH region exhibits a “local aggregation” pattern: The objects are clustered in the southcentral part of the BTH city cluster; that is, in the Tangshan–Tianjin region and around to the mountains in the Baoding–Shijiazhuang–Xingtai–Handan region. The city of Tangshan has the highest concentration of industrial heat sources in the study region, accounting for about 36.92% of all the identified heat sources. Due to the topography and urban nature of the area, there are few industrial heat source objects in Beijing and the surrounding areas.

3.2. Analysis of the Results of the Industrial Heat Source Object Classification in the BTH Region
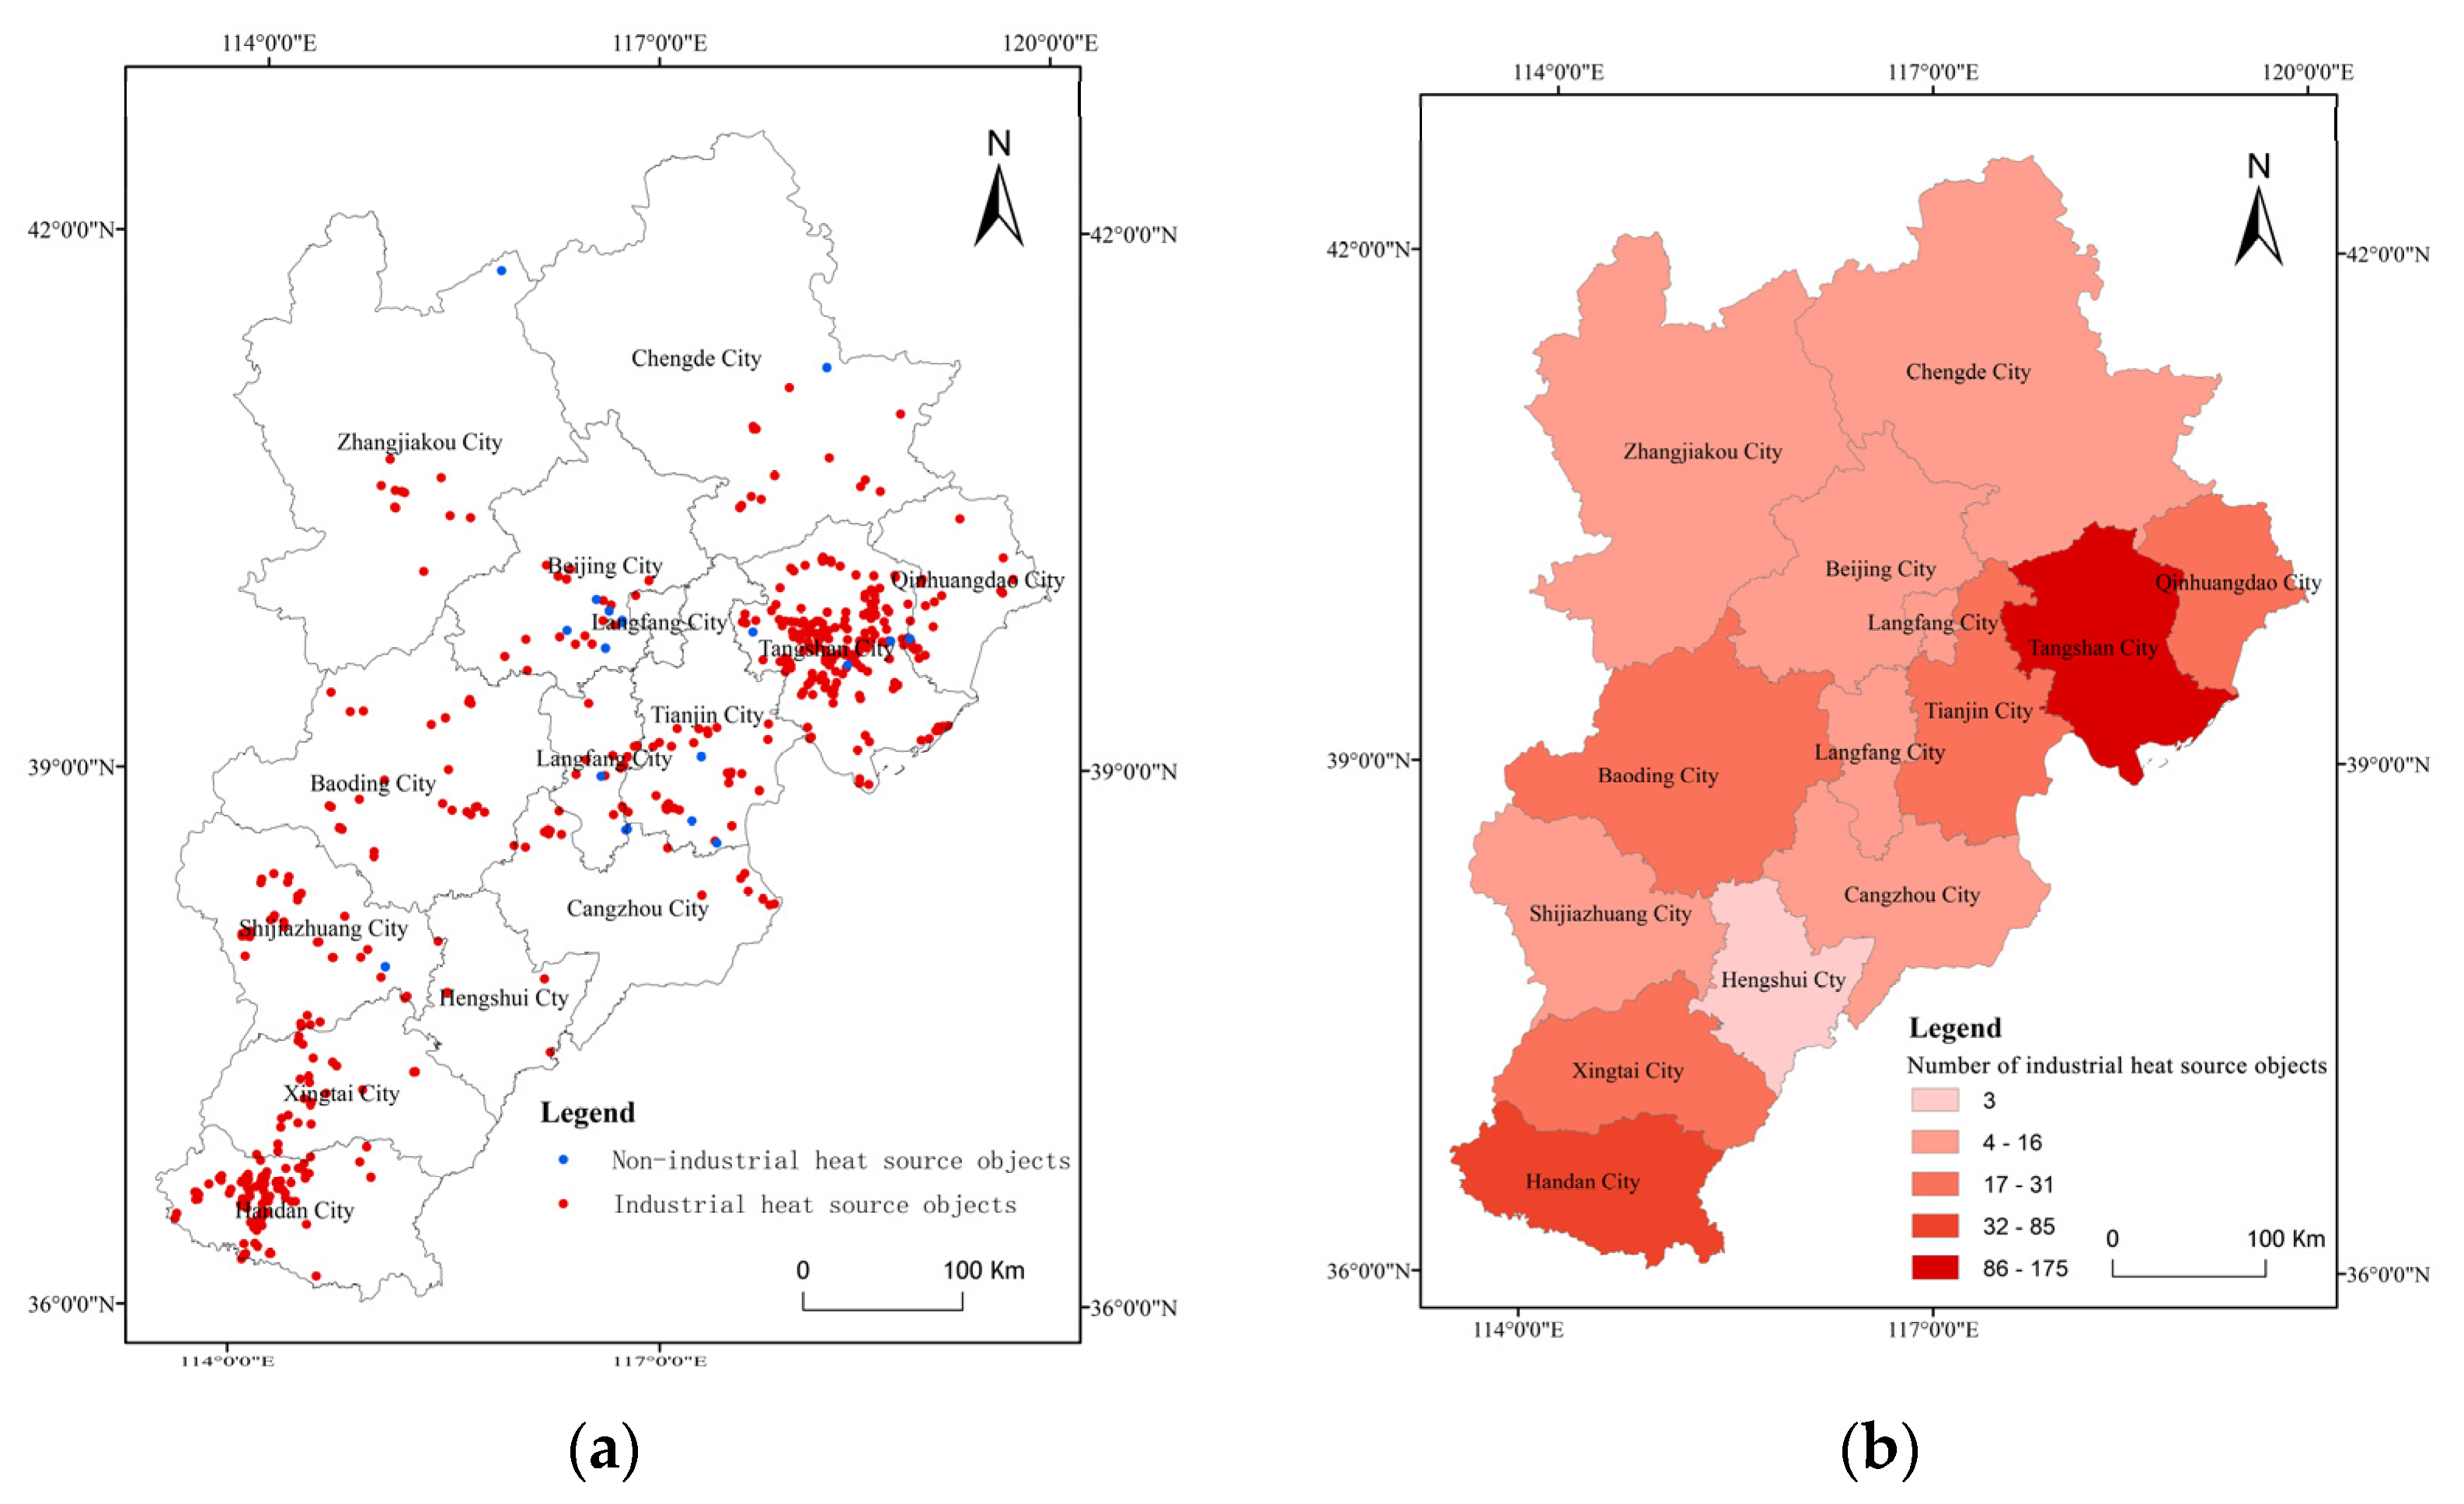
The 474 industrial heat source objects that were identified (see Section 3.1) were classified as belonging to one of the following categories: cement plants, steel plants, coal and chemical industry, oil and gas developments, and other. We used keyword-based analysis and field verification. The spatial distribution of the classified objects is shown in Figure 6. From the Figure, it can be seen that:
(1)
Of the 474 objects, 255 (53.80%) belong to the steel plant category; the biggest concentration of these is found in the cities of Tangshan and Handan.
(2)
One hundred and three (21.73%) of the objects were classified as cement plants; these are concentrated in the cities of Tangshan and Shijiazhuang.
(3)
There are 60 heat sources related to the coal and chemical industry (12.66% of the total), mainly in Tangshan, Shijiazhuang, and Handan; 37 heat sources (7.81%) classified as being related to oil and gas developments, mainly in Tangshan, Shijiazhuang, and Cangzhou; and 19 heat sources (4.01%) classified as “other”, mainly in Qinhuangdao and Handan.

3.3. Analysis of the Operation of Industrial Heat Sources in the BTH Region during the Period 2012–2021

The BTH region is located within China’s capital economic zone and performs particular functions and exhibits particular modes of development. Under the influence of policies such as “adjusting structure and removing production capacity”, some factories have been converted to other uses or closed down. In this study, in order to accurately analyze the operation of industrial heat source objects in the study region using time-series of data, we analyzed the changes related to the 474 industrial heat source objects that were identified over the 2012–2021 period.
Figure 7a shows the number of active industrial heat source objects in the BTH region each year during the 2012–2021 period. From this, it can be seen that:
(1)
Overall, the number of active industrial heat source objects in the BTH region first rises and then falls, with the number of objects reaching a peak in 2013.
(2)
The number of active industrial heat source objects was lowest in 2021 when there were only 238. This constitutes a decrease of 39.13% compared to the number in 2013 (391).
By overlaying the annual thermal anomaly data with details of the industrial heat source objects, it was found that a total of 377 industrial heat source objects (79.54% of the total) were continuously active between 2012 and 2021. This means that there were no years during this period when the number of thermal anomalies was zero, indicating a stable temporal and spatial distribution of the industrial heat sources in the study region. Temporal continuity is one of the bases for distinguishing industrial thermal anomalies from anomalies related to the combustion of biomass.
Figure 7b shows the change in the number of objects belonging to each of the five categories of active industrial heat source objects in the BTH region each year during the 2012–2021 period. The following conclusions can be drawn from this analysis:
(1)
The largest number of objects belongs to the steel plant category, followed in order by the cement plants, coal and chemical industry, oil and gas developments, and “other” categories. The number of objects belonging to the cement plants, steel plants, and oil and gas development categories all tended to first increase and then decrease, reaching peaks in 2013, 2013, and 2017, respectively. The number of objects belonging to the chemical industry and “other” categories decreased throughout the study period. This is a result of constraints on coal mining and the effect of national environmental policies.
(2)
Of the categories shown, the greatest decline in the number of objects between 2013 and 2021 is for the steel plant category—a decline from 215 to 128, or 40.47% The next biggest decline is for the coal and chemical industry category (40.38%).
(3)
Overall, during the 2012–2021 period, the number of identified industrial heat source objects belonging to the cement plant, steel plant, coal and chemical industry, oil and gas development, and “other” categories decreased by 31.40%, 37.56%, 42.59%, 13.04%, and 100%, respectively, illustrating the effects of China’s supply-side reforms and the results achieved.
From the table showing the changes in the number of active industrial heat source objects in each city in the BTH region each year from 2012 to 2021 (Table 2), the spatial distribution of industrial heat sources during the same period (Figure 7c,d), and the table showing the changes in the number of industrial heat sources in each city (Table 3), the following can be seen.
(1)
With the exception of Chengde and Hengshui, where there was a slight increase, the number of active industrial heat sources in the 13 prefecture-level cities in the BTH region during the period 2012–2021 showed a decreasing trend.
(2)
The most significant decline in the number of active industrial heat sources in 2021 compared with 2012 (76.92%) was in Beijing, followed by Langfang (66.67%); the number in Baoding and Xingtai also fell be more than 50%.

3.4. Analysis of the Factors Influencing the Number of Industrial Heat Sources in the BTH Region

As mentioned in Section 2.3.5 the number of industrial heat sources detected in this study was taken as the explanatory variable; five features were used as explanatory variables: EC, ER, OP, ES, and RD. The results of this analysis are shown in Table 4.
(1)
The R2 of the OLS regression model was 0.976, which implied that EC, ER, OP, ES, and RD could explain 97.64% of the causes of variation in IH. The model passed the F-test (F = 173.942, p = 0.000 < 0.05), indicating that at least one of EC, ER, OP, ES, or RD affected the relationship of IH. The equation of the econometric regression model is shown as:
I H i t = 887.063 + 295.272 E C i t 442.737 E R i t 124.946 O P i t + 103.796 E S i t + 4429.940 R D i t + ε ,
(2)
The regression coefficient value of EC was 295.272 and showed a 0.01 level of significance (t = 5.362, p = 0.000 < 0.01), implying that EC has a significant positive effect relationship with IH. The regression coefficient value of ER was −442.737, but it did not show significance (t = −0.154, p = 0.879 > 0.05), implying that ER does not have an effective relationship with IH. The regression coefficient value of OP was −124.946 and showed a 0.01 level of significance (t = −5.139, p = 0.000 < 0.01), implying that ER does not have an effective relationship with IH. The regression coefficient value of OP was −124.946 and showed a 0.01 level of significance (t = −5.139, p = 0.000 < 0.01), implying that OP has a significant negative effect on IH. The regression coefficient value of ES was 103.796 and showed a 0.01 level of significance (t = 3.435, p = 0.002 < 0.01), implying that ES has a significant positive effect relationship with IH. The regression coefficient value of RD was 4429.940 and showed a 0.01 level of significance (t = 5.691, p = 0.000 < 0.01), implying that RD has a significant positive effect relationship with IH.

4. Discussion

4.1. Analysis of the Spatial and Temporal Distribution of Industrial Heat Sources and Influencing Factors in the Beijing–Tianjin–Hebei Region

The number of industrial heat sources in the Beijing–Tianjin–Hebei region changed considerably in the last decade. From the perspective of the time dimension, since September 2013, when the State Council issued the Action Plan for the Prevention and Control of Air Pollution, pointing out that “adjusting and optimizing the industrial structure and promoting industrial optimization and upgrading,” China has actively implemented industrial transformation and upgrading and industrial restructuring. After the supply-side reform was proposed in 2015, the number of industrial heat sources decreased steadily from 2015 to 2017. Due to the continuous promotion of environmental policies such as ecological civilization construction and “structure adjustment and capacity removal,” the decline in the number of plants in different categories accelerated significantly after 2017. The outbreak of COVID-19 in 2020 also had a significant impact on society. Thus, the 244 industrial heat sources in operation in 2019 and 2020 were analyzed to evaluate the effect of COVID-19 on the operating status of industrial heat sources in the Beijing–Tianjin–Hebei region. The total active fire point data of all 244 industrial heat sources in 2020 decreased by 5.03% compared to 2019. However, there are 119 (48.77%) industrial heat sources, the number of which are increased and decreased by active fire point data. The results show that COVID-19 had little impact on the operation of industrial heat sources in the Beijing–Tianjin–Hebei region.
From the perspective of the spatial dimension, the number of industrial heat sources declined the most in Beijing and Langfang. This is consistent with the “four centers” development plan for Beijing, in which most of the traditional heavy industry is to be transferred to the surrounding areas of Tianjin and Hebei. The northwestern part of Hebei is divided into ecological protection and eco-industrial development zones; this is intended to promote environmental improvement and reduce the amount of energy-intensive industry. At the same time, Tangshan, Handan, and other traditional industrial cities are also promoting industrial transformation, eliminating outdated production capacity, and optimizing their industrial facilities.
From the perspective of economic indicators, it can be seen that EC has a significant positive effect on the number of industrial heat sources, indicating that the implementation of the “double control” policy led to a reduction in energy consumption and the number of industrial heat sources throughout the study period. ER has no significant effect on the number of industrial heat sources according to this model, probably because industrial pollution in the BTH region is mainly concentrated in a specific period for centralized treatment, which does not correspond to the temporal characteristics of industrial heat sources. The OP has a significant negative impact on industrial heat sources: The study region’s increased openness to the outside world has led to the introduction of advanced foreign environmental measures by energy-intensive enterprises and, in turn, to a reduction in the number of industrial heat sources. There is a strong positive correlation between the IS and the number of industrial heat sources. Policies promoting the transfer of industry have resulted in a reduction in the number of energy-intensive industries in the BTH region and a corresponding fall in the number of industrial heat sources. RD promotes innovation and a shift in industrial production from high quantity to high quality, and this has a significant impact on the number of industrial heat sources.
These results are generally consistent with findings concerning the relationship between “green” innovation and the environmental regulation of energy-intensive industries in the BTH region [35], which indicate that the number of industrial heat sources is, to some extent, affected by environmental innovation by energy-intensive industries. To further study the correlation between industrial heat sources and ER, more data related to environmental changes are needed.

4.2. Comparative Analysis with Identification of Industrial Heat Source Objects Based on Nighttime Thermal Data
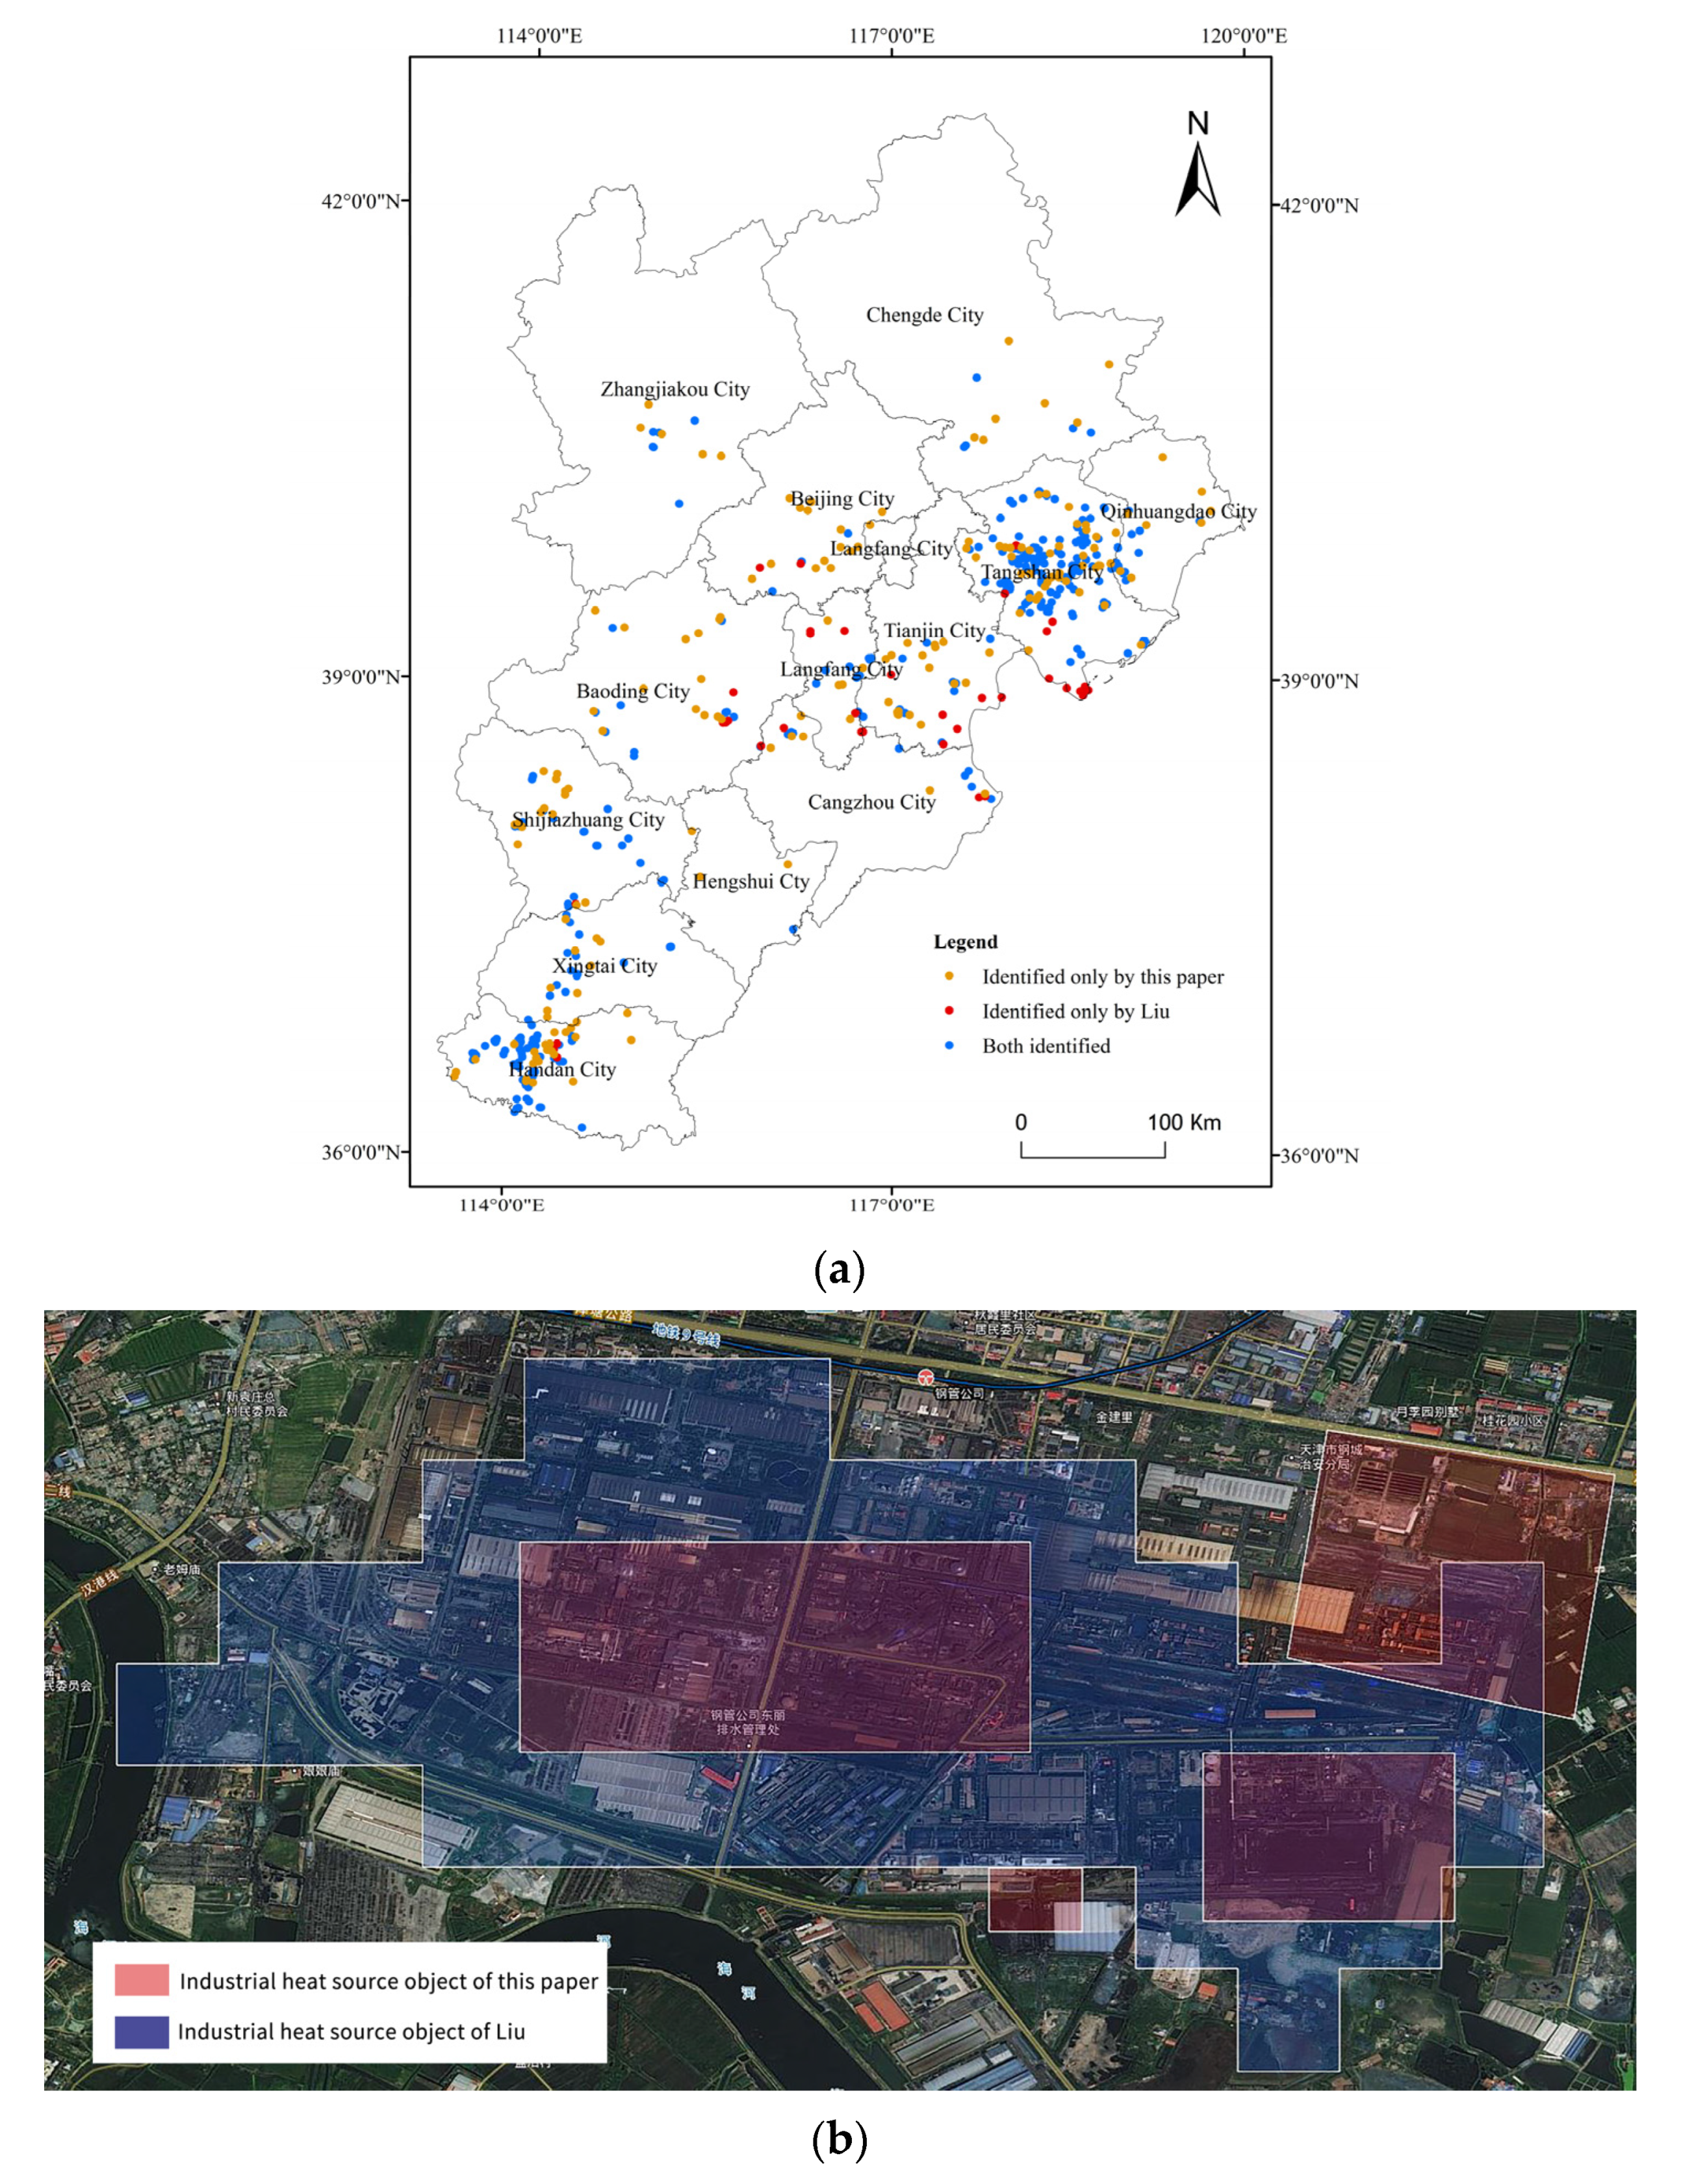
The 459 industrial heat source objects that were identified as active during the 2012–2017 period were compared with industrial heat source objects identified using nighttime thermal data [24] from the same time period. Using nighttime thermal data for the BTH region, 264 industrial heat sources were identified; the spatial distribution of these objects is shown in Figure 8a. It can be seen that:
(1)
The number of industrial heat source objects identified using the method described in this paper is 73.86% greater than the number found using the nighttime thermal data.
(2)
In terms of spatial coverage, 84.09% (222) of the heat source objects identified using the thermal data overlap with the objects identified in this study; conversely, 63.18% (290) of the heat source objects identified in this study overlap with the objects identified using the thermal data, which means that the method described in this paper produces results with a higher spatial resolution.
(3)
After superimposing the identified heat sources on high-resolution remote sensing images, the industrial heat sources corresponding to plants and mines that were identified in this study have a finer minimum granularity. This greatly reduces the number of instances of “one industrial heat source object covering multiple industrial plants and mines” in the identification based on nighttime thermal data (Figure 8b).
(4)
Smaller-scale industrial heat sources were extracted using the method described in this paper. These results provide a finer description of industrial zones, better coverage, and better identification of industrial heat sources by category (Table 5).
The advantages of this study method over industrial heat source objects identified using nighttime thermal data were as follows:
(1)
The source thermal data were different. ACF (active fire data) was used in our study rather than nighttime thermal data. Compared with nighttime thermal data, ACF contained enough daytime and nighttime thermal data to improve temporal resolution. Furthermore, the spatial resolution (375 m) of ACF was higher than the nighttime thermal data (750 m).
(2)
The industrial heat source object detection models were different. The industrial heat source identification method using nighttime thermal data needs to rasterize those fire vector data. It makes it so that many different but spatially proximate objects cannot be distinguished (multiple industrial heat source entities in one industrial heat source object). In our study, a density segmentation method based on vector data was adopted to avoid the above problem.

5. Conclusions

In order to accurately determine the location of industrial heat sources and monitor the progress made in energy conservation and emission reduction by energy-intensive industries, NPP-VIIRS active fire/hotspot data, having some of the highest spatial and temporal resolutions among current continuous global thermal anomaly products, were used in combination with POI data in this study. Then, a new classification of industrial heat source objects model based on active fire point density segmentation and spatial topological correlation analysis was put forward. Finally, the accurate identification and classification of industrial heat source objects in the BTH region were carried out. The experimental results were then compared with those for the identification of industrial heat sources based on nighttime thermal data. Following this analysis, the following conclusions were drawn:
(1)
In this study, out of 505,840 thermal anomalies found in the BTH region during the 2012–2021 period, 493 were extracted from the data as industrial heat source objects. The manual verification of these results confirmed that 474 of these objects did, in fact, correspond to industrial heat sources, an identification accuracy of 96.14%. A comparison between these results and results based on nighttime thermal showed that the number of industrial heat source objects identified using the method developed in this study was higher than the number identified using nighttime thermal data and that much smaller objects could be detected using the former method.
(2)
The verified industrial heat source objects were classified into five categories: cement plants, steel plants, coal and chemical industry, oil and gas, and other, which accounted for 21.73%, 53.80%, 12.66%, 7.81%, and 4.01% of the objects, respectively. The results of this categorization were found to be more accurate than one based on nighttime thermal data.
(3)
During the 2012–2021 period, the number of active industrial heat sources in the BTH region tended to first increase and then decrease, with the number of objects being highest in 2013 and then reducing in each subsequent year. In 2021, the number of active industrial heat sources was 153 lower than in 2013, a decrease of 39.13%. The number of objects in the cement plant, steel plant, coal and chemical industry, oil and gas development, and other categories fell by 31.40%, 37.56%, 42.59%, 13.04%, and 100% during the period 2013–2021.
(4)
From the regression analysis of the number of industrial heat sources using the five econometric data categories of EC, ER, OP, ES, and RD, it can be seen that EC, OP, ES, and RD all showed a 0.01 level of significance with the number of industrial heat sources.
The research results showed that our new method can significantly improve the identification accuracy and deal with the problem of low identification granularity in previous studies. It can be used to monitor the scale and operation of energy-intensive industries on a regional scale. However, it should be noted that there are problems due to missing data in the thermal anomaly data as a result of the weather conditions, geographic environment, ground cover, and satellite data. To address these problems, in future work, we will focus on the spatiotemporal fusion of thermal anomaly data to construct industrial heat source datasets that have more accurate information parameters.

Author Contributions

Conceptualization, C.M.; methodology, C.M.; software, C.M.; validation, C.M. and X.S.; formal analysis, Y.X. and T.L.; investigation, X.S.; resources, C.M.; data curation, X.S.; writing—original draft preparation, C.M. and X.S.; writing—review and editing, Y.Z.; visualization, X.S. and P.Z.; supervision, Y.Z. and J.Y.; project administration, Y.Z.; funding acquisition, C.M. All authors have read and agreed to the published version of the manuscript.

Funding

The Strategic Priority Research Program of the Chinese Academy of Science (grant number XDA19090131), the Youth Innovation Promotion Association of the Chinese Academy of Science (grant number 2021126), and the National Key Research and Development Program of China (grant number 2020YFA0607503).

Institutional Review Board Statement

Not applicable.

Informed Consent Statement

Not applicable.

Data Availability Statement

Available at http://cstr.cn/31253.11.sciencedb.j00001.00430 (accessed on 15 July 2022).

Acknowledgments

The ACF Data were downloaded from the FIRMS website. This research was financially supported by the Youth Innovation Promotion Association of the Chinese Academy of Science (2021126). The authors thank the editors and the three anonymous reviewers for their valuable comments, which helped to improve our manuscript.

Conflicts of Interest

The authors declare no conflict of interest.

Abbreviations

ACFNPP VIIRS 375-m active fire/hotspot data
BTHBeijing-Tianjin-Hebei
POIPoint of Interest data
ECEnergy consumption level
EREnvironmental regulation
OPOpenness to the outside
ISIndustry scale
RDR&D intensity

References

  1. Deng, H.; Xu, B.; Zou, Y. The Economic Logic of China’s Industrialization: From Heavy Industry to Comparative Advantage. J. Econ. Res. 2018, 53, 17–31. [Google Scholar]
  2. Bin, X.; Lin, B. Investigating Spatial Variability of CO2 Emissions in Heavy Industry: Evidence from a Geographically Weighted Regression Model. J. Energy Policy 2012, 149, 112011. [Google Scholar]
  3. Chen, S. Energy Consumption, CO2 Emissions and the Sustainable Development of Chinese Industry. J. Econ. Res. 2009, 44, 41–55. [Google Scholar]
  4. Lei, R.; Sheng, Z.; Tpabc, D.; Xoabc, D. A Review of CO2 Emissions Reduction Technologies and Low-carbon Development in the Iron and Steel Industry Focusing on China. Renew. Sustain. Energy Rev. 2021, 143, 110846. [Google Scholar]
  5. Lin, B.; Tan, R. China’s CO2 Emissions of a Critical Sector: Evidence from Energy Intensive Industries. J. Clean. Prod. 2017, 142, 4270–4281. [Google Scholar] [CrossRef]
  6. IEA: Global Energy Review 2021. Available online: https://www.iea.org/reports/global-energy-review-2021 (accessed on 31 December 2021).
  7. Xue, Y.; Qu, S.; Yan, J.; Song, G.; Zhong, L. Beijing Cement Industry Air Pollutant Emission List and Pollution Characteristics. Int. J. Environ. Sci. Technol. 2014, 37, 201–204. [Google Scholar]
  8. Bo, X.; Zhao, C.; Wu, Y.; Su, Y.; Wang, L.; Tian, J.; Shi, Y.; Luo, M.; Li, S. A study of High Spatial and Temporal Resolution Emission Inventory Methods for the Iron and Steel Industry in Beijing, Tianjin and Hebei Regions. China Environ. Sci. 2015, 35, 2554–2560. [Google Scholar]
  9. Li, X.; Wang, X.; Liu, Z.; Wu, L.; Weng, Y.; Hu, J. Ningbo Human-caused VOC List and Contribution Analysis of Key Industrial Sectors. Environ. Sci. 2014, 35, 2497–2502. [Google Scholar] [CrossRef]
  10. Ma, C.; Yang, J.; Chen, F.; Rui, G. Assessing Heavy Industrial Heat Source Distribution in China Using Real-Time VIIRS Active Fire/Hotspot Data. Sustainability 2018, 10, 4419. [Google Scholar] [CrossRef]
  11. Ichoku, C.; Giglio, L.; Wooster, M.J.; Remer, L.A. Global Characterization of Biomass-burning Patterns Using Satellite Measurements of Fire Radiative Energy. Remote Sens. Environ. 2008, 112, 2950–2962. [Google Scholar] [CrossRef]
  12. Gao, H.; Zhao, C. Application of NOAA/AVHRR in Forest Fire Monitoring. J. Shandong For. Sci. Technol. 2007, 1, 33–35. [Google Scholar]
  13. Wei, Y.; Sang, H.; Zhang, T.; Cong, Y.; Gu, H. Straw Burning Fire Point Identification in Hebei Province Using Improved MODIS Fire Point Detection Algorithm. J. Glob. Position. Syst. 2019, 44, 125–130. [Google Scholar]
  14. Hafizur, R.M.; Nimish, S.; Seema, K.; Arindam, D. Potential Areas of Crop Residue Burning Contributing to Hazardous Air Pollution in Delhi during Post-monsoon Season. J. Environ. Qual. 2022, 51, 181–192. [Google Scholar]
  15. Sophia, P.; Maria, K.; Francesco, M.; Teodosio, L.; Filippos, V.; Valerio, T. Monitoring Temporal Variations in the Geothermal Activity of Miocene Lesvos Volcanic Field Using Remote Sensing Techniques and MODIS—LST Imagery. Int. J. Appl. Earth Obs. Geoinf. 2021, 95, 102251. [Google Scholar]
  16. Elvidge, C.D.; Zhizhin, M.; Baugh, K.; Hsu, F.-C.; Ghosh, T. Methods for Global Survey of Natural Gas Flaring from Visible Infrared Imaging Radiometer Suite Data. Energies 2015, 9, 14. [Google Scholar] [CrossRef]
  17. Zhou, Y.; Zhao, F.; Wang, S.; Liu, W.; Wang, L. A Method for Monitoring Iron and Steel Factory Economic Activity Based on Satellites. Sustainability 2018, 10, 1935. [Google Scholar] [CrossRef]
  18. Hao, L.; Meng, Q.; Ge, X.; Zhang, Y.; Hu, D.; Zhang, L.; Tang, Z. A Method for Extraction of Industrial Thermal Contaminated Areas Based on Octant Method. Remote Sens. Technol. Appl. 2020, 35, 469–477. [Google Scholar]
  19. Ma, C.; Niu, Z.; Ma, Y.; Chen, F.; Yang, J.; Liu, J. Assessing the Distribution of Heavy Industrial Heat Sources in India between 2012 and 2018. ISPRS Int. J. Geo-Inf. 2019, 8, 568. [Google Scholar] [CrossRef]
  20. Lai, J. Study on Remote Sensing Identification and Spatial Distribution Pattern of Heat Source in Heavy Industry; Northwest Normal University: Lanzhou, China, 2020. [Google Scholar]
  21. Li, B.; Fan, J.; Han, L.; Sun, G.; Zhang, D.; Zhang, P. An Industrial Heat Source Extraction Method: BP Neural Network Using Temperature Feature Template. J. Geoinf. Sci. 2022, 24, 533–545. [Google Scholar]
  22. Xu, G.; Yue, J.; Dong, Y.; Lou, J.; Xiong, W.; Nie, Y. Deep Convolutional Network Satellite Image Cement Plant Target Detection. Chin. J. Image Graph. 2019, 24, 550–561. [Google Scholar]
  23. Lu, K.; Li, G.; Chen, Z.; Jiu, L.; Li, B.; Gao, J. Steel Plant Extraction Based on Negative Sample Multichannel Optimized SSD Network. J. Univ. Chin. Acad. Sci. 2020, 37, 352–359. [Google Scholar]
  24. Sun, J.; Liu, Y.; Dong, Y.; Xu, B.; Wei, X. Classification of Urban Industrial Heat Sources Based on Suomi-NPP VIIRS Nocturnal Thermal Anomaly Product—A Case Study of Beijing-Tianjin-Hebei Region. Geogr. Inf. Sci. 2018, 34, 13–19. [Google Scholar]
  25. Liu, Y.; Hu, C.; Zhan, W.; Sun, C.; Murch, B.; Ma, L. Identifying Industrial Heat Sources Using Time-series of the VIIRS Nightfire Product with an Object-oriented Approach. Remote Sens. Environ. 2018, 204, 347–365. [Google Scholar] [CrossRef]
  26. Ma, C.; Yang, J.; Xia, W.; Liu, J.; Zhang, Y.; Sui, X. A model for expressing industrial information based on object-oriented industrial heat sources detected using multi-source thermal anomaly data in China. Remote Sens. 2022, 14, 835. [Google Scholar] [CrossRef]
  27. Song, T.; Dong, G.; Tang, Z.; Chen, M.; Hu, Z.; Liang, X. Industrial Structure Optimization in Beijing-Tianjin-Hebei under the Triple Energy-Environment-Employment Constraint. Geogr. Res. 2017, 36, 2184–2196. [Google Scholar]
  28. Yang, H. Contribution of China’s Iron and Steel Industry to Air Pollution and Emission Reduction Measures; Beijing University: Beijing, China, 2019. [Google Scholar]
  29. Fang, C. Theoretical Basis and Regularity Analysis of Synergistic Development of Beijing-Tianjin-Hebei Urban Agglomeration. Adv. Geogr. Sci. 2017, 36, 15–24. [Google Scholar]
  30. VIIRS I-Band 375 m Active Fire Data. Available online: https://earthdata.nasa.gov/earth-observation-data/near-real-time/firms/viirs-i-band-active-fire-data (accessed on 31 December 2021).
  31. National POI Information Database. Available online: http://www.poilist.cn/ (accessed on 31 December 2021).
  32. Beijing Statistical Yearbook. Available online: https://data.cnki.net/yearbook/Single/N2021120006 (accessed on 15 July 2022).
  33. Tianjin Statistical Yearbook. Available online: https://data.cnki.net/yearbook/Single/N2022010263 (accessed on 15 July 2022).
  34. Hebei Statistical Yearbook. Available online: https://data.cnki.net/yearbook/Single/N2022060071 (accessed on 15 July 2022).
  35. Wang, C.; Zhang, Y.; Li, H. Research on the Relationship between Green Innovation Efficiency and Environmental Regulation in Beijing-Tianjin-Hebei Region-Take High-tech and Energy-intensive industries as Examples. J. Hebei Eng. Univ. (Nat. Sci. Ed.) 2020, 37, 107–112. [Google Scholar]
Figure 1. The study region: the BTH region.
Sustainability 14 11228 g001
Figure 2. (a) The spatial distribution of hot anomalies data in the BTH region for 2012 to 2021. (b) The spatial distribution of POI data in the BTH region for 2012 to 2021.
Sustainability 14 11228 g002
Figure 3. Details of the data processing for identifying and classifying industrial heat sources based on active fire point density segmentation.
Sustainability 14 11228 g003
Figure 4. Illustration of the characteristics of industrial heat source objects belonging to different categories: (a1a4) cement plants, (b1b4) steel plants, (c1c4) coal and chemical industry, (d1d4) oil and gas developments, and (e1e4) other.
Sustainability 14 11228 g004aSustainability 14 11228 g004b
Figure 5. Spatial distribution of industrial heat sources in the BTH region: (a) distribution of industrial and non–industrial heat sources and (b) density of industrial heat sources.
Sustainability 14 11228 g005
Figure 6. Spatial distribution of classified identifiable industrial heat sources in the BTH region. (a) Histogram showing the number of heat sources belonging to each of the five categories in each city in the BTH region. (b) Spatial distribution of the classified identifiable industrial heat sources.
Sustainability 14 11228 g006
Figure 7. Time-series of thermal anomalies associated with industrial heat sources in the BTH region during the 2012–2021 period. (a) Line graph showing the total number of industrial heat source objects in the BTH region each year during the 2012–2021 period. (b) Graph showing the number of industrial heat source objects in different categories in the BTH region each year during the 2012–2021 period. (c) Spatial distribution of active industrial heat sources from 2012 to 2021. (d) Map showing the trends in the number of industrial heat sources by city from 2012 to 2021.
Sustainability 14 11228 g007
Figure 8. Comparison with the identification of industrial heat source objects based on nighttime thermal data: (a) comparison between the heat source objects identified using the method described in this study and those identified using nighttime thermal data and (b) an illustration of the granularity of the results obtained in this study.
Sustainability 14 11228 g008
Table 1. Keywords used for categorizing the industrial heat sources.
CategoryKeywords
Cement plantsCementBuilding MaterialsLimestoneConcrete
Steel plantsSteelCastingSmeltingMachinery
Coal and chemical industryCoal ChemistryCokingMining
Oil and gas developmentsOilNatural GasChemicalEnergy
OtherSilicon IndustryGlassCalcium Industry
Table 2. The number of active industrial heat source objects in different cities in Beijing, Tianjin, and Hebei each year during the 2012–2021 period.
2012201320142015201620172018201920202021Decline between 2012 and 2021 (%)
Beijing13151312116643376.92%
Tianjin2425262722252020171537.50%
Tangshan1421431331381241241201171019533.10%
Qinhuangdao2020141313161613111145.00%
Chengde10111113121415151511−10.00%
Zhangjiakou688778755433.33%
Baoding222217141413119101054.55%
Langfang121211121191035466.67%
Cangzhou898896109780.00%
Hengshui1100122202−100.00%
Shijiazhuang3130302425272725252035.48%
Xingtai2022211816141415111050.00%
Handan7373726765635852474538.36%
Total38239136435333032731628925723837.70%
Table 3. The number of active industrial heat sources in different categories during the 2012–2021 period.
2012201320142015201620172018201920202021Decline between 2012 and 2021 (%)
Cement plants8690807167706564625931.40%
Steel plants20521520119918517817716114212837.56%
Coal and chemical industry5452484842444139333142.59%
Oil and gas developments2322252730322623182013.04%
Other 1412108633220100.00%
Total38239136435333032731628925723837.70%
Table 4. Regression analysis results.
Coefficientt
C−887.063 **−4.117
Energy consumption level295.272 **5.362
Environmental regulation −442.737−0.154
Openness to the outside−124.946 **−5.139
Enterprise scale103.796 **3.435
R&D intensity4429.940 **5.691
Adj R20.971
F-statistic173.942
** p < 0.01.
Table 5. The number of industrial heat sources in different categories in different cities and municipalities in the BTH region as identified in this study and by Liu (2018) [24] using nighttime thermal data.
Cement PlantsSteel PlantsCoal and ChemicalIndustryOil and GasDevelopmentsOther Total
Liu 2018 [24]This
Paper
Liu 2018
[24]
This
Paper
Liu 2018
[24]
This
Paper
Liu 2018
[24]
This
Paper
This
Paper
Liu 2018
[24]
This
Paper
Beijing141920121516
Tianjin06718214501330
Tangshan1023721082126991112167
Qinhuangdao15611510141222
Chengde094500001415
Zhangjiakou261221002511
Baoding31158710231525
Langfang1359213101114
Cangzhou0137305501113
Hengshui00010002003
Shijiazhuang414410761511636
Xingtai210410720201324
Handan110274518191364783
Total251021392437658243719264459
Liu 2018 refers to the identification of industrial heat source objects based on nighttime thermal data [24].
Publisher’s Note: MDPI stays neutral with regard to jurisdictional claims in published maps and institutional affiliations.

