Abstract
With the continuous development of ecological city construction under the concept of “ecological civilization”, the creation of ecologically livable cities has become more and more important. Since urban livability involves a wide range of social life, the establishment of urban livability index evaluation system can help analyze urban livability and residents’ quality of life, and then optimize and control urban spatial structure to promote high-quality urban development. This study takes Wuhan, Hubei Province, as an example, and establishes a comprehensive index evaluation system based on 12 indicators in three criteria levels: economic, social, and environmental, and calculates a comprehensive score of urban livability for each district in Wuhan City, and conducts a comprehensive evaluation of the 13 administrative districts under Wuhan City. Based on the final scores, we analyze the livability and friendliness of each district in Wuhan, analyze the spatial pattern of the results, discuss the strengths and weaknesses of the livability of each district in Wuhan, make scientific reference suggestions to promote the coordinated development of each district, guide the rational allocation of resources, and provide a reference for decision-making to promote the livable communities in each district in Wuhan.
1. Introduction
The rapid development of urbanization has brought about environmental pollution, traffic congestion, and other problems, which have led to higher demands for the quality of living environment. How to create and improve the livability of cities has become an important issue in urban development [1].
The comprehensive development of society requires “people-oriented” and concern for people’s “quality of life” [2,3], which is an important embodiment of the scientific concept of development [4]. Improving and continuously improving the quality of life of all people as the ultimate goal of social development is also one of the signs of social progress [5].
In the era of knowledge and innovation, with the rise of the concept of people-oriented urban development, choosing a livable city has become the goal of people [6]. The most direct criterion of how to evaluate the level of livability and construction of a city is the citizens’ sense of belonging and access [7]. At present, what we now face is the contradiction between unbalanced and inadequate development and the people’s ever-growing needs for a better life, and promoting high-quality urban development is the key to solve the main contradiction [8]. To set the goal of high-quality urban development, it is necessary to pay attention to the livability of cities.
Spatial data exploration and analysis is a powerful tool for studying spatial phenomena, and the study of spatial association of regional socio-economic phenomena is one of the focal points of the society [9]. Scholars at home and abroad have conducted several useful explorations on the analysis of spatial patterns [10,11,12,13,14,15], using analytical methods such as fuzzy comprehensive evaluation method [4], factor analysis [16,17,18], hierarchical analysis (AHP) [18,19], coefficient of variation method, distance comprehensive assessment method [20,21], etc. For example, Liu et al. used factor analysis methods and Monte Carlo simulation methods to evaluate and analyze the livability of different cities in Shanxi Province [22]. Turkoglu, H., et al. [23] analyzed the relationship between sustainable development strategies and quality of life using a range of indicators such as socio-economic, residential environment, and physical health. Royuela, V., et al. analyzed the role of quality of life in urban economics, and used Barcelona as an example to test the spatial stability of the relationship between urban growth and quality of life [24]. Linares, S., et al. measured spatial segregation and quality of life in two midsize cities of Buenos Aires Province in Argentina, by evaluating from a statistical and geographical point of view how the variations in spatial segregation impact the quality-of-life index. Thematic mapping and scattered plots allowed us to visualize the spatial arrangement of residential areas according to both categories [25]. Delmelle, E., et al. investigated the spatial process of neighborhood improvement and decline with respect to its quality of life profile. In particular, they seek to determine to what extent a neighborhood’s geographic situation impacts its probability of improving or declining and is spatial proximity equally advantageous or detrimental [26]. Dadashpoor, H., et al. chiefly investigated the spatial patterns of the regional quality of life (RQoL) in Iran using objective indicators, over the period of 15 years [27].
In the report of the 18th Party Congress, the concept of three living spaces was introduced. Under the perspective of “three living”, the inner city and the production space are dominated by industrial production and service functions [28]. On 1 March 2021, China’s first watershed protection law, the Yangtze River Protection Law of the People’s Republic of China, came into force. Since then, the legislative concept of ecological priority and green development has been deeply rooted in people’s hearts. In the year since the promulgation of this law, Wuhan has taken green as the base color to build a new era hero city with ecological livability, and a waterfront ecological green city is gradually showing in front of people. Wuhan City in the 2006–2022 urban master plan, clearly put forward to improve the residential areas of public service facilities and public green configuration level [29]. The plan calls for the construction of new communities with convenient transportation, beautiful environment, comfortable living, and complete infrastructure to comprehensively improve the living environment and residential construction level in Wuhan and create a livable city. These goals reflect the Wuhan government’s pursuit of economic development, but also in full consideration of the living and living environment of the public, and also reflects the “people-oriented” construction concept.
Based on the background of ecological construction, this study extracted 12 indicators from three criteria layers, namely, economic, social, and environmental, to establish a comprehensive index evaluation system, calculate the comprehensive score of urban livability of each district in Wuhan, and conduct a comprehensive evaluation of the 13 administrative districts under Wuhan. Based on the final scores, we analyze the livability and friendliness of each district in Wuhan, and analyze the spatial clustering and spatial pattern of the results to explore the strengths and weaknesses of the livability of each district in Wuhan.
2. Overview of the Study Area
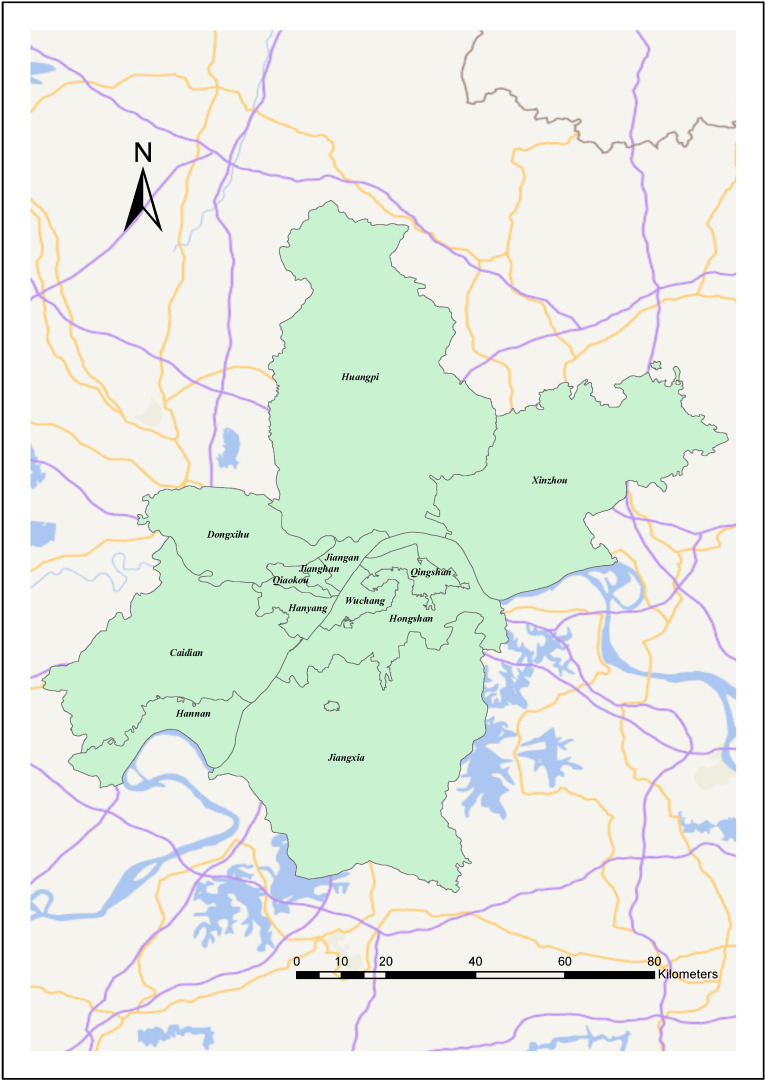
As shown in Figure 1, the study area of this paper is Wuhan, Hubei Province, China. Wuhan is located in the eastern part of Hubei Province, at the confluence of the Yangtze River and the Han River, and is the central city in central China, forming the three towns of Hankou, Wuchang, and Hanyang, and is an important industrial base, scientific and educational base, and comprehensive transportation hub in China. As of the end of 2019, Wuhan has a resident population of 11.12 million, ranking seventh in terms of total population of Chinese cities. In the 14th Five-Year Plan of Wuhan, it is clearly proposed to join hands with cities in Wuhan City Circle to jointly build a “waste-free city circle” and a “green city circle”, and establish a mechanism for collaborative ecological and environmental governance. In the 14th Five-Year Plan, we will continue to implement the concept of people’s city and build a happy city with people’s livelihood. In accordance with the requirements of the 14th Five-Year Plan, the Wuhan Municipal Government has been striving to improve and enhance the quality of life of all people and build a happy and livable city.

Figure 1.
The overview of the Wuhan City.
3. Data and Methods
3.1. Data Description
The data involved in this study are mainly remote sensing image data and land use data, administrative district vector data, economic statistics, air monitoring site statistics, and various POI data for the main urban administrative districts of Wuhan City in 2019 and 2020. Among them, the data at the economic level are mainly from Wuhan City Statistical Yearbook, the data at the social level are mainly from POI data, and the data at the environmental level are from remote sensing monitoring data and air monitoring site statistics, and the detailed description of the data is shown in Table 1.

Table 1.
Data description.
3.2. Method Description and Application
3.2.1. Index Method to Evaluate the Livability of Wuhan City
This study provides basic data for subsequent principal component analysis and TOPSIS analysis by calculating remote sensing ecological index, landscape index, air quality index, and related facility point density, and further makes evaluation and analysis of urban livability in Wuhan under ecological construction.
- a.
- Remote Sensing Ecology Index
Remote Sensing Ecology Index (RSEI) is a comprehensive ecological index based on Landsat remote sensing imagery first proposed by Xu in 2013 [30], which is widely used for ecological environment quality evaluation.
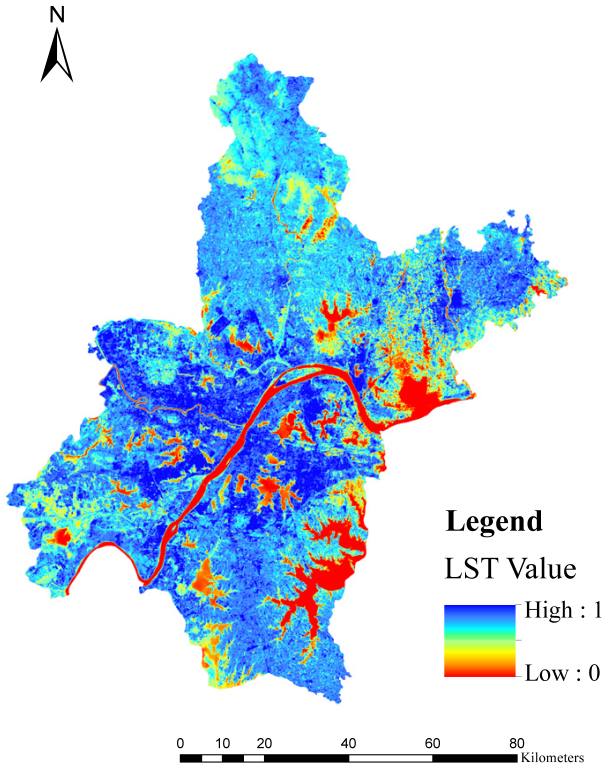
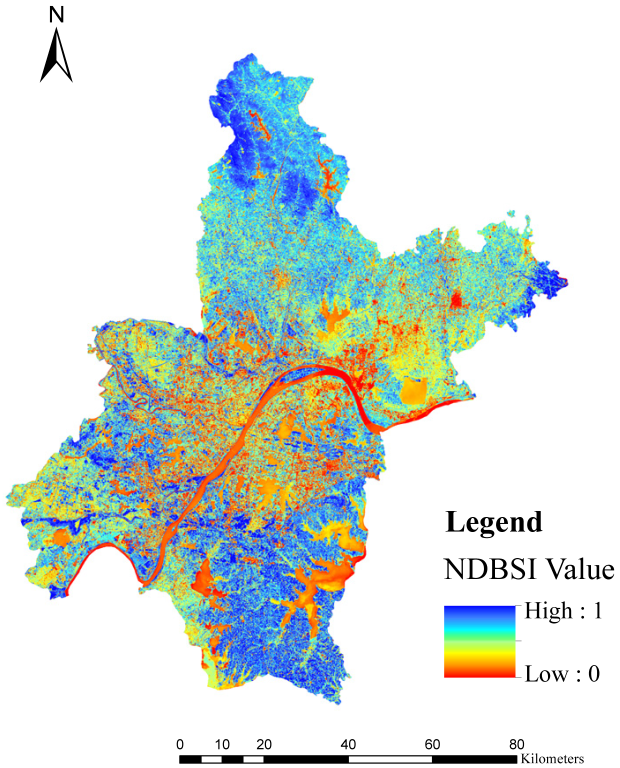
RSEI integrates four ecological indicators: NDVI, WET, LST, and NDBSI, and evaluates the ecological condition by establishing a functional relationship among the four indicators, with the following equation:
The above four indicators are normalized vegetation index, moisture component, surface temperature, normalized building, and bare soil index, respectively. The formulae and meanings of these indicators are shown in Table 2.
Table 2.
RSEI index calculation and meaning table.
Since the four indicators have different units and value ranges, these indicators are first normalized in the forward direction to map their values to the [0, 1] interval with the following equation.
X is the index value, and and are the maximum and minimum values of this index in the target year, respectively. The evaluation dimension is then reduced using principal component analysis (PCA), and the initial unnormalized is calculated by the PCA function of ENVI with the following equation.
By normalizing the RSEI value in the interval of [0, 1], the closer the RSEI is to 1, the better the quality of ecological environment, and the RSEI can be divided into five categories corresponding to the quality of ecological environment, namely “poor” (0–0.2), “poor” (0.2–0.4), “Medium” (0.4–0.6), “good” (0.6–0.8), and “excellent” (0.8–1.0).
- b.
- Landscape Index
Landscape index can reflect the natural landscape composition characteristics and spatial change characteristics of a certain area, and is a highly concentrated quantitative reference scale expressing the natural landscape layout information. As a reasonable landscape index, it needs to fully reflect the richness of natural landscape layout types, reflect the spatial shape characteristics of each patch, and reveal the spatial distribution characteristics of each part within the natural landscape. Based on the land use status and natural landscape classification criteria of Wuhan city, this project will be analyzed by classifying a total of five major landscape indices selected from two scales of landscape type level and landscape level, as shown in Table 3. The patch density coefficient (PD) and number of patches (NP) are selected according to the natural landscape level index. Landscape area (CA), maximum patch index (LPI) were selected for the landscape type level index, and the proportion of landscape area occupied by patches (PLAND) was used to determine the landscape pattern of each district in Wuhan City, as an environmental criterion layer to analyze the livability of residents’ life.
Table 3.
Landscape index indicators.
- c.
- Air Quality Index
AQI (air quality index) is a new national air quality assessment standard released in March 2012 that monitors six pollutants: sulfur dioxide, nitrogen dioxide, PM10, PM2.5, carbon monoxide, and ozone, with data updated hourly. AQI presents these six pollutants in a unified assessment standard.
It describes how clean or polluted the air is, and the health effects, and its focus is on assessing the health effects of breathing polluted air for a few hours or days.
The higher the AQI index, the worse the air quality in the area. Generally, the AQI domain is classified by the state into six levels, representing different levels of pollution, as shown in Table 4.
Table 4.
Air quality index rating scale.
3.2.2. Preliminary Evaluation of Urban Livability in Wuhan City by TOPSIS Analysis
TOPSIS analysis, i.e., distance integrated evaluation, is a common and effective method in multi-objective decision analysis. The principle of TOPSIS is to rank the relative merits of evaluation units by measuring their proximity to the “ideal solution” and “negative ideal solution”. The “ideal solution” is the solution with the best value of each attribute, while the “negative ideal solution” is the solution with the worst value of each attribute.
If the evaluation object is closest to the “ideal solution” and at the same time is farthest from the “negative ideal solution”, it is the best; otherwise, it is the worst. The advantages of this method are: the processing object is obtained from the statistics of actual measurement data, avoiding the interference of subjective factors, and can objectively conduct a comprehensive evaluation of multiple objectives, easy to apply, no strict restrictions on data distribution, sample size, and the number of indicators, with a wide range of applications, small calculation volume, intuitive geometric meaning, and small distortion of information. The specific calculation steps are as follows:
- a.
- With n evaluation objects and m evaluation indexes, the original data can be written as a matrix .
- b.
- Normalization of the matrix. The normalized transformations are carried out for the high-optimality (the larger the better) and low-optimality (the smaller the better) indicators, namely or .
- c.
- The evaluation set of optimal and inferior solutions in the normalized matrix is obtained. The normalized matrix is obtained, and the optimal and inferior vectors composed of the maximum and minimum values of each column are denoted as:
- d.
- The Euclidean distance between the actual value of the indicator and the optimal and worst-case scenario is calculated for each region. The calculation equations are respectively:where: D+ and D− denote the distance between the ith evaluation object and the optimal and inferior solutions, respectively.
- e.
- The relative closeness or similarity is calculated and ranked. The closeness of the ith evaluation object to the optimal solution (relative closeness) (0 ≤ ≤ 1; i = 1, 2, ⋯, n).
3.2.3. Accurate Evaluation of Urban Livability in Wuhan City Using Principal Component Analysis
Principal component analysis (PCA) is used to replace the original indicators with a small number of mutually unrelated composite indicators by rotating the original axes to retain as much information as possible while replacing the original indicators with as few principal components as possible, thus making the complex problem simple.
In general, if the KMO value is greater than 0.5, it is suitable for factor analysis; if the KMO value is less than 0.5, it is extremely unsuitable for factor analysis. When the Sig value of Bartlett’s sphericity utility test is less than 0.05, it is considered that the correlation coefficient matrix is significantly different from the unit matrix and passes the Bartlett’s sphericity utility test, and the extraction of principal factors and the calculation of principal component scores can be carried out in the next step.
The calculation of the comprehensive urban livability index of Wuhan city districts based on principal component analysis was carried out with the following formula.
where is the contribution rate of each principal component and is the score of each principal component, from which the urban livability index of each district in Wuhan is calculated for evaluation analysis.
3.2.4. Analysis of Wuhan City’s Urban Spatial Pattern Using Local Indicators of Spatial Association
Local indicators of spatial association (LISA) was usually used to measure the similarity and difference between a spatial unit and its neighboring units.
Analyzing the spatial correlation of regional systems from the perspective of spatial clustering is a prerequisite for conducting spatial econometric studies. In this study, the local Moran’I index (Moran’s I) is introduced in an attempt to analyze the spatial characteristics of the composite index of each district in Wuhan city from the perspective of spatial clustering. The local Moran’s I index can further clarify the local spatial clustering trends and discrete characteristics of the observed objects, and its calculation formula is:
> 0 means that area i with high (low) values of the examined indexes is surrounded by other areas with high (low) values, < 0 means that area i with high (low) values is surrounded by other areas with low (high) values, and = 0 means that there is no local spatial autocorrelation. In order to have a more intuitive understanding of the urban livability of Wuhan and to investigate the spatial correlation patterns of Wuhan’s internal units, this study will use Moran’s I index and LISA analysis to reveal the local spatial correlation patterns and spatial distribution layout of Wuhan. The Moran’s I index is a kind of spatial autocorrelation coefficient, whose values are distributed in [–1, 1], and is used to identify whether there is spatial autocorrelation.
3.3. Technology Line
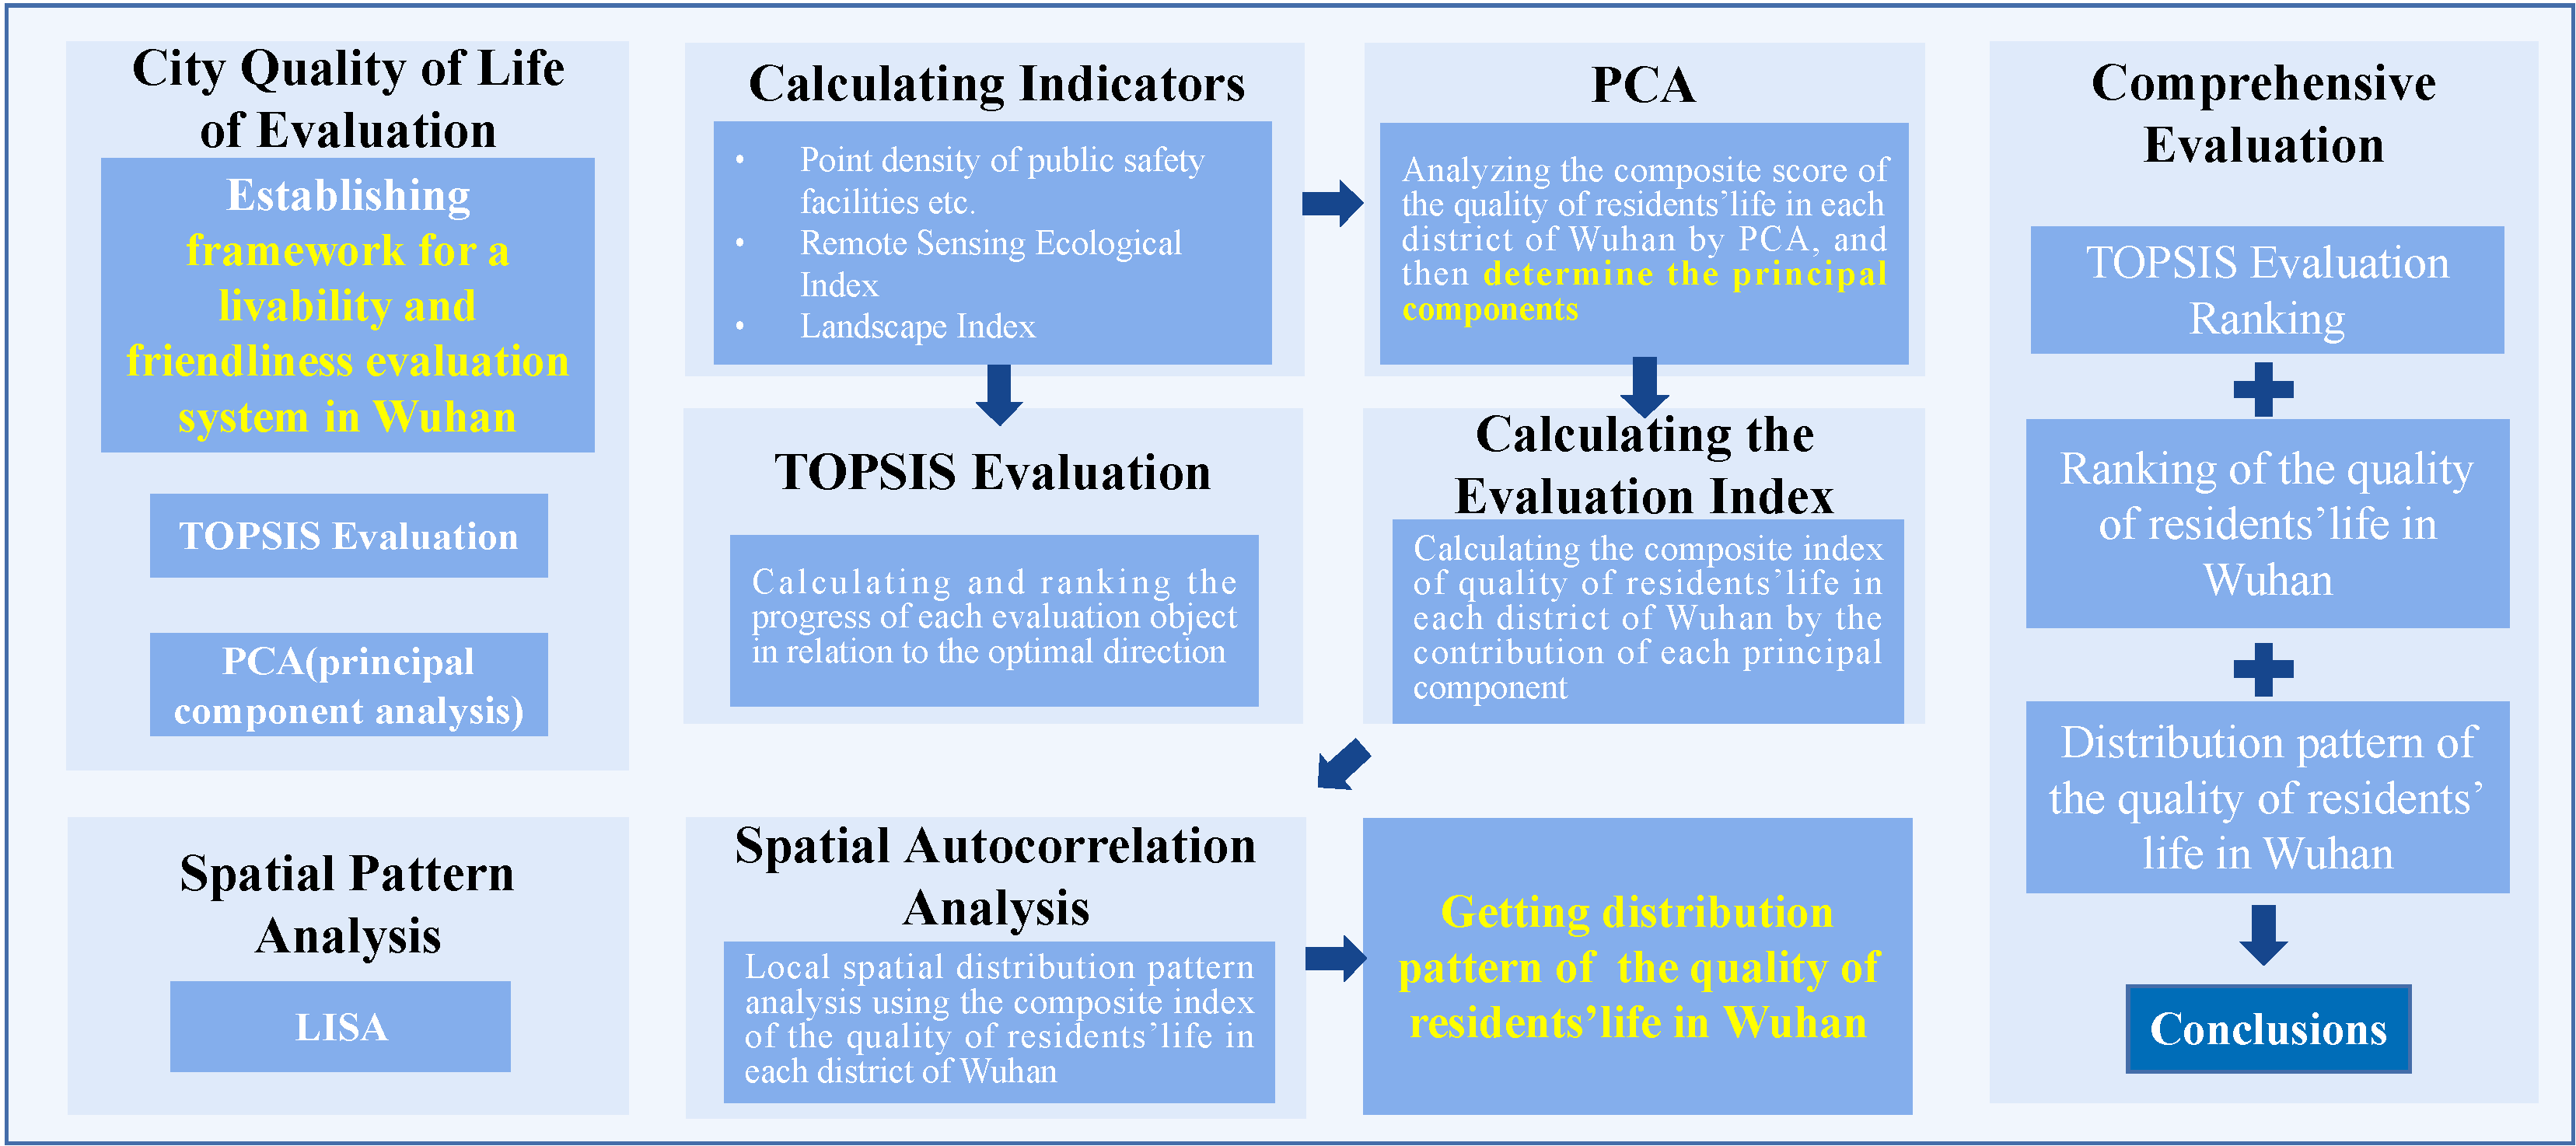
The technology roadmap for this study is as follows (Figure 2).
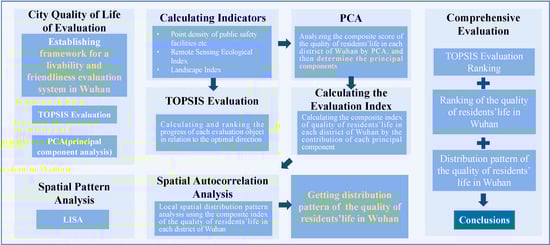
Figure 2.
Technology roadmap.
4. Results and Analysis
4.1. Building a System for Evaluating Livability and Friendliness
A livable city is a complex and huge system involving economic, natural, and social aspects, and its essence should be suitable for human living, life, and development. The evaluation of livability of a city is also a comprehensive evaluation of production, life, and ecology, which means that a livable city is a multi-functional, multi-level, multi-objective, and multi-factor evaluation object. Therefore, the indicators of livable cities should include enough contents to cover the aspects related to livability in cities. Based on the connotation of the concept of livable city and the principles of index system construction, and with reference to the above well-known urban livability evaluation index system at home and abroad, we reviewed the relevant literature. This study aims to select three dimensions: economic, social, and environmental, and establish a set of evaluation index system based on objective data.
In this study, the evaluation of the livability and friendliness of each district in Wuhan City was conducted from the perspective of building an ecologically livable city, based on the principle of “people-oriented”, and the importance of building an urban ecological environment for sustainable urban development, while taking into account the economic and social benefits of the city. The framework of the evaluation system of livability and friendliness of each district in Wuhan is shown in Table 5. The framework of the evaluation system of livability and friendliness of each district in Wuhan city is composed of a three-level index system. The first level indicator (target level) is livability friendliness, the second level indicators (criterion level) are three indicators of economic level, social environment, and ecological environment respectively, and the third level indicators (element level) are the branches included in the second level indicators, including residents’ income, public transportation, medical and health care, environmental health, etc.
Table 5.
The livability and friendliness evaluation system framework of Wuhan.
Except for the indicators of the economic level layer, which were extracted from the Wuhan City Statistical Yearbook, the indicator values of the social environment layer and the ecological environment layer need to be obtained by calculation. In this study, the average point density values of POI data are used as the index values of public transportation, medical and health care, public safety, culture and leisure, and convenience services; the remote sensing ecological index is calculated as the index value of habitat environment; the hourly average air quality value is used as the index value of environmental health; and the comprehensive landscape index is used as the index value of landscape pattern.
4.2. Indicator Calculation Results
4.2.1. Remote Sensing Ecology Index Calculation
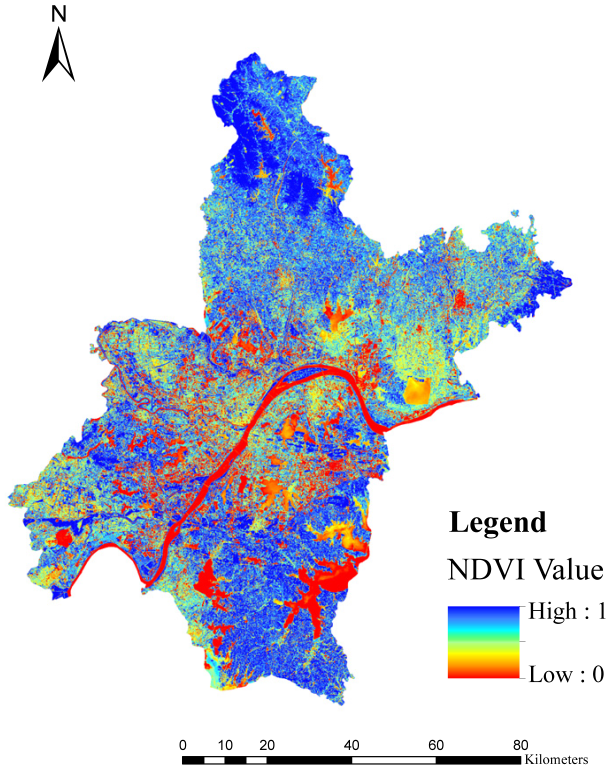
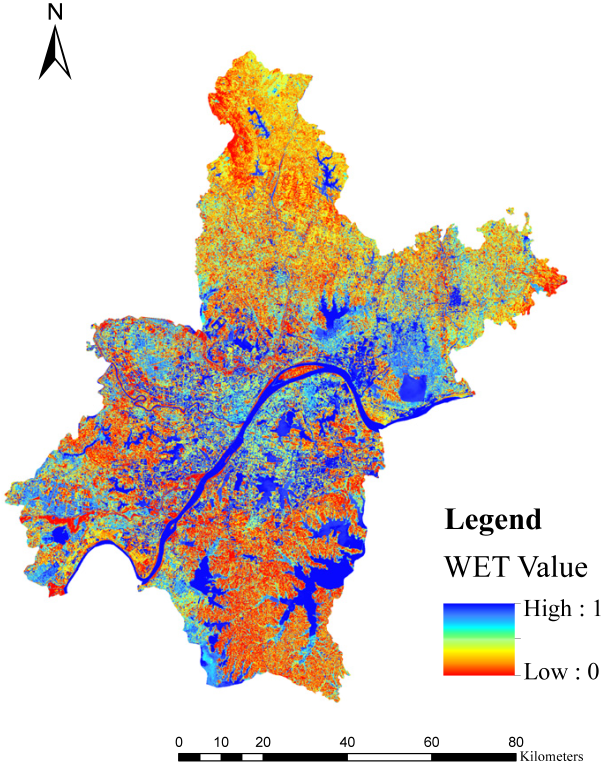
The RSEI index consists of four basic indexes, NDVI, WET, LST, and NDBSI. First, the calculation and normalization of the four indexes are carried out by the BandMath function of ENVI5.3 according to the calculation formula of RSEI index in Section 3.1 (Table 6).
Table 6.
NDVI, WET, LST, NDBS calculation results.
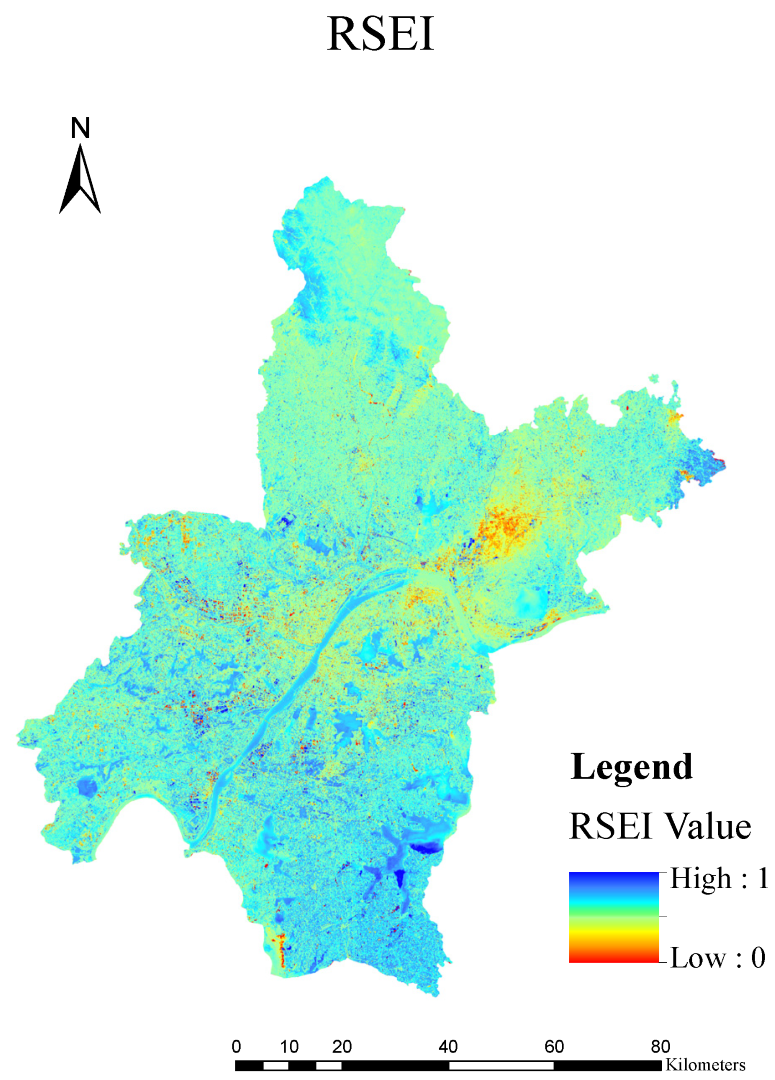
On this basis, the PCA function of ENVI was used to extract the principal components, and the principal component 1 with a contribution rate greater than 95% was selected for the RSEI principal component calculation and normalized to obtain the RSEI as shown in Figure 3.
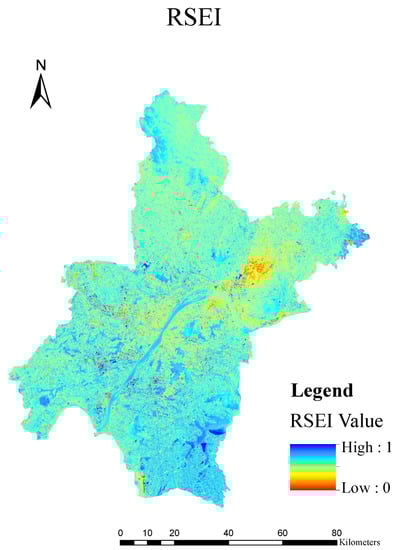
Figure 3.
Results of the RSEI index calculation for Wuhan.
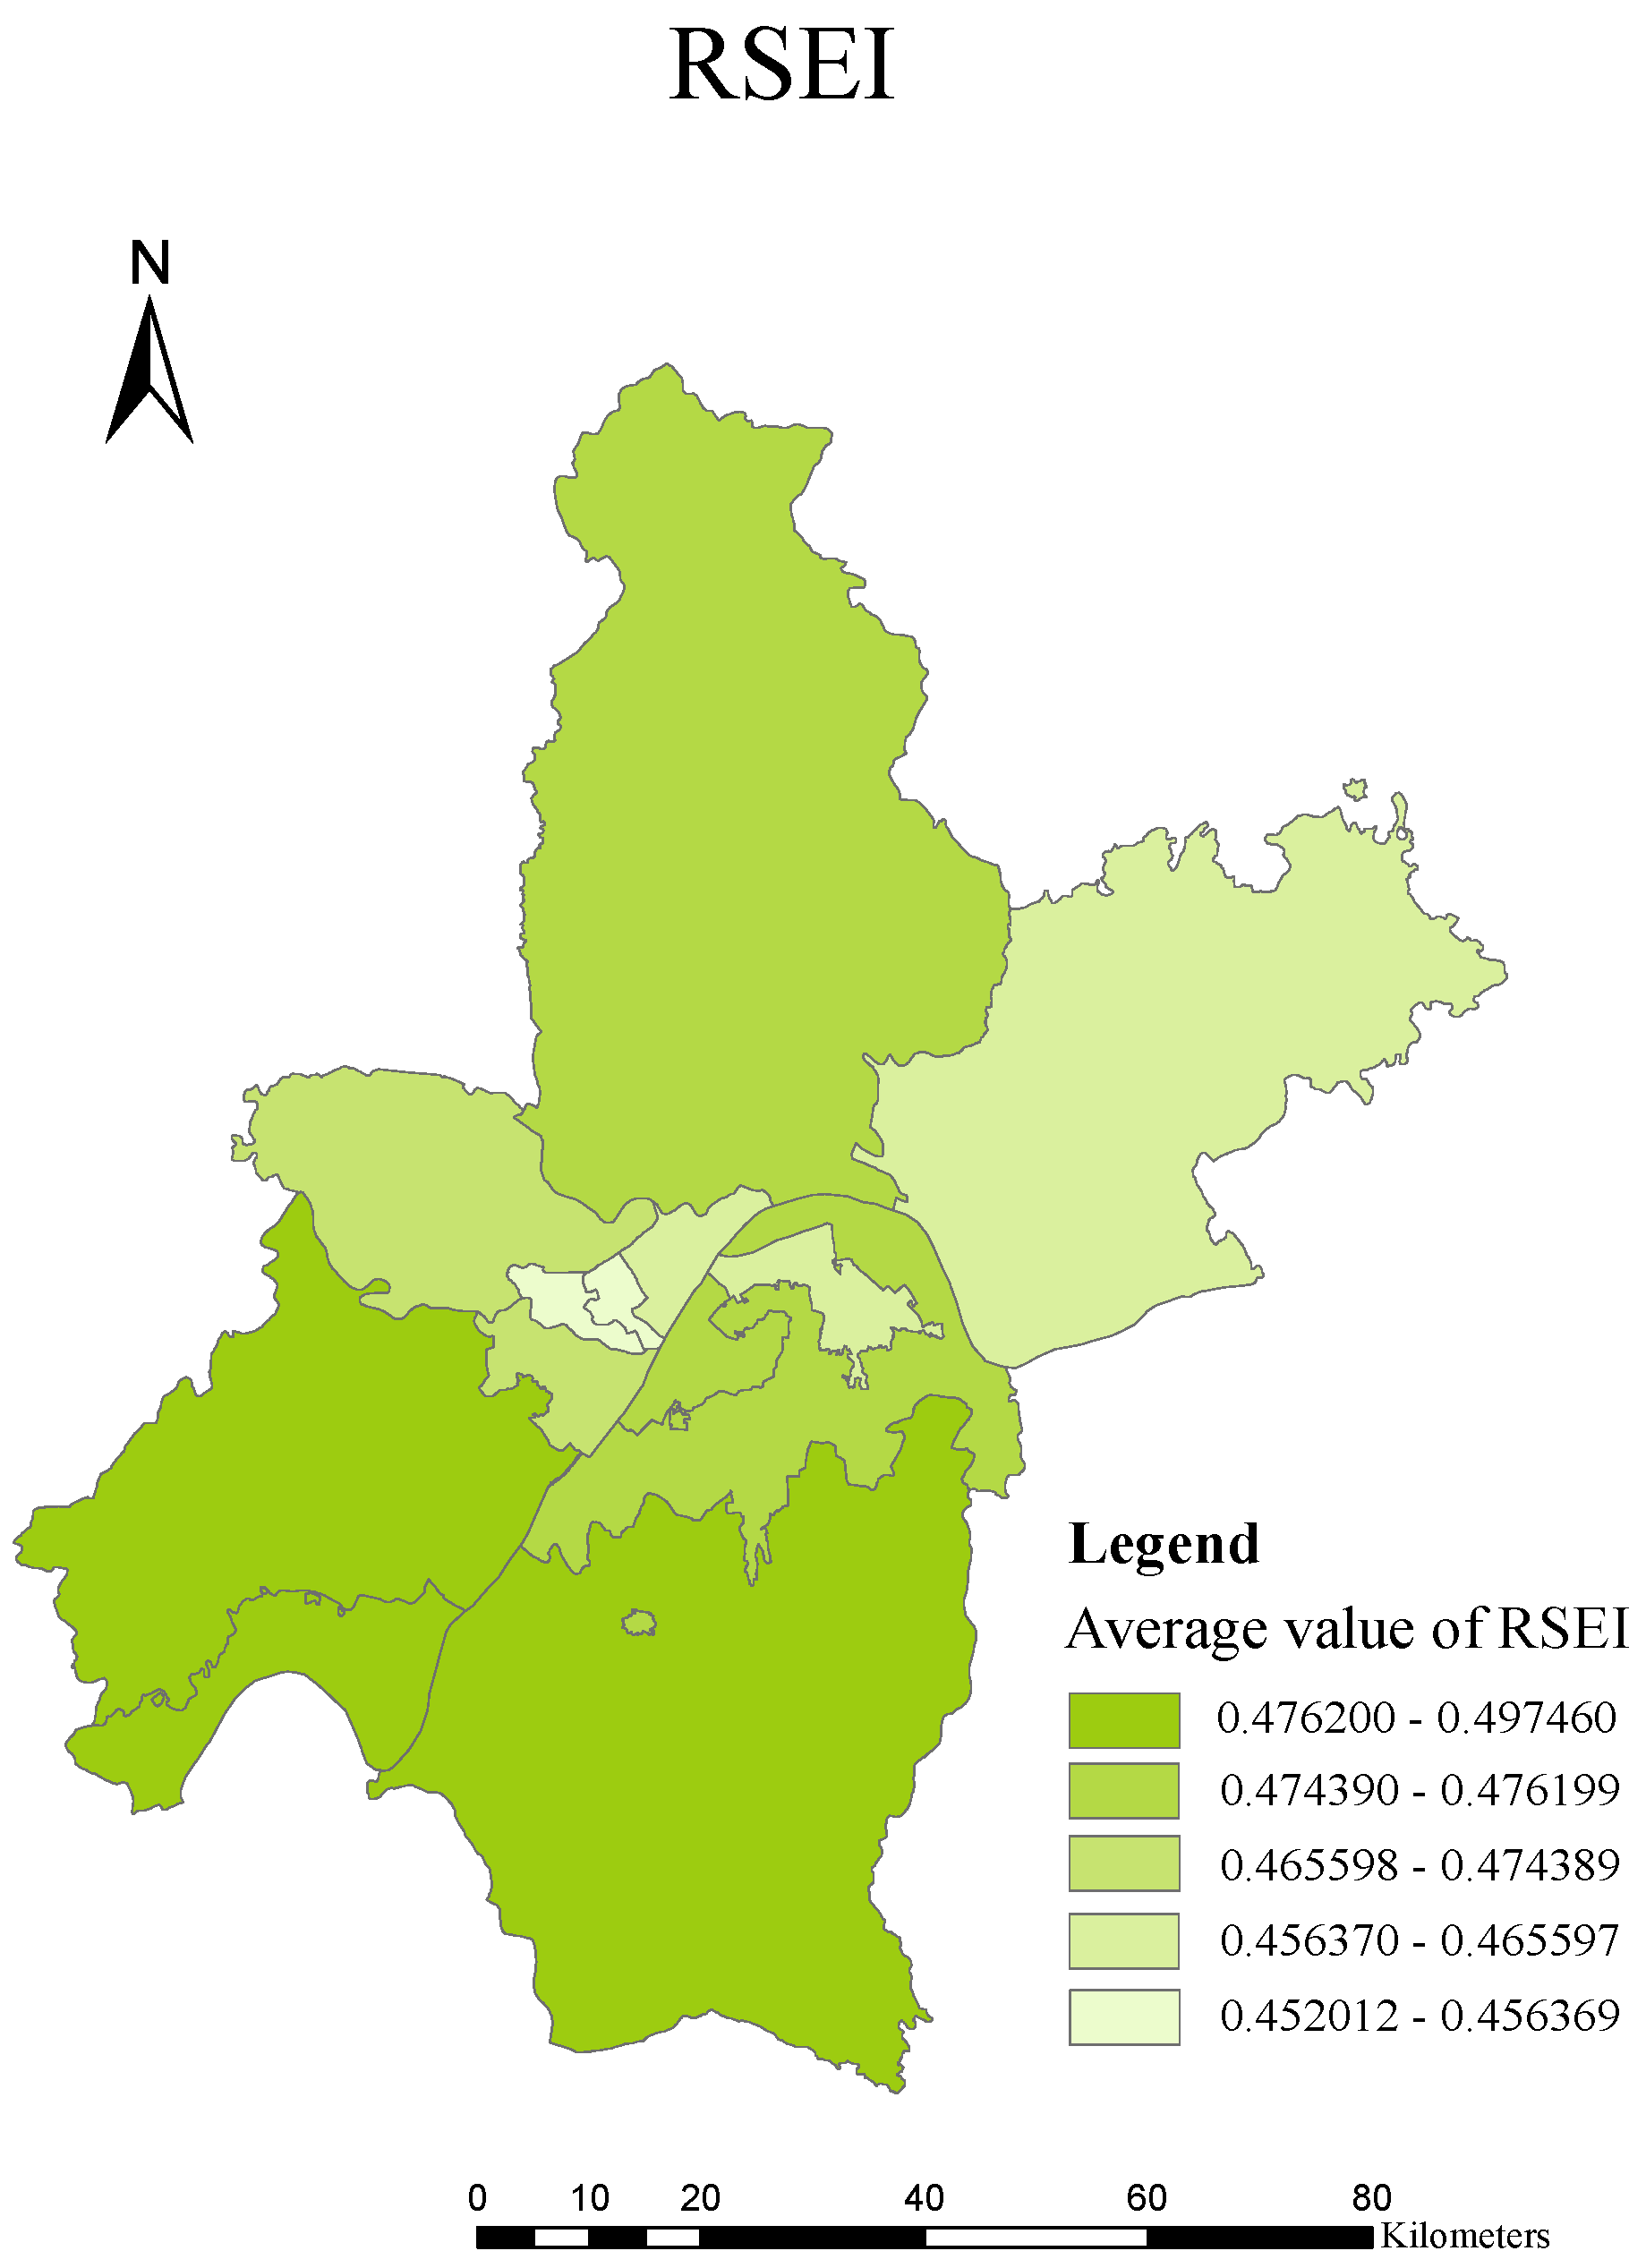
In this study, the raster average of RSEI was selected as the ecological index value of each district, and the raster data outside Wuhan City were first extracted by masking in ArcGIS, and then the regional analysis tool “zonal statistics” was used to generate the RSEI average of each district. From Figure 4, it can be seen that the RSEI values of all districts in Wuhan are between 0.45 and 0.5, and the ecological environment is at a medium level, with Caidian, Jiangxia, and Hannan districts having a relatively good ecological environment, and Qiaokou and Jianghan districts having a relatively poor ecological environment.
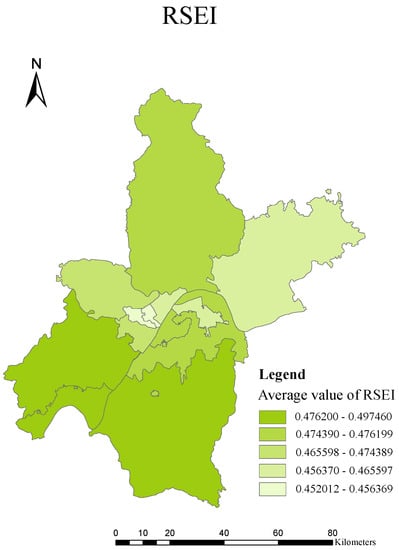
Figure 4.
The mean value of RSEI in each district of Wuhan.
4.2.2. Air Quality Index Calculation Index
Since AQI data are based on the values measured at air monitoring stations, it is an attribute value of point data and cannot directly replace the values within a region. It needs to be transformed into surface data based on ArcGIS software and then assigned to each district in Wuhan city.
Finally, “hourly AQI value” was used as the symbolic display field to display the graded values, and a thematic chart was created, as shown in Figure 5. It was found that the average hourly AQI values of Wuhan city districts in 2019 ranged from 67 to 76, which were all in the second level, i.e., good level.
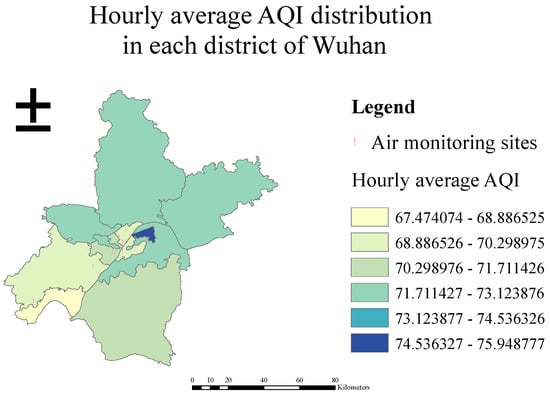
Figure 5.
Distribution of hourly average AQI values by district in Wuhan.
4.2.3. Calculation of Landscape Indices
Based on the land use classification data of Wuhan City obtained by processing in ArcGIS, five landscape indices for each district of Wuhan City were obtained by processing with Fragstats 4.2.
Table 7 shows the landscape indices of each district in Wuhan city calculated by Fragstats 4.2.
Table 7.
Landscape index of Wuhan City districts.
4.2.4. POI Data Point Density Analysis
Using ArcGIS software, point density was calculated for each of the six POI points, and the results are as follows (Figure 6, Figure 7, Figure 8, Figure 9 and Figure 10).
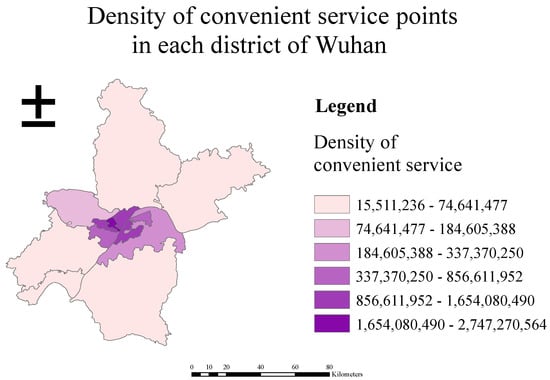
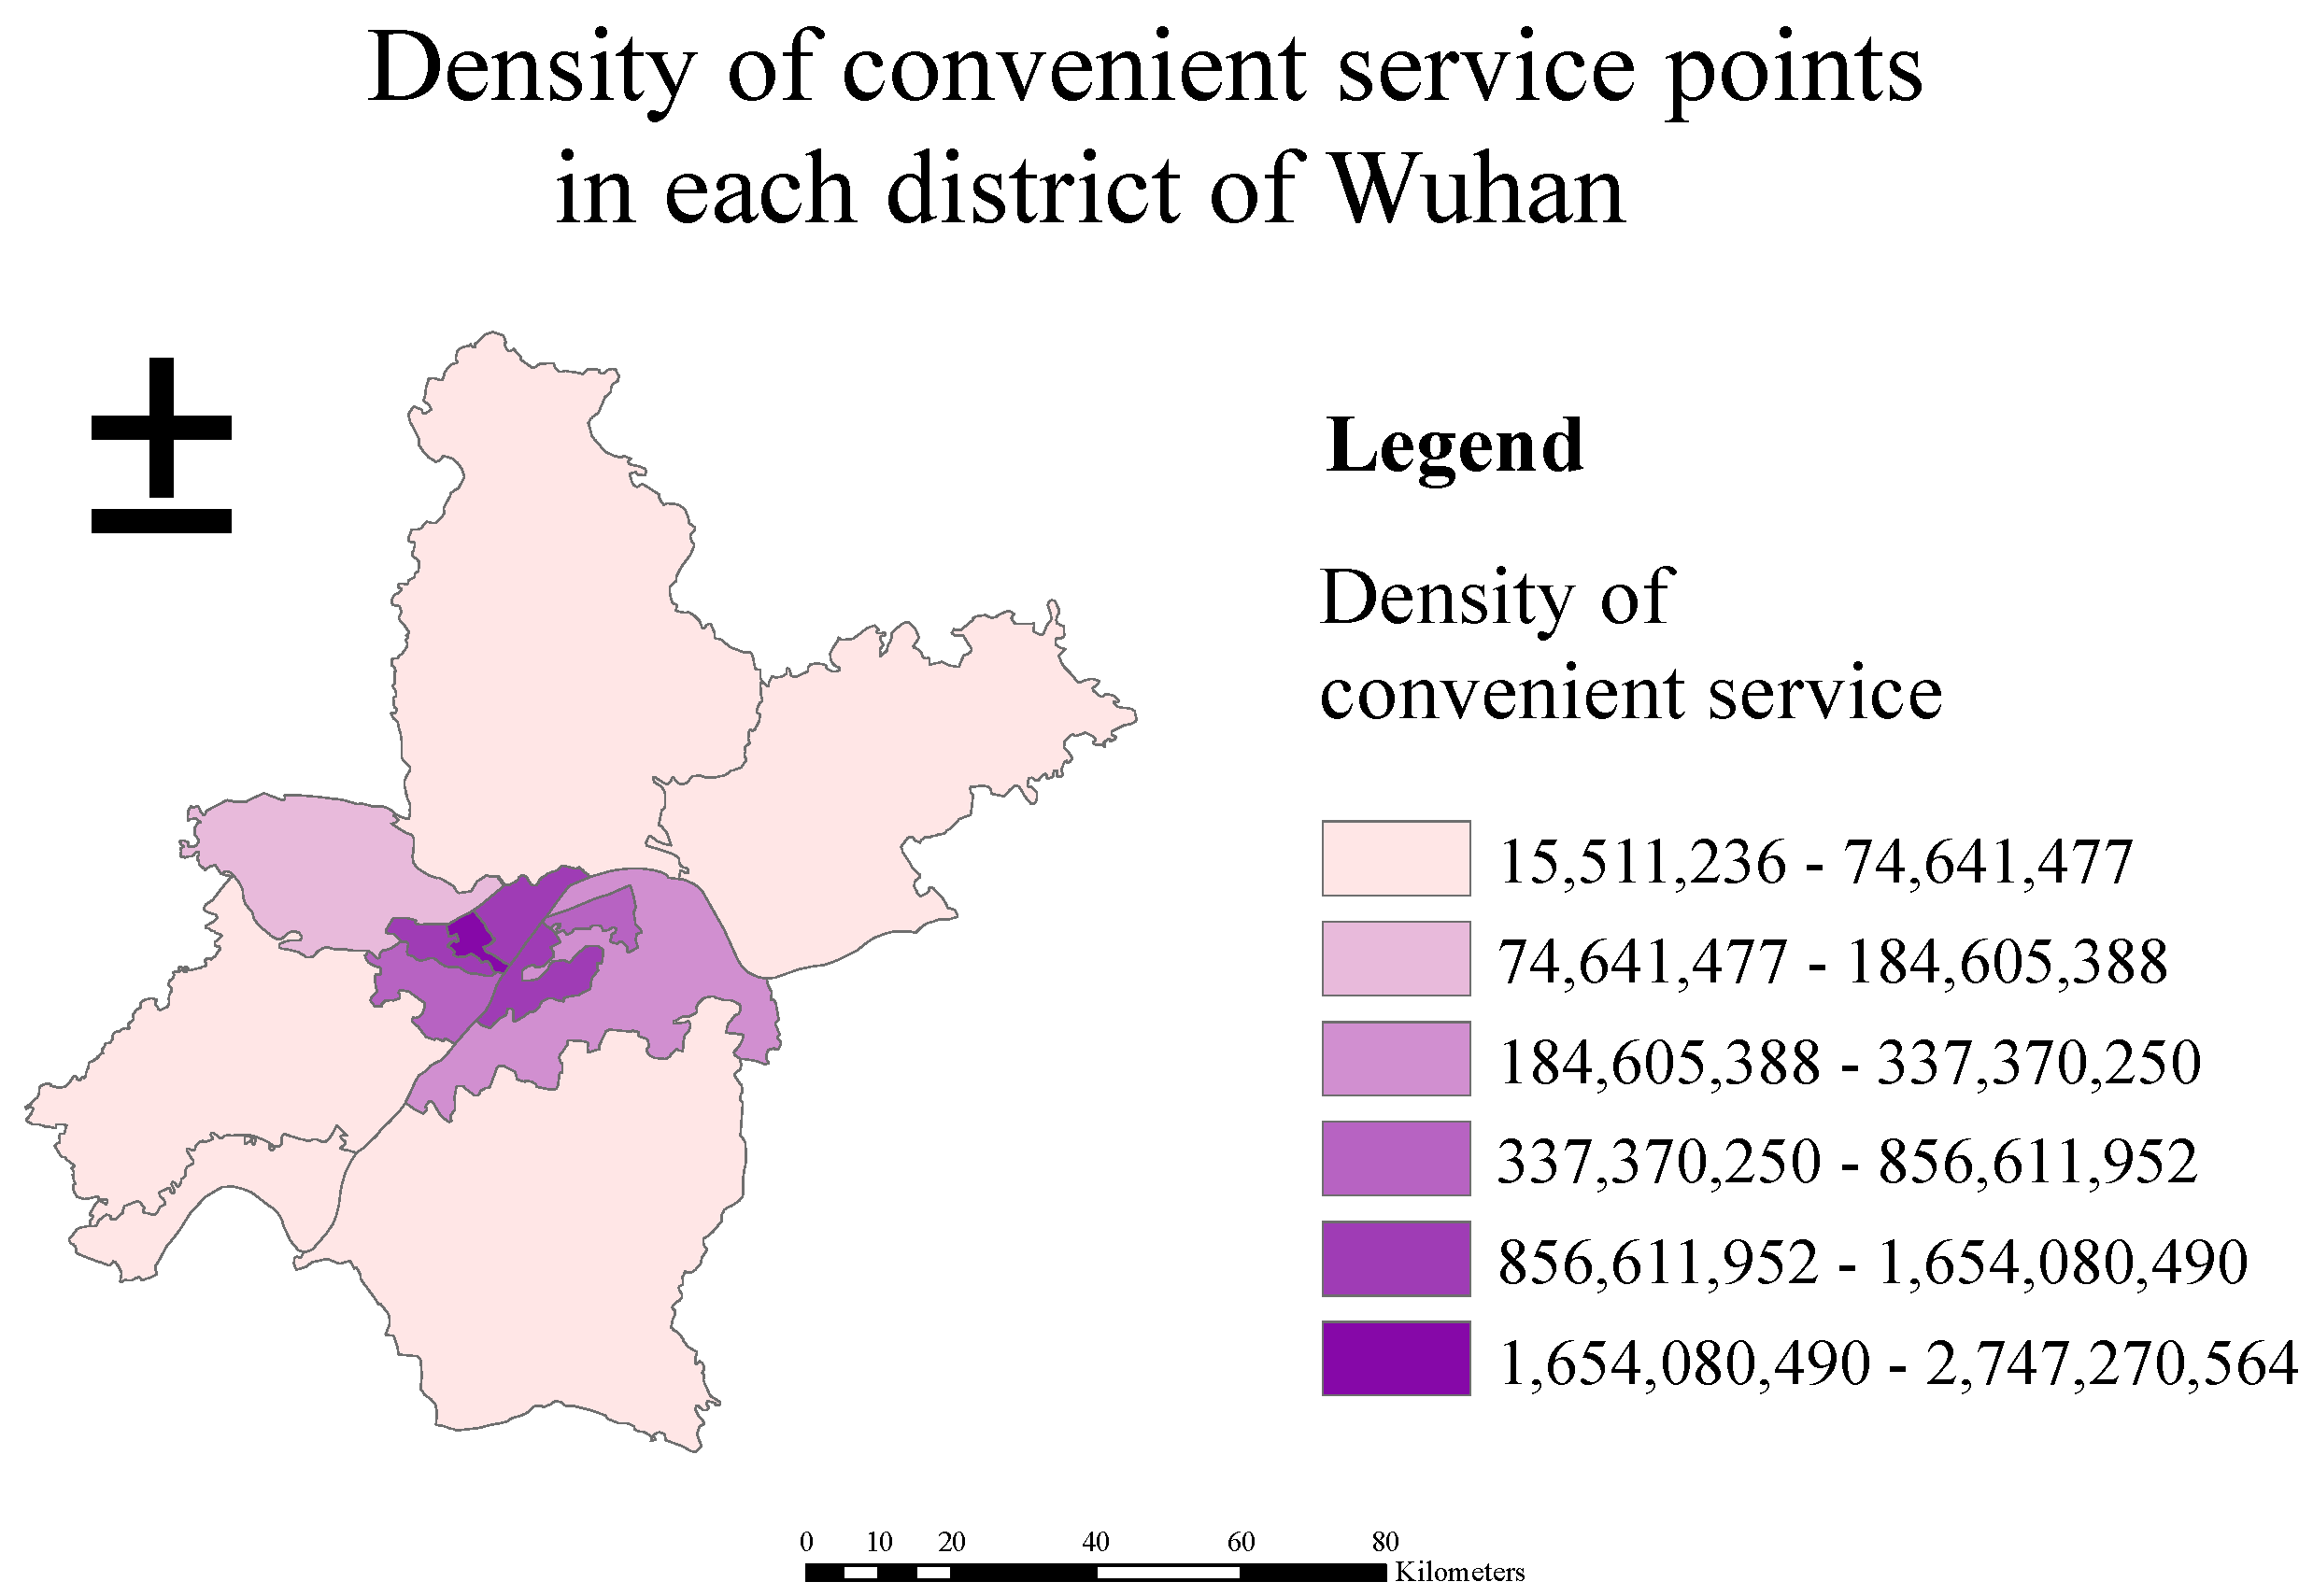
Figure 6.
The density of convenient service facilities in each district of Wuhan.
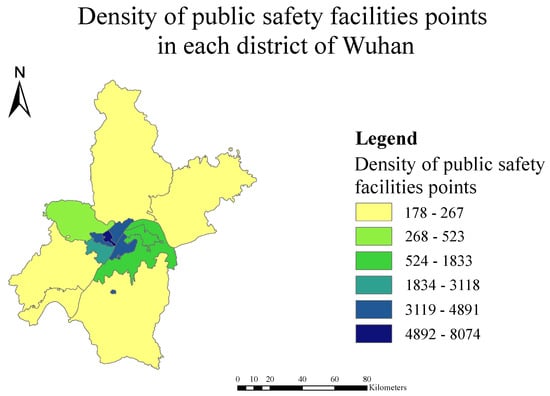
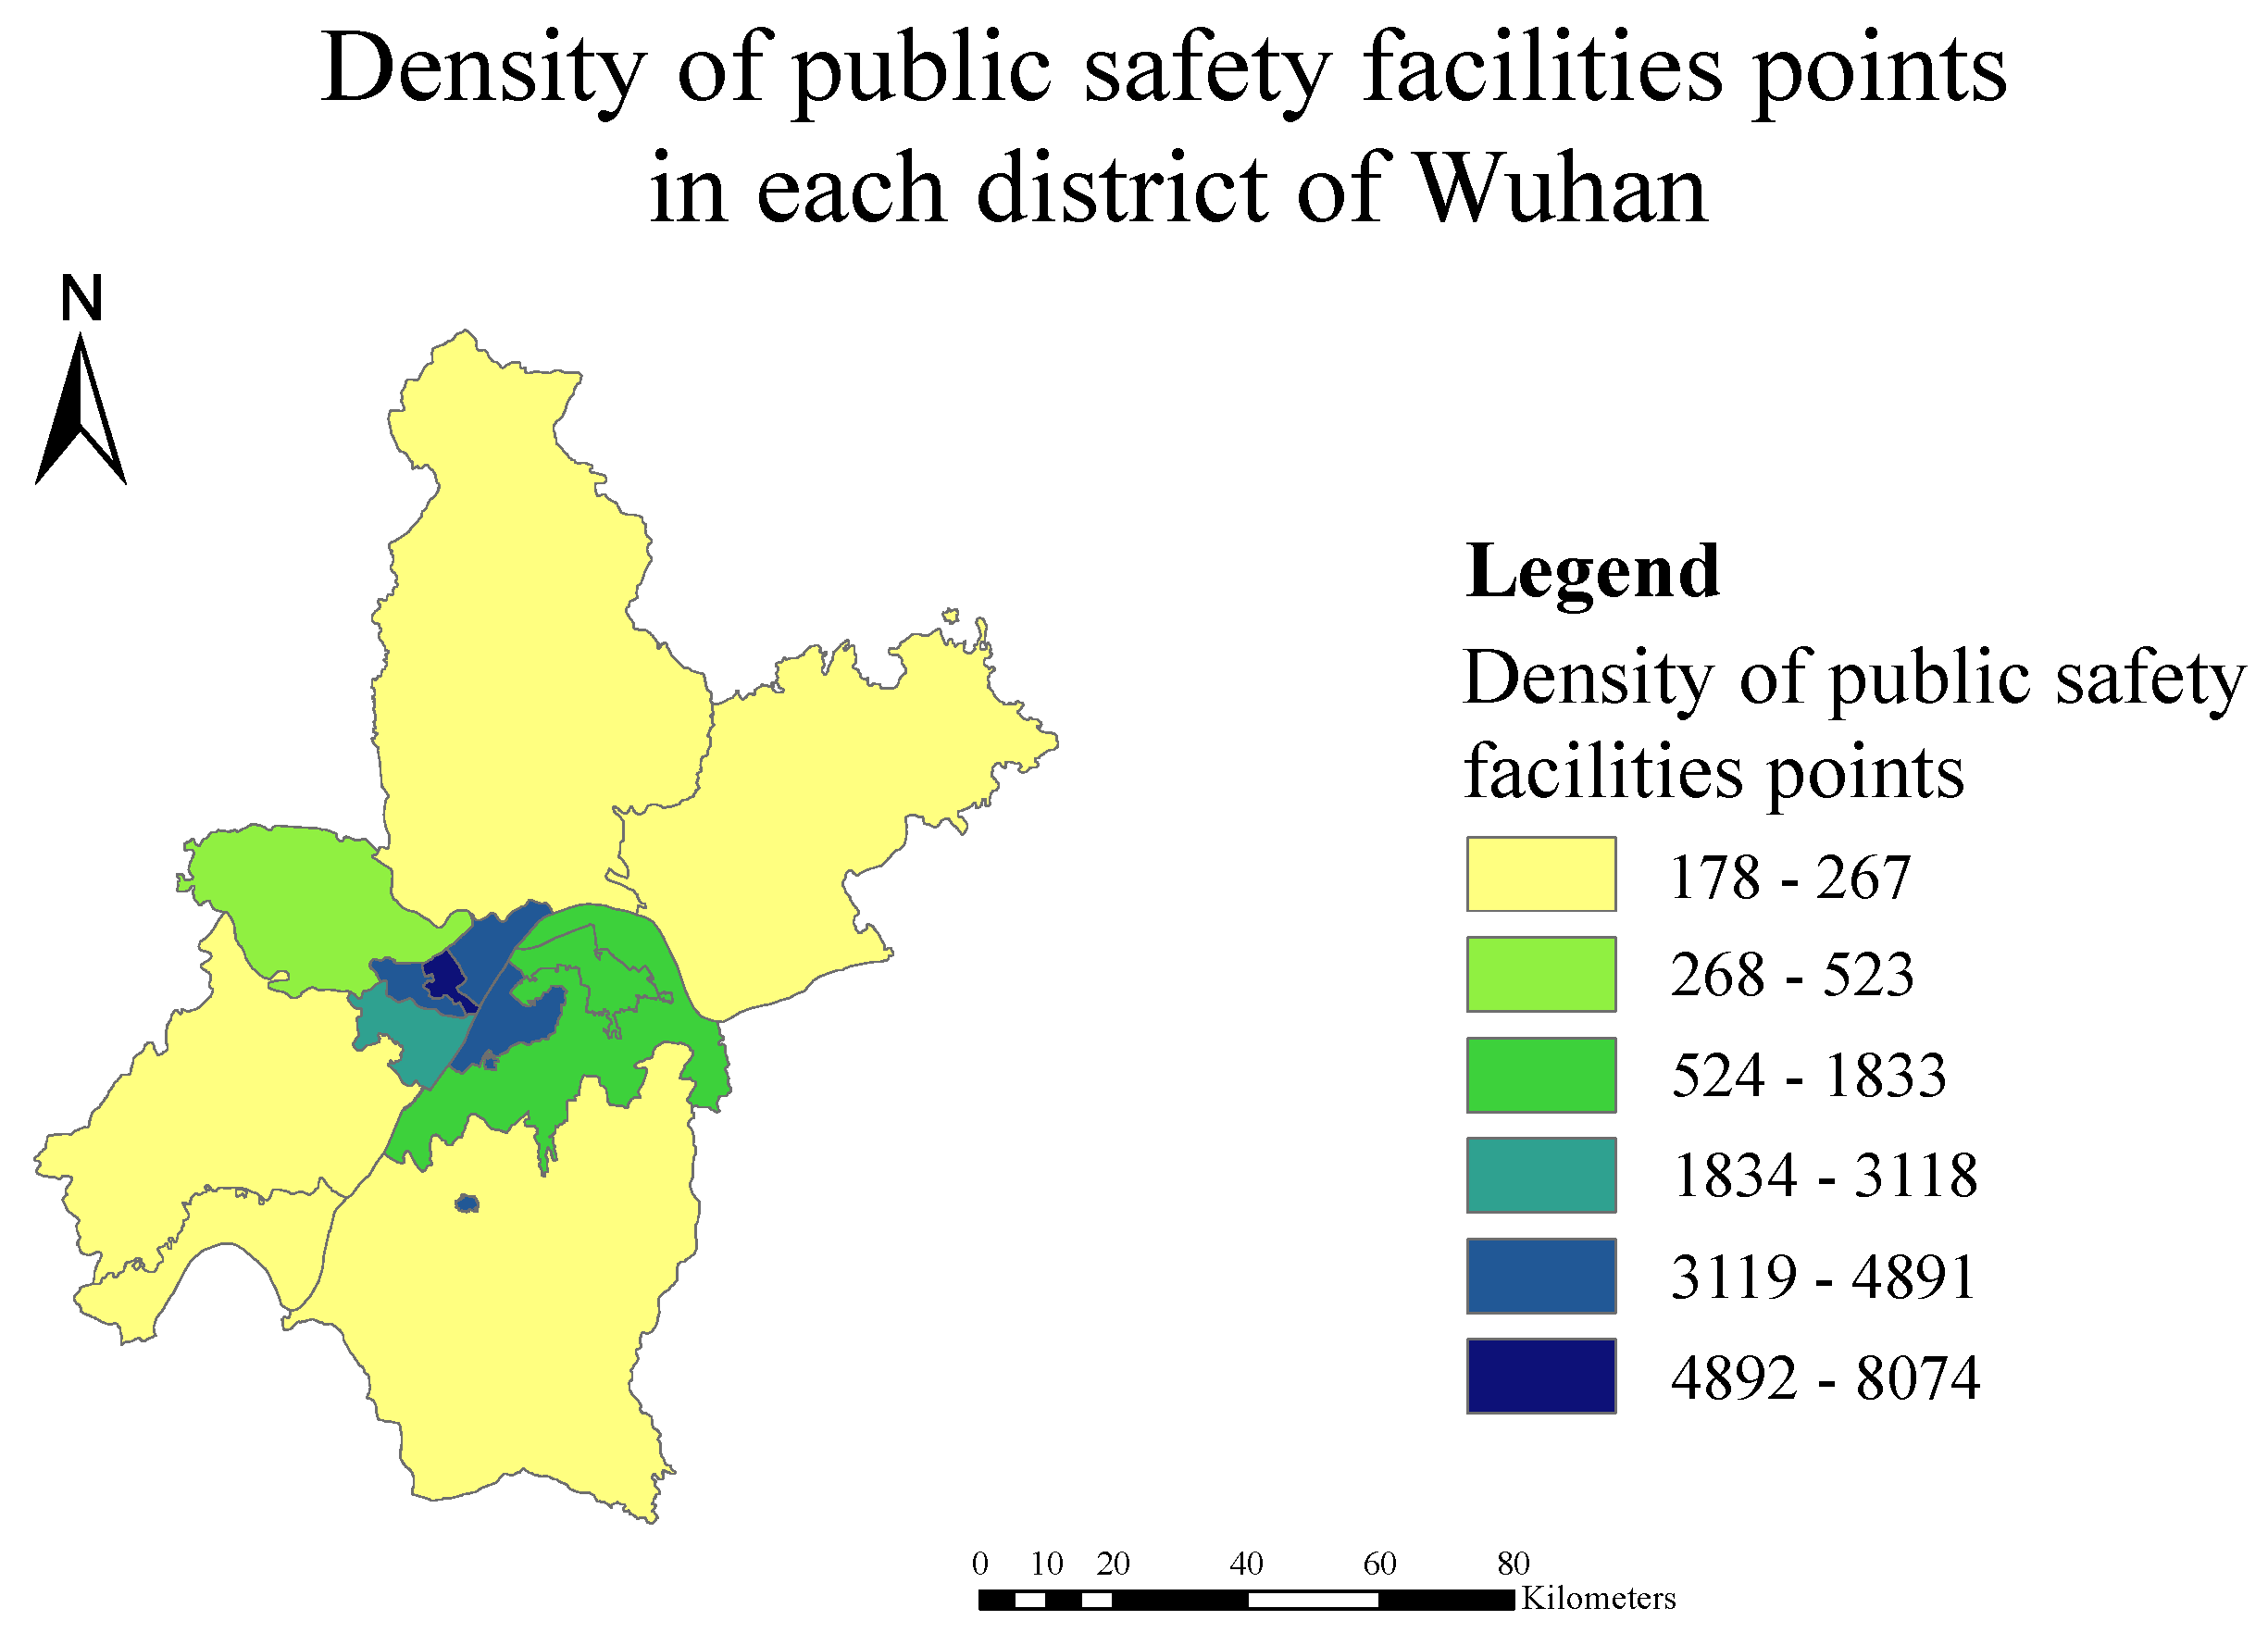
Figure 7.
The density of public safety facilities points in each district of Wuhan.
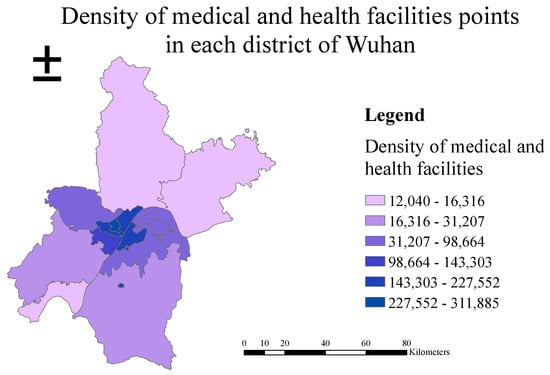
Figure 8.
The density of medical and health facilities points in each district of Wuhan.
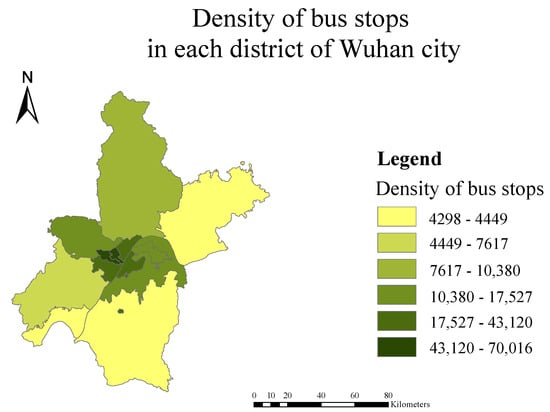
Figure 9.
The density of bus stops in each district of Wuhan.
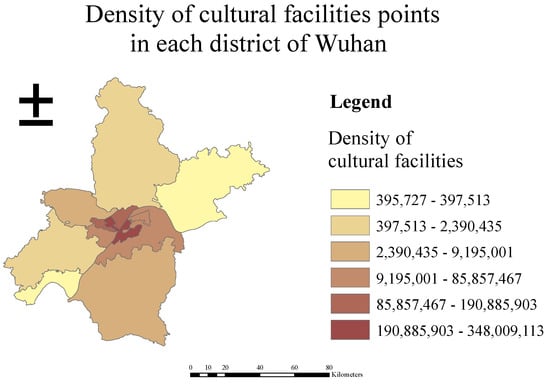
Figure 10.
The density of cultural facility sites in each district of Wuhan.
4.3. TOPSIS Evaluation
After completing the calculation of the system indexes, the preliminary ranking and evaluation of the quality of life of residents in each district of Wuhan City were carried out by TOPSIS evaluation, and all the obtained criterion-level data are processed by SPSS, then standardized and normalized to complete the pre-processing of the data for TOPSIS evaluation. Based on the closeness of each evaluation object to the optimal solution in TOPSIS and ranking, the rank evaluation was performed according to the value.
4.3.1. Isotropy and Standardization
The data of the 12 comprehensive evaluation indicators in the three levels selected in this study are different in nature and not uniform in units. Therefore, before conducting the TOPSIS evaluation, we need to standardize the data by processing them in a homogeneous and dimensionless way. All the data were summarized and imported into SPSS software for isotropic processing. For the landscape indices, PLAND and PD are negative indicators, and according to the nature of both landscape indices, the inverse of PLAND is normalized and PD is normalized by 1-PD. After completing the isotropic treatment of all landscape indices, the five landscape indices are normalized and averaged for each landscape index in each district to obtain the comprehensive landscape index. For the hourly average AQI value, the larger the AQI value is, the greater the pollution is, so we homogenize the original hourly average AQI value to find the inverse, to realize the negative index positivity. After the isotropy of all index data, SPSS was used to standardize the data. The standardized data were prefixed with “Z_” identifiers.
4.3.2. Performing TOPSIS Evaluation Analysis
SPSSAU is an online data processing website with algorithms including conventional statistical functions, regression analysis and prediction, ANOVA functions, non-parametric functions, multivariate statistical functions, and other algorithmic functions to help data science research. The standardized data were imported into SPSSAU to complete the TOPSIS evaluation analysis for this study.
We first use the TOPSIS method to find the positive and negative ideal solutions of the evaluation index (A+ and A−), and then calculate the distance values D+ and D− of each evaluation object from the positive and negative ideal solutions respectively. Based on the D+ and D− values, we finally calculate the proximity of each evaluation object to the optimal scheme (C values) and sort them against the C values.
Table 8.
Positive and negative ideal solutions.
Table 9.
TOPSIS evaluation calculation results.
From the ranking of livable urban areas in Table 9, it can be found that Jianghan District has the highest relative proximity of 0.605, which is theoretically the best choice among the 13 districts. The second place is Wuchang District, whose proximity is 0.567, which is 0.038 different from the first place, and the third place is 0.02 different from the second place. It can be seen that in terms of livability, the development of livability in several urban areas is not very different. However, the difference is more obvious when comparing the city at the bottom of the ranking.
4.4. Principal Component Analysis
Urban livability evaluation is a comprehensive evaluation, and the determination of weights is crucial for the whole evaluation, which directly affects the accuracy of the evaluation results. At present, there are mainly two types of weighting methods: subjective weighting method and objective weighting method. The objective weighting method is based on the statistical information obtained from the evaluation index data, such as principal component analysis, entropy method, factor analysis method, etc. The subjective assignment method is based on experts’ experience or relevant professional knowledge to assign weights to each index, such as hierarchical analysis, direct assignment method, expert scoring method, etc. In order to avoid the subjective arbitrariness of the subjective assignment method, which affects the research results, this study uses principal component analysis to determine the weights of the community livability evaluation index system and evaluate the community livability environment in Wuhan. After determining the weights, the livability index of each district can be calculated using the corresponding data of each district, and the livability friendliness of each district in Wuhan City can be ranked and evaluated.
According to the evaluation system of livability and friendliness of Wuhan city districts constructed in this study, the data corresponding to the indicators were collected and the relevant indicators were calculated, and principal component analysis was used to calculate the comprehensive index of urban livability of Wuhan city districts. First, the model test was performed on the sample data, and the KMO and Bartlett’s sphericity tests were conducted using SPSS software in this study. The KMO value was 0.663 > 0.6, and the statistic of Bartlett’s sphericity test was Sig = 0.00 < 0.01, indicating that the sample data passed the tests and the observed variables were suitable for principal component analysis.
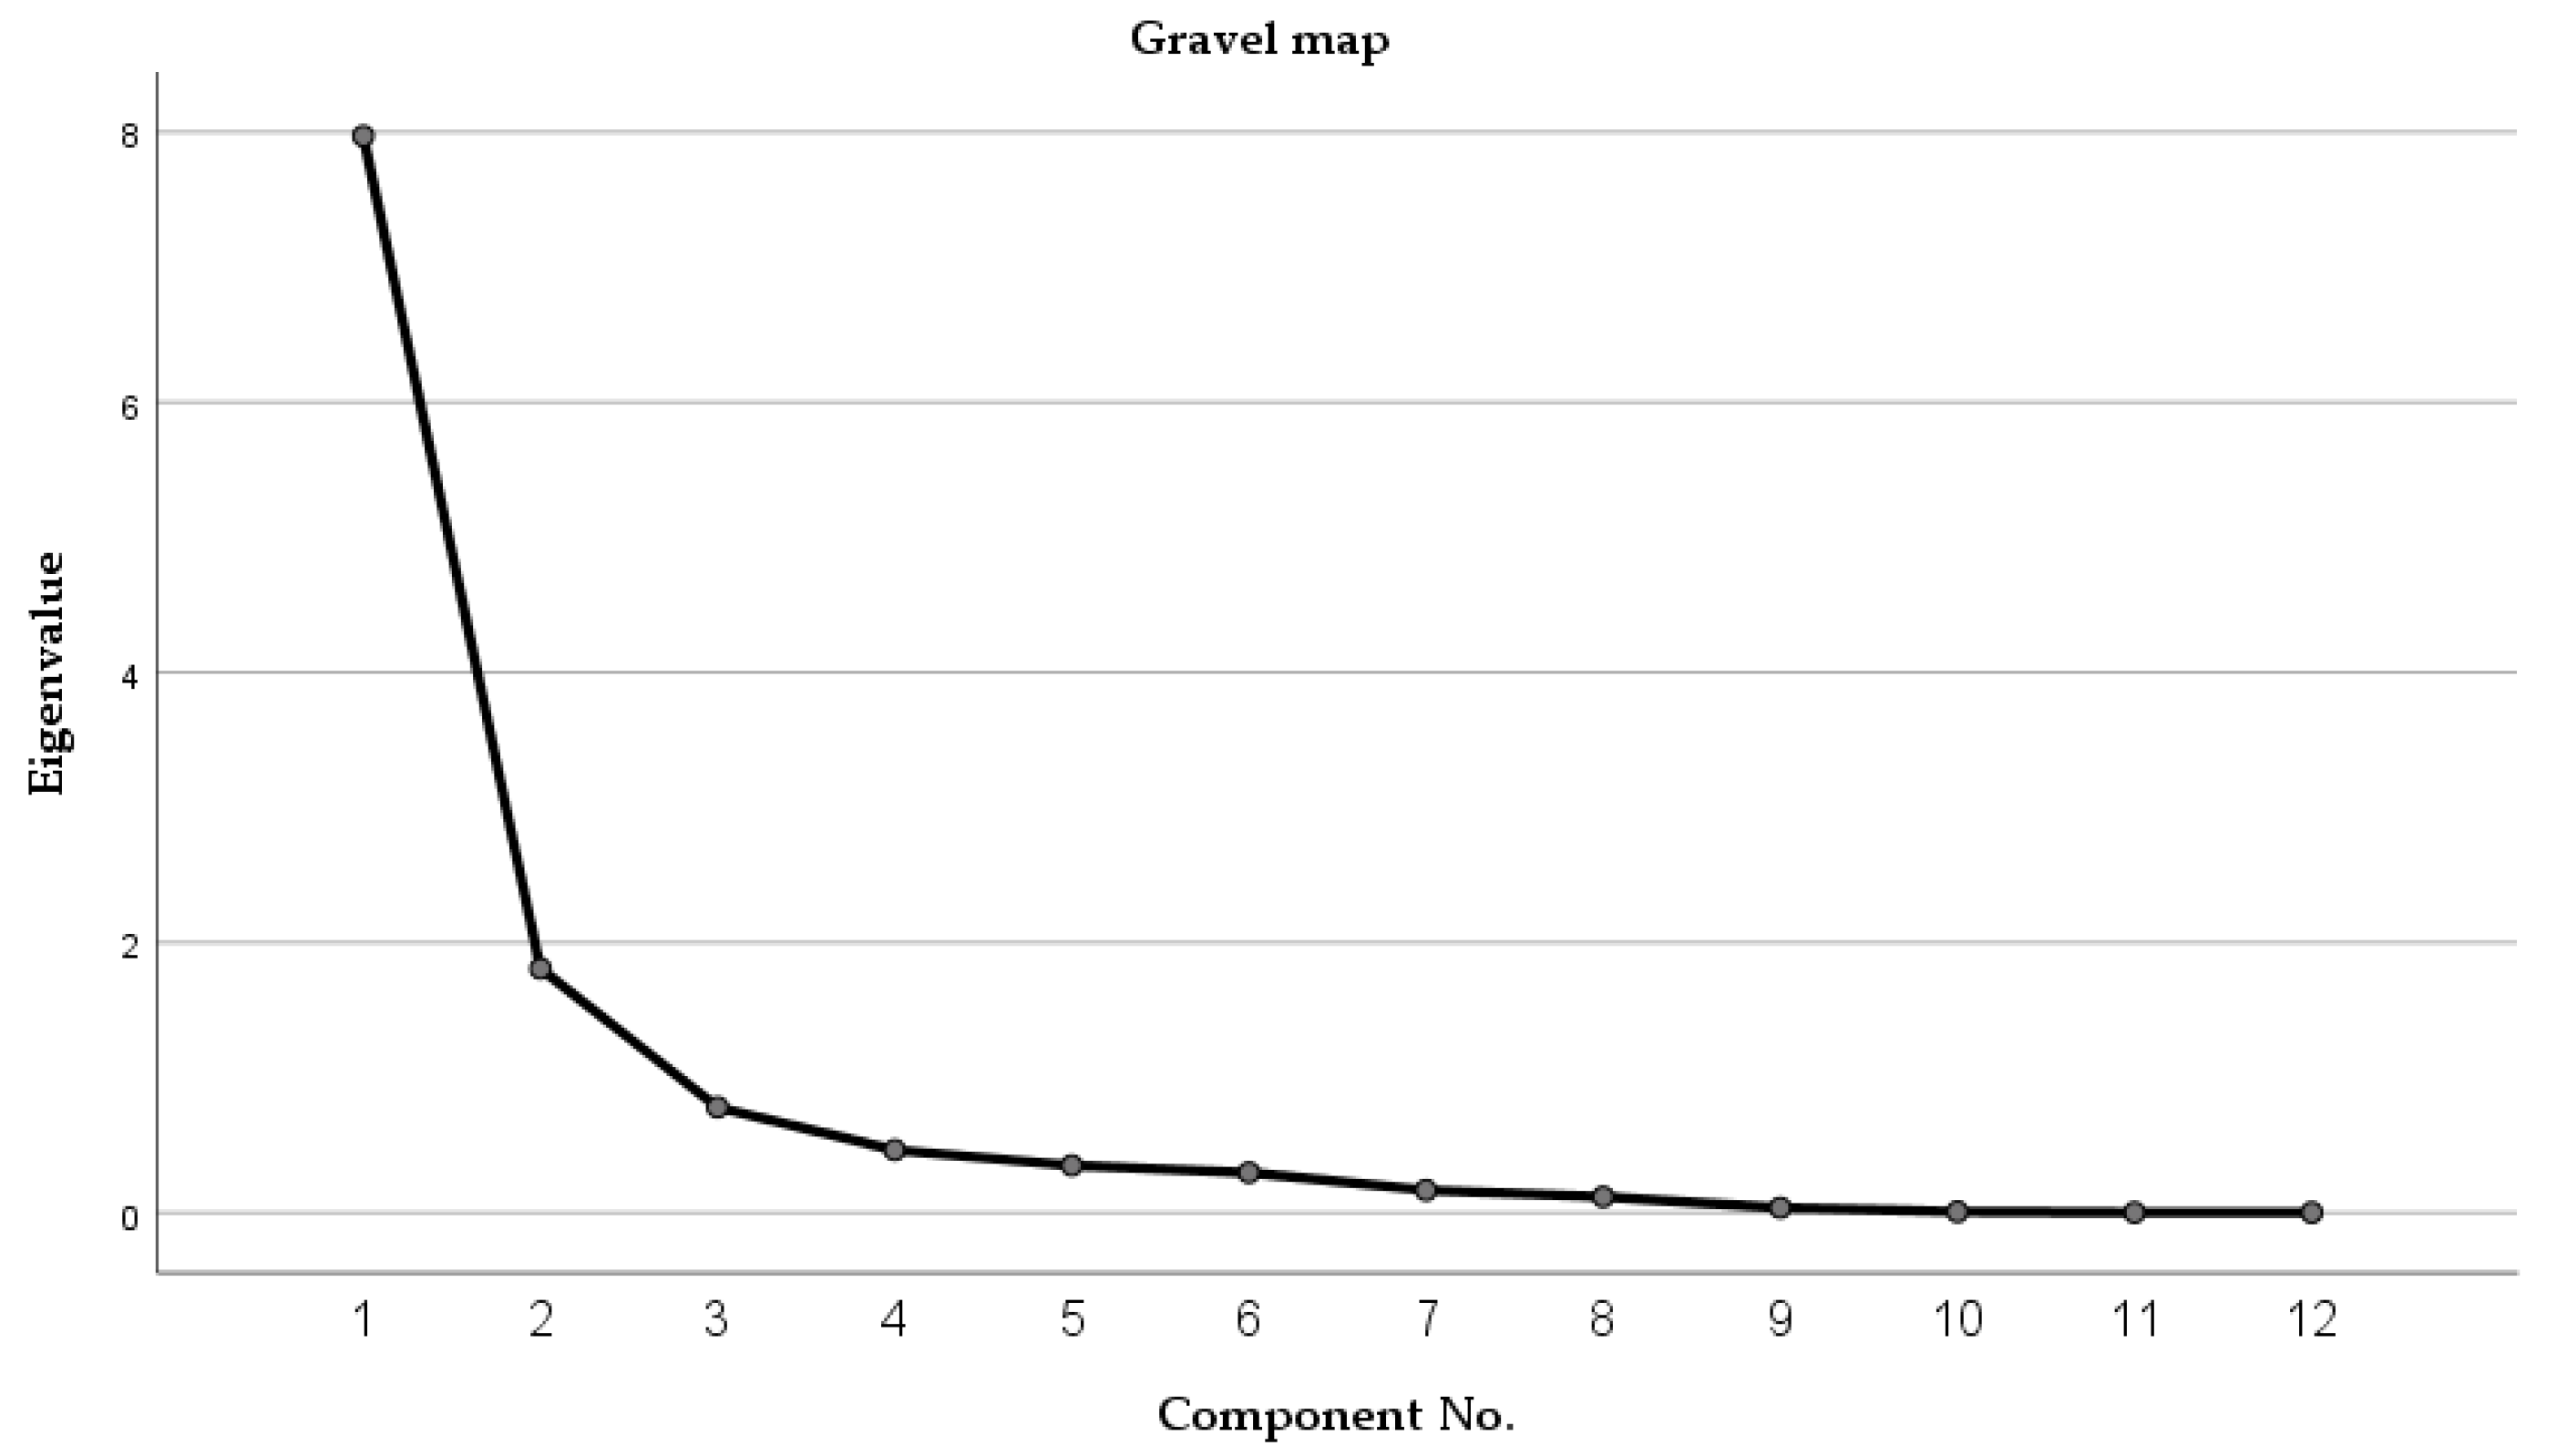
Next, the extraction of principal components was carried out, and from the gravel plot in Figure 11, it can be seen that the first two items have a clear trend and the eigenvalues are greater than 1. From the third item, it is relatively flat, indicating that the first two items are significant and can be used as principal components to represent the indicators. Therefore, the model extracted 2 initial eigenvalues greater than 1 from the 12 indicators as principal components, which are 7.851 and 1.794 as shown in Table 10, and the cumulative contribution of the 2 principal components reached 80.372%, covering more than 80% of the information of the original indicators.
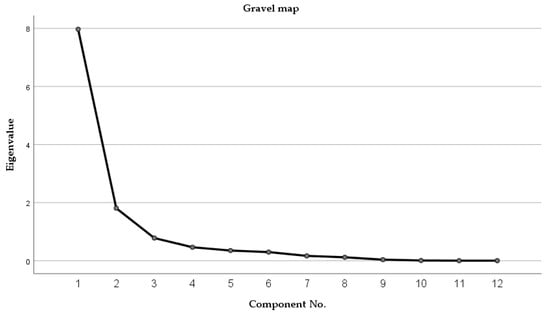
Figure 11.
Gravel map.
Table 10.
Initial eigenvalues of principal components and their contribution rates.
According to Table 11 of the rotated component matrix, we can see that public factor F1 has a large load on per capita disposable income, retail sales of social consumer goods, point density of public transport stations, point density of hospitals and pharmacies, point density of police stations, point density of cultural facilities, and point density of convenient service facilities, which means that it mainly explains these seven indicators. As these seven indicators include the economic level layer and social environment layer, they can be named as “economic and social environment factors”; the public factor F2 has a large load on the comprehensive landscape index and a relatively large load on the RSEI and hourly average AQI values, and these three indicators reflect the content related to urban ecological environment, so they can be named as “ecological environment factors”. In summary, the main factors affecting the livability and friendliness of Wuhan districts are economic and social environmental factors and ecological environmental factors.
Table 11.
Principal component loading matrix after rotation.
Since the two main factors reflect the quality of residents’ life from different aspects, the scores of each main factor in each district can be calculated according to the component score coefficient matrix (Table 12), and the urban livability composite index of each district in Wuhan is weighted according to the formula of 3.7 Urban livability composite index, using the contribution rate of the main factors’ eigenvalues as weights (Table 12). From Table 12, it can be seen that Jianghan District, Wuchang District, and Jiangan District ranked the top three in Wuhan City, while Dongxi Lake District, Jiangxia District, Huangpi District, and Xinzhou District ranked the last four. Jianghan District ranked first, with its economic and social environmental factors dominating as high as 2.23692 and ecological environmental factors scoring 0.7509, making it the city with the most excellent integrated economic, social, and ecological development. Qiaokou District and Hanyang District, as administrative districts with high livability and friendliness, showed negative scores for ecological environmental factors. The economic and social environmental factors and the composite index of Hannan District, Caidian District, Hongshan District, Qingshan District, Dongxi Lake District, Jiangxia District, Huangpi District and Xinzhou District are all negative, and the economic and social environmental factors seriously reduce the livability level of these areas, but the ecological environmental factors of Hannan District, Caidian District, and Jiangxia District all score above 1.0, and the ecological environment quality is better.
Table 12.
Urban livability index and ranking by district in Wuhan.
4.5. Spatial Pattern Analysis
4.5.1. Preliminary Analysis
For visual illustration, the spatial distribution of the composite index of urban livability was identified using ArcGIS (Figure 12). Combining Table 13 and Figure 12, it can be seen that the overall urban livability index of five of the seven central urban districts of Wuhan: Jianghan, Wuchang, Jiangan, Qiaokou and Hanyang, is high, with Jianghan District ranking first with an overall index of about 1.58. This is mainly due to Wuhan’s special urban pattern, which is not monocentric but rather “polycentric”.
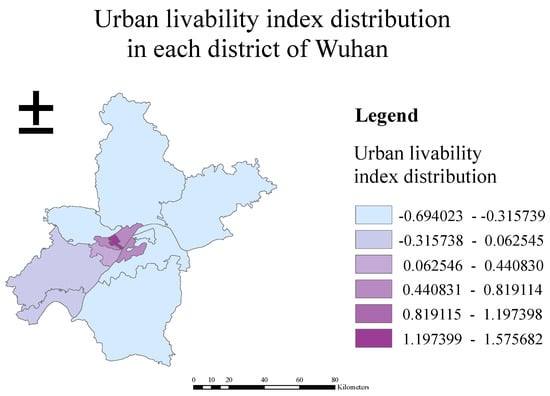
Figure 12.
Distribution of urban livability index in each district of Wuhan.
Table 13.
Urban livability composite index of Wuhan City by district.
4.5.2. LISA Analysis
In order to identify and discern the comprehensive urban livability index of each district and detect the spatial association patterns of units within the region more clearly, this study applies the LISA analysis commonly used in ESDA to reveal their association patterns and their distribution patterns on a local spatial basis.
Before conducting LISA analysis, the spatial weight matrix is first determined using GeoDa software. The available determination methods are mainly distance-based spatial weight matrix, first-order neighborhood matrix based on the neighborhood concept, higher-order neighborhood matrix, and K-value nearest neighbor spatial matrix, which are usually calculated using the neighborhood criterion or distance criterion. According to the neighboring relationship of each unit, the binary neighboring weight matrix is used. The spatial weight matrix based on the neighboring concept includes two kinds of Rook and Queen, and the former is chosen in this study to measure the comprehensive urban livability index of each district in Wuhan City, and its spatial association pattern presents a high-high type.
Specifically, there are two districts with high-high characteristics, namely Jianghan District and Wuchang District, which are located in the most central area of Wuhan City and are the center of Wuhan’s central urban area. This type of city has a high overall index of urban livability with its neighboring districts, and shows a significant positive correlation and spatial homogeneity among them, which has become the “peak” (hot spot) of the city-wide overall index of urban livability. Analyzing the data of each index, we can see that the two districts have the highest per capita disposable income.
The data of each index shows that the two districts are at a higher level in terms of per capita disposable income, retail sales of social consumer goods, density of facilities, landscape index, and environmental conditions, and the overall livability level is higher than the surrounding areas.
5. Conclusions
In this study, the evaluation system of livability and friendliness of each district in Wuhan was constructed by considering three aspects of the city: ecological, economic, and social. The TOPSIS evaluation method was used to evaluate the quality of urban residents’ life in each district of Wuhan City from 12 indicators in three dimensions included in the evaluation system. In addition, principal component analysis was also used to extract the principal components of the 12 indicators and to calculate the overall index of urban livability in each district of Wuhan for a comprehensive evaluation. Finally, LISA analysis was used to investigate the spatial association patterns of each district within Wuhan City, and the following conclusions were obtained.
Through TOPSIS evaluation, we can get the relatively best quality of life for Wuhan residents in Jianghan District, which is the district with the first value, the first category of districts with excellent quality of life also includes Wuchang District and Jiangan District ( value > 0.5), the second category of districts with medium quality of life includes Caidian District, Hanyang District, Jiangxia District, Qiaokou District. and Hannan District (0.3 < value < 0.5). The third category of districts with average quality of life includes Hongshan District, Xinzhou District, Huangpi District, Qingshan District, and Dongxi Lake District ( value < 0.3).
Through principal component analysis, we can get that the primary factors affecting the quality of life of urban residents in Wuhan districts are economic and social factors, followed by ecological and environmental factors, with a cumulative contribution rate of 80%, which shows that economic and social factors still occupy an important position in affecting the quality of life of residents in Wuhan districts, but ecological and environmental factors also play an important role.
The first category is Jianghan District, which has excellent scores in economic and social factors and good development in ecological environment; the second category is Wuchang District, Jiangan District, Qiaokou District, among which Qiaokou District has poor scores in ecological environment factors, which affects its livability and friendliness; the third category is Hanyang District, whose economic and social factors and eco-environmental factors are average and relatively balanced; the fourth category is Hannan District, Caidian District, Hongshan District, and Qingshan District, among which Hannan District and Caidian District have excellent scores in ecological factors, but their livability index is affected by the backward development of economic and social factors; the fifth category is Dongxihu District, Jiangxia District, Huangpi District, and Xinzhou District, and the last three economic and social development are too poor to dominate their livability composite index, and the score is lagging behind.
Using LISA analysis to reveal the distribution of spatial patterns and integrating the TOPSIS evaluation scores and the comprehensive urban livability index of each district in Wuhan, Jianghan District, and Wuchang District, which are the centers of Wuhan’s central urban area, have the top two TOPSIS evaluation rankings and comprehensive index scores, and show high-high type local characteristics, and both have higher comprehensive livability levels than the surrounding areas, while the TOPSIS evaluation rankings and comprehensive index scores of Dongxi Lake District, Huangpi District and Xinzhou District are all in the bottom, and have lower comprehensive livability levels.
6. Recommendation
6.1. Economic Perspective
In terms of economic level, Hannan District, as the economic development zone of Wuhan City, has a total GDP of 164.35 billion yuan for the year 2019, with a real growth of 6.6%. Its growth rate was 0.8 percentage points lower than that of the city, although the economy steadily ranked at the forefront of the city, especially in the 13 municipal districts occupying the top of the list. Hannan District’s economic operation is generally stable; stable to good development trend. However, the level of economic development is not a comprehensive measure of urban livability and living standards, as TOPSIS analysis shows that it ranks 8th, while the overall living standards index ranks 6th in the city, due to its single industry, mainly high-tech development and relatively few other industries, resulting in a small population. Therefore, Hannan District needs to delineate a new spatial pattern of urban development and position the “3 + N” modern industrial system, i.e., make every effort to build three pillar industrial clusters of automobile, new energy, and new materials. At the same time, it should focus on developing four characteristic support industries: smart home, green building, general aviation, and life health. The development of multi-industrialization can further promote economic development and improve the quality of life of the residents at the same time.
Dongxi Lake, which is also a development zone, differs greatly from Hannan District, ranking first from the bottom in TOPSIS analysis, while its livability index ranks 10th in the city. Its economic development is ranked high, but its employment opportunities are few. In the Dongxi Lake area, there are more industries and factories, and the high-tech high-end industries are much inferior compared with the Optics Valley, resulting in many young people not being able to find jobs in the Dongxi Lake area even if they buy houses in Dongxi t Lake, and they can generally only find jobs in Hankou, Wuchang, and Optics Valley, so there are fewer employment opportunities. At the same time, the supporting facilities in the region are not perfect, and the commercial and educational facilities are weak. The quality of education in Dongxi Lake is at the bottom of Wuhan, and the lack of commercial living and education support of the Dongxi Lake area is not high. However, Dongxi Lake District is not an ordinary suburb, it has abundant lakes and wetlands, i.e., a good ecological environment. Therefore, Dongxi Lake District should seize the opportunity of its better ecological environment to create an ecological industry chain, while expanding schools and institutes and strengthening the integration of industry and education.
On the contrary, Caidian District, the bottom district of Wuhan City’s GDP in 2019, has a TOPSIS analysis ranking of 4 and a quality-of-life index ranking of 7. Its urban livability is more impressive. The main reason for the lagging GDP is that Caidian District is very much the area available for development, and a large area of the golden development corridor facing the Yangtze River in the region is all allocated to other districts, and its sustainable economic development is limited by objective conditions. It does not enjoy the benefits of the Yangtze River Golden Waterway, which limits Caidian’s economic outreach. However, Caidian District has green land such as Houguan Lake National Wetland Park, hence a considerable ecological environment. Therefore, Caidian District can build a demonstration belt for rural revitalization around the development of regional tourism, and a demonstration belt for exquisite agriculture along the Han River around the promotion of agricultural transformation and upgrading. At the same time, it can unite with neighboring development zones to develop together with their respective advantages, thus creating an ecological city integrating industrial innovation, ecological livability, and low-carbon demonstration, as well as an industrial new city with Caidian Economic Development Zone as the main development of advanced manufacturing.
6.2. Society Perspective
In terms of social environment level: The social level of this study takes the mean value of point density of five types of social service facilities: bus stops, hospitals and pharmacies, police stations, cultural facilities, and convenience services as the analysis index, and the size of the mean value of point density reflects the construction of social service facilities, which in turn can be used to rate each area of Wuhan at the social level.
According to the map visualization results of POI point density of various service facility types, four regions, namely Jianghan District, Wuchang District, Jiangan District, and Qiaokou District, show obvious advantages. Among them, the highest mean value of point density of five types of social service facility distribution is in Jianghan District, which indicates that the social service facilities in Jianghan District are better constructed and the facility points are densely distributed. After comparing the principal factor scores of the principal component analysis and the indicators, we can conclude that the important reason why Jianghan District was finally ranked first in terms of livability and friendliness was the advantage of the social level score. The top-ranked Wuchang, Jiangan, and Qiaokou districts have an above-average number of social service facilities, and their residents’ livability and friendliness scores also perform better. Therefore, the construction of service facilities is an important part of promoting the social livability dimension. However, almost all of the areas with good social scores are located in the central part of Wuhan, concentrated in the “three towns of Wuhan”. The peripheral areas of Wuhan, such as Hannan, Jiangxia, Huangpi, and Xinzhou, have many villages and a wide population distribution. The results of this study show that the average density of various social service facilities in the above-mentioned areas is small, indicating that the social service facilities are not well built, and there are problems such as insufficient quantity and density. In order to improve the friendliness of urban residents, the overall configuration level of social welfare facilities in the regions with insufficient performance of social dimensions is low, and the number of residential areas where various types of service facilities can be reached is low. Relevant departments and policymakers should focus on supplementing the social service facilities in the area, accordingly, improving the construction of service facilities in the area and solving the contradiction between residents’ needs and the unbalanced allocation of facilities. At the same time, it is recommended that spatial analysis should be conducted before the construction of social service facilities in each district, starting from the degree of people’s demand and studying the existing layout of such service facilities to achieve reasonable layout and optimal site selection. The site selection should take into account the gathering of the regional population to avoid the waste of public resources caused by unreasonable site selection. This will also play a role in improving the unbalanced spatial distribution of social service facilities in Wuhan, which is “clustered in the middle and scattered around”.
6.3. Ecologic Perspective
In terms of eco-environmental level, from the principal component analysis, it can be seen that Qiaokou District and Qingshan District have the worst scores in eco-environmental factors. Although Qiaokou District has better economic and social factors than Jiangan District which is in the 3rd place, its ecological factors score is less than −1.0. The performance of ecological factors makes Qiaokou District far from the positive ideal solution and close to the negative ideal solution, and the TOPSIS evaluation ranking is low. From the specific indexes of ecological environment factors, it can be seen that Qiaokou District has a good performance of RSEI ecological index, while the hourly AQI value is too high, which indicates that the air quality greatly restricts the ecological development of Qiaokou District. Qiaokou District is connected to the new heart city of Jianghan District in the north and the old central city of Hanyang District in the south, which is within the third ring of Wuhan. Therefore, Qiaokou District should firmly grasp the geographical advantage, integrate the concept of ecological civilization development into the regional development in order to play the charm of the waterfront area, comprehensively improve the quality of air environment, and build an ecological and livable Qiaokou District together with Gutian New Ecological Zone in the west. Similar to it is Qingshan District, which is also located in the center of Wuhan and adjacent to the ecologically livable urban area of Wuchang District. In the past, Qingshan District was an industrial town, famous for steel making, known as the “Ten Mile Steel City”, and now the secondary industry is still the main industry in Qingshan District. However, this has also caused the ecological environment in Qingshan District to lag behind. From the overall livability index and TOPSIS ranking, the quality of life and livability in Qingshan District are poor, with the ecological environment factor scoring last. It can be seen that to create a livable Qingshan District, it is necessary to grasp the “green ecology” to implement a regional coordinated development strategy and adjust the industrial structure to coordinate the development of circular economy in the whole district. Looking at the urban areas with negative overall livability index, there are five urban areas with negative eco-environmental factor scores, among which Hongshan District, Dongxi Lake District and Xinzhou District are also lagging behind in TOPSIS ranking. It is a long way to go to make Wuhan a livable “green city”. In the future development, it is necessary to analyze each urban area according to its pollutant emission, urban noise, greening, etc., in order to help Wuhan build a comprehensive and good ecological livable city.
Author Contributions
Data curation, W.T.; Formal analysis, H.C.; Methodology, H.C.; Project administration, W.L.; Software, Y.T.; Visualization, W.Z.; Writing—original draft, H.F.; Writing—review & editing, H.C. All authors have read and agreed to the published version of the manuscript.
Funding
This research received no external funding.
Data Availability Statement
Not applicable.
Conflicts of Interest
The authors declare no conflict of interest.
References
- Kashef, M. Urban livability across disciplinary and professional boundaries. Front. Arch. Res. 2016, 5, 239–253. [Google Scholar] [CrossRef]
- Schalock, R.L. The concept of quality of life: What we know and do not know. Intellect. Disabil. Res. 2004, 48, 203–216. [Google Scholar] [CrossRef] [PubMed]
- Felce, D.; Perry, J. Quality of life: Its definition and measurement. Res. Dev. Disabil. 1995, 16, 51–74. [Google Scholar] [PubMed]
- Fewsmith, J. Promoting the scientific development concept. J. China Leadersh. Monit. 2004, 11, 1–10. [Google Scholar]
- MacPherson, S. Social Development as an Organizing Concept for Social Progress; Routledge: London, UK, 2019; pp. 26–42. [Google Scholar]
- Chen, M.; Ye, C.; Lu, D.; Sui, Y.; Guo, S. Cognition and construction of the theoretical connotations of new urbanization with Chinese characteristics. J. Geogr. Sci. 2019, 29, 1681–1698. [Google Scholar] [CrossRef]
- Zalnejad, K.; Hossein, S.F.; Alipour, Y. The Impact of Livable City’s Principles on Improving Satisfaction Level of Citizens; Case Study: District 4 of Region 4 of Tehran Municipality. J. Arman. Archit. Urban Dev. 2019, 12, 171–183. [Google Scholar]
- Huang, K.X.; Ning, L.; Tian, G. Conquering China’s Unbalanced and Inadequate Development: Macroeconomic Outlook, Policy Simulations, and Reform Implementation-A Summary of Annual SUFE Macroeconomic Report (2017–2018). J. Front. Econ. China 2018, 13, 147–170. [Google Scholar]
- Mikhaylov, A.S. Socio-spatial dynamics, networks and modelling of regional milieu. Entrep. Sustain. Issues 2018, 5, 1020–1030. [Google Scholar] [CrossRef]
- Dong, M.; Zou, B.; Pu, Q.; Wan, N.; Yang, L.; Luo, Y. Spatial pattern evolution and casual analysis of county level economy in Changsha-Zhuzhou-Xiangtan urban agglomeration, China. Chin. Geogr. Sci. 2014, 24, 620–630. [Google Scholar] [CrossRef]
- Qiu, B.W.; Wang, Q.M.; Chen, C.C.; Chi, T.H. Spatial Autocorrelation Analysis of Multi-scale Land Use in Fujian Province. J. Nat. Resour. 2007, 22, 311–320. [Google Scholar]
- Kozina, J.; Bole, D. The impact of territorial policies on the distribution of the creative economy: Tracking spatial patterns of innovation in Slovenia. Hung. Geogr. Bull. 2018, 67, 259–273. [Google Scholar] [CrossRef]
- Xuan, G.F.; Jian-Gang, X.U.; Zhao, J. An Analysis of Urban Social Space Based on ESDA-A Case Study of the Central Urban District in Shanghai. Sci. Geogr. Sin. 2010, 30, 22–29. [Google Scholar]
- Wang, P.A.; Luo, W.H.; Bai, Y.P. Comparative Analysis of Aggregation Detection Based on Spatial Autocorrelation and Spatioal-Temporal Scan Statitstics. J. Hum. Geogr. 2012, 27, 119–127. [Google Scholar]
- Zhu, W.; Chen, J. The spatial analysis of digital economy and urban development: A case study in Hangzhou, China. Cities 2022, 123, 103563. [Google Scholar] [CrossRef]
- Song, M.; Xie, Q. Evaluation of urban competitiveness of the Huaihe River eco-economic belt based on dynamic factor analysis. Comput. Econ. 2021, 58, 615–639. [Google Scholar] [CrossRef]
- Li, Z.I.; Chen, M.M.; Pan, L.M. The Measurement and Evaluation of the Residents’ Life Quality Based on the Factor Analysis. Northwest Popul. J. 2012, 33, 22–26. [Google Scholar]
- Sarfraz, M.S.; Tripathi, N.K.; Tipdecho, T.; Thongbu, T.; Kerdthong, P.; Souris, M. Analyzing the spatio-temporal relationship between dengue vector larval density and land-use using factor analysis and spatial ring mapping. BMC Public Health 2012, 12, 853. [Google Scholar] [CrossRef] [Green Version]
- Wang, J.; Li, M.; Liu, Y.; Zhang, H.; Zou, W.; Cheng, L. Safety assessment of shipping routes in the South China Sea based on the fuzzy analytic hierarchy process. Saf. Sci. 2014, 62, 46–57. [Google Scholar] [CrossRef]
- Kumar, S.; Gautam, S.K.; Kumar, A.; Maithan, R.; Kumar, A. Sustainability assessment of different nanoparticle for heat exchanger applications: An intuitionistic fuzzy combinative distance-based assessment method. Acta Innov. 2021, 40, 44–63. [Google Scholar] [CrossRef]
- Sun, Y.; Liang, X.; Xiao, C. Assessing the influence of land use on groundwater pollution based on coefficient of variation weight method: A case study of Shuangliao City. Environ. Sci. Pollut. Res. 2019, 26, 34964–34976. [Google Scholar] [CrossRef]
- Liu, J.X.; Han, B.; Wang, M. Using multi-source data to assess livability in Hong Kong at the community-based level: A combined subjective-objective approach. Geogr. Sustain. 2020, 1, 284–294. [Google Scholar] [CrossRef]
- Turkoglu, H. Sustainable development and quality of urban life. Procedia Soc. Behav. Sci. 2015, 202, 10–14. [Google Scholar] [CrossRef]
- Royuela, V.; Moreno, R.; Vaya, E. Influence of quality of life on urban growth: A case study of Barcelona, Spain. Reg. Stud. 2010, 44, 551–567. [Google Scholar] [CrossRef]
- Linares, S.; Mikkelsen, C.A.; Velázquez, G.A.; Celemín, J.P. Spatial segregation and quality of life: Empirical analysis of medium-sized cities of buenos aires province. Indic. Qual. Life Lat. Am. 2016, 62, 201–218. [Google Scholar]
- Delmelle, E.; Thill, J.C.; Wang, C.H. Spatial dynamics of urban neighborhood quality of life. Ann. Reg. Sci. 2016, 56, 687–705. [Google Scholar] [CrossRef]
- Dadashpoor, H.; Khalighi, N. Investigating spatial distribution of regional quality of life (RQoL) in Iran between 1996 and 2011. Soc. Indic. Res. 2016, 127, 1217–1248. [Google Scholar] [CrossRef]
- Geng, S.B.; Zhu, W.R.; Shi, P.L. A functional land use classification for ecological, production and living spaces in the Taihang Mountains. J. Resour. Ecol. 2019, 10, 246–255. [Google Scholar]
- Liu, J.; Ye, J.; Yang, W.; Yu, S.X. Environmental impact assessment of land use planning in Wuhan city based on ecological suitability analysis. Procedia Environ. Sci. 2010, 2, 185–191. [Google Scholar]
- Xu, H.Q. A remote sensing index for assessment of regional ecological changes. China Environ. Sci. 2013, 33, 889–897. [Google Scholar]


Publisher’s Note: MDPI stays neutral with regard to jurisdictional claims in published maps and institutional affiliations. |
© 2022 by the authors. Licensee MDPI, Basel, Switzerland. This article is an open access article distributed under the terms and conditions of the Creative Commons Attribution (CC BY) license (https://creativecommons.org/licenses/by/4.0/).