
Developing a Quality 4.0 Implementation Framework and Evaluating the Maturity Levels of Industries in Developing Countries


Abstract
:1. Introduction
- ▪
- How can industries implement Quality 4.0 in developing countries?
- ▪
- What is the extent of industry implementation of the overall Quality 4.0 framework?
- ▪
- What are the factors influencing the implementation of Quality 4.0 in industry?
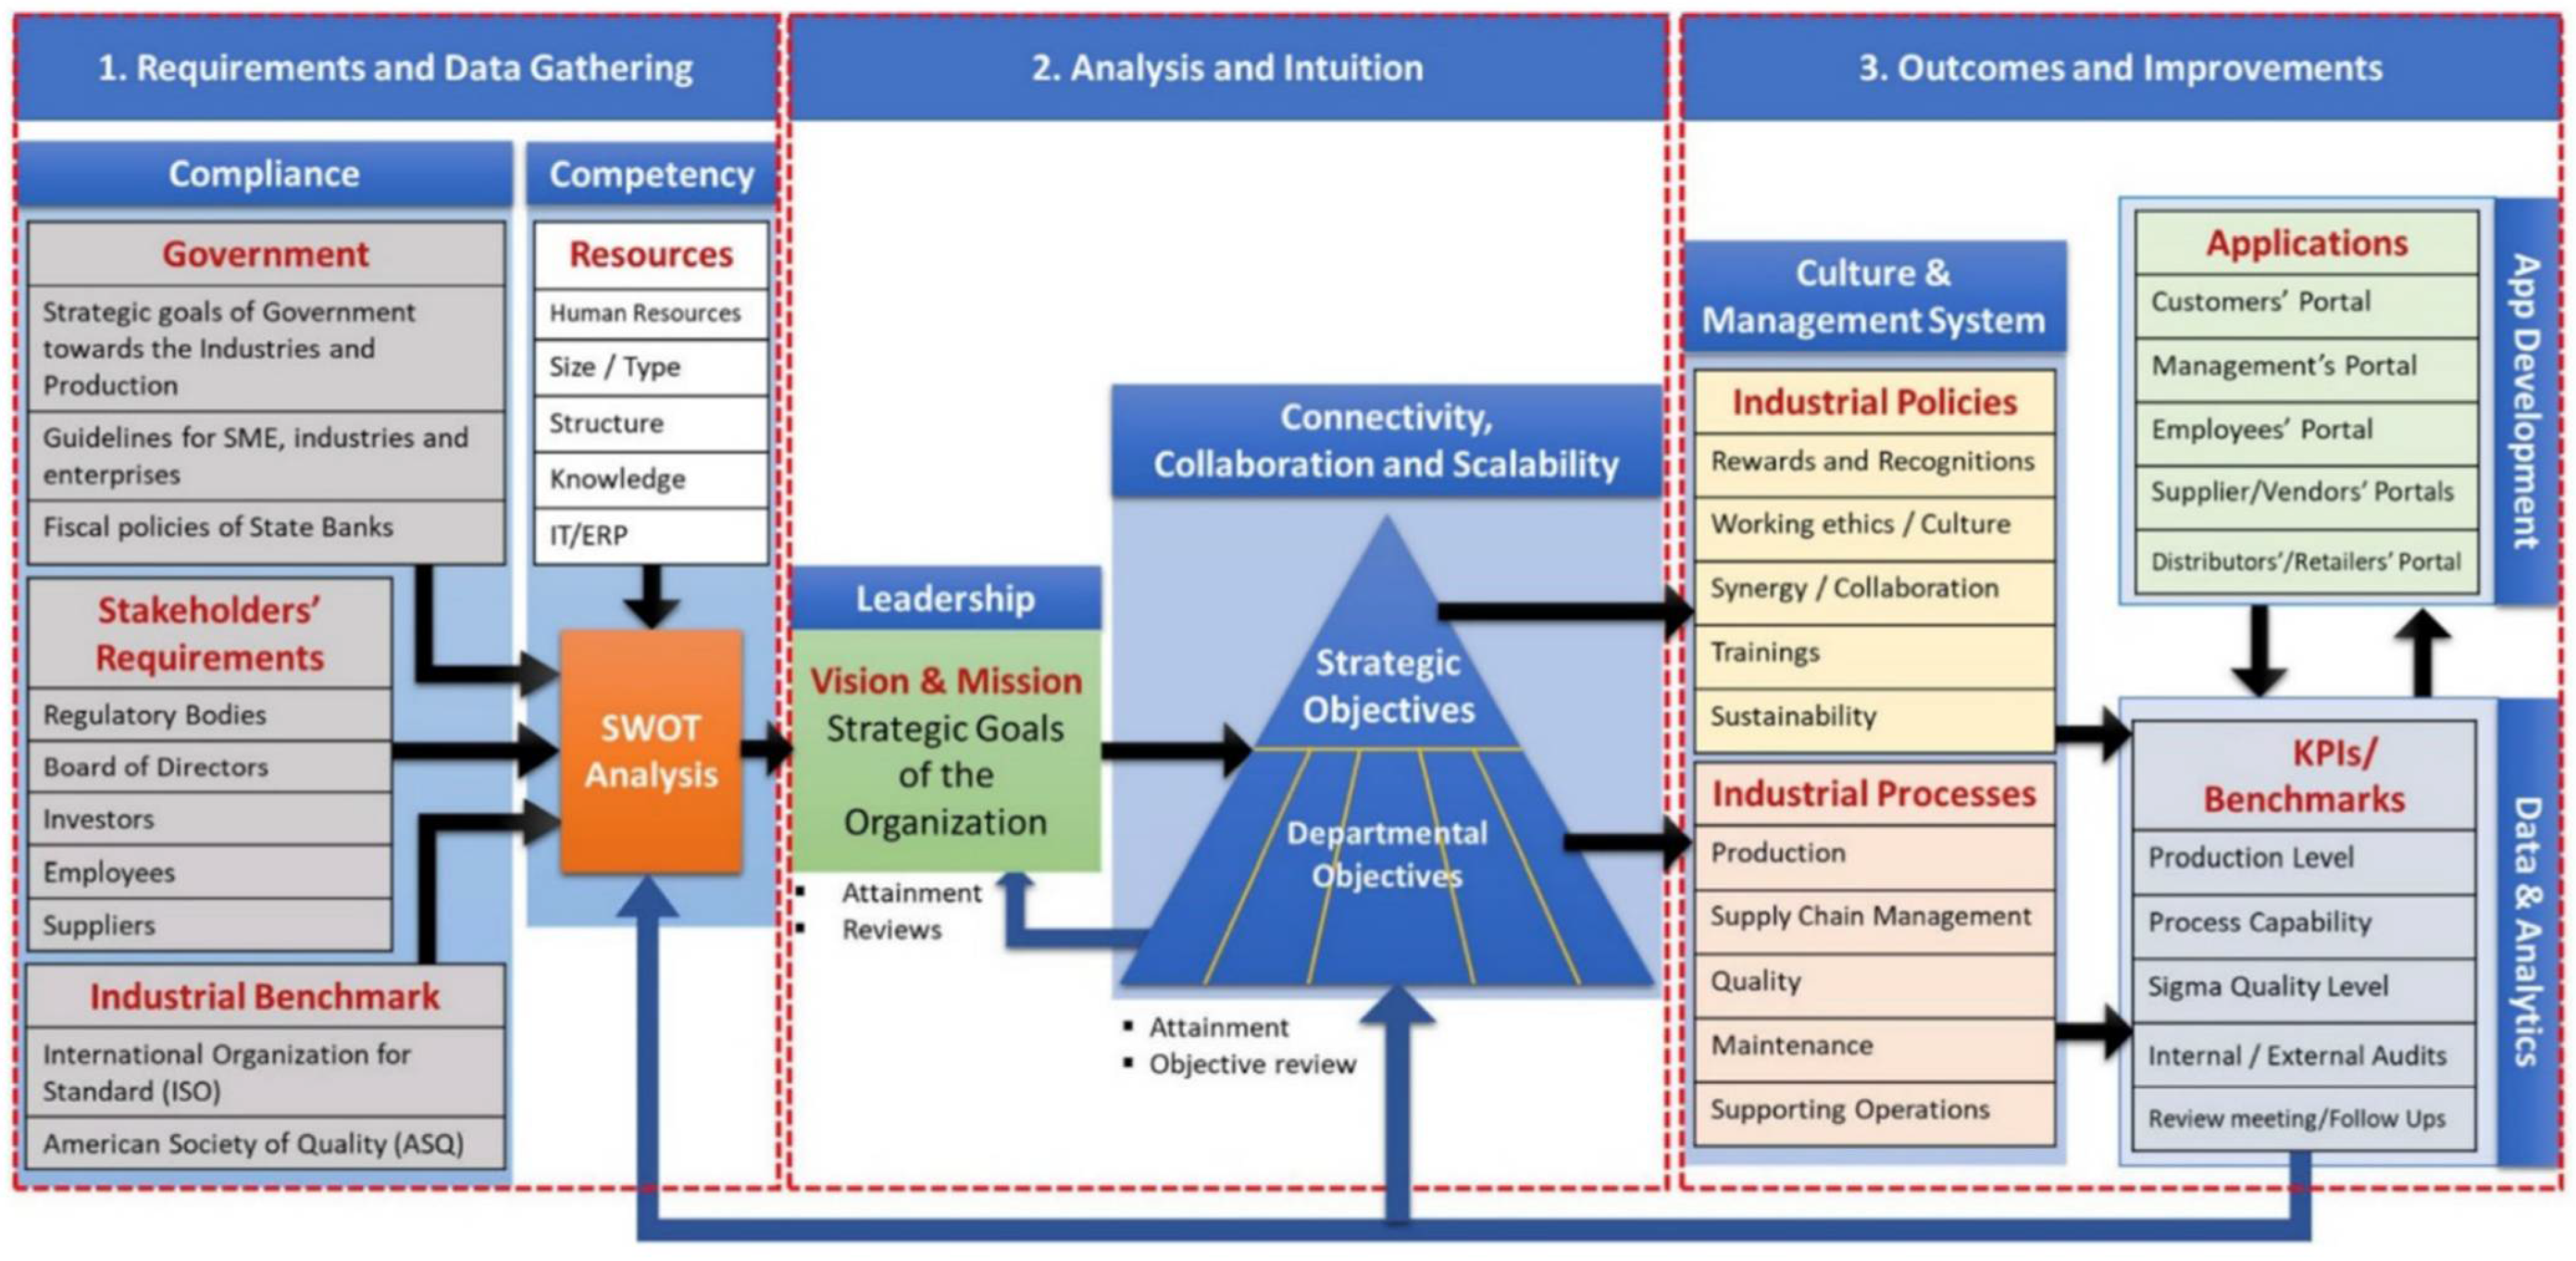
2. Conceptualization and Implementation of Quality 4.0 Framework
| (i) Compliance | (iv) Connectivity | (vii) Management System | (x) Data |
| (ii) Competency | (v) Collaboration | (viii) Web-based Applications | (xi) Analytics |
| (iii) Leadership | (vi) Culture | (ix) Scalability |
2.1. Compliance
2.2. Competency
2.3. Leadership
2.4. Connectivity
2.5. Collaboration
2.6. Scalability
2.7. Culture
2.8. Management System
2.9. App Development
2.10. Data Gathering
2.11. Analytics
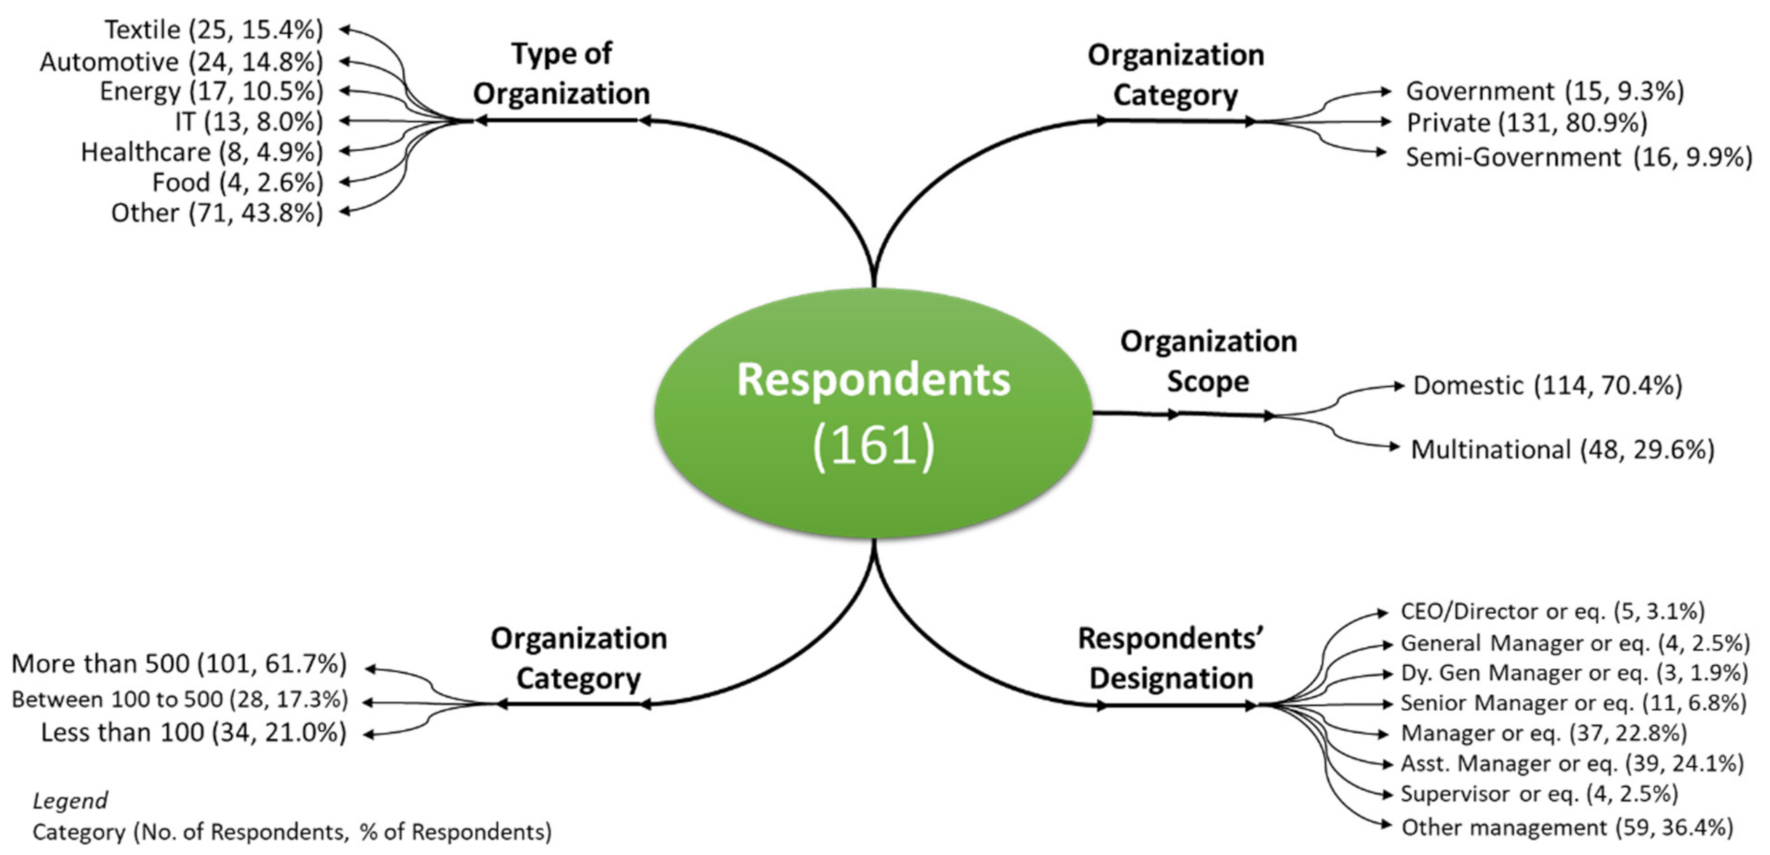
3. Research Instrument and Sampling
4. Statistical Analysis & Results
5. Recommendations
6. Conclusions
- ▪
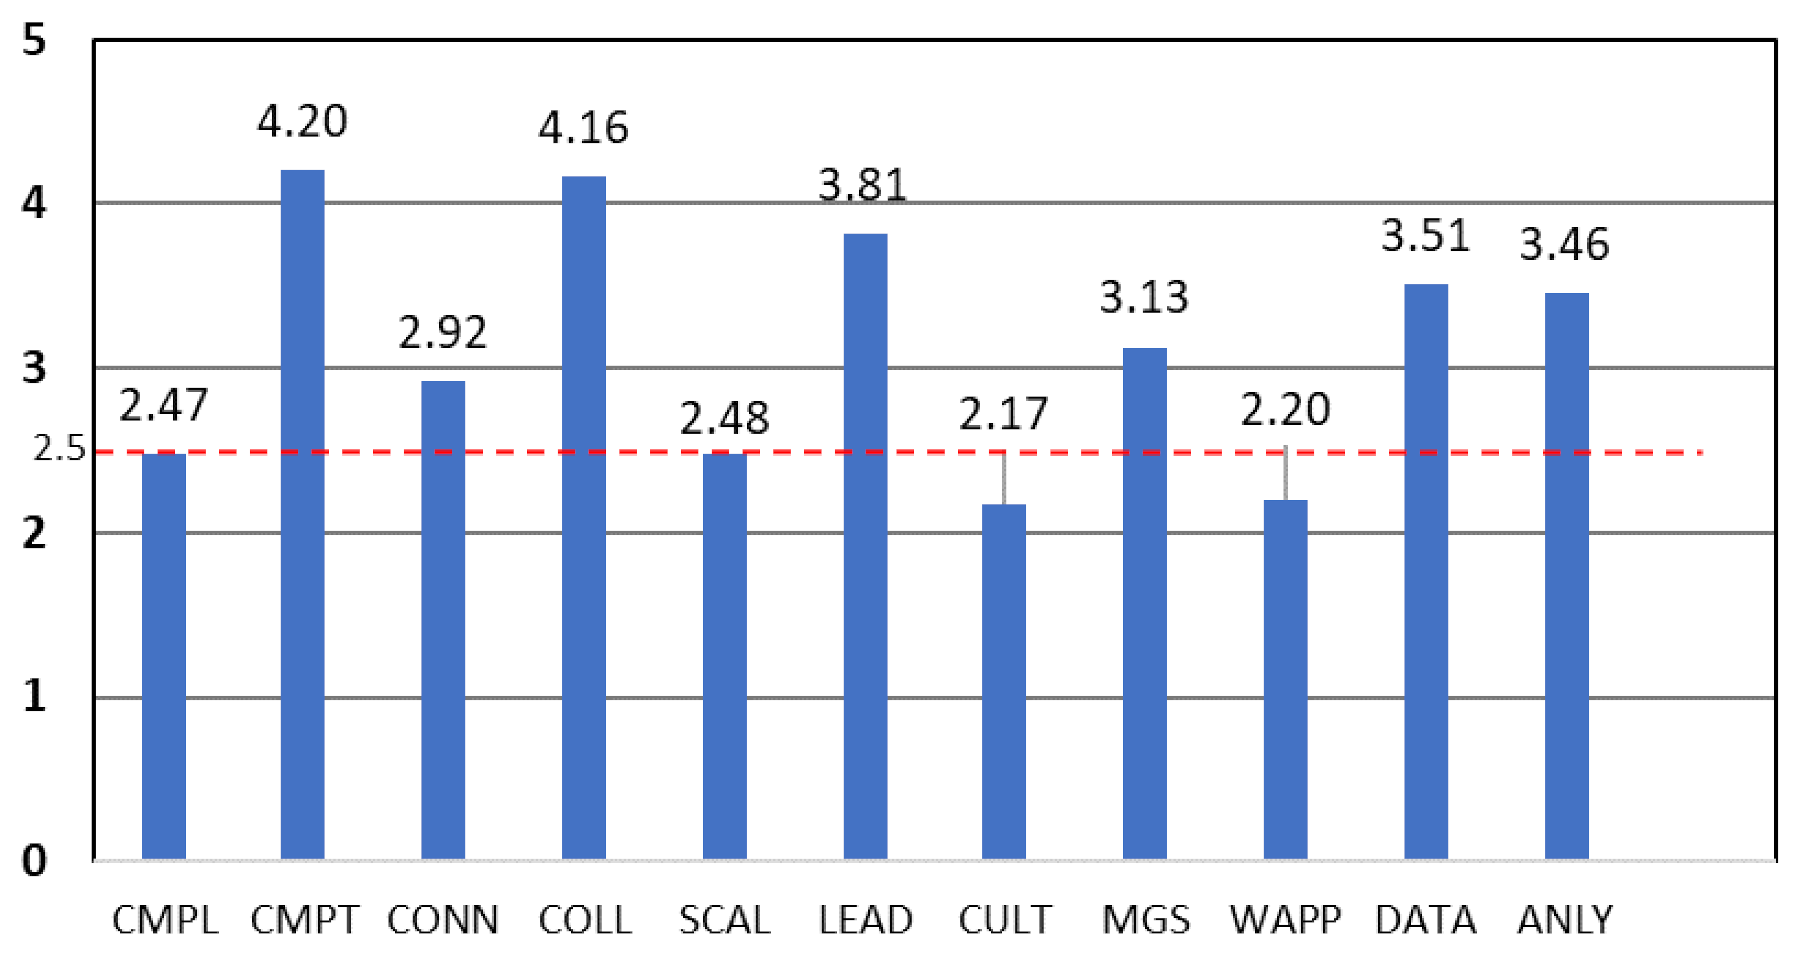
- Quality 4.0 is not fully implemented in Pakistani industry.
- ▪
- The eleven dimensions of the Quality 4.0 are not implemented well in the industry, especially compliance, scalability, culture, and app development. These need the attention of industry for implementation.
- ▪
- Implementation of one dimension of the Quality 4.0 framework has direct impacts on the others; hence, complying with the requirements of one dimension may result in the implementation of other Quality 4.0 dimensions.
- ▪
- Quality 4.0 is not implemented in small domestic organizations, but more in-depth analysis shows that it is also not well implemented in multinational and large organizations.
Author Contributions
Funding
Institutional Review Board Statement
Informed Consent Statement
Data Availability Statement
Acknowledgments
Conflicts of Interest
References
- Montgomery, D.C. Statistical Quality Control, 6th ed.; John Willey and Sons: Hoboken, NJ, USA, 2008. [Google Scholar]
- Taguchi, G. Quality engineering in Japan. Commun. Stat.-Theory Methods 1985, 14, 2785–2801. [Google Scholar] [CrossRef]
- Gryna, F.M.; Chua, R.C.; DeFeo, J.A. Juran’s Quality Planning and Analysis: For Enterprise Quality; Tata McGraw-Hill Education: Gautam Buddha Nagar, India, 2006. [Google Scholar]
- Javaid, M.; Haleem, A.; Singh, R.P.; Suman, R.; Gonzalez, E.S. Understanding the adoption of Industry 4.0 technologies in improving environmental sustainability. Sustain. Oper. Comput. 2022, 3, 203–217. [Google Scholar] [CrossRef]
- Villagrán, N.V.; Estevez, E.; Pesado, P.; Marquez, J.J. Standardization: A Key Factor of Industry 4.0. In Proceedings of the Sixth International Conference on eDemocracy & eGovernment (ICEDEG), Quito, Ecuador, 24–26 April 2019. [Google Scholar] [CrossRef]
- Standardization Council Industrie 4.0. German Standardization Roadmap Industrie 4.0, Version 4.0. 2020. Available online: www.din.de (accessed on 20 August 2022).
- Habrat, D. Legal challenges of digitalization and automation in the context of Industry 4.0. Procedia Manuf. 2020, 51, 938–942. [Google Scholar] [CrossRef]
- Maddikunta, P.K.R.; Pham, O.V.; Prabadevi, B.; Deepa, N.; Dev, K.; Gadekallu, T.R.; Ruby, R.; Liyanage, M. Industry 5.0: A survey on enabling technologies and potential applications. J. Ind. Inf. Integr. 2022, 26, 100257. [Google Scholar] [CrossRef]
- Fazal, N.; Haleem, A.; Bahl, S.; Javaid, M.; Nandan, D. Digital Management Systems in Manufacturing Using Industry 5.0 Technologies. In Advancement in Materials, Manufacturing and Energy Engineering 2022, II; Lecture Notes in Mechanical Engineering; Verma, P., Samuel, O.D., Verma, T.N., Dwivedi, G., Eds.; Springer: Singapore, 2022. [Google Scholar] [CrossRef]
- Elangovan, U. Industry 5.0: The Future of the Industrial Economy, 1st ed.; CRC Press: Oxon, UK, 2022. [Google Scholar]
- Quality 4.0, Quality Glossary Definition: Quality 4.0, American Society of Quality (ASQ). Available online: www.asq.org (accessed on 20 August 2022).
- Madu, C.N.; Kuei, C.H. Strategic total quality management—Transformation process overview. Total Qual. Manag. 1994, 5, 255–266. [Google Scholar] [CrossRef]
- Gummer, B. Total Quality Management. Adm. Soc. Work. 1996, 20, 75–95. [Google Scholar] [CrossRef]
- Van der Wiele, A.; Dale, B.; Williams, A. ISO 9000 series registration to total quality management: The transformation journey. Int. J. Qual. Sci. 1997, 2, 236–252. [Google Scholar] [CrossRef]
- Chin, K.; Pun, K.; Hua, H. Consolidation of China’s quality transformation efforts: A review. Int. J. Qual. Reliab. Manag. 2001, 18, 836–853. [Google Scholar] [CrossRef]
- Beer, M. Why Total Quality Management Programs Do Not Persist: The Role of Management Quality and Implications for Leading a TQM Transformation. Decis. Sci. 2003, 34, 623–642. [Google Scholar] [CrossRef]
- Klefsjö, B.; Bergquist, B.; Garvare, R. Quality management and business excellence, customers and stakeholders: Do we agree on what we are talking about, and does it matter? TQM J. 2008, 20, 120–129. [Google Scholar] [CrossRef]
- Hur, M.H. The influence of total quality management practices on the transformation of how organisations work. Total Qual. Manag. Bus. Excel. 2009, 20, 847–861. [Google Scholar] [CrossRef]
- Küpper, D.; Knizek, C.; Ryeson, D.; Noecker, J. Quality 4.0 Takes More Than Technology; BCG-ASQ-DG: Boston, MA, USA, 2018. [Google Scholar]
- Blog: Quality 4.0: The Future of Quality? Available online: https://www.juran.com/blog/quality-4-0-the-future-of-quality (accessed on 22 July 2022).
- Lodi, S.A.; Shaikh, A.A.; Wasif, M.; Butt, F.A. A Quality 4.0 Assurance Framework for the Higher Education Institutes. In Proceedings of the 8th International Conference on Higher Education Advances (HEAd’22), Valencia, Spain, 14–17 June 2022. [Google Scholar]
- Gohane, G.; Bulkunde, A.; Parate, A.; Nagdeve, P.; Mendhe, V.; Pandey, S.; Yadav, H. Study and Review of Quality 4.0 in the Industry. In Proceedings of the Advances in Materials Processing and Manufacturing Applications (iCADMA), Jaipur, India, 5–6 November 2020. [Google Scholar] [CrossRef]
- Theuws, F. The Benefits of Quality 4.0. Quality 2021, 60, 51. Available online: www.proquest.com/scholarly-journals/benefits-quality-4-0/docview/2626029858/se-2?accountid=135034 (accessed on 20 August 2022).
- Sader, S.S.; Husti, I.; Daróczi, M. Suggested Indicators to Measure the Impact of Industry 4.0 on Total Quality Management. Int. Sci. J. Ind. 4.0 2017, 2, 298–301. [Google Scholar]
- Zonnenshain, A.; Kenett, R.S. Quality 4.0—the challenging future of quality engineering. Qual. Eng. 2020, 32, 614–626. [Google Scholar] [CrossRef]
- Escobar, C.A.; McGovern, M.E.; Morales-Menendez, R. Quality 4.0: A review of big data challenges in manufacturing. J. Intell. Manuf. 2021, 32, 2319–2334. [Google Scholar] [CrossRef]
- Corti, D.; Masiero, S.; Gladysz, B. Impact of Industry 4.0 on Quality Management: Identification of main challenges towards a Quality 4.0 approach. In Proceedings of the IEEE International Conference on Engineering, Technology and Innovation (ICE/ITMC), Cardiff, UK, 21–23 June 2021. [Google Scholar] [CrossRef]
- Chiarini, A.; Kumar, M. What is Quality 4.0? An exploratory sequential mixed methods study of Italian manufacturing companies. Int. J. Prod. Res. 2021, 60, 4890–4910. [Google Scholar] [CrossRef]
- Santos, G.; Sá, J.; Félix, M.; Barreto, L.; Carvalho, F.; Doiro, M.; Zgodavová, K.; Stefanović, M. New Needed Quality Management Skills for Quality Managers 4.0. Sustainability 2021, 13, 6149. [Google Scholar] [CrossRef]
- Ali, K.; Johl, S.K. Soft and hard TQM practices: Future research agenda for industry 4.0. Total Qual. Manag. Bus. Excell. 2021. [Google Scholar] [CrossRef]
- Ali, K.; Johl, S.K. Impact of Total Quality Management on SMEs Sustainable Performance in the Context of Industry 4.0. In Proceedings of the International Conference on Emerging Technologies and Intelligent Systems (ICETIS 2021), Al Buraimi, Oman, 25–26 June 2021. [Google Scholar] [CrossRef]
- De Souza, F.F.; Corsi, A.; Pagani, R.N.; Balbinotti, G.; Kovaleski, J.L. Total quality management 4.0: Adapting quality management to Industry 4.0. TQM J. 2021, 34, 749–769. [Google Scholar] [CrossRef]
- Glogovac, M.; Ruso, J.; Maricic, M. ISO 9004 maturity model for quality in industry 4.0. Total Qual. Manag. Bus. Excel. 2020, 33, 529–547. [Google Scholar] [CrossRef]
- Aviv, I.; Hadar, I.; Levy, M. Knowledge Management Infrastructure Framework for Enhancing Knowledge-Intensive Business Processes. Sustainability 2021, 13, 11387. [Google Scholar] [CrossRef]
- Marjanovic, O. Improvement of Knowledge-Intensive Business Processes Through Analytics and Knowledge Sharing. In Proceedings of the International Conference on Information Systems—Digital Innovation at the Crossroads (ICIS 2016), Dublin, Ireland, 11–14 December 2016. [Google Scholar]
- Marjanovic, O.; Freeze, R. Knowledge-Intensive Business Process: Deriving a Sustainable Competitive Advantage through Business Process Management and Knowledge Management Integration. Knowl. Process Manag. 2012, 19, 180–188. [Google Scholar] [CrossRef]
- Oláh, J.; Aburumman, N.; Popp, J.; Khan, M.A.; Haddad, H.; Kitukutha, N. Impact of Industry 4.0 on Environmental Sustainability. Sustainability 2020, 12, 4674. [Google Scholar] [CrossRef]
- Burritt, R.; Christ, K. Industry 4.0 and environmental accounting: A new revolution? Asian J. Sustain. Soc. Responsib. 2016, 1, 23–38. Available online: https://www.analysisinn.com/post/kmo-and-bartlett-s-test-of-sphericity/ (accessed on 22 July 2022). [CrossRef]
- Malik, T.M.; Khalid, R.; Zulqarnain, A.; Iqbal, S.A. Cost of quality: Findings of a wood products’ manufacturer. TQM J. 2016, 28, 2–20. [Google Scholar] [CrossRef]
- Anwar, S.; Abbas, Q.; Ashfaq, M. Introduction to the Economy of Pakistan. Available online: https://www.researchgate.net/publication/321037817_Introduction_to_the_Economy_of_Pakistan (accessed on 22 July 2022).


| S. No. | Dimension | Survey Question | Variables |
|---|---|---|---|
| 1. | -- | Organization Name (Open response) | ORGAN |
| 2. | Type of Organization (Automotive, Textile, IT, Health Care, Food, Energy, other) | ORGTYP | |
| 3. | Organization Category (Government, Semi-Government, Private) | ORGCAT | |
| 4. | Designation (Supervisor, Asst. Manager, Manager, Sr. Manager, Gen. Manager, Director, Other) | DESIGN | |
| 5. | Department Name (Supply Chain, Maintenance, Quality, Production, Maintenance, Other) | DEPTT | |
| 6. | No. of Employees (Less than 100, 101 to 500, more than 500) | EMPL | |
| 7. | Organization Scope (Domestic, Multinational) | ORGSC | |
| 8. | No. of Quality Professionals having professional certification in the field of quality management | NOQP | |
| 9. | Compliance (CMPL) | Strategic goal of the government (Full—5, Major—4, Normal—3, Minor—2, None—1) | CMPL1 |
| 10. | Guidelines of SME, Industries and Enterprises | CMPL2 | |
| 11. | Fiscal policies of the state/reserve banks | CMPL3 | |
| 12. | Regulatory Bodies | CMPL4 | |
| 13. | Decisions of Board of Directors | CMPL5 | |
| 14. | Decision of Investors | CMPL6 | |
| 15. | Requirements of Employers | CMPL7 | |
| 16. | Requirements of Suppliers | CMPL8 | |
| 17. | Implementation of Quality Standards | CMPL9 | |
| 18. | Competency (CMPT) | Knowledge of Quality Assurance (Highest—5, Major—4, Average—3, Normal—2, None—1) | COMT1 |
| 19. | Competency of Human Resource related to Technology | CMPT2 | |
| 20. | Formalization of Organizational Structure | CMPT3 | |
| 21. | Organizational Knowledge | CMPT4 | |
| 22. | Smart Phones/Gadgets, IT Infrastructure and ERP | CMPT5 | |
| 23. | Connectivity (CONN) | Connectivity through the IT Infrastructure (Highest—5, Major—4, Normal—3, Minor—2, None—1) | CONN1 |
| 24. | Connectivity of Strategic and Departmental Objectives | CONN2 | |
| 25. | Connectivity through ERP and its linkage with the Quality | CONN3 | |
| 26. | Connectivity of Strategic and Departmental Data to form KPIs | CONN4 | |
| 27. | Connectivity of Smart Phones/Gadgets with the QMS | CONN5 | |
| 28. | Connectivity of Quality System with the IT Infrastructure | CONN6 | |
| 29. | Collaboration (COLL) | Existence of Quality Circle and its meeting (Highest—5, Major—4, Normal—3, Minor—2, None—1) | COLL1 |
| 30. | KPIs/Quality Report sharing on regular basis | COLL2 | |
| 31. | Existence and effectiveness of Quality Board of Review | COLL3 | |
| 32. | Shared responsibilities of follow-ups related to Quality | COLL4 | |
| 33. | Scalability (SCAL) | Ease in processing small to large-scale data (Highest—5, High—4, Normal—3, Low—2, None—1) | SCAL1 |
| 34. | Capability to process small to large-scale manufacturing | SCAL2 | |
| 35. | Capability of firm to acquire product/variant wise quality data | SCAL3 | |
| 36. | Leadership (LEAD) | Involvement in SWOT Analysis (Full-time—5, Mostly—4, Normal—3, A few—2, None—1) | LEAD1 |
| 37. | Leadership alignment with the Vision and Mission | LEAD2 | |
| 38. | Engagement with the Quality Management Systems | LEAD3 | |
| 39. | Seriousness towards the Quality 4.0 framework | LEAD4 | |
| 40. | Culture (CULT) | Working culture towards the quality (Highest—5, High—4, Normal—3, Low—2, None—1) | CULT1 |
| 41. | Reward and recognition for improvements in quality | CULT2 | |
| 42. | Culture of synergy, collaboration and flexibility | CULT3 | |
| 43. | Management System (MGS) | Existence of QMS (Highest—5, High—4, Normal—3, Low—2, None—1) | MGS1 |
| 44. | Frequent Trainings of Quality Management System (QMS) | MGS2 | |
| 45. | Review Meetings for the performance assessment QMS | MGS3 | |
| 46. | Internal and External Audits for the performance reviews of QMS | MGS4 | |
| 47. | App Development (WAPP) | Existence of portals for data collections and reporting | WAPP1 |
| 48. | Ease of using portals (Complete—5, Major—4, Normal—3, Minor—2, None—1) | WAPP2 | |
| 49. | Frequency of portal updates | WAPP3 | |
| 50. | Data (DATA) | Real-time collections of data from different departments | DATA1 |
| 51. | Size of data (Highest—5, High—4, Average—3, Low—2, Least—1) | DATA2 | |
| 52. | Reliability of data | DATA3 | |
| 53. | Analytics (ANLY) | Availability of cloud-based data analytics (Highest—5, High—4, Average—3, Low—2, Least—1) | ANLY1 |
| 54. | Use of machine learning or artificial intelligence-based analysis | ANLY2 | |
| 55. | Existence of real-time dashboards accessible to the leadership and management | ANLY3 | |
| 56. | Flexibility in analysis of data | ANLY4 |
| Dimension | Response Option | Description |
|---|---|---|
| Compliance (CMPL) | Full—5 | Full compliance with the assessments from the internal and external audits |
| Major—4 | Major compliance with the assessments from the audits | |
| Normal—3 | Normal compliance with the assessments | |
| Minor—2 | Minor compliance with assessments | |
| None—1 | No compliance | |
| Competency (CMPT) | Highest—5 | Highest knowledge, with professional certification or benchmark standard |
| Major—4 | Major knowledge, with formal certification or benchmark standard | |
| Average—3 | Average knowledge, with self-learning and informal skills | |
| Minor—2 | Normal knowledge, with self-learning | |
| None—1 | No knowledge or skills | |
| Connectivity (CONN) | Highest—5 | Highest connectivity, with real-time data gathering and reporting |
| Major—4 | Major connectivity, with data gathering and reporting updates within 1 to 2 h | |
| Normal—3 | Normal connectivity, with daily data gathering and reporting | |
| Minor—2 | Static connectivity, with weekly data gathering and reporting | |
| None—1 | No connectivity at all | |
| Collaboration (COLL) | Highest—5 | Continuous communication online or via daily meetings |
| Major—4 | Major communication through informal social media | |
| Normal—3 | Normal communication over phones or VOIP | |
| Minor—2 | Low communication through weekly meetings | |
| None—1 | Very little communication | |
| Scalability (SCAL) | Highest—5 | Very quickly with a click |
| High—4 | Some work is needed to transform data from small to large scale | |
| Normal—3 | An IT professional is needed to transform data from small to large scale | |
| Low—2 | The two types of data are handled separately | |
| None—1 | Only one type of data is handled | |
| Leadership (LEAD) | Full-time—5 | Leadership is totally engaged with the management or real-time actions are taken |
| Mostly—4 | Leadership has several businesses and partially engaged with the management | |
| Normal—3 | Leadership looks after the business and engages with the management on weekly basis | |
| A few—2 | Leadership seldom looks after the business or once a month | |
| None—1 | There is no engagement of leadership at all | |
| Culture (CULT) | Highest—5 | Leadership and employees practice the culture habitually |
| High—4 | The culture is practiced informally in most of the divisions | |
| Normal—3 | The culture is practiced occasionally and only with leadership will | |
| Low—2 | A few managers at their own level practice the culture | |
| None—1 | No such culture exists | |
| Management System (MGS) | Highest—5 | A formal system exists and the leadership is committed to practicing the same |
| High—4 | A formal system exists but the leadership is partially committed to practicing the same | |
| Normal—3 | A formal system exists but no leadership commitment exists | |
| Low—2 | There is an informal system | |
| None—1 | There is no system at all | |
| App Development (WAPP) | Complete—5 | A paperless system exists in the organization with ease and real-time connectivity |
| Major—4 | A portal exists but the data are entered manually | |
| Normal—3 | A few islands of portal exist which are not well connected | |
| Minor—2 | Major tasks are performed on the apps but others are performed manually | |
| None—1 | There is no app development | |
| Data (DATA) | Highest—5 | Instantaneous data gathering or data size > 1 TB or no filtering needed |
| High—4 | Data are updated every hour or data size is greater than 1 GB and less than 1 TB or little filtering is required | |
| Normal—3 | Data are updated every day or data size is less than 1 GB or filtering takes a full day | |
| Low—2 | Data are updated every week or data size is less than 1 GB or filtering takes several days | |
| None—1 | Data are static and is on papers or data size is less than 1 GB or selective data is taken | |
| Analytics (ANLY) | Highest—5 | Exists and is fully implemented in the organization |
| High—4 | Exists and implemented for critical data | |
| Normal—3 | Exists and implemented for quarterly or bi-annual data | |
| Low—2 | Exists and implemented for annual data | |
| None—1 | Does not exist |
| Industry Type | Dimension of Quality 4.0 | ||
|---|---|---|---|
| Major Implementation (Average Score 4 to 5) | Average Implementation (Average Score 2.5 to 3.9) | Minor Implementation (Average Score 1 to 2.4) | |
| Automotive | Competency, Connectivity, Collaboration, and Leadership | Compliance, Data Gathering, Analytics, and Management System | Scalability, Culture, and App Development |
| Energy | Competency and Collaboration | Compliance, Connectivity, Leadership, Management System, Data Gathering, and Analytics | Scalability, Culture, and App Development |
| Food | Competency, Collaboration, Leadership, and Management System | Connectivity, Scalability, Culture, App Development, and Data Analytics | Compliance |
| Health | Competency and Collaboration | Connectivity, Leadership, Management System, Data Gathering, and Analytics | Compliance, Scalability, Culture, and App Development |
| IT | None | Competency, Collaboration, Scalability, Leadership, Culture, Management System, App Development, Data Gathering, and Analytics | Compliance and Connectivity |
| Others | None | Competency, Connectivity, Collaboration, Leadership, Data Gathering, and Analytics | Compliance, Scalability, Culture, Management System, and App Development |
| Industry Category | Dimension of Quality 4.0 | ||
|---|---|---|---|
| Major Implementation (Average Score 4 to 5) | Average Implementation (Average Score 2.5 to 3.9) | Minor Implementation (Average Score 1 to 2.4) | |
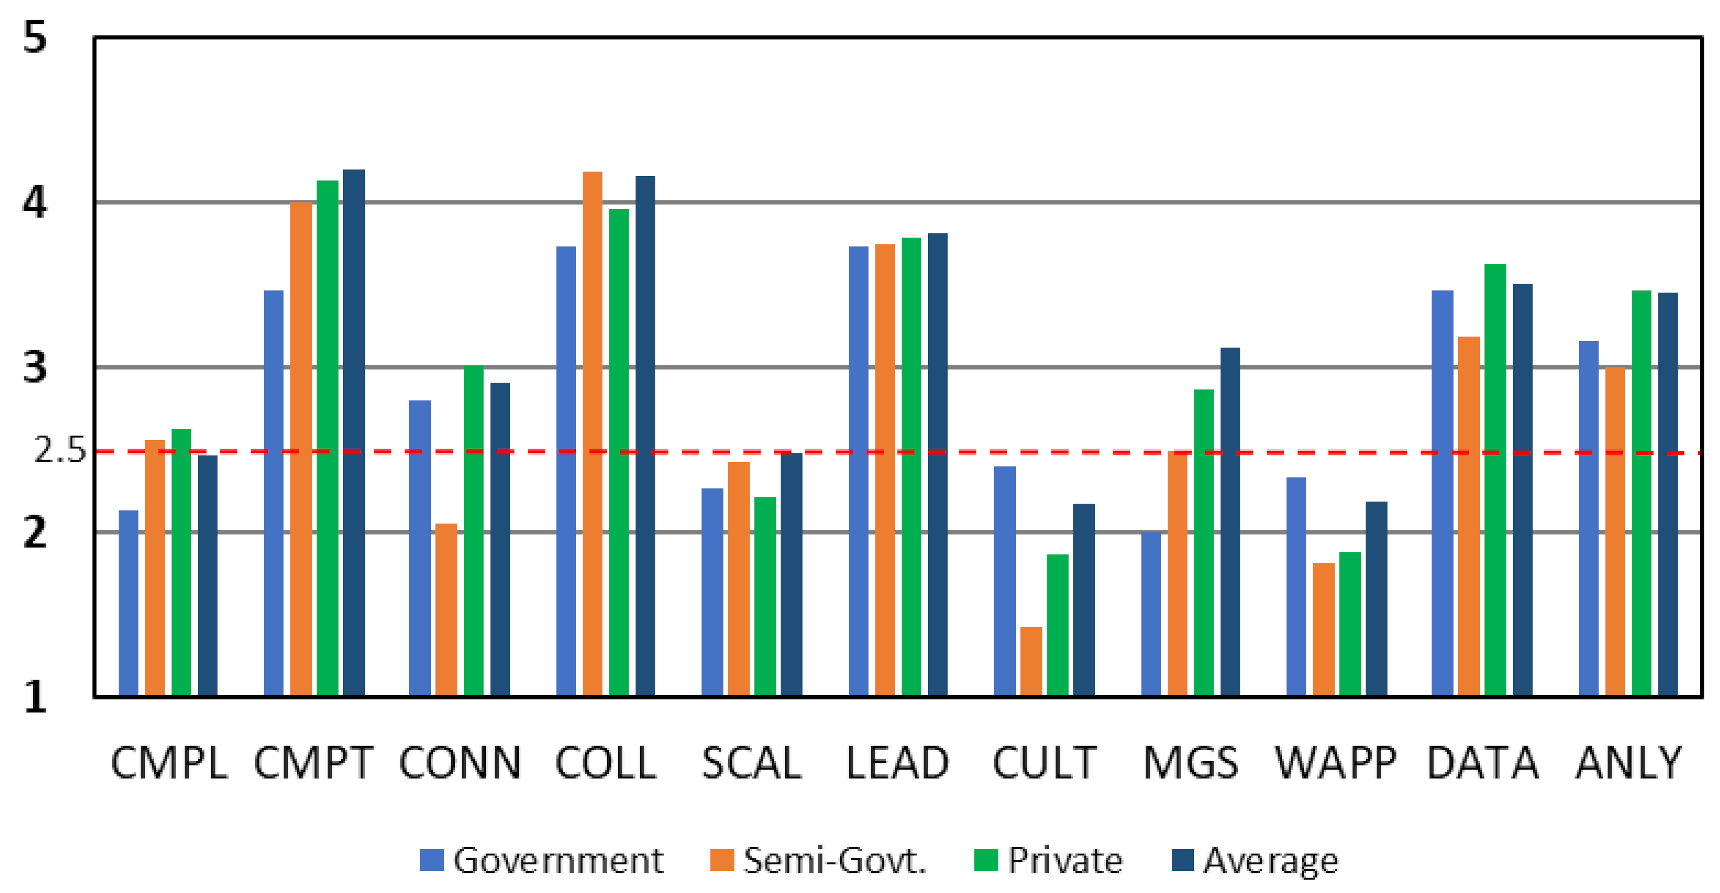
| Government | None | Competency, Connectivity, Collaboration, Leadership, Data Gathering, and Analytics | Compliance, Scalability, Culture, Management System, and App Development |
| Semi-Government | Competency and Collaboration | Compliance, Leadership, Management System, and Data Analytics | Connectivity, Scalability, Culture, and App Development |
| Private | Competency | Compliance, Connectivity, Collaboration, Leadership, Management System, Data Gathering, and Analytics | Scalability, App Development, and Culture |
| No. of Employees | Dimensions of Quality 4.0 | ||
|---|---|---|---|
| Major Implementation (Average Score 4 to 5) | Average Implementation (Average Score 2.5 to 3.9) | Minor Implementation (Average Score 1 to 2.4) | |
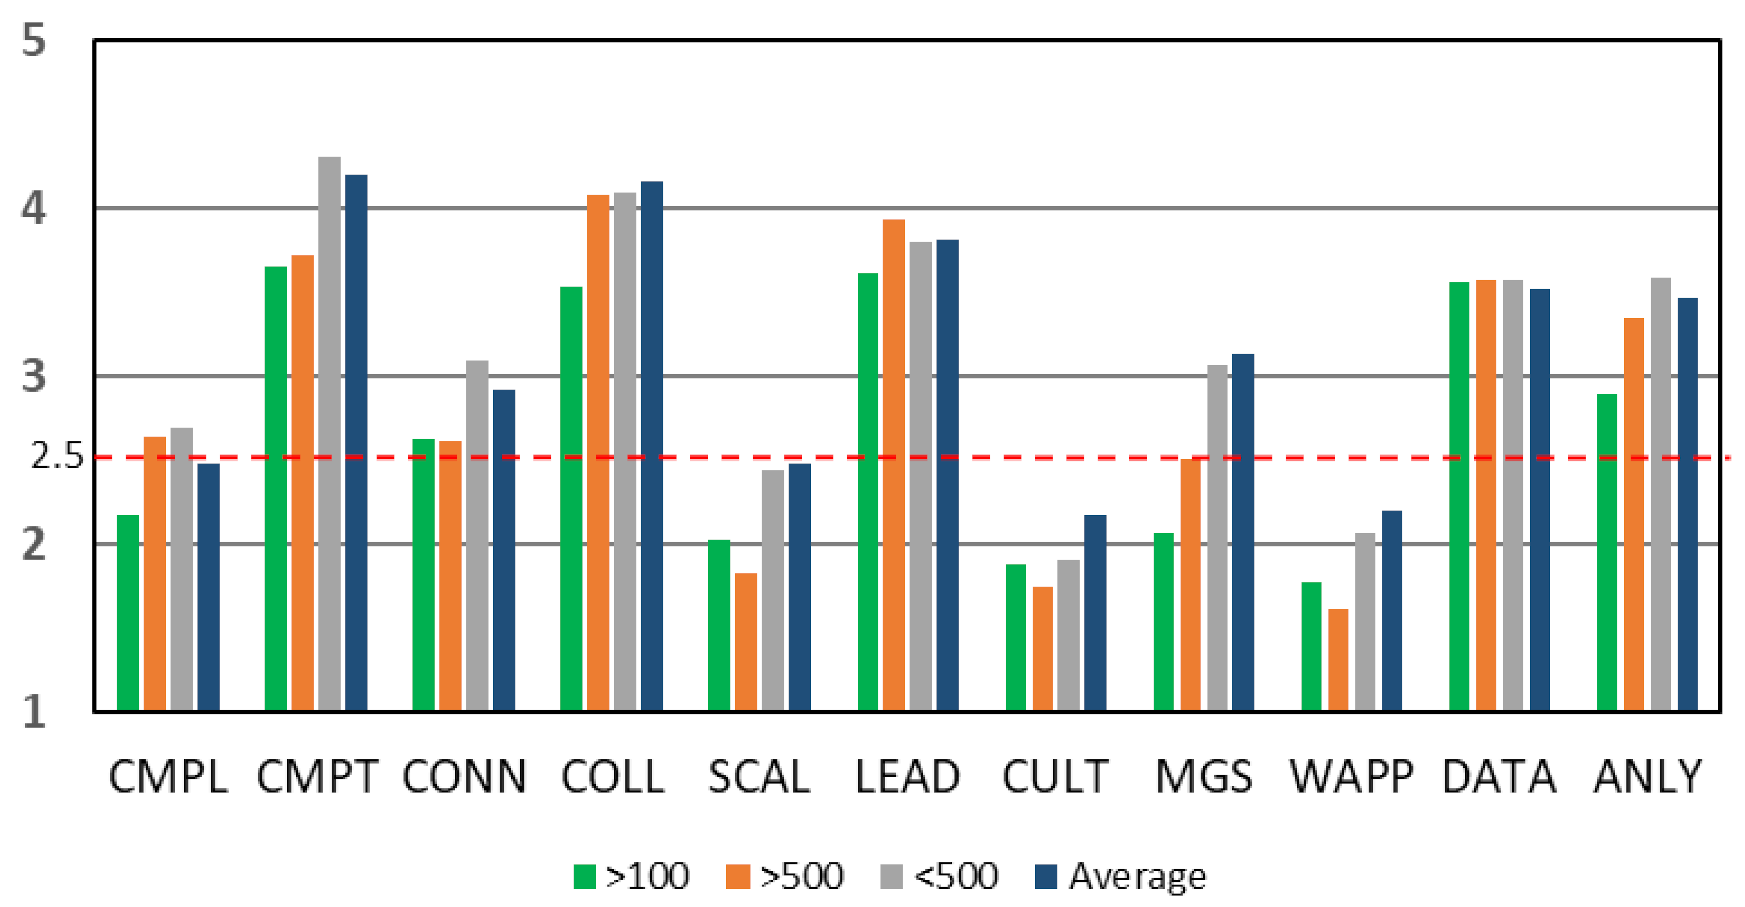
| Less than 100 | None | Competency, Connectivity, Collaboration, Leadership, Data, Analytics | Compliance, Scalability, Culture, Management System, and App Development |
| Between 100 to 500 | Collaboration | Compliance, Competency, Connectivity, Leadership, Management System, Data Gathering, and Analytics | Scalability, Culture, and App Development |
| More than 500 | Competency and Collaboration | Compliance, Connectivity, Leadership, Management System, Data Gathering, and Analytics | Scalability, Culture, and App Development |
| Scope of Organization | Dimension of Quality 4.0 | ||
|---|---|---|---|
| Major Implementation (Average Score 4 to 5) | Average Implementation (Average Score 2.5 to 3.9) | Minor Implementation (Average Score 1 to 2.4) | |
| Domestic | Competency | Compliance, Connectivity, Collaboration, Leadership, Data Gathering, and Analytics | Scalability, Culture, Management System, and App Development |
| Multinational | Competency, Collaboration, and Leadership | Compliance, Connectivity, Scalability, Management System, Data Gathering, and Analytics | Culture and App Development |
| Dimension | Mean | St. Dev. | SE of Mean | DOF | t-Value | Significance (p-Value) |
|---|---|---|---|---|---|---|
| CMPL | 2.574 | 1.091 | 0.086 | 161 | 0.864 | 0.806 |
| CMPT | 4.062 | 1.350 | 0.106 | 161 | 14.725 | 1.000 |
| CONN | 2.907 | 1.360 | 0.107 | 161 | 3.814 | 1.000 |
| COLL | 3.969 | 1.111 | 0.087 | 161 | 16.826 | 1.000 |
| SCAL | 2.247 | 1.462 | 0.115 | 161 | −2.203 | 0.014 |
| LEAD | 3.784 | 1.265 | 0.099 | 161 | 12.924 | 1.000 |
| CULT | 1.877 | 1.215 | 0.095 | 161 | −6.533 | 0.000 |
| MGS | 2.759 | 2.085 | 0.164 | 161 | 1.583 | 0.942 |
| WAPP | 1.919 | 1.337 | 0.105 | 160 | −5.512 | 0.000 |
| DATA | 3.568 | 0.695 | 0.055 | 161 | 19.559 | 1.000 |
| ANLY | 3.398 | 1.219 | 0.096 | 161 | 9.381 | 1.000 |
| MEAN | 3.007 | 0.762 | 0.060 | 161 | 8.467 | 1.000 |
| CMPL | CMPT | CONN | COLL | SCAL | LEAD | CULT | MGS | WAPP | DATA | ANLY | |
|---|---|---|---|---|---|---|---|---|---|---|---|
| CMPL | 1 | 0.212 * | 0.225 * | −0.021 | 0.082 | 0.126 | −0.016 | 0.113 | −0.045 | 0.198 | 0.252 * |
| CMPT | 0.212 * | 1 | 0.548 * | 0.196 | 0.172 | 0.186 | 0.145 | 0.175 | 0.158 | 0.002 | 0.368 * |
| CONN | 0.225 * | 0.548 * | 1 | 0.101 | 0.221 * | 0.353 * | 0.170 | 0.205 * | 0.280 * | 0.089 | 0.448 * |
| COLL | −0.021 | 0.196 | 0.101 | 1 | 0.211 * | 0.256 * | 0.135 | 0.235 * | 0.154 | −0.025 | 0.232 * |
| SCAL | 0.082 | 0.172 | 0.221 * | 0.211 * | 1 | 0.261 * | 0.433 * | 0.607 * | 0.680 * | 0.057 | 0.467 * |
| LEAD | 0.126 | 0.186 | 0.353 * | 0.256 * | 0.261 * | 1 | 0.355 * | 0.423 * | 0.273 * | 0.098 | 0.455 * |
| CULT | −0.016 | 0.145 | 0.170 | 0.135 | 0.433 * | 0.355 * | 1 | 0.435 * | 0.571 * | 0.142 | 0.417 * |
| MGS | 0.113 | 0.175 | 0.205 * | 0.235 * | 0.607 * | 0.423 * | 0.435 * | 1 | 0.558 * | 0.065 | 0.485 * |
| WAPP | -0.045 | 0.158 | 0.280 * | 0.154 | 0.680 * | 0.273 * | 0.571 * | 0.558 * | 1 | 0.029 | 0.498 * |
| DATA | 0.198 | 0.002 | 0.089 | −0.025 | 0.057 | 0.098 | 0.142 | 0.065 | 0.029 | 1 | 0.182 |
| ANLY | 0.252 * | 0.368 * | 0.448 * | 0.232 * | 0.467 * | 0.455 * | 0.417 * | 0.485 * | 0.498 * | 0.182 | 1 |
| Correlation | 3 | 3 | 7 | 4 | 7 | 7 | 5 | 7 | 6 | 0 | 9 |
| Mean | St. Dev. | SE of Mean | DOF | t-Value | Significance (p-Value) | |
|---|---|---|---|---|---|---|
| MEAN | 3.373 | 0.713 | 0.103 | 47 | −6.090 | >0.001 |
| Mean | St. Dev. | SE of Mean | DOF | t-Value | Significance (p-Value) | |
|---|---|---|---|---|---|---|
| MEAN | 3.112 | 0.759 | 0.076 | 101 | −11.766 | >0.001 |
| Sum of Squares | DOF | Mean Square | F-Value | Significance Level | |
|---|---|---|---|---|---|
| Between Groups | 6.174 | 4 | 1.544 | 2.776 | 0.029 |
| Within Groups | 87.290 | 157 | 0.556 | ||
| Total | 93.464 | 161 |
| No. | Hypothesis | Test | Result | Remarks |
|---|---|---|---|---|
| H1 | The Quality 4.0 framework is implemented in the industry. | t-test Target value = 2.5 | True | Mean of means (MEAN) > 2.5 |
| H2 | All eleven dimensions of the Quality 4.0 framework are implemented in the industry. | t-test Target value = 2.5 | False | Not all means are greater than 2.5 |
| H3 | The eleven dimensions of the Quality 4.0 have relationships among each other. | Sig. Pearson Correlation Coefficient | True | Most of the dimensions are correlated |
| H4 | The Quality 4.0 framework is well implemented in multinational organizations. | t-test Target value = 4.0 | False | p-value < 0.05 |
| H5 | The Quality 4.0 framework is well implemented in large organizations having more than 500 employees. | t-test Target value = 4.0 | False | p-value < 0.05 |
| H6 | The existence of Quality Management professionals enables an organization to implement the Quality 4.0 framework | ANOVA F-value | True | NOQP is significant |
| SWOT | S# | Recommendations |
|---|---|---|
| STRENGTHS | 1. | According to the respondents, COMPETENCY of human resources is one of the highest implemented dimensions of the Quality 4.0 framework, but the competency is not well utilized, resulting in low industry implementation of compliance, culture, scalability, and app development. |
| 2. | CONNECTIVITY axis is very well implemented in Pakistani industries, but the industry infrastructure and the technology are quite obsolete. Industrial Internet of Things (IIoTs), high-speed internet, cloud computing, and app developments are necessary for industries to effectively integrate quality management systems. As per the respondents, LEADERSHIP has the third highest implementation in industry in Pakistan. This dimension measures the involvement of the leadership in developing organizational strategy, vision, and mission; engagement with the quality management system, and implementation of Quality 4.0. This is for the obvious reason that the involvement of the leadership is critical because the outcomes and development of any organization are dependent on it. In this study, leaders demonstrated seriousness towards the implementation of Quality 4.0, which motivates the stakeholders in implementing the new concepts of Quality 4.0 in industries. | |
| WEAKNESSES | 1. | Fostering a quality CULTURE is the first essential element in developing and implementing Quality 4.0. Technological advancement to achieve breakthrough performance indicators can only transform the organization when employees and other stakeholders from the top down take ownership of quality. Quality Culture and its sustainability is one of the major issues in Pakistani industries, reflected in the low respondent scores. It is recommended that leadership and human resources staff change their mind-sets towards quality management systems to enhance the customer experience and achieve continuous sustainability. Quality culture can be developed in organizations through rewards and recognition systems, especially through the Kaizen approach recommended under the globally famous Toyota Production System/Lean. It is strongly recommended that organizations start with quality principles/practices and then implement the basic tradition tools/techniques in moving towards Quality 4.0. |
| 2. | The Quality 4.0 framework is quite technology oriented, which requires technological infrastructure and skilled and trained human resources to make continuous updates, which requires huge resources for any organization. Hence, determining the costs of quality analysis (ANALYTICS) is recommended for the implementation [39]. | |
| 3. | Technology and training updates are the integrated feature of the Quality 4.0 framework; hence it is recommended to acquire the human resources (COMPETENCY) willing to continuously adopt the changes in technology and trainings for the continuous improvement of systems. | |
| 4. | It is recommended to provide industry awareness sessions especially in the third world countries developing countries to disseminate the features, importance, and advantages of implementing Quality 4.0. | |
| 5. | The COMPLIANCE and standardization at the organization and industry levels must aim at enhancing in maturity and customer experience. | |
| 6. | The COMPETENCY of the human resources may be effectively utilized for the scalability of the organization to cope with the fluctuating demands. The major dilemma in industries is the constant production rates and capacity, resulting in the low utilization of resources in non-peak demand periods. | |
| 7. | The existence of QUALITY MANAGEMENT SYSTEMS (QMS) is quite weak. They are implemented in the industry mostly to comply with ISO 9001 standards and surveillance audits. The QMS It is recommended that both the manufacturing and service industries adopt a QMS and evaluate it through the internal and surveillance audit. | |
| 8. | Integration and CONNECTIVITY of the real-time data from the IIoTs, POS, and other sources may be collected through cloud-based data collection systems, which may be eventually analysed, forecast, and displayed on dashboards. | |
| 9. | There was a considerable lack of data analysis (ANALYTICS); data were often gathered for the sake of auditing purposes. Data analysis is strongly recommended whether in traditional ways or towards Quality 4.0. | |
| OPPORTUNITIES | 1. | LEADERSHIP capabilities can be exploited for the improvement in Quality Management by having frequent review meetings, dashboard discussion, customer reviews, etc. Leadership implementation and execution of Quality 4.0 can enhance overall quality and the customer experience. Unlike the Total Quality Management philosophy (CULTURE), Quality 4.0 is an implementable framework that can be adopted by the manufacturing and service industries for enhanced productivity and customer experience. |
| 2. | The Quality 4.0 framework is as perceived in the previous research not only is an operational framework but also is directly linked with the strategy of any organization (MANAGEMENT SYSTEM). Strategic planning, execution, implementation, and evaluation are integral to the Quality 4.0 framework. | |
| 3. | Since the framework relies on COLLABORATION and input from the government, industry, and other stakeholder, it is recommended for the smooth implementation of the framework that the framework be implemented in stable organizations. This is because volatility and continuous changes in stakeholder requirement may result in the ineffective implementation of the framework, resulting in the loss of resources. | |
| 4. | It is recommended to develop and implement smart KPIs (DATA) and benchmarks for the measurement of performance at both the macro and micro levels. Real-time collection and analysis of data for KPI dashboards (APP DEVELOPMENT) are highly recommended to be available for review through the leadership in the industry. | |
| 5. | AI-based cloud computing, which is an important contributor SCALABILITY and decision systems (DATA), are integrated into the Quality 4.0 framework for data analysis and inferences, and results may be communicated to the relevant people. | |
| 6. | In this era of big data collection and analysis, it is important for human resources to be aware of the importance of real-time data collection and analysis. | |
| 7. | To oblige the compliance axis of the Quality 4.0 framework, it is recommended that at the government and industry levels, international benchmarks and COLLABORATION be introduced to enhance industry competitiveness. | |
| THREATS | 1. | LEADERSHIP must make great investments to transform. |
| 2. | Due to the unavailability of 5G technology (CONNECTIVITY) in the third world developing countries, cloud computing (SCALABILITY) and smart decision making are huge problems, resulting in high scrap and defect rates in industries. | |
| 3. | Most technology and equipment specified in the general framework of Quality 4.0 are not designed and manufactured in developing countries, and thus, their acquisition can be a hurdle; in addition, there can be delays not connected to industry targets due to frequent changes in government policies (COMPLIANCE), especially in Pakistan. | |
| 4. | In consideration of digital transformations, traditional quality practices are recommended to drawing attention to sustainability. A lack of long-term proper application of traditional quality practices, especially in small to medium-scale industries was observed. Employees feel overburdened by following specified mandatory quality practices and have the perception of adding waste (cost) instead of adding quality. Quality CULTURE is recommended. | |
| 5. | Employees feel threats of downsizing following technological advancements; they must be counselled regarding the benefits of the advancement of quality CULTURE by leadership. |
Publisher’s Note: MDPI stays neutral with regard to jurisdictional claims in published maps and institutional affiliations. |
© 2022 by the authors. Licensee MDPI, Basel, Switzerland. This article is an open access article distributed under the terms and conditions of the Creative Commons Attribution (CC BY) license (https://creativecommons.org/licenses/by/4.0/).
Share and Cite
Zulqarnain, A.; Wasif, M.; Iqbal, S.A. Developing a Quality 4.0 Implementation Framework and Evaluating the Maturity Levels of Industries in Developing Countries. Sustainability 2022, 14, 11298. https://doi.org/10.3390/su141811298
Zulqarnain A, Wasif M, Iqbal SA. Developing a Quality 4.0 Implementation Framework and Evaluating the Maturity Levels of Industries in Developing Countries. Sustainability. 2022; 14(18):11298. https://doi.org/10.3390/su141811298
Chicago/Turabian StyleZulqarnain, Ali, Muhammad Wasif, and Syed Amir Iqbal. 2022. "Developing a Quality 4.0 Implementation Framework and Evaluating the Maturity Levels of Industries in Developing Countries" Sustainability 14, no. 18: 11298. https://doi.org/10.3390/su141811298
APA StyleZulqarnain, A., Wasif, M., & Iqbal, S. A. (2022). Developing a Quality 4.0 Implementation Framework and Evaluating the Maturity Levels of Industries in Developing Countries. Sustainability, 14(18), 11298. https://doi.org/10.3390/su141811298