Article

Learning the Indicative Patterns of Simulated Force Changes in Soil Moisture by BP Neural Networks and Finding Differences with SMAP Observations

1
College of Computer Science and Technology, Jilin University, Changchun 130012, China
2
College of Computer Science and Technology, Changchun Normal University, Changchun 130032, China
3
College of Information Media, Jilin Province Economic Management Cadre College, Changchun 130012, China
4
School of Marxism, Changchun Normal University, Changchun 130032, China
*
Author to whom correspondence should be addressed.
Sustainability 2022, 14(18), 11310; https://doi.org/10.3390/su141811310
Submission received: 19 July 2022 / Revised: 3 September 2022 / Accepted: 6 September 2022 / Published: 9 September 2022

Abstract

:
Soil moisture is a vital land surface variable that can influence climate change. Many problems in soil moisture data require the identification of signals obscured by anthropogenic external forces (including greenhouse gases such as CO2 and aerosol radiative force), natural forces (such as volcanic and solar activity), and internal variability (such as ENSO, NAO, and PDO). Although artificial neural networks (ANNs) have been widely studied in making accurate predictions, the studies of interpretation of ANNs in soil moisture are still rare. Hence, the proposed method aims to assist in the study of interpretating soil moisture data. Specifically, first, an ANN model is trained to predict the approximate year of the simulations by identifying the spatial patterns of qualitative changes in soil moisture. After accurately predicting the approximate year, the spatial patterns in the ANN model, acting as “reliable indicators” of the force changes, are the different natures of regional signals. Then, the simulated data and Soil Moisture Active and Passive (SMAP) observations are fed into the trained ANN separately, and the specific differences are observed by the Deep Taylor Decomposition (DTD) visualization tool. By comparing with the standard multiple linear regression method, the results of the ANN model can provide the reliable indicators of change for a specific year, thus providing meaningful information from the ANN model according to the common soil moisture data. The results show that a large correlation exists between eastern Asia and western North America during the 21st century, and the correlation increases with time in Australia. This also reflects the strong force signal due to a combination of anthropogenic and external forces that has played a role in soil moisture over the decades and can clearly discern the differences between model simulations and observed data. This study indicates that the proposed method using ANNs and visualization tools enables relatively accurate predictions and the discovery of unknown patterns within soil moisture data.

1. Introduction

Soil moisture, one of the key physical quantities in soil science research, has received attention in related studies. It can influence climate change through a variety of pathways, including changes in surface albedos, soil heat capacity, and transport of sensible and latent heat to the atmosphere [1,2]. It has been shown that soil moisture is second only to sea surface temperature (SST) in geoscientific studies [3]; at mid- and high-latitudes, its influence on climate is comparable to that of the ocean, and on land, its impact is even greater than that of SST [4,5,6]. After recognition of the importance of soil moisture on climate change, studies on it have been carried out one after another.
It is understood from the above that soil moisture is important for climate change prediction. However, as soil moisture has been studied more deeply, it has been found that different soil moisture data have a large uncertainty in predicting climate change, and there is no feasible way to systematically characterize this uncertainty. The systematic characterization of the Coupled Model Intercomparison Projects (CMIPs) made uncertain prediction possible. The CMIPs contain many climate models with similar complexities and provide simulations with the same set of emission scenarios over the same time period [7]. Although several kinds of uncertainty exist in the CIMPs model, in this paper we mainly focus on the internal (or natural) variability and differences between model simulations (the data from the CIMPs model) [8]. Internal (or natural) variability is caused by the disordered and unpredictable evolution of the climate system, which is full of internal “noise” (e.g., extreme weather climates such as the El Niño Southern Oscillation, Interdecadal variation in the Atlantic Ocean [9], and Interdecadal Pacific Oscillation). It has a significant impact on the accuracy of climate predictions; the differences between models refer to the uncertainty of climate response, i.e., structural differences between models. Furthermore, this variability arises from individual modeling centers in constructing and tuning their models (e.g., parameterization of unresolved processes). These uncertainties are referred to as “noise”, and earth sciences often need to identify marked “signals” in the context of “noise”. Scientists have devised numbers of statistical methods for extracting the “signal” of interest within the “noisy” background, such as regression-based identification of linear trends [10], extracting empirical orthogonal functions for the main variation patterns [11], and specific time scales obtained after filtering analysis of the spectrum [12]. As the variability in time series data within the climate model is randomly phased among individuals, averaging over a sufficient number of members of the radiative force scenario family can yield the associated force climate signal. Although the force response has been captured in the final overall mean spatial model, it is difficult to observe and determine this pattern in a single year because of the combination of force signal and internal variability. Meanwhile, although the ANN model has been widely applied in soil moisture prediction, few studies exist in exploring the interpretation of what the ANN has learned for soil moisture.
The purpose of this study was to identify the indicators of the variability of anthropogenic force based on natural force and internal variability, in addition to model differences. As the ANN model has been successfully applied in identifying the indicator patterns by providing the reliable regions in any given year [13], we combined a BP neural network [14] with the Deep Taylor Decomposition (DTD) visualization technique for learning the indicative patterns of simulated force changes in soil moisture. We first train the ANN model to predict the approximate year of the simulations and then regard the spatial patterns as “reliable indicators” of the force change. Further, the specific differences between simulated data and Soil Moisture Active and Passive (SMAP) observations are conducted by the Deep Taylor Decomposition (DTD) visualization tool. Finally, we compare the standard multiple linear regression method to gain reliable indicators.

2. Data Set Description

2.1. CMIP5 Simulation Data

We use annual average global soil moisture data from geoscience model simulations in the Coupled Model Intercomparison Project, phase 5 [15]. The soil moisture data in 14 models are given in Table 1. All soil moisture is represented by grid data and each grid point refers to the content of soil moisture. The grid data are composed of grid points in longitude and latitude directions; that is, it is like an image that is composed of pixel values in the length and width directions. To accommodate the characteristics of a Back Propagation Neural Network (BPNN), the raw data must be processed to the same size according to latitude and longitude, such that all the soil moisture data are interpolated into a 4 degree longitude x 4 degree latitude grid (90 longitude values × 45 latitude values = 4050 total grid points). This also helps us to reduce the number of grid points, which saves a large amount of time for training the model.
The experiments analyze the annual average soil moisture under the RCP8.5 scenario (from 2006 to 2099) [16]. For our selected simulation data, similar external forces existed in different model simulations, so the model prediction bias comes mainly from the physical properties of the climate model, the resolution and numerical model (i.e., model uncertainty), and the diversity of models in terms of climate non-force (or internal) variability [8]. It is necessary to note that the data set is taken from 23 laboratories for a period of 93 years; thus, the data set has more than 2000 observations, which enables the model to predict the period of time.

2.2. SMAP Observation Data

We evaluate the applicability of artificial neural networks trained by climate models to the real world by evaluating the techniques used by artificial neural networks to predict annual average soil moisture observation maps. For the soil moisture observations, the SMAP global data are from the National Snow and Ice Data Center (NSIDC) (experimental data can be downloaded from the NSIDC website). Specifically, we analyze the monthly global soil moisture (using interpolation methods common to CMIP5 described above). In this paper, we only analyze data for the period 2006–2020, which is fully covered globally, as shown in Table 1.

3. Methods

3.1. Back Propagation Neural Network (BPNN)

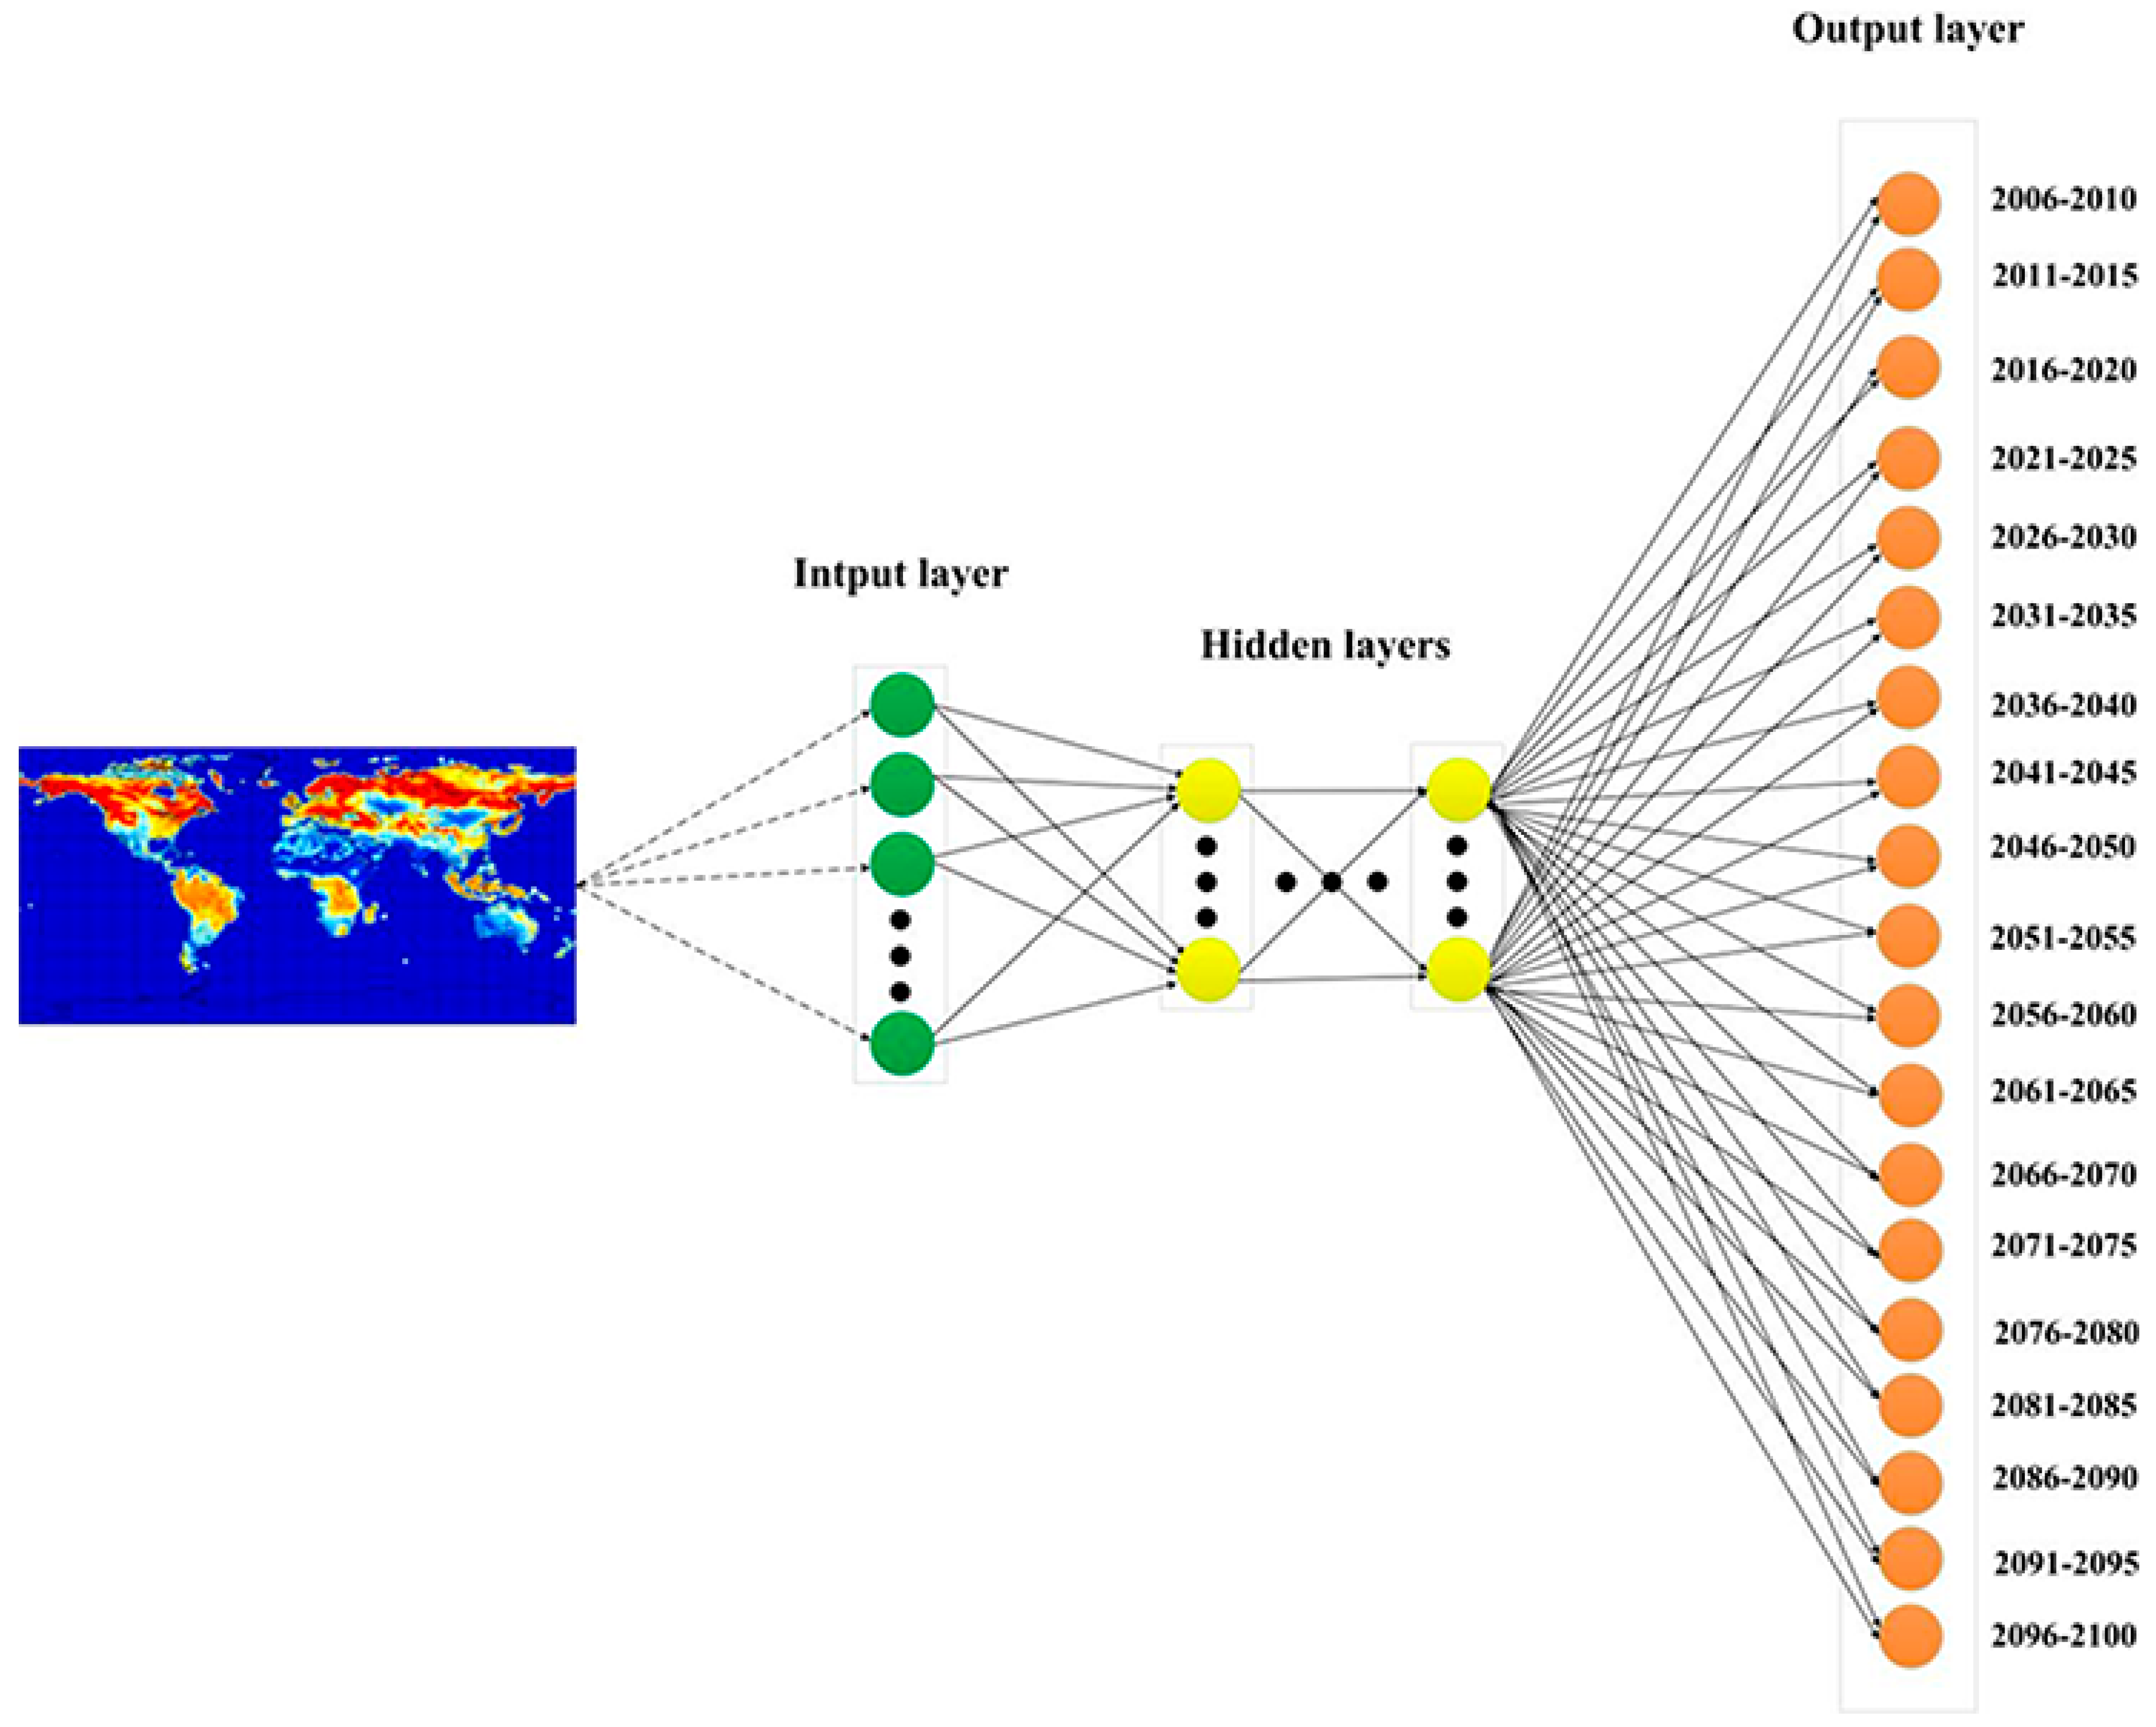
The experiment is set up as a classification task, which requires that when a soil moisture map is input into the model, the model needs to determine which year it belongs to. The scheme of the evaluated BPNN architecture is shown in Figure 1. Each cell of the input layer signals for the soil moisture of a grid point is shown in the input map. The input layer is followed by a hidden layer containing multiple neural units. The final output layer, consisting of 19 neurons and representing the estimated year, takes the output from the hidden layer and performs the classification operation. Specifically, the last layer in Figure 1, which is the output layer, has a total of 19 neural units and each unit represents a five-year span. The BPNN is mainly used to learn and discriminate the class to which the input map belongs. We use a simple architecture with only a small number of hidden layers (and cells) because this setup is sufficient for our application. The design of the experiment as a classification experiment is necessary because the specific BPNN visualization tool we used (Deep Taylor Decomposition) was developed for the classification architecture.
The BPNN in the paper uses the activation function ReLu for all units except the output layer. This is a common activation function in machine learning that defines f x = max 0 , x . When the input x is positive, the output of this function is linear.
We apply a softmax layer before outputting the prediction class in the final output layer, which is very common in classification problems. For the value of a vector x of length c, the softmax function is defined as:
f x i = e x i j = 1 c e x j
In the above equation, xi represents a specific element. The softmax function is mainly used to probabilistically scale the predicted value obtained in the experiments. Since we need to obtain the weights for different prediction years, the function will require half the effort.
In this experiment, we used a quadratic cross-entropy loss in the nonlinear neural network; the formula is defined as follows:
loss = m = 1 N y m l o g p y m + 1 y m log 1 p y m
Each parameter in the above equation is defined as follows: m denotes the mth class, ym denotes the true value corresponding to the mth class, and p(ym) denotes the prediction probability. The model corrects the error between the uncertain and true value according to this function.
The BPNN uses the stochastic gradient descent optimizer in Tensorflow for training and optimizing our parameters, and we chose the optimal parameters for the experiments after many experimental parameter settings, where the learning rate = 0.001, momentum = 0.7, and batch size = 50. These parameters show good performance in both prediction results and visualization mode. In the experiments, we trained BPNN with 500 iterations, and the comparisons show that the number of iterations for convergence is small. Additionally, large iterations significantly reduce the accuracy of the prediction.
Usually, the classification of the BPNN is hot-coded for the output category; however, we found that the results of the classification effect after hot-coding are very unsatisfactory through the analysis and validation of the simulated data, and the year obtained from the classification by the above hot-coding will be output very strictly for one in every five years. For example, 2014 is coded as belonging entirely to the 2011–2015 class, which results in missing a large amount of information, because no information is left about whether 2014 is associated with other adjacent years. We found a more convincing coding method through our review of sources who fuzzily coded the data set into one category every decade using fuzzy coding [17] and, in this study, we created a method that fits the form of our own data by examining other authors’ classification methods. In order not to lose more useful information, we use an alternative coding method, namely fuzzy coding, which is able to map any year to one or more affiliated neighboring categories and whose total probability sums to a whole. To make the experiment more intuitive, we apply a triangular affiliation function [18], whose width is set to five years here and further maps the output of five probabilities into one or two adjacent categories of non-zero probabilities. Here we define each output class according to the estimated central year. For example, 2018 in 2016–2020 is the central year of these five years, and the category probabilities derived from the triangular affiliation function are weighted to the central year. The specific decoding and encoding processes are shown in Figure 2, where the coordinate information is meaningful on the coordinate axes, the y-axis represents the central year of each five-year period, and the x-axis illustrates the probability associated with each category. The location of the dots with the same color for each year in the representation represents the corresponding probability. For example, 2012 is coded with a probability of 0.2 for the “2008” class and 0.8 for the “2013” class, the correct year of 2012. The use of the above method acts on the output layer of the neural network, thus achieving a five-year classification, and the neural network also assigns the correct (fuzzy) probability to each class/five-year input sample. Through experimental analysis we can conclude that the above classification method can encode the exacted (true) year in the output class, and facilitates our visualization tool (DTD) to ensure our output results in a set of class probabilities.
In the encoding step, each colored year, 2012, 2066, and 2093, are mapped to the class probabilities indicated by the dots in the same color. For example, 2012 is encoded as probabilities 0.2 and 0.8 for classes 2008 and 2013, respectively, while 2066 is encoded as probabilities 0.4 and 0.6 for classes 2063 and 2068, respectively. In the decoding step, each year can be reconstructed as the weighted sum of the five years’ centers, where the weights are determined by each decade class probability. For example, 2012 results from the weighted sum 0.2…2008 + 0.8…2013 = 2012.
For the choice of neural network, the deep neural network was selected first, and it was found that the selected model cannot improve the prediction accuracy after increasing the number of hidden layer units or hidden layers. Thus, we chose a simpler network that does not reduce the accuracy. Our BPNN structure contains 2 hidden layers with 10 hidden units in each layer. Although the BPNN structure we used is relatively simple, the accuracy of our classification results is comparable to that of complex networks, and our training speed is improved by the streamlined structure of our BPNN; however, our goal is what the BPNN learns. The details of the experiments, including the framework and activation functions, are described as follows.

3.2. Deep Taylor Decomposition (DTD)

The main objective of DTD is to ensure that the indicative pattern of force changes after the BPNN can yield an accurate indicator of the year (i.e., the class probabilities). Our method, called “Deep Taylor Decomposition”, effectively utilizes the structure of the network by propagating the interpretation back from the output layer to the input layer; that is, we use this method to identify the regions in the input map that are most relevant to the BPNN’s prediction [19,20].
DTD is a common interpretative method for machine learning models which maps the logical operational process of a neural network to the very beginning dimension of the input data. The method performs a back propagation pass on the network, where a set of rules is applied uniformly to all layers of the network. The results show the most relevant regions of the neural network for the input map with the corresponding year (i.e., correlation of each input pixel). The implementation of DTD is as follows. With the BPNN training, we feed the samples we want to test into the trained BPNN and output the correlation probability of the year. The predictions we obtained are back propagated and then the correlation between the soil moisture and the prediction is output via DTD for each area of the input sample. Due to the special nature of DTD, the output value propagates conservatively, which ensures that all information of network decision is projected back to the original input. A detailed description of DTD can be found in [19].
In the transmission process of the DTD, since only one output prediction can be transmitted at a time, we input the maximum output value (i.e., probability) predicted by the neural network into the DTD, although we encode one year needed to encode the corresponding multiple probabilities with fuzzy encoding. Thus, the correlation heat map generated by the DTD back propagation represents those areas of soil moisture at the global scale that correspond to the year in which it was located in the BPNN at that time, i.e., the most relevant areas; in other words, our input map was the five-year range we encoded. Although we use fuzzy coding for the year with the highest probability value in every five-year period and output the information for that year, the samples of 2016 and 2019 still produce different heat maps due to the different paths of probability distribution of information flow. In addition, through additional experiments, we output all the probabilities for each of the five years, reverse the output by the DTD separately, and then sum the generated correlation heat map. Finally, we can obtain a similar scenario to the one above where only the maximum probability is transmitted.

3.3. Multiple Linear Regression (MLR)

Although the focus of this work is to analyze the results of nonlinear neural networks, the standard linear method is helpful for us to understand the above work [21]. When multi-layer artificial neural networks are used for prediction, the linear method is more referential than the non-linear method. We input the training set of global simulation data into the multiple linear regression to train the linear regression network, and use multiple linear regression to predict the year of the graph.
β y e a r = a 1 X 1 + a 2 X 2 + a 3 X 3 + + a 4050 X 4050 + c
The parameters in the above equation include the constant c, and xi denotes the specificity grid point (each year contains a total of 4050 grid points) and ai denotes the regression coefficient for each grid point. The role of multiple linear regression is not only for comparison with nonlinear experiments; this is also a clever use of DTD as it is not yet studied by most researchers in the earth sciences to explain neural networks, although some of its effects can be understood by linear regression. For example, the regression coefficients in multiple linear regression can assist us to understand how DTD works, thus providing a new path for researchers who are not familiar with this method.

4. All Neural Network Training

4.1. Back Propagation Neural Network Training

The entire time span of the model simulation data (CMIP5 model) was chosen from 2006–2099, where we set the training set to 80% of the total data and the test set to the remaining 20%. We conducted training with 11 simulated data and the remaining 3 soil moisture data for testing. All the neural networks in this paper used the same simulation data allocation method as above, and the same settings for the configuration of the neural networks considered in this paper and the initialization of the weights/paranoia were also used. This approach reduces other disturbing factors and makes the experiments more accurate.
In this paper, we apply quadratic cross-entropy loss to train the BPNN, and we discuss in detail the application of cross-entropy for uncertain category and correct category probabilities. The large difference in the number of neural units between our input and output layers—there are 4050 neural units in the input layer and only 19 neural units in the output layer—may lead to overfitting. In order to prevent overfitting, we use ridge regression (i.e., L2 regularization), a relatively common method in neural networks. We apply this method to the weights of all hidden layers to ensure the neural network prevents overfitting. Through our research, we found that ridge regression is also useful for visualizing the patterns learned by the BPNN. L2 regularization serves to disperse the importance of the inputs by adding an additional term proportional to the sum of the squares of the weights to the cross-entropy loss, which is similar to our understanding that soil moisture exhibits a large amount of spatial autocorrelation. In the soil moisture training, the regularization parameter is set to 0.001.
Before training the simulated data, we predict the training set to normalize it using the z-score processing method and subtract their corresponding means using the initial training set data and the corresponding years at each grid point. We tried various normalization methods before this; for example, the common Min-max normalization did not work very well. Since, in this paper, we normalize the data using the mean and standard deviation of all models, we do not remove differences in model means or variables.

4.2. Multiple Linear Regression Training

In this paper, multiple linear regression is regarded as a comparison for better understanding the results of the nonlinear neural network. The data set and other variables (weights and offsets) used in multiple linear regression are consistent with those used in the nonlinear network, so that the differences in the data set and variable allocation can be ignored. In order to compare linear and nonlinear neural networks as simply as possible, we designed the linear neural network in a form that is similar to the nonlinear neural network. In order to reflect the performance of the linear model as much as possible, we set the number of iterations to 1000 to optimize the weights, and the learning rate is set to 0.001, which is also introduced in the linear neural network. We also introduce regularization in the linear neural network to penalize unnecessarily large values of weights, to disperse the weights, and to increase the consistency of the same position; this is discussed in detail in Section 5.1.

5. Results

In the previous section, we systematically describe the learning training process of multiple linear regression and BP neural networks. In this section, we systematically analyze the results of our neural network training and discuss the true meaning of the neural network through the test set of prediction results, so as to analyze the difference in the patterns between the CMIP5 model simulations and the observed data.

5.1. Prediction Based on MLR

After training the multiple linear regression model above, we feed the test set into the trained multiple linear regression model to obtain the prediction results with the real years of the data represented in a two-dimensional coordinate system [22]. Figure 3b shows the prediction results of the multiple linear regression model for the years of simulated soil moisture data, with the x-axis indicating the true year and the y-axis indicating the predicted year, and where the training set of simulated data for the soil moisture model is represented by gray dots and the test set of simulated data is shown by the other colors. It can be seen in Figure 3b that the linear model shows good results in predicting the year of the soil moisture map, and the scatter plots almost always fall on a one-to-one line, a result that is satisfactory. Figure 3a represents a plot of the regression coefficients (ai in Equation (1)). In order to illustrate the importance of each grid point for our forecast year, we visualize the regression coefficients in the multivariate linearity, which enables the importance of different regions for the year forecast to be seen at a glance. The method of visualizing the regression coefficients of the linear model is similar to the correlation analysis performed by DTD for nonlinear neural networks, in that each grid point in the input graph is analyzed for its relevance/significance to the final prediction.
Although it is clear from Figure 3b that the predictions are still relatively good, there is a large degree of contrast in the adjacent positions of the linear regression coefficient map shown in Figure 3a. This is due to the positive and negative variables in the weights of the adjacent points, a situation that occurs in the earth sciences where a systematic physical interpretation is not possible. Therefore, we refer to the constrained study for the regression problem and this manifestation is defined as under-constrained (i.e., adjacent grid points have covariance). In the experiments, the regression task is allowed to overfit noisy patterns in the soil moisture map. These patterns are not the same as the large-scale patterns in the physical sense, a feature that is reflected in variability within climate science. Regarding the introduction of regularization in the regression model, the effect in the visualization is to make our graphs smoother, that is, to disperse the large weights to the adjacent grid points and reduce the values of the adjacent points, as shown in Figure 3c. From the perspective of physics, regularization adds spatial autocorrelation between soil moisture data, a physical property that is known in terms of physical data, and allows the interpretation of regression weights from the standpoint of physical properties. For example, higher soil moisture in eastern North America and northern South America would cause the model to predict later years, while higher soil moisture in eastern Asia and northern Europe would drive the model to predict earlier years.
The experimental analysis of the multiple linear regression model yields the following points, which can provide us with some ideas when analyzing nonlinear neural networks. First, we can explain the predictions of the regression model by visualizing the importance of each input cell (i.e., each prediction grid point; in this paper there are 4050 grid points) on the final output (expressed as linear regression coefficients). Secondly, L2 regularization applied to the neural network is very useful for our interpretation of the learned patterns, although the loss of prediction accuracy can be compared in Figure 3b,d. However, our main goal is to make the nonlinear neural network learn the indicative patterns associated with the year of the soil moisture input map, so we can accept its reduction in terms of prediction accuracy. The real situation is that the prediction accuracy improves after we apply L2 regularization in the experiments, which is due to the fact that regularization reduces the overfitting of the data. Third, the interpretation of the multiple linear regression predictions is static in time, or a single graph (Figure 3a,c); however, in Section 5.2, the manner in which DTD visualizes the importance of a region as a function of time for our neural network predictions is discussed.

5.2. Prediction Based on BPNN

By training the BPNN through model simulation we obtain the trained nonlinear neural network, where we feed the test set of soil moisture model simulation data into the trained BPNN model to obtain the year prediction for the input map in Figure 3f; this prediction is performed on top of the fuzzy classification described in Section 3.1. In Figure 3b,d, the gray points represent the training set and the other colored points represent the test set. Comparing Figure 3f with Figure 3b,d, it is clear that the BPNN has better predictions compared to multilinear regression—both in training and test simulations. This phenomenon suggests that the accuracy of nonlinear predictions is better in tasks with high predictive complexity. Both the training and test simulations in this paper are selected from the RCP8.5 scenario simulation, where the magnitude of the force changes increases over time. By learning the internal variation in soil moisture and model differences at a later stage in our model, it is easier to determine the year of the graph.
The white circles in Figure 3f indicate the prediction of the SMAP data set annual average soil moisture observation map input to the trained BPNN. Although the BPNN was not trained on the observation map, it still successfully predicted the observation map year when it was input to the observation map. This means that the BPNN learned, from the climate model, the pattern of force changes associated with the observed climate system. The results in Figure 3f show that the predictions from the simulated data fall within 6 years of the real year. When we feed the observed data into the trained BPNN, the biggest difference is the downward shift in the predictions based on the observed soil moisture maps. This suggests that the regional pattern learned from the model may be advanced, compared to what is observed by the satellite. As shown in Figure 4 and Figure 5, we input the CMIP simulated data and the observed data for the same years into the trained BPNN separately, and then visualize and output the most relevant regions for the predicted years by DTD. We analyze whether the observed data are similar to the model simulated data in the RCP8.5 scenario by comparing the differences in these regions and the deviations in the year predictions, and then analyze if the RCP8.5 scenario is applicable to our estimates of future scenarios. This is discussed in Section 6.3.

6. Discussions

6.1. CMIP5

First, we model the RCP8.5 scenario in CMIP5 as the largest population, a low rate of technological innovation, slow energy improvements, and, therefore, slow income growth. These result in high energy demand and high GHG emissions over time, and a lack of policies to address climate change. This scenario is chosen to consider the problem in the worst possible way for our survival and nature’s environment. Thus, we analyze the impact of model simulations in the RCP8.5 scenario in our survival environment, and, by training the neural network on 14 CMIP5 model simulation data, we find that as the year increases, the increase in anthropogenic or natural force promotes the neural network in identifying the year of the data. The increasing accuracy also indicates that the indicator pattern is very important for the training of our neural network. During this period, the force of anthropogenic greenhouse gases and aerosols increased substantially [16,23,24]. As the forcing signal increases, the learned indicator patterns are more easily distinguished from internal variability and inter-model differences. The results for soil moisture confirm that the BPNN successfully indicates the force patterns that emerge under the RCP scenario simulation. However, given that soil moisture exhibits one of the most powerful and well-documented effects of anthropogenic climate change on various force factors [25,26,27,28], the results are perhaps not surprising.
While the results in Figure 3 above show the ability of the BPNN to predict the year of the soil moisture map, from a rigorous perspective, it is interesting to see what model the artificial neural network is using to determine the simulated or observed year. That is, in the context of climate change and model uncertainty, what regions can be used as indicators of change at the global scale? Our neural network visualization tool, DTD, is used to solve this problem. Firstly, we back propagate the output value of the neural network by DTD and visualize the output value of DTD, so that we obtain a heat map distribution of correlations about specific years. The relative analysis for DTD is similar to the generated regression coefficient plots (e.g., Figure 3a,c), but the difference is that DTD can generate separate interest plots for any of the inputs/forecasts. In addition, according to our nonlinear neural network, it can highlight the most relevant regions of the global regions, thus using these regions as the most reliable indicators of the forecast year.
We apply DTD to the predictions for all training and test simulations. The DTD heat map in Figure 4 is the soil moisture simulation test set map which is fed into the trained BPNN to accurately predict each year. Similar to the regression coefficient plots in Figure 3a,c, these correlation heat maps vary over time due to the structure of the artificial neural network, and it is possible to visualize the most reliable regions in a given year through this heat map. As shown in Figure 4, each correlation heat map is output once so that we can see how soil moisture changes over time; however, again in Figure 4 we have selected only a portion of the predicted maps. It is clear from Figure 4 that eastern Asia and western North America have shown a large correlation over the 21st century, with the correlation increasing over time in Australia. This reflects the strong force signal due to a combination of anthropogenic and external forces that has played a role in soil moisture over the decades. Thus, the BPNN demonstrated the year that may be used as the correlation increases and thus has a basis for identification.

6.2. Observations

Our analysis of the model simulation data shows that the BPNN successfully identifies reliable patterns of indicator variability amidst the noise of internal variability and model uncertainty in the CMIP5 model simulations. In Section 5.2, we input the observed soil moisture maps from the 2006–2020 SMAP data set into the BPNN trained on the climate model. The BPNN successfully identifies approximately the correct years from the observed maps. This indicates that the pattern of change indicators identified by the BPNN trained on the geoscience model is present in the observed maps.
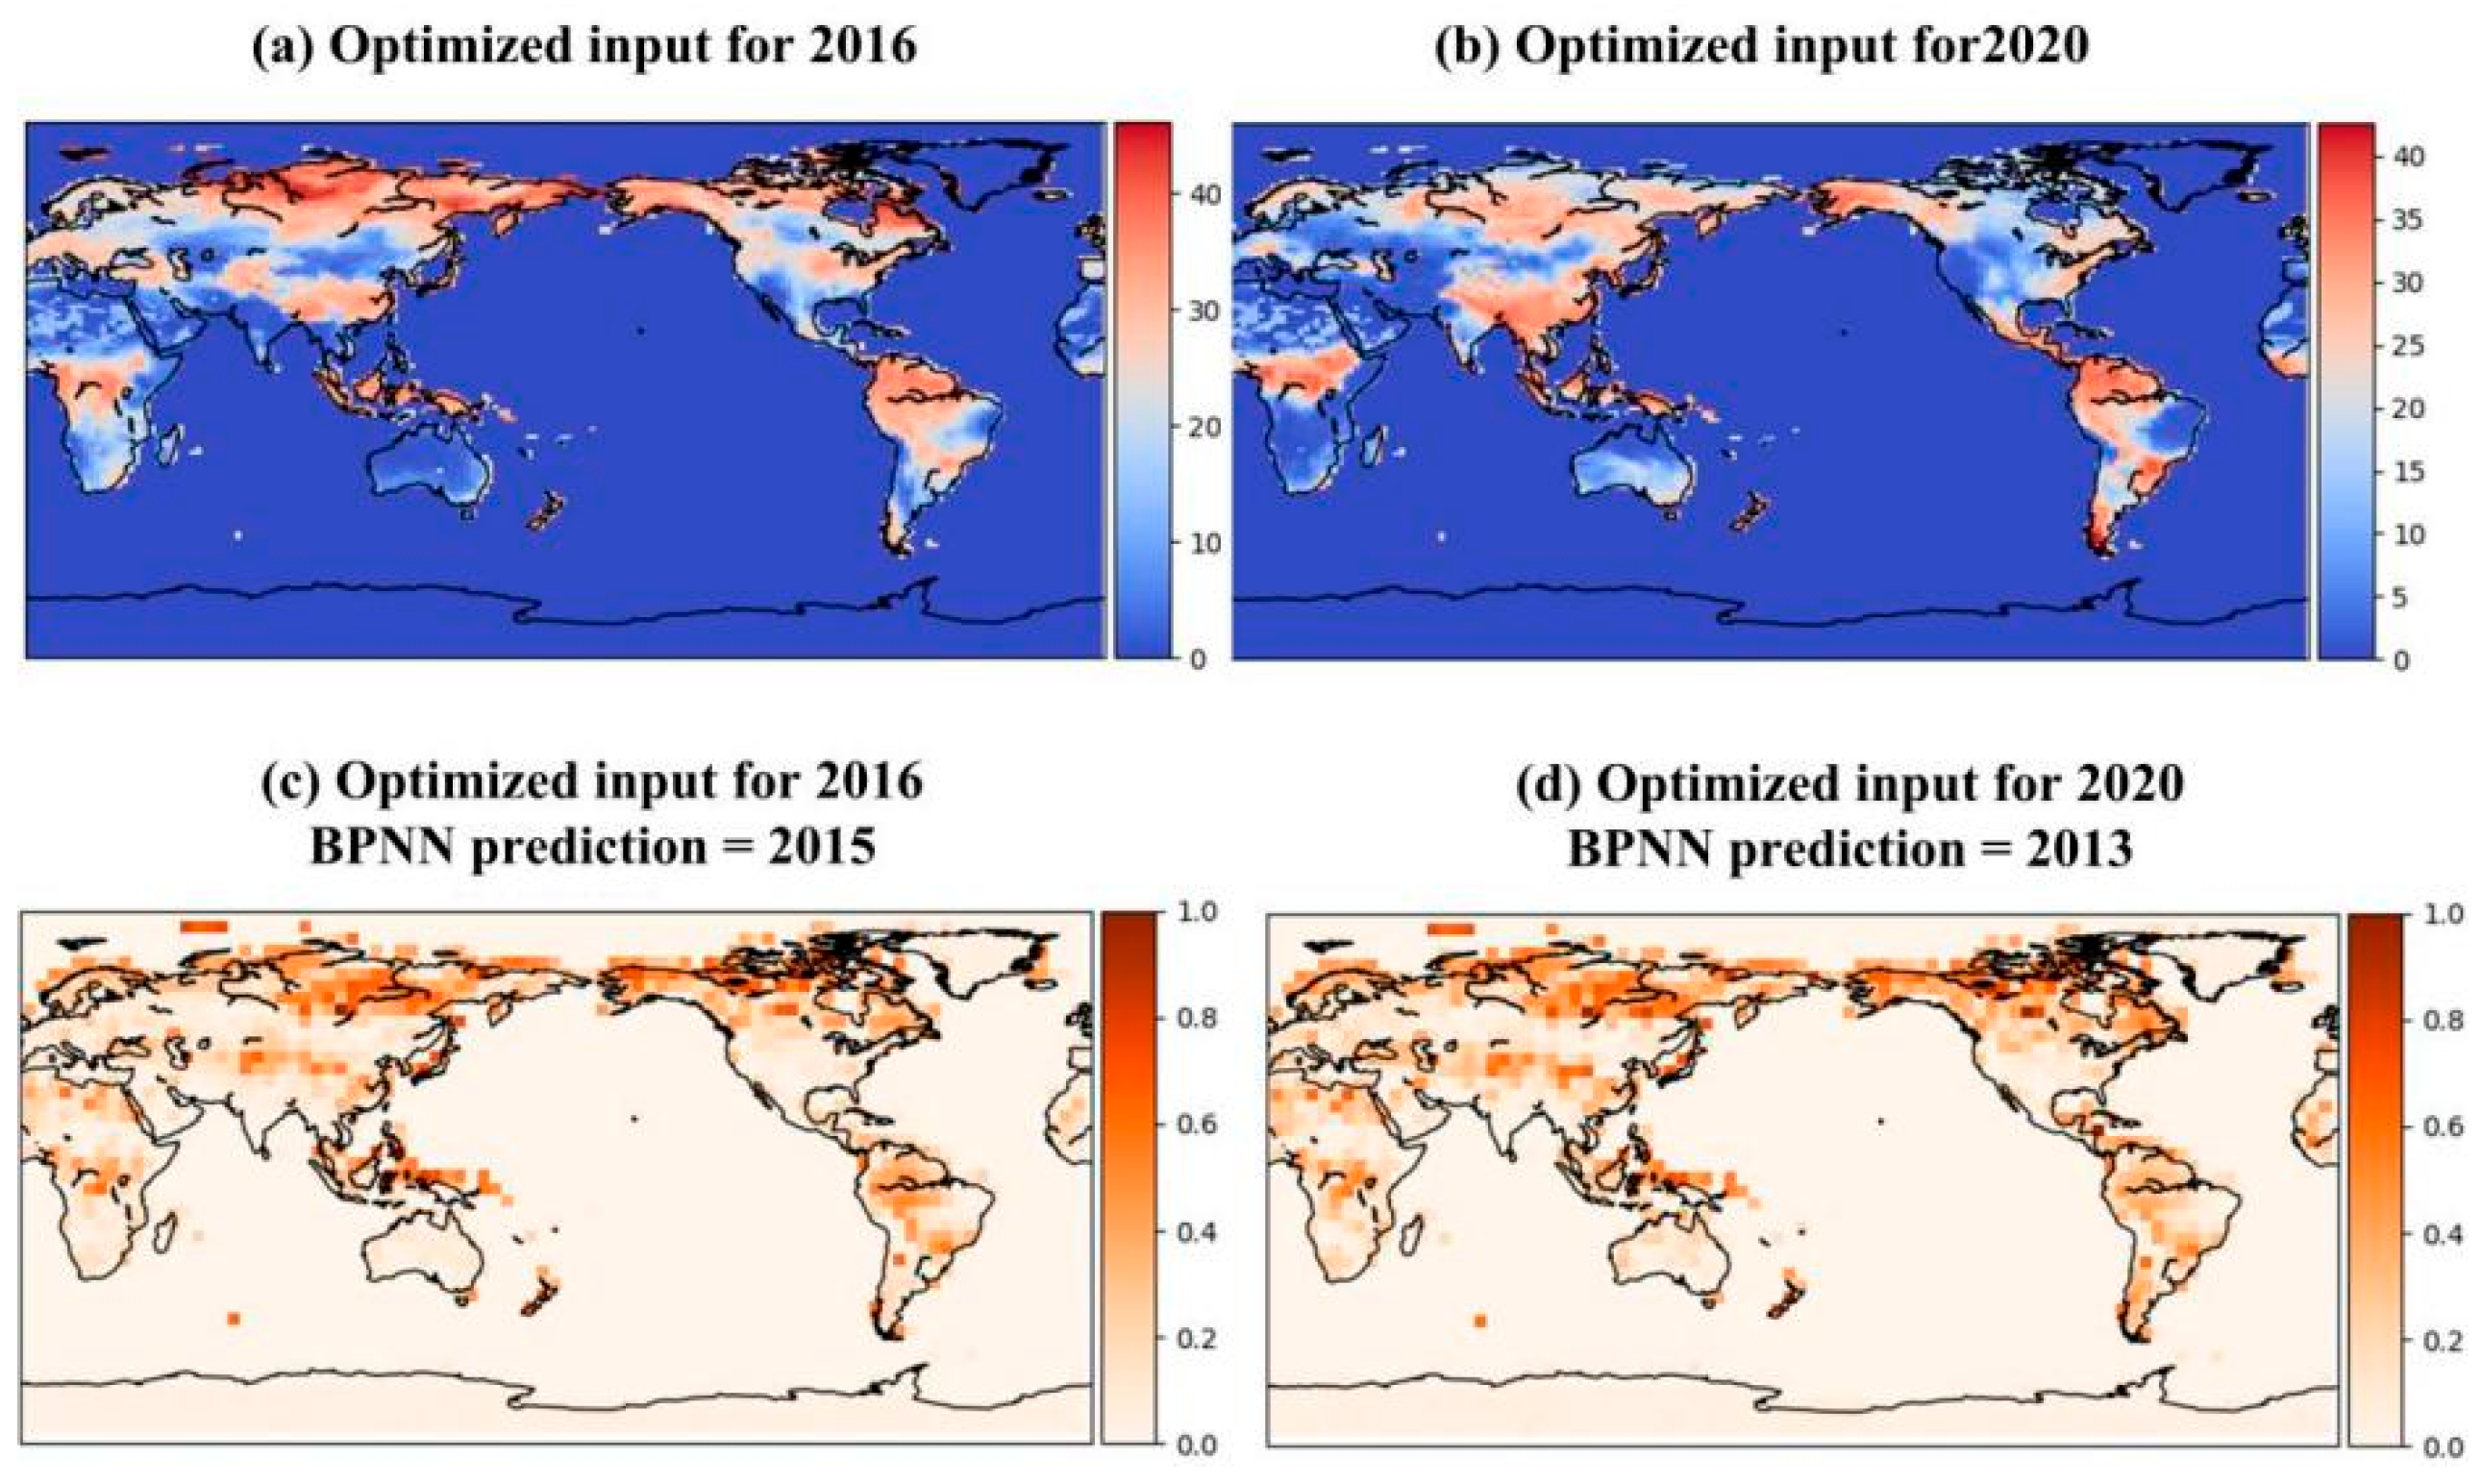
It is shown above that BPNN can identify the correct year of the observation graph; however, the correlation region of the observation graph is also assessed. Therefore, we output the prediction of the SMAP observation plot through the DTD as a correlation heat map, based on which we can obtain the regions that are important for the observed data and thus affect our prediction of the observation plot (the white dots in Figure 3f indicate the observed SMAP data). As shown in Figure 5, we input the SMAP soil moisture map for 2016 and 2020 into the trained BPNN to obtain the prediction maps, where Figure 5a,b are the prediction maps for 2016 and 2020, respectively. Although the patterns of soil moisture anomalies in 2016 and 2020 are very different, the BPNN uses similar regional correlation heat maps for prediction (Figure 5c,d). Overall, the largest correlations appear to be in Asia and northern North America, although some non-zero correlations are also seen in other regions. Furthermore, despite the large El Niño signal in 2016 (equatorial east-central Pacific) and the anomalous soil moisture signal across the northern mid-high latitudes in 2020, these regions were not considered, which is relevant to our predicted years in our neural network’s discrimination. This again emphasizes that the neural network identifies the most reliable signals/regions, not just the anomalous regions.

6.3. Deviation of CMIP5 Simulated and Observed Data

The soil moisture data from SMAP are obtained by the Soil Moisture Active Passive radiometer. Compared with the soil moisture obtained by CMIP5 simulations, SMAP is used as soil moisture data with fewer errors. In this study, SMAP also acts as the observed data and is applied to infer biases within the CMIP5 models. As can be seen in the above comparative analysis of the entire experiment for CMIP5 simulated and observed data (white circles in Figure 3f), the projections based on the observed maps are delayed by about 10 years. This indicates that the simulated data are ahead of their assumptions relative to the observed data, which is also in line with the assumptions of the RCP8.5 scenario simulation. As a premise of high consumption, high emissions, and lack of corresponding policies on climate change, this leads to a significant lag in the predicted years of the simulation’s assumptions relative to today’s premise of reasonable environmental protection and resource allocation, etc. This also proves that our neural network can illustrate clearly the indicative pattern of force changes in the simulation. To better represent this bias, we visualize the difference between the observed and simulated data for the same year and then output a correlation heat map. We can than see that the difference between them is fully represented in Figure 6, unlike in Figure 4 and Figure 5. Figure 6a shows the correlation heat map obtained from the difference between the observed data and the simulated data of the same year in “2016”. This also proves that our model has great advantages and prospects in distinguishing observed data from simulated data.

7. Conclusions

In this paper, we use a back propagation neural network (BPNN) and a powerful visualization method, Deep Taylor Decomposition, to identify reliable indicator patterns of force variables within annual mean soil moisture maps from climate model simulations. The applied method provides a new pathway for researchers to improve model simulations or to analyze the main influences on future forcing changes and opens new doors to continue the application of neural networks in different roles to the field of geosciences. Indicator patterns change over time, and the BPNN captures model-consistent nonlinearities, deviations in temporal evolution between observed and simulated data, by exploiting relationships between grid points. Since the interpretability of the Deep Taylor Decomposition can help propagate the predicted values of the nonlinear neural network to obtain the regions associated with the predicted years, we can also obtain for the observed data those regions that are relevant to predicting their years. For example, in the experiments, we find that the BPNN treats western South America as a reliable region for forcing variability in the observed data. Finally, we show the most relevant regions for a given year where the climate model differs most from the observed data.
Although the study can identify the patterns of force changes in climate simulations, the patterns themselves cannot be presented due to the complex nonlinear process of the BPNN model. In future work, a deep learning model will be developed that provides an intuitive way to explain how the model predicts the year based on the soil moisture data.

Author Contributions

Conceptualization, X.L. (Xiaoning Li), H.Z., C.S., X.L. (Xiaofeng Li), X.L. (Xiaolin Li), Y.Z. and X.W.; methodology, X.L. (Xiaoning Li), H.Z., C.S., X.L. (Xiaofeng Li), X.L. (Xiaolin Li), Y.Z. and X.W.; software, C.S., Y.Z.; validation, X.L. (Xiaoning Li), H.Z., C.S., X.L. (Xiaofeng Li), X.L. (Xiaolin Li), Y.Z. and X.W.; formal analysis, X.L. (Xiaoning Li), H.Z., C.S., X.L. (Xiaofeng Li), X.L. (Xiaolin Li), Y.Z. and X.W.; investigation, X.L. (Xiaoning Li), H.Z., C.S., X.L. (Xiaofeng Li), X.L. (Xiaolin Li), Y.Z. and X.W.; data curation, C.S., Y.Z.; writing—original draft preparation, X.L. (Xiaoning Li); writing—review and editing, X.L. (Xiaoning Li), H.Z., C.S., X.L. (Xiaofeng Li), X.L. (Xiaolin Li), Y.Z. and X.W.; supervision, X.W. All authors have read and agreed to the published version of the manuscript.

Funding

This work was supported in part by the Social Science Project of Education Department of Jilin Province under Grant JJKH20181219SK, the Natural Science Foundation of Changchun Normal University under Grant 2019006.

Institutional Review Board Statement

Not applicable.

Informed Consent Statement

Not applicable.

Data Availability Statement

The data in this paper are available without any restriction.

Acknowledgments

We acknowledge the World Climate Research Programme’s Working Group on Coupled Modelling, which is responsible for CMIP, and we appreciate the climate modeling groups for producing and making available their model output. The author would also like to thank Cropscape portal for access to the SMAP level4 open data hub.

Conflicts of Interest

The authors declare no conflict of interest.

References

  1. Ma, Z.; Fu, C.; Xie, L.; Chen, W.; Tao, S. Some problems in the study on the relationship between soil moisture and climatic change. Adv. Earth Sci. 2001, 16, 563–566. [Google Scholar] [CrossRef]
  2. Dospinescu, N.; Dospinescu, O.; Tatarusanu, M. Analysis of the Influence Factors on the Reputation of Food-Delivery Companies: Evidence from Romania. Sustainability 2020, 12, 4142. [Google Scholar] [CrossRef]
  3. Council, N. GOALS (Global Ocean-Atmosphere-Land System) for Predicting Seasonal-to-Interannual Climate: A Program of Observation, Modeling, and Analysis; National Academy Press: Cambridge, MA, USA, 1994. [Google Scholar]
  4. Shukla, J.; Mintz, Y. Influence of land-surface evapotranspiration on the earth’s climate. Science 1982, 215, 1498–1501. [Google Scholar] [CrossRef]
  5. Dirmeyer, P.A. Using a global soil wetness data set to improve seasonal climate simulation. J. Clim. 2000, 13, 2900–2922. [Google Scholar] [CrossRef]
  6. Koster, R.D.; Dirmeyer, P.A.; Guo, Z.; Bonan, G.; Chan, E.; Cox, P.; Gordon, C.T.; Kanae, S.; Kowalczyk, E.; Lawrence, D.; et al. Regions of strong coupling between soil moisture and precipitation. Science 2004, 305, 1138–1140. [Google Scholar] [CrossRef]
  7. Lehner, F.; Deser, C.; Maher, N.; Marotzke, J.; Fischer, E.M.; Brunner, L.; Knutti, R.; Hawkins, E. Partitioning climate projection uncertainty with multiple large ensembles and CMIP5/6. Earth Syst. Dyn. 2020, 11, 491–508. [Google Scholar] [CrossRef]
  8. Hawkins, E.; Sutton, R. The potential to narrow uncertainty in regional climate predictions. Bull. Am. Meteorol. Soc. 2009, 90, 1095–1108. [Google Scholar] [CrossRef]
  9. Cassou, C.; Kushnir, Y.; Hawkins, E.; Pirani, A.; Kucharski, F.; Kang, I.-S.; Caltabiano, N. Decadal Climate Variability and Predictability: Challenges and Opportunities. Bull. Am. Meteorol. Soc. 2018, 99, 479–490. [Google Scholar] [CrossRef]
  10. Mudelsee, M. Trend analysis of climate time series: A review of methods. Earth-Sci. Rev. 2019, 190, 310–322. [Google Scholar] [CrossRef]
  11. Thompson, D.W.; Wallace, J.M. The Arctic Oscillation signature in the wintertime geopotential height and temperature fields. Geophys. Res. Lett. 1998, 25, 1297–1300. [Google Scholar] [CrossRef] [Green Version]
  12. Wheeler, M.C.; Hendon, H.H. An all-season real-time multivariate MJO index: Development of an index for monitoring and prediction. Mon. Weather Rev. 2004, 132, 1917–1932. [Google Scholar] [CrossRef]
  13. Barnes, E.A.; Toms, B.; Hurrell, J.W.; Ebert-Uphoff, I.; Anderson, C.; Anderson, D. Indicator patterns of forced change learned by an artificial neural network. JAMES 2020, 12, e2020MS002195. [Google Scholar] [CrossRef]
  14. Han, X.; Wei, Z.; Zhang, B.; Li, I.; Du, T.; Chen, H. Crop evapotranspiration prediction by onsidering dynamic change of crop oefficient and the precipitation effect in back-propagation neural network model. J. Hydrol. 2021, 596, 126104. [Google Scholar] [CrossRef]
  15. Taylor, K.E.; Stouffer, R.J.; Meehl, G.A. An overview of CMIP5 and the experiment design. Bull. Am. Meteorol. Soc. 2012, 93, 485–498. [Google Scholar] [CrossRef]
  16. Meinshausen, M.; Smith, S.J.; Calvin, K.; Daniel, J.S.; Kainuma, M.; Lamarque, J.-F.; Matsumoto, K.; Montzka, S.A.; Raper, S.C.B.; Riahi, K.; et al. The RCP greenhouse gas concentrations and their extensions from 1765 to 2300. Clim. Chang. 2011, 109, 213. [Google Scholar] [CrossRef]
  17. Aissaoui, O.E.; Madani, Y.; Oughdir, L.; El Allioui, Y. A fuzzy classification approach for learning style prediction based on web mining technique in e-learning environments. Educ. Inf. Technol. 2019, 24, 1943–1959. [Google Scholar] [CrossRef]
  18. Zadeh, L.A. Fuzzy Sets, Fuzzy Logic, and Fuzzy Systems: Selected Papers by Lotfi. A. Zadeh; World Scientific: Singapore, 1996; pp. 394–432. [Google Scholar]
  19. Bach, S.; Binder, A.; Montavon, G.; Klauschen, F.; Müller, K.-R.; Samek, W. On pixel-wise explanations for non-linear classifier decisions by layer-wise relevance propagation. PLoS ONE 2015, 10, e0130140. [Google Scholar] [CrossRef]
  20. Montavon, G.; Lapuschkin, S.; Binder, A.; Samek, W.; Müller, K.-R. Explaining nonlinear classification decisions with deep taylor decomposition. Pattern Recognit. 2017, 65, 211–222. [Google Scholar] [CrossRef]
  21. Salmerón, R.; García, C.B.; García, J. Variance Inflation Factor and Condition Number in multiple linear regression. J. Stat. Comput. Simul. 2018, 88, 2365–2384. [Google Scholar] [CrossRef]
  22. Sippel, S.; Meinshausen, N.; Merrifield, A.; Lehner, F.; Pendergrass, A.G.; Fischer, E.; Knutti, R. Uncovering the forced climate response from a single ensemble member using statistical learning. J. Clim. 2019, 32, 5677–5699. [Google Scholar] [CrossRef]
  23. Lamarque, J.-F.; Kyle, G.P.; Meinshausen, M.; Riahi, K.; Smith, S.J.; van Vuuren, D.P.; Conley, A.J.; Vitt, F. Global and regional evolution of short-lived radiatively-active gases and aerosols in the Representative Concentration Pathways. Clim. Chang. 2011, 109, 191. [Google Scholar] [CrossRef]
  24. Myhre, G.; Shindell, D.; Bréon, F.; Collins, W.; Fuglestvedt, J.; Huang, J.; Koch, D.; Granier, C.; Haigh, J.; Hodnebrog, Ø.; et al. Anthropogenic and Natural Radiative Forcing; Cambridge University Press: Cambridge, UK, 2014. [Google Scholar]
  25. Bindoff, N.L.; Stott, P.A.; AchutaRao, K.M.; Allen, M.R.; Gillett, N.; Gutzler, D.; Hansingo, K.; Hegerl, G.; Hu, Y.; Jain, S.; et al. Detection and Attribution of Climate Change: From Global to Regional; Cambridge University Press: Cambridge, UK, 2013. [Google Scholar]
  26. Gregory, J.M.; Andrews, T. Variation in climate sensitivity and feedback parameters during the historical period. Geophys. Res. Lett. 2016, 43, 3911–3920. [Google Scholar] [CrossRef]
  27. Knutson, T.; Kossin, J.; Mears, C.; Perlwitz, J.; Wehner, M. Detection and Attribution of Climate Change; U.S. Department of Commerce: Washington, DC, USA, 2017.
  28. Andrews, T.; Gregory, J.M.; Paynter, D.; Silvers, L.G.; Zhou, C.; Mauritsen, T.; Webb, M.J.; Armour, K.C.; Forster, P.M.; Titchner, H. Accounting for changing temperature patterns increases historical estimates of climate sensitivity. Geophys. Res. Lett. 2018, 45, 8490–8499. [Google Scholar] [CrossRef]
Figure 1. Schematic of BPNN architecture employed here to predict the year of a map of soil moisture. The output layer is divided into classes, each representing a single five years. The BPNN task is to predict the class probabilities associated with the input, which is called a classification task. Here, fuzzy classification [17] is used to encode the specific year, and binary cross-entropy is used during training. Sustainability 14 11310 i001 Input layer: an image that is composed of pixel values in the length and width directions; Sustainability 14 11310 i002 Hidden layers: Artificial Neuron; Sustainability 14 11310 i003 Output layer: predict the year of a map of soil moisture.
Sustainability 14 11310 g001
Figure 2. Fuzzy classification encoding and decoding of example years. Sustainability 14 11310 i004 Probability belongs entirely to the 2011–2015 class; Sustainability 14 11310 i005 Probability belongs entirely to the 2063–2068 class; Sustainability 14 11310 i006 Probability belongs entirely to the 2093–2098 class.
Sustainability 14 11310 g002
Figure 3. Predictions and regression weights from using multilinear regression of temperature at each grid point to predict the year of the map. The upper row (a,b) uses no regularization (λ = 0.0) and the lower row (c,d) utilizes L2 regularization (λ = 0.2). Training data are shown in gray, while colors denote the different CMIP5 model simulations used for testing, where each color denotes a different simulation. (e,f) represents the training in the BPNN, where the gray dots and other colored dots are the same as those set in the multivariate linear regression, but the white dots represent the SMAP observation data.
Sustainability 14 11310 g003
Figure 4. The prediction results for different years are obtained by feeding the test set of simulated data into the trained BPNN. Although our test set consists of three simulations, the above results are gained by randomly taking one of the simulations and feeding it into the neural network. The prediction on the test set of simulated data gives us a better understanding of the good performance of BPNN.
Sustainability 14 11310 g004
Figure 5. (a,b) represent the SMAP observation maps for 2016 and 2020, respectively, obtained by populating the processed 4050 soil moisture values into the global region. The correlation heat map between (c,d) is obtained by feeding (a) and (b) into the trained BPNN neural network and then visualization with DTD; the prediction is made for the year of the observation map, respectively, and this result is in accordance with our prediction.
Sustainability 14 11310 g005
Figure 6. Deviation patterns between observed and simulated data. In order to distinguish the deviation pattern between observed and simulated data, we subtract all points of simulated data from all points of observed data, input the deviation map into the trained BPNN, and then visualize the correlation heat map with DTD. From (a,b) we can see that, compared with Figure 5c,d, their correlations for northern Asia and eastern North America are almost non-existent. However, the correlation between Europe and eastern Asia increases. This phenomenon is consistent with the experimental prediction for the simulated data at the beginning of the 21st century, which indicates an advance of about 5–6 years relative to the observed data in terms of simulated data.
Sustainability 14 11310 g006
Table 1. 14 CMIP5 models analyzed with available soil moisture data.
Modeling
Center/Version
Organization and CountryResolutionYearsForcing
ACCESS1-0CSIRO_BOM, Australia1.25° × 1.875°2006–099RCP 8.5
ACCESS1-3CSIRO_BOM, Australia1.25° × 1.875°2006–2099RCP 8.5
bcc-csm1-1BCC, China2.8125°× 2.8125°2006–2099RCP 8.5
bcc-csm1-1-mBCC, China1.125° × 1.125°2006–2099RCP 8.5
BNU-ESMGCESS, China2.8125°× 2.8125°2006–2099RCP 8.5
CanESM2CCCMA, Canada2.8125°× 2.8125°2006–2099RCP 8.5
CCSM4NCAR, America0.9375° × 1.25°2006–2099RCP 8.5
CESM1-BGCNSF_DOE_NCAR, America1.875° × 1.25°2006–2099RCP 8.5
CESM1-CAM5NSF_DOE_NCAR, America1.875° × 1.25°2006–2099RCP 8.5
CM5A-MRIPSL, Francenominal 1.2587° × 2.5°2006–2099RCP 8.5
CM5B-LRIPSL, France1.875° × 3.75°2006–2099RCP 8.5
CSIRO-Mk3-6-0CSIRO_QCCCE, Australia1.875° × 1.875°2006–2099RCP 8.5
MIROC5MIROC, Japan0.9375° × 1.25°2006–2099RCP 8.5
NorESM1-MNCC, Norway1.875° × 1.25°2006–2099RCP 8.5
Publisher’s Note: MDPI stays neutral with regard to jurisdictional claims in published maps and institutional affiliations.