

Predicting Factors Affecting Preparedness of Volcanic Eruption for a Sustainable Community: A Case Study in the Philippines

 , ,
, ,  and
and
Abstract
:1. Introduction
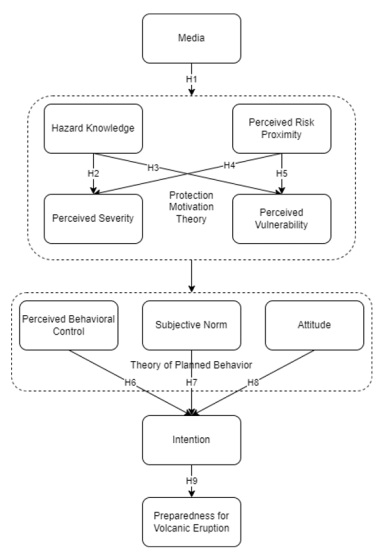
2. Conceptual Framework
3. Methodology
3.1. Demographics
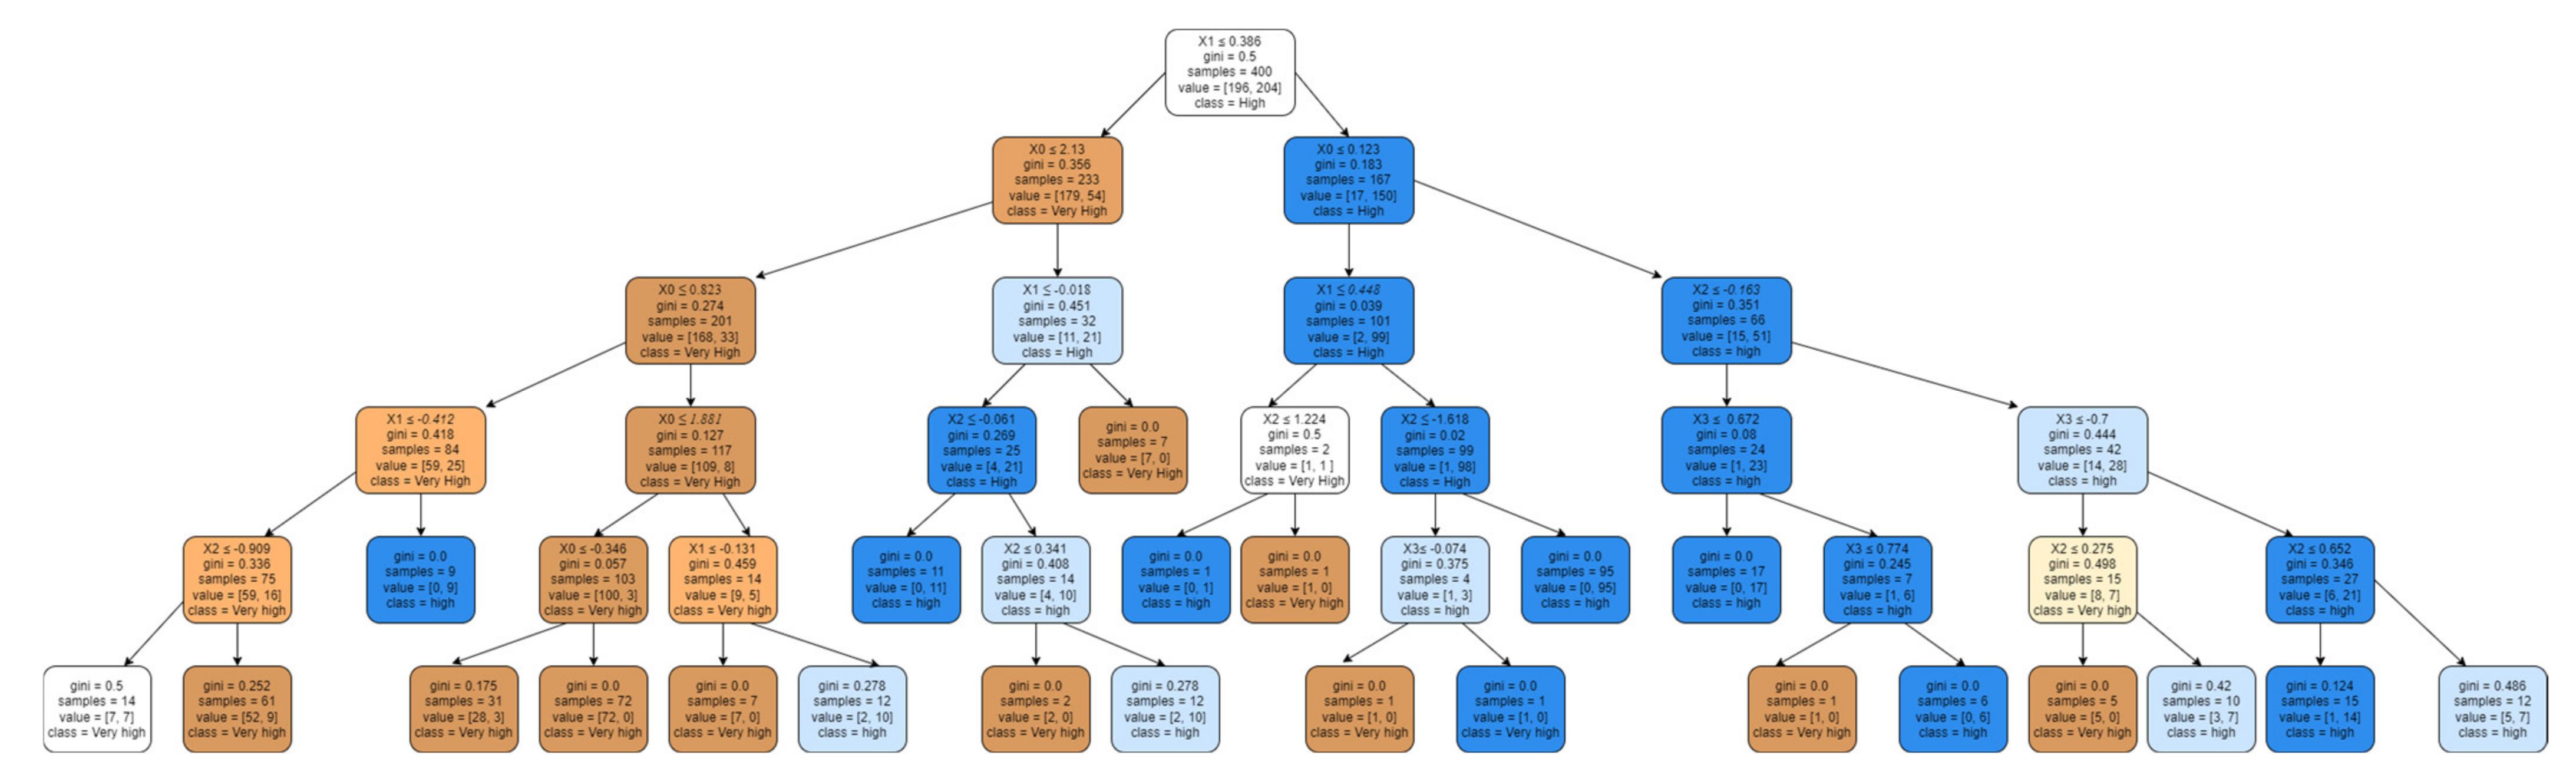
3.2. Random Forest Classifier
3.3. Artificial Neural Network
4. Results
4.1. Descriptive Statistics of the Items
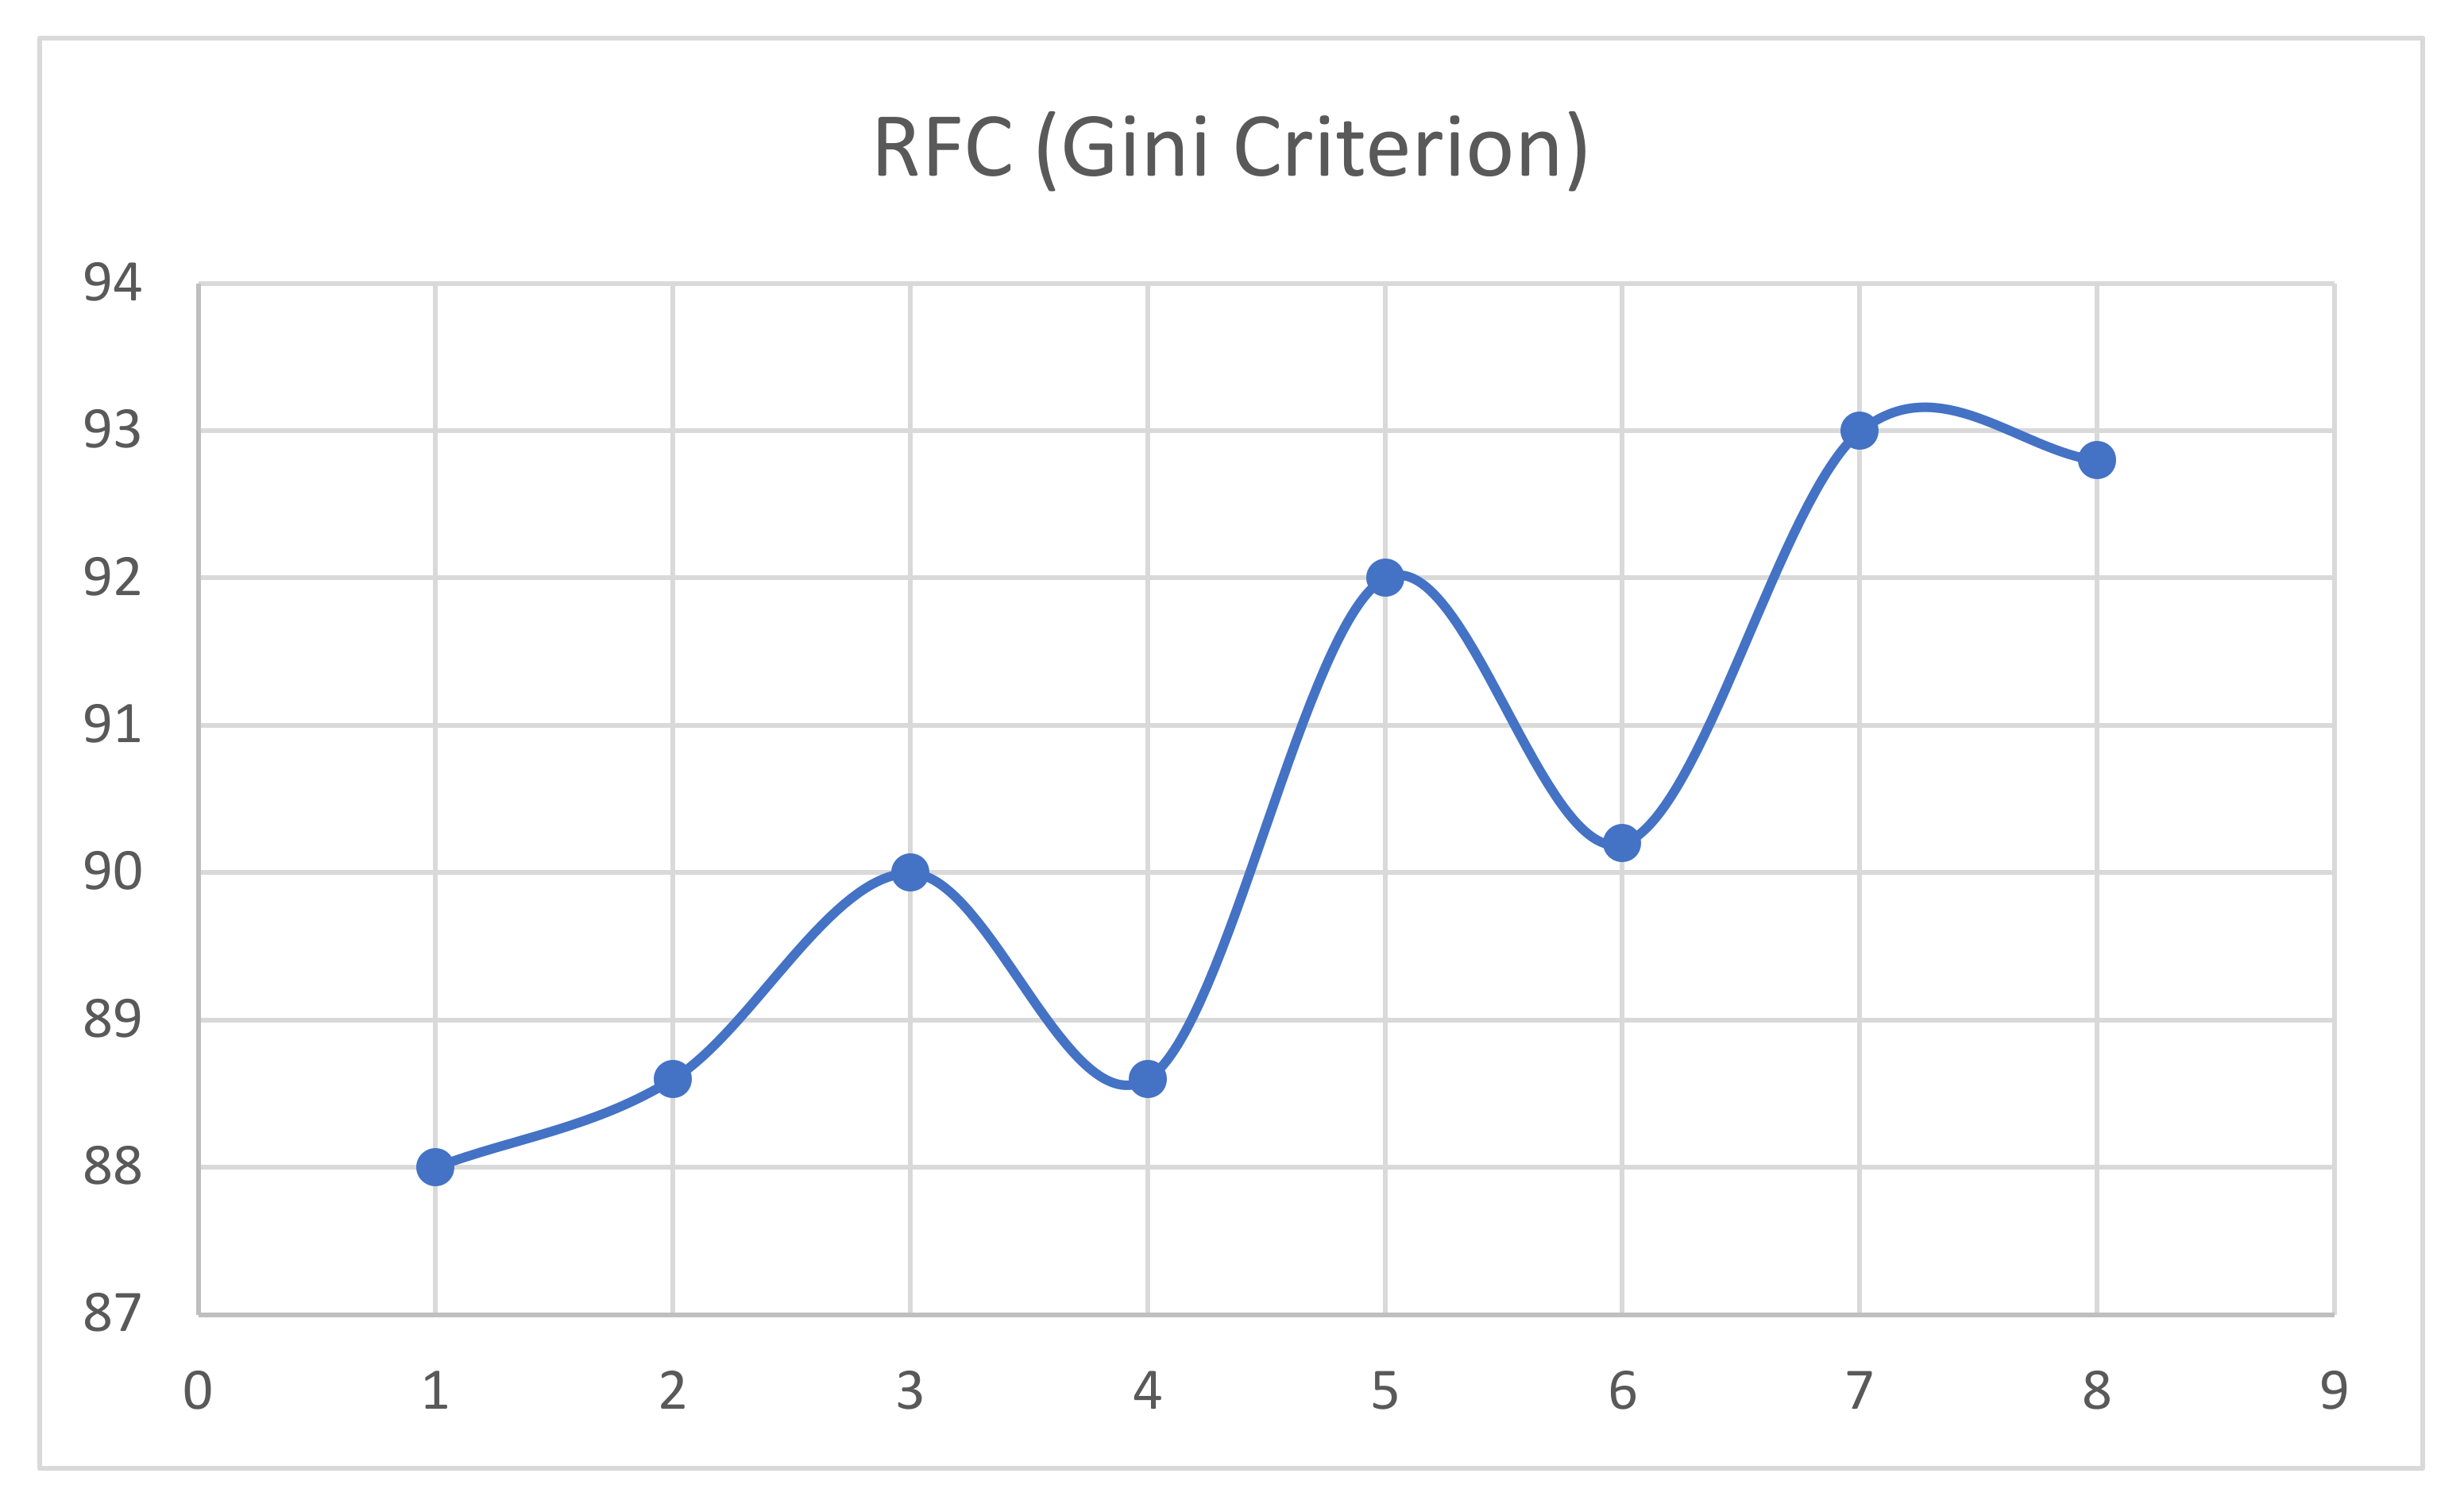
4.2. Random Forest Classifier
4.3. Artificial Neural Network
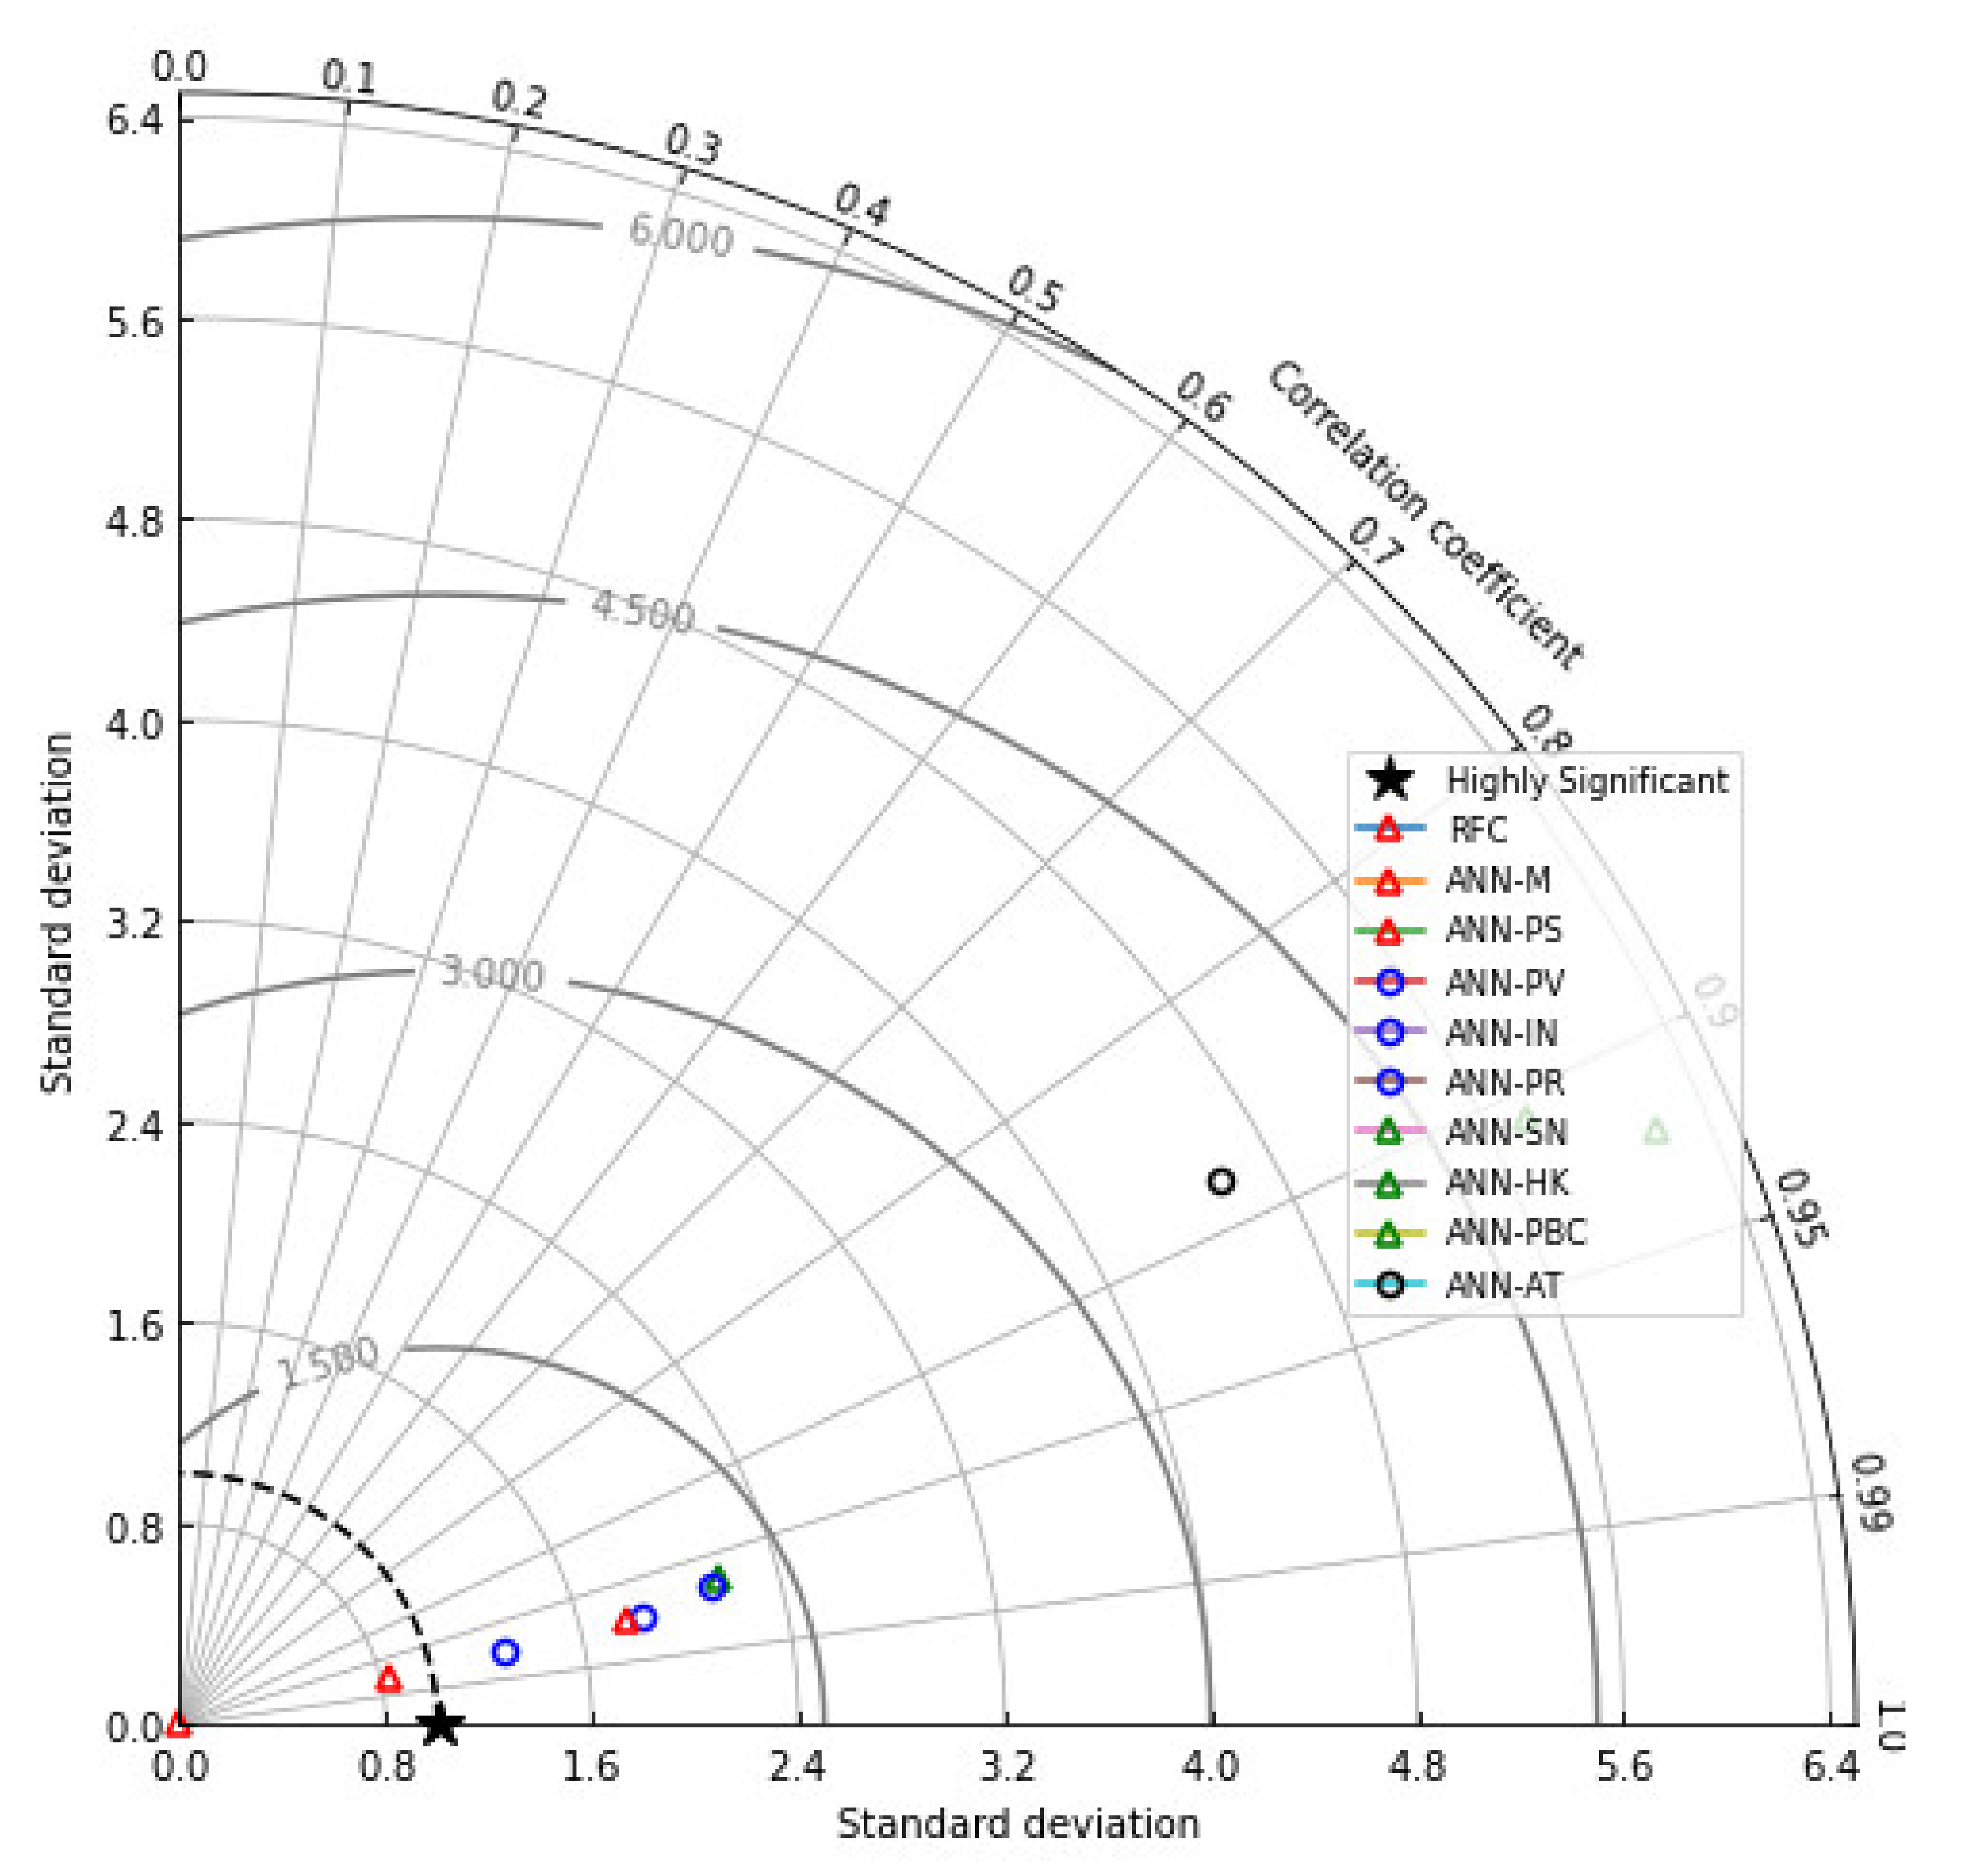
4.4. Evaluation of Accuracy
5. Discussion
5.1. Theoretical and Practical Implications
5.2. Limitations
6. Conclusions
Author Contributions
Funding
Institutional Review Board Statement
Informed Consent Statement
Data Availability Statement
Acknowledgments
Conflicts of Interest
Appendix A

| Construct | Items | Measures |
|---|---|---|
| Media | MP1 | I think there are a variety of sources for media information about volcanic activities. |
| MP2 | I believe that the information among media is easily shared. | |
| MP3 | I believe that social media contributes to the quick spreading of information regarding volcanic eruptions. | |
| MP4 | I know how to distinguish irrelevant information (fake news) from social media platforms. | |
| Hazard Knowledge | HK1 | I am familiar with the disaster sirens and warning signals. |
| HK2 | I believe I should wear masks to protect me from inhaling the ashes during volcanic eruption. | |
| HK3 | I know that I should limit myself from going outdoors to reduce my ash exposure. | |
| HK4 | I know that I should wear protective clothing during volcano eruption if I go outdoors. | |
| HK5 | I know that there is poor air quality before, during, and after a volcanic eruption. | |
| Perceived Risk Proximity | GP1 | I think my location is within the danger zone from a volcano. |
| GP2 | I am familiar with the nearest evacuation facility I can go to if a volcano erupts. | |
| GP3 | I am aware of the risks I have from volcaniv eruption based on my location. | |
| Perceived Severity | PS1 | I believe that a Taal volcano eruption is severe. |
| PS2 | I believe that a Taal volcano eruption may lead to deaths among people. | |
| PS3 | I believe that a Taal volcano eruption is much more severe than other volcanic eruptions. | |
| PS4 | I find that a Taal volcano eruption may affect my livelihood. | |
| PS5 | I think that it will cpst me much to rebuild my resources affected by a Taal volcano eruption. | |
| Perceived Vulnerability | PV1 | I think my community is vulnerable to experience the effects of Taal volcanic eruption. |
| PV2 | I am likely to experience the effects of a Taal volcano eruption based on my experience. | |
| PV3 | I have an experience of being vulnerable to volcano eruptions. | |
| PV4 | I know I am more vulnerable to severe effects of volcanic eruption if I have breathing problems. | |
| Perceived Behavioral Control | PBC1 | I am in control of the situation in protecting myself from eruption hazards. |
| PBC2 | I think it is easy to implement preventive measures in my vicinity. | |
| PBC3 | I know that I can avoid experiencing the effects of a volcanic eruption. | |
| PBC4 | I think I have sufficient knowledge in responding to effects of volcanic eruption. | |
| Subjective Norms | SN1 | Most people in my community follow the preventive measures given by the local government unit. |
| SN2 | People in my community receivedaid from the local government unit. | |
| SN3 | People living in my community go to the assigned evacuation centers before the volcano erupts. | |
| SN4 | Most people in my community observe safety measures when the volcano shows possibility of eruption. | |
| SN5 | People in my community still work for their living even though the government raises the alert levels for volcanic eruption. | |
| Attitude toward the Behavior | ATB1 | I am stressed in a volcanic eruption. |
| ATB2 | I am scared if my family will be affected by a volcanic eruption. | |
| ATB3 | I feel insecure when my community does not prepare for volcanic eruption. | |
| ATB4 | I am concerned when the government raises the alert level of the Taal volcano. | |
| ATB5 | I am confident that I know how to respond when a volcano erupts. | |
| Intention to Evacuate | IF1 | I am willing to adhere to the authorities’ instructions if they tell me to evacuate. |
| IF2 | I am willing to leave anything behind to put myself in the safest place in the fastest way possible. | |
| IF3 | My family is willing to leave anything behind to be in the safest place in the fastest way possible. | |
| IF4 | I am willing to stay in the evacuation area with other people until it is safe to go back in my home. | |
| Preparedness | PP1 | I believe preemptive measures by the authorities for disaster response are effective. |
| PP2 | I believe that the emergency warning awareness will keep me safe during volcanic eruption. | |
| PP3 | I believe that being updated by mass media will keep me safe during volcanic eruption. | |
| PP4 | I think being connected to any friend or family member who does not live near the volcano is necessary in any case of a life-threatening circumstance. | |
| PP5 | I think that it is essential to evacuate early if I am living in a community with the greatest risk. |
References
- Coppola, D.; Laiolo, M.; Cigolini, C.; Massimetti, F.; Delle Donne, D.; Ripepe, M.; Arias, H.; Barsotti, S.; Parra, C.B.; Centeno, R.G.; et al. Thermal Remote Sensing for Global Volcano Monitoring: Experiences from the mirova system. Front. Earth Sci. 2020, 7, 362. [Google Scholar] [CrossRef]
- Kurata, Y.B.; Prasetyo, Y.T.; Ong, A.K.; Nadlifatin, R.; Persada, S.F.; Chuenyindee, T.; Cahigas, M.M. Determining factors affecting preparedness beliefs among Filipinos on Taal Volcano eruption in Luzon, Philippines. Int. J. Disaster Risk Reduct. 2022, 76, 103035. [Google Scholar] [CrossRef]
- Brown, S.K.; Jenkins, S.F.; Sparks, R.S.; Odbert, H.; Auker, M.R. Volcanic fatalities database: Analysis of volcanic threat with distance and victim classification. J. Appl. Volcanol. 2017, 6, 15. [Google Scholar] [CrossRef]
- Niroa, J.J.; Nakamura, N. Volcanic disaster risk reduction in indigenous communities on Tanna Island, Vanuatu. Int. J. Disaster Risk Reduct. 2022, 74, 102937. [Google Scholar] [CrossRef]
- Thouret, J.-C.; Wavelet, E.; Taillandier, M.; Tjahjono, B.; Jenkins, S.F.; Azzaoui, N.; Santoni, O. Defining population socio-economic characteristics, hazard knowledge and risk perception: The adaptive capacity to persistent volcanic threats from Semeru, Indonesia. Int. J. Disaster Risk Reduct. 2022, 77, 103064. [Google Scholar] [CrossRef]
- Reyes-Hardy, M.-P.; Aguilera Barraza, F.; Sepúlveda Birke, J.P.; Esquivel Cáceres, A.; Inostroza Pizarro, M. GIS-based volcanic hazards, vulnerability and risks assessment of the Guallatiri Volcano, Arica y Parinacota Region, Chile. J. S. Am. Earth Sci. 2021, 109, 103262. [Google Scholar] [CrossRef]
- Barone, G.; De Giudici, G.; Gimeno, D.; Lanzafame, G.; Podda, F.; Cannas, C.; Giuffrida, A.; Barchitta, M.; Agodi, A.; Mazzoleni, P. Surface reactivity of Etna Volcanic Ash and evaluation of Health Risks. Sci. Total Environ. 2021, 761, 143248. [Google Scholar] [CrossRef]
- Michellier, C.; Kervyn, M.; Barette, F.; Muhindo Syavulisembo, A.; Kimanuka, C.; Kulimushi Mataboro, S.; Hage, F.; Wolff, E.; Kervyn, F. Evaluating population vulnerability to volcanic risk in a data scarcity context: The case of Goma City, Virunga Volcanic Province (DRCongo). Int. J. Disaster Risk Reduct. 2020, 45, 101460. [Google Scholar] [CrossRef]
- Dogar, M.M.; Sato, T. Regional climate response of middle eastern, African, and South Asian monsoon regions to explosive volcanism and Enso forcing. J. Geophys. Res. Atmos. 2019, 124, 7580–7598. [Google Scholar] [CrossRef]
- Dogar, M.M.; Sato, T. Analysis of climate trends and leading modes of climate variability for Mena Region. J. Geophys. Res. Atmos. 2018, 123, 13074–13091. [Google Scholar] [CrossRef]
- Dogar, M.M.; Stenchikov, G.; Osipov, S.; Wyman, B.; Zhao, M. Sensitivity of the regional climate in the Middle East and North Africa to volcanic perturbations. J. Geophys. Res. Atmos. 2017, 122, 7922–7948. [Google Scholar] [CrossRef]
- Fan, Y.; Chen, J.; Shirkey, G.; John, R.; Wu, S.R.; Park, H.; Shao, C. Applications of structural equation modeling (SEM) in Ecological Studies: An updated review. Ecol. Processes 2016, 5, 19. [Google Scholar] [CrossRef]
- Woody, E. An SEM perspective on evaluating mediation: What every clinical researcher needs to know. J. Exp. Psychopathol. 2011, 2, 210–251. [Google Scholar] [CrossRef]
- Duarte, P.; Pinho, J.C. A mixed methods UTAUT2-based approach to assess mobile health adoption. J. Bus. Res. 2019, 102, 140–150. [Google Scholar] [CrossRef]
- PHIVOLCS Taal Volcano Bulletin 9 April 2022 08:00 am. Available online: https://www.phivolcs.dost.gov.ph/index.php/volcano-hazard/volcano-bulletin2/taal-volcano/14430-taal-volcano-bulletin-9-april-2022-08-00-am#:~:text=There%20has%20been%20no%20recorded,dropped%20on%203%20April%202022 (accessed on 31 May 2022).
- Mangosing, M.A.M.-M.F. Bulusan Eruption Rains Ash, Forces Evacuation. Available online: https://newsinfo.inquirer.net/1606790/bulusan-eruption-rains-ash-forces-evacuation (accessed on 31 May 2022).
- Manila, U.S.E. Natural Disaster Alert–Mount Bulusan at Alert Level 1, June 6, 2022. Available online: https://ph.usembassy.gov/natural-disaster-alert-mount-bulusan-at-alert-level-1/ (accessed on 25 June 2022).
- The World Data Active Volcanoes and Eruptions in the Philippines. Available online: https://www.worlddata.info/asia/philippines/volcanos.php (accessed on 25 February 2022).
- Gumasing, M.J.; Prasetyo, Y.T.; Ong, A.K.; Nadlifatin, R. Determination of factors affecting the response efficacy of Filipinos under Typhoon Conson 2021 (jolina): An extended protection motivation theory approach. Int. J. Disaster Risk Reduct. 2022, 70, 102759. [Google Scholar] [CrossRef]
- Ong, A.K.; Prasetyo, Y.T.; Lagura, F.C.; Ramos, R.N.; Sigua, K.M.; Villas, J.A.; Young, M.N.; Diaz, J.F.; Persada, S.F.; Redi, A.A. Factors affecting intention to prepare for mitigation of “The big one” earthquake in the Philippines: Integrating protection motivation theory and extended theory of planned behavior. Int. J. Disaster Risk Reduct. 2021, 63, 102467. [Google Scholar] [CrossRef]
- Kurata, Y.B.; Prasetyo, Y.T.; Ong, A.K.; Nadlifatin, R.; Chuenyindee, T. Factors affecting perceived effectiveness of typhoon vamco (Ulysses) flood disaster response among Filipinos in Luzon, Philippines: An integration of protection motivation theory and extended theory of planned behavior. Int. J. Disaster Risk Reduct. 2022, 67, 102670. [Google Scholar] [CrossRef]
- Prasetyo, Y.T.; Castillo, A.M.; Salonga, L.J.; Sia, J.A.; Seneta, J.A. Factors affecting perceived effectiveness of COVID-19 prevention measures among Filipinos during enhanced community quarantine in Luzon, Philippines: Integrating Protection Motivation Theory and extended theory of planned behavior. Int. J. Infect. Dis. 2020, 99, 312–323. [Google Scholar] [CrossRef]
- Ong, A.K.; Chuenyindee, T.; Prasetyo, Y.T.; Nadlifatin, R.; Persada, S.F.; Gumasing, M.J.; German, J.D.; Robas, K.P.; Young, M.N.; Sittiwatethanasiri, T. Utilization of random forest and deep learning neural network for predicting factors affecting perceived usability of a COVID-19 contact tracing mobile application in Thailand “Thaichana. ” Int. J. Environ. Res. Public Health 2022, 19, 6111. [Google Scholar] [CrossRef] [PubMed]
- Ong, A.K.; Prasetyo, Y.T.; Velasco, K.E.; Abad, E.D.; Buencille, A.L.; Estorninos, E.M.; Cahigas, M.M.; Chuenyindee, T.; Persada, S.F.; Nadlifatin, R.; et al. Utilization of random forest classifier and artificial neural network for predicting the acceptance of reopening decommissioned nuclear power plant. Ann. Nucl. Energy 2022, 175, 109188. [Google Scholar] [CrossRef]
- Weichselgartner, J.; Pigeon, P. The role of knowledge in disaster risk reduction. Int. J. Disaster Risk Sci. 2015, 6, 107–116. [Google Scholar] [CrossRef]
- Phengsuwan, J.; Shah, T.; Thekkummal, N.B.; Wen, Z.; Sun, R.; Pullarkatt, D.; Thirugnanam, H.; Ramesh, M.V.; Morgan, G.; James, P.; et al. Use of social media data in Disaster Management: A survey. Future Internet 2021, 13, 46. [Google Scholar] [CrossRef]
- Dube, E.; Munsaka, E. The contribution of indigenous knowledge to disaster risk reduction activities in Zimbabwe: A big call to practitioners. Jàmbá J. Disaster Risk Stud. 2018, 10, 493. [Google Scholar] [CrossRef] [PubMed]
- Chuenyindee, T.; Ong, A.K.; Prasetyo, Y.T.; Persada, S.F.; Nadlifatin, R.; Sittiwatethanasiri, T. Factors affecting the perceived usability of the COVID-19 contact-tracing application “Thai chana” during the early COVID-19 omicron period. Int. J. Environ. Res. Public Health 2022, 19, 4383. [Google Scholar] [CrossRef]
- Arias, J.P.; Bronfman, N.C.; Cisternas, P.C.; Repetto, P.B. Hazard proximity and risk perception of tsunamis in coastal cities: Are people able to identify their risk? PLoS ONE 2017, 12, e0186455. [Google Scholar] [CrossRef] [PubMed]
- Yagoub, M.M.; Al Yammahi, A.A. Spatial distribution of natural hazards and their proximity to Heritage Sites: Case of the United Arab Emirates. Int. J. Disaster Risk Reduct. 2022, 71, 102827. [Google Scholar] [CrossRef]
- Rana, I.A.; Jamshed, A.; Younas, Z.I.; Bhatti, S.S. Characterizing flood risk perception in urban communities of Pakistan. Int. J. Disaster Risk Reduct. 2020, 46, 101624. [Google Scholar] [CrossRef]
- German, J.D.; Redi, A.A.; Prasetyo, Y.T.; Persada, S.F.; Ong, A.K.; Young, M.N.; Nadlifatin, R. Choosing a package carrier during COVID-19 pandemic: An integration of pro-environmental planned behavior (PEPB) theory and Service Quality (SERVQUAL). J. Clean. Prod. 2022, 346, 131123. [Google Scholar] [CrossRef] [PubMed]
- Vinnell, L.J.; Milfont, T.L.; McClure, J. Why do people prepare for natural hazards? developing and testing a theory of planned behaviour approach. Curr. Res. Ecol. Soc. Psychol. 2021, 2, 100011. [Google Scholar] [CrossRef]
- Najafi, M.; Ardalan, A.; Akbarisari, A.; Noorbala, A.A.; Jabbari, H. Demographic determinants of Disaster Preparedness Behaviors amongst Tehran inhabitants, Iran. PLoS Curr. 2015, 7, 1–15. [Google Scholar] [CrossRef]
- Bronfman, N.C.; Cisternas, P.C.; Repetto, P.B.; Castañeda, J.V. Natural disaster preparedness in a multi-hazard environment: Characterizing the sociodemographic profile of those better (worse) prepared. PLoS ONE 2019, 14, e0214249. [Google Scholar] [CrossRef] [PubMed]
- Bourque, L.B.; Regan, R.; Kelley, M.M.; Wood, M.M.; Kano, M.; Mileti, D.S. An examination of the effect of perceived risk on preparedness behavior. Environ. Behav. 2012, 45, 615–649. [Google Scholar] [CrossRef]
- Heller, K.; Alexander, D.B.; Gatz, M.; Knight, B.G.; Rose, T. Social and personal factors as predictors of earthquake preparation: The role of support provision, network discussion, negative affect, age, and EDUCATION1. J. Appl. Soc. Psychol. 2005, 35, 399–422. [Google Scholar] [CrossRef]
- Yuduang, N.; Ong, A.K.; Vista, N.B.; Prasetyo, Y.T.; Nadlifatin, R.; Persada, S.F.; Gumasing, M.J.; German, J.D.; Robas, K.P.; Chuenyindee, T.; et al. Utilizing structural equation modeling–artificial neural network hybrid approach in determining factors affecting perceived usability of mobile mental health application in the Philippines. Int. J. Environ. Res. Public Health 2022, 19, 6732. [Google Scholar] [CrossRef] [PubMed]
- Podsakoff, P.M.; MacKenzie, S.B.; Lee, J.-Y.; Podsakoff, N.P. Common method biases in behavioral research: A critical review of the literature and recommended remedies. J. Appl. Psychol. 2003, 88, 879–903. [Google Scholar] [CrossRef]
- Kim, Y.; Hardisty, R.; Torres, E.; Marfurt, K.J. Seismic-facies classification using random forest algorithm. In SEG Technical Program Expanded Abstracts 2018; SEG Library: Anaheim, CA, USA, 2018. [Google Scholar]
- Snehil; Goel, R. Flood damage analysis using machine learning techniques. Procedia Comput. Sci. 2020, 173, 78–85. [Google Scholar] [CrossRef]
- Chen, J.; Li, Q.; Wang, H.; Deng, M. A machine learning ensemble approach based on Random Forest and radial basis function neural network for risk evaluation of Regional Flood Disaster: A case study of the yangtze river delta, China. Int. J. Environ. Res. Public Health 2019, 17, 49. [Google Scholar] [CrossRef]
- Yang, W.; Zhou, S. Using decision tree analysis to identify the determinants of residents’ CO2 emissions from different types of trips: A case study of guangzhou, China. J. Clean. Prod. 2020, 277, 124071. [Google Scholar] [CrossRef]
- Moustra, M.; Avraamides, M.; Christodoulou, C. Artificial Neural Networks for earthquake prediction using time series magnitude data or seismic electric signals. Expert Syst. Appl. 2011, 38, 15032–15039. [Google Scholar] [CrossRef]
- Yariyan, P.; Zabihi, H.; Wolf, I.D.; Karami, M.; Amiriyan, S. Earthquake risk assessment using an integrated fuzzy analytic hierarchy process with artificial neural networks based on GIS: A case study of sanandaj in Iran. Int. J. Disaster Risk Reduct. 2020, 50, 101705. [Google Scholar] [CrossRef]
- Oktarina, R.; Bahagia, S.N.; Diawati, L.; Pribadi, K.S. Artificial Neural Network for predicting earthquake casualties and damages in Indonesia. IOP Conf. Ser. Earth Environ. Sci. 2020, 426, 012156. [Google Scholar] [CrossRef]
- Jamshidi, M.B.; Lalbakhsh, A.; Talla, J.; Peroutka, Z.; Roshani, S.; Matousek, V.; Roshani, S.; Mirmozafari, M.; Malek, Z.; La Spada, L.; et al. Deep learning techniques and COVID-19 drug discovery: Fundamentals, state-of-the-art and Future Directions. Stud. Syst. Decis. Control 2021, 348, 9–31. [Google Scholar] [CrossRef]
- Satwik, P.M.; Sundram, M. An integrated approach for weather forecasting and disaster prediction using Deep Learning Architecture based on memory augmented neural network’s (Mann’s). Mater. Today Proc. 2021; in press. [Google Scholar] [CrossRef]
- Lara, F.; Lara-Cueva, R.; Larco, J.C.; Carrera, E.V.; León, R. A deep learning approach for automatic recognition of seismo-volcanic events at the Cotopaxi Volcano. J. Volcanol. Geotherm. Res. 2021, 409, 107142. [Google Scholar] [CrossRef]
- Gholami, H.; Mohamadifar, A.; Sorooshian, A.; Jansen, J.D. Machine-learning algorithms for predicting land susceptibility to dust emissions: The case of the Jazmurian Basin, Iran. Atmos. Pollut. Res. 2020, 11, 1303–1315. [Google Scholar] [CrossRef]
- Thrun, M.C.; Gehlert, T.; Ultsch, A. Analyzing the fine structure of distributions. PLoS ONE 2020, 15, e0238835. [Google Scholar] [CrossRef] [PubMed]
- Sennert, S.S.; Klemetti, E.W.; Bird, D.K. Role of social media and networking in volcanic crises and Communication. Adv. Volcanol. 2015, 1, 733–743. [Google Scholar] [CrossRef]
- Ramakrishnan, T.; Ngamassi, L.; Rahman, S. Examining the factors that influence the use of social media for disaster management by underserved communities. Int. J. Disaster Risk Sci. 2022, 13, 52–65. [Google Scholar] [CrossRef]
- Armstrong, C.L.; Cain, J.A.; Hou, J. Ready for disaster: Information seeking, media influence, and disaster preparation for severe weather outbreaks. Atl. J. Commun. 2020, 29, 121–135. [Google Scholar] [CrossRef]
- Andreastuti, S.; Paripurno, E.T.; Gunawan, H.; Budianto, A.; Syahbana, D.; Pallister, J. Character of community response to volcanic crises at Sinabung and Kelud Volcanoes. J. Volcanol. Geotherm. Res. 2019, 382, 298–310. [Google Scholar] [CrossRef]
- Cahigas, M.M.; Prasetyo, Y.T.; Persada, S.F.; Ong, A.K.; Nadlifatin, R. Understanding the perceived behavior of public utility bus passengers during the era of COVID-19 pandemic in the Philippines: Application of social exchange theory and theory of planned behavior. Res. Transp. Bus. Manag. 2022, 2022, 100840. [Google Scholar] [CrossRef]
- Barclay, J.; Few, R.; Armijos, M.T.; Phillips, J.C.; Pyle, D.M.; Hicks, A.; Brown, S.K.; Robertson, R.E. Livelihoods, wellbeing and the risk to life during volcanic eruptions. Front. Earth Sci. 2019, 7, 2296–6463. [Google Scholar] [CrossRef]
- Warsini, S.; Buettner, P.; Mills, J.; West, C.; Usher, K. The psychosocial impact of the environmental damage caused by the Mt Merapi eruption on survivors in Indonesia. EcoHealth 2014, 11, 491–501. [Google Scholar] [CrossRef]
- Hershkovich, O.; Gilad, D.; Zimlichman, E.; Kreiss, Y. Effective medical leadership in times of emergency: A perspective. Disaster Mil. Med. 2016, 2, 4. [Google Scholar] [CrossRef] [PubMed]
- Martinez-Villegas, M.M.; Solidum, R.U.; Saludadez, J.A.; Pidlaoan, A.C.; Lamela, R.C. Moving for safety: A qualitative analysis of affected communities’ evacuation response during the 2014 Mayon Volcano Eruption. J. Appl. Volcanol. 2021, 10, 6. [Google Scholar] [CrossRef]
- Gaillard, J.-C. Alternative paradigms of volcanic risk perception: The case of Mt. Pinatubo in the Philippines. J. Volcanol. Geotherm. Res. 2008, 172, 315–328. [Google Scholar] [CrossRef]
- Baxter, P.J.; Aspinall, W.P.; Neri, A.; Zuccaro, G.; Spence, R.J.S.; Cioni, R.; Woo, G. Emergency planning and mitigation at vesuvius: A new evidence-based approach. J. Volcanol. Geotherm. Res. 2008, 178, 454–473. [Google Scholar] [CrossRef]
- Perry, R.W.; Lindell, M.K. Volcanic risk perception and adjustment in a multi-hazard environment. SSRN Electron. J. 2008, 172, 170–178. [Google Scholar]
- Morganstein, J.C.; Ursano, R.J. Ecological disasters and mental health: Causes, consequences, and interventions. Front. Psychiatry 2020, 11, 1. [Google Scholar] [CrossRef] [PubMed]
- Abella, A.A.; Prasetyo, Y.T.; Young, M.N.; Nadlifatin, R.; Persada, S.F.; Perwira Redi, A.A.; Chuenyindee, T. The effect of positive reinforcement of behavioral-based safety on safety participation in Philippine coal-fired power plant workers: A partial least square structural equation modeling (PLS-SEM) approach. Int. J. Occup. Saf. Ergon. 2022, 1, 1–27. [Google Scholar] [CrossRef] [PubMed]
- Kusumastuti, R.D.; Arviansyah, A.; Nurmala, N.; Wibowo, S.S. Knowledge management and natural disaster preparedness: A systematic literature review and a case study of East Lombok, Indonesia. Int. J. Disaster Risk Reduct. 2021, 58, 102223. [Google Scholar] [CrossRef]
- Hanel, P.H.; Maio, G.R.; Soares, A.K.; Vione, K.C.; de Holanda Coelho, G.L.; Gouveia, V.V.; Patil, A.C.; Kamble, S.V.; Manstead, A.S. Cross-cultural differences and similarities in human value instantiation. Front. Psychol. 2018, 9, 849. [Google Scholar] [CrossRef] [PubMed] [Green Version]


| Variable | Item | Mean | StD | Cronbach’s Alpha |
|---|---|---|---|---|
| Media | MP1 | 4.303 | 0.833 | 0.803 |
| MP2 | 4.383 | 0.799 | ||
| MP3 | 4.663 | 0.614 | ||
| MP4 | 4.381 | 0.761 | ||
| Hazard Knowledge | HK1 | 3.512 | 1.153 | 0.737 |
| HK2 | 4.809 | 0.485 | ||
| HK3 | 4.778 | 0.527 | ||
| HK4 | 4.643 | 0.698 | ||
| HK5 | 4.682 | 0.650 | ||
| Perceived Risk Proximity | GP1 | 2.380 | 1.260 | 0.773 |
| GP2 | 2.753 | 1.290 | ||
| GP3 | 3.599 | 1.142 | ||
| Perceived Severity | PS1 | 4.052 | 0.840 | 0.829 |
| PS2 | 4.443 | 0.725 | ||
| PS3 | 3.490 | 0.993 | ||
| PS4 | 3.452 | 1.256 | ||
| PS5 | 3.299 | 1.256 | ||
| Perceived Vulnerability | PV1 | 3.054 | 1.200 | 0.851 |
| PV2 | 2.925 | 1.214 | ||
| PV3 | 2.510 | 1.262 | ||
| PV4 | 4.084 | 1.100 | ||
| Perceived Behavioral Control | PBC1 | 3.512 | 1.005 | 0.758 |
| PBC2 | 3.564 | 0.944 | ||
| PBC3 | 3.675 | 1.001 | ||
| PBC4 | 3.561 | 0.974 | ||
| Social Norm | SN1 | 3.216 | 1.010 | 0.837 |
| SN2 | 3.006 | 1.104 | ||
| SN3 | 2.852 | 1.091 | ||
| SN4 | 3.153 | 1.066 | ||
| SN5 | 3.544 | 1.030 | ||
| Attitude Toward the Behavior | ATB1 | 3.392 | 1.107 | 0.796 |
| ATB2 | 4.138 | 0.965 | ||
| ATB3 | 4.092 | 0.993 | ||
| ATB4 | 4.283 | 0.820 | ||
| ATB5 | 3.276 | 1.047 | ||
| Intention | IF1 | 4.496 | 0.702 | 0.844 |
| IF2 | 4.193 | 0.925 | ||
| IF3 | 4.133 | 0.933 | ||
| IF4 | 4.158 | 0.961 | ||
| Perceived Preparedness | PP1 | 3.674 | 0.975 | 0.822 |
| PP2 | 4.126 | 0.804 | ||
| PP3 | 4.331 | 0.746 | ||
| PP4 | 4.406 | 0.783 | ||
| PP5 | 4.554 | 0.687 |
| Category | 60:40 | 70:30 | 80:20 | 90:10 |
|---|---|---|---|---|
| Random | ||||
| Gini | 88.00 | 88.60 | 90.00 | 88.60 |
| Std. Dev | 0.000 | 3.848 | 0.000 | 0.548 |
| Entropy | 90.20 | 91.00 | 86.60 | 81.60 |
| Std. Dev | 1.096 | 0.000 | 2.510 | 1.140 |
| Best | ||||
| Gini | 92.00 | 90.20 | 93.00 | 92.80 |
| Std. Dev | 0.000 | 0.837 | 0.000 | 2.280 |
| Entropy | 89.60 | 88.20 | 92.00 | 89.80 |
| Std. Dev | 0.894 | 3.114 | 0.000 | 1.483 |
| Latent | Average Training | Standard Deviation | Average Testing | Standard Deviation |
|---|---|---|---|---|
| Media | 96.11 | 3.137 | 97.89 | 0.837 |
| Perceived Severity | 91.30 | 3.224 | 97.33 | 1.782 |
| Perceived Vulnerability | 84.30 | 2.515 | 97.17 | 1.286 |
| Intention | 81.93 | 0.377 | 96.95 | 1.839 |
| Perceived Risk Proximity | 88.93 | 1.400 | 95.65 | 2.133 |
| Subjective Norm | 86.79 | 0.979 | 95.34 | 2.173 |
| Hazard Knowledge | 86.49 | 3.130 | 87.10 | 6.200 |
| Perceived Behavioral Control | 67.86 | 6.015 | 83.44 | 5.752 |
| Attitude | 66.04 | 2.342 | 79.92 | 4.580 |
| Latent | Importance | Score (%) |
|---|---|---|
| M | 0.202 | 100 |
| PS | 0.199 | 98.6 |
| PV | 0.199 | 98.5 |
| IN | 0.196 | 97.2 |
| PR | 0.196 | 96.8 |
| SN | 0.190 | 94.3 |
| HK | 0.181 | 89.8 |
| PBC | 0.168 | 83.2 |
| AT | 0.161 | 79.9 |
Publisher’s Note: MDPI stays neutral with regard to jurisdictional claims in published maps and institutional affiliations. |
© 2022 by the authors. Licensee MDPI, Basel, Switzerland. This article is an open access article distributed under the terms and conditions of the Creative Commons Attribution (CC BY) license (https://creativecommons.org/licenses/by/4.0/).
Share and Cite
German, J.D.; Redi, A.A.N.P.; Ong, A.K.S.; Prasetyo, Y.T.; Sumera, V.L.M. Predicting Factors Affecting Preparedness of Volcanic Eruption for a Sustainable Community: A Case Study in the Philippines. Sustainability 2022, 14, 11329. https://doi.org/10.3390/su141811329
German JD, Redi AANP, Ong AKS, Prasetyo YT, Sumera VLM. Predicting Factors Affecting Preparedness of Volcanic Eruption for a Sustainable Community: A Case Study in the Philippines. Sustainability. 2022; 14(18):11329. https://doi.org/10.3390/su141811329
Chicago/Turabian StyleGerman, Josephine D., Anak Agung Ngurah Perwira Redi, Ardvin Kester S. Ong, Yogi Tri Prasetyo, and Vince Louis M. Sumera. 2022. "Predicting Factors Affecting Preparedness of Volcanic Eruption for a Sustainable Community: A Case Study in the Philippines" Sustainability 14, no. 18: 11329. https://doi.org/10.3390/su141811329
APA StyleGerman, J. D., Redi, A. A. N. P., Ong, A. K. S., Prasetyo, Y. T., & Sumera, V. L. M. (2022). Predicting Factors Affecting Preparedness of Volcanic Eruption for a Sustainable Community: A Case Study in the Philippines. Sustainability, 14(18), 11329. https://doi.org/10.3390/su141811329