
The Demarcation of Urban Development Boundary Based on the Maxent-CA Model: A Case Study of Wuxi in China

Abstract
:1. Introduction
2. Materials and Methods
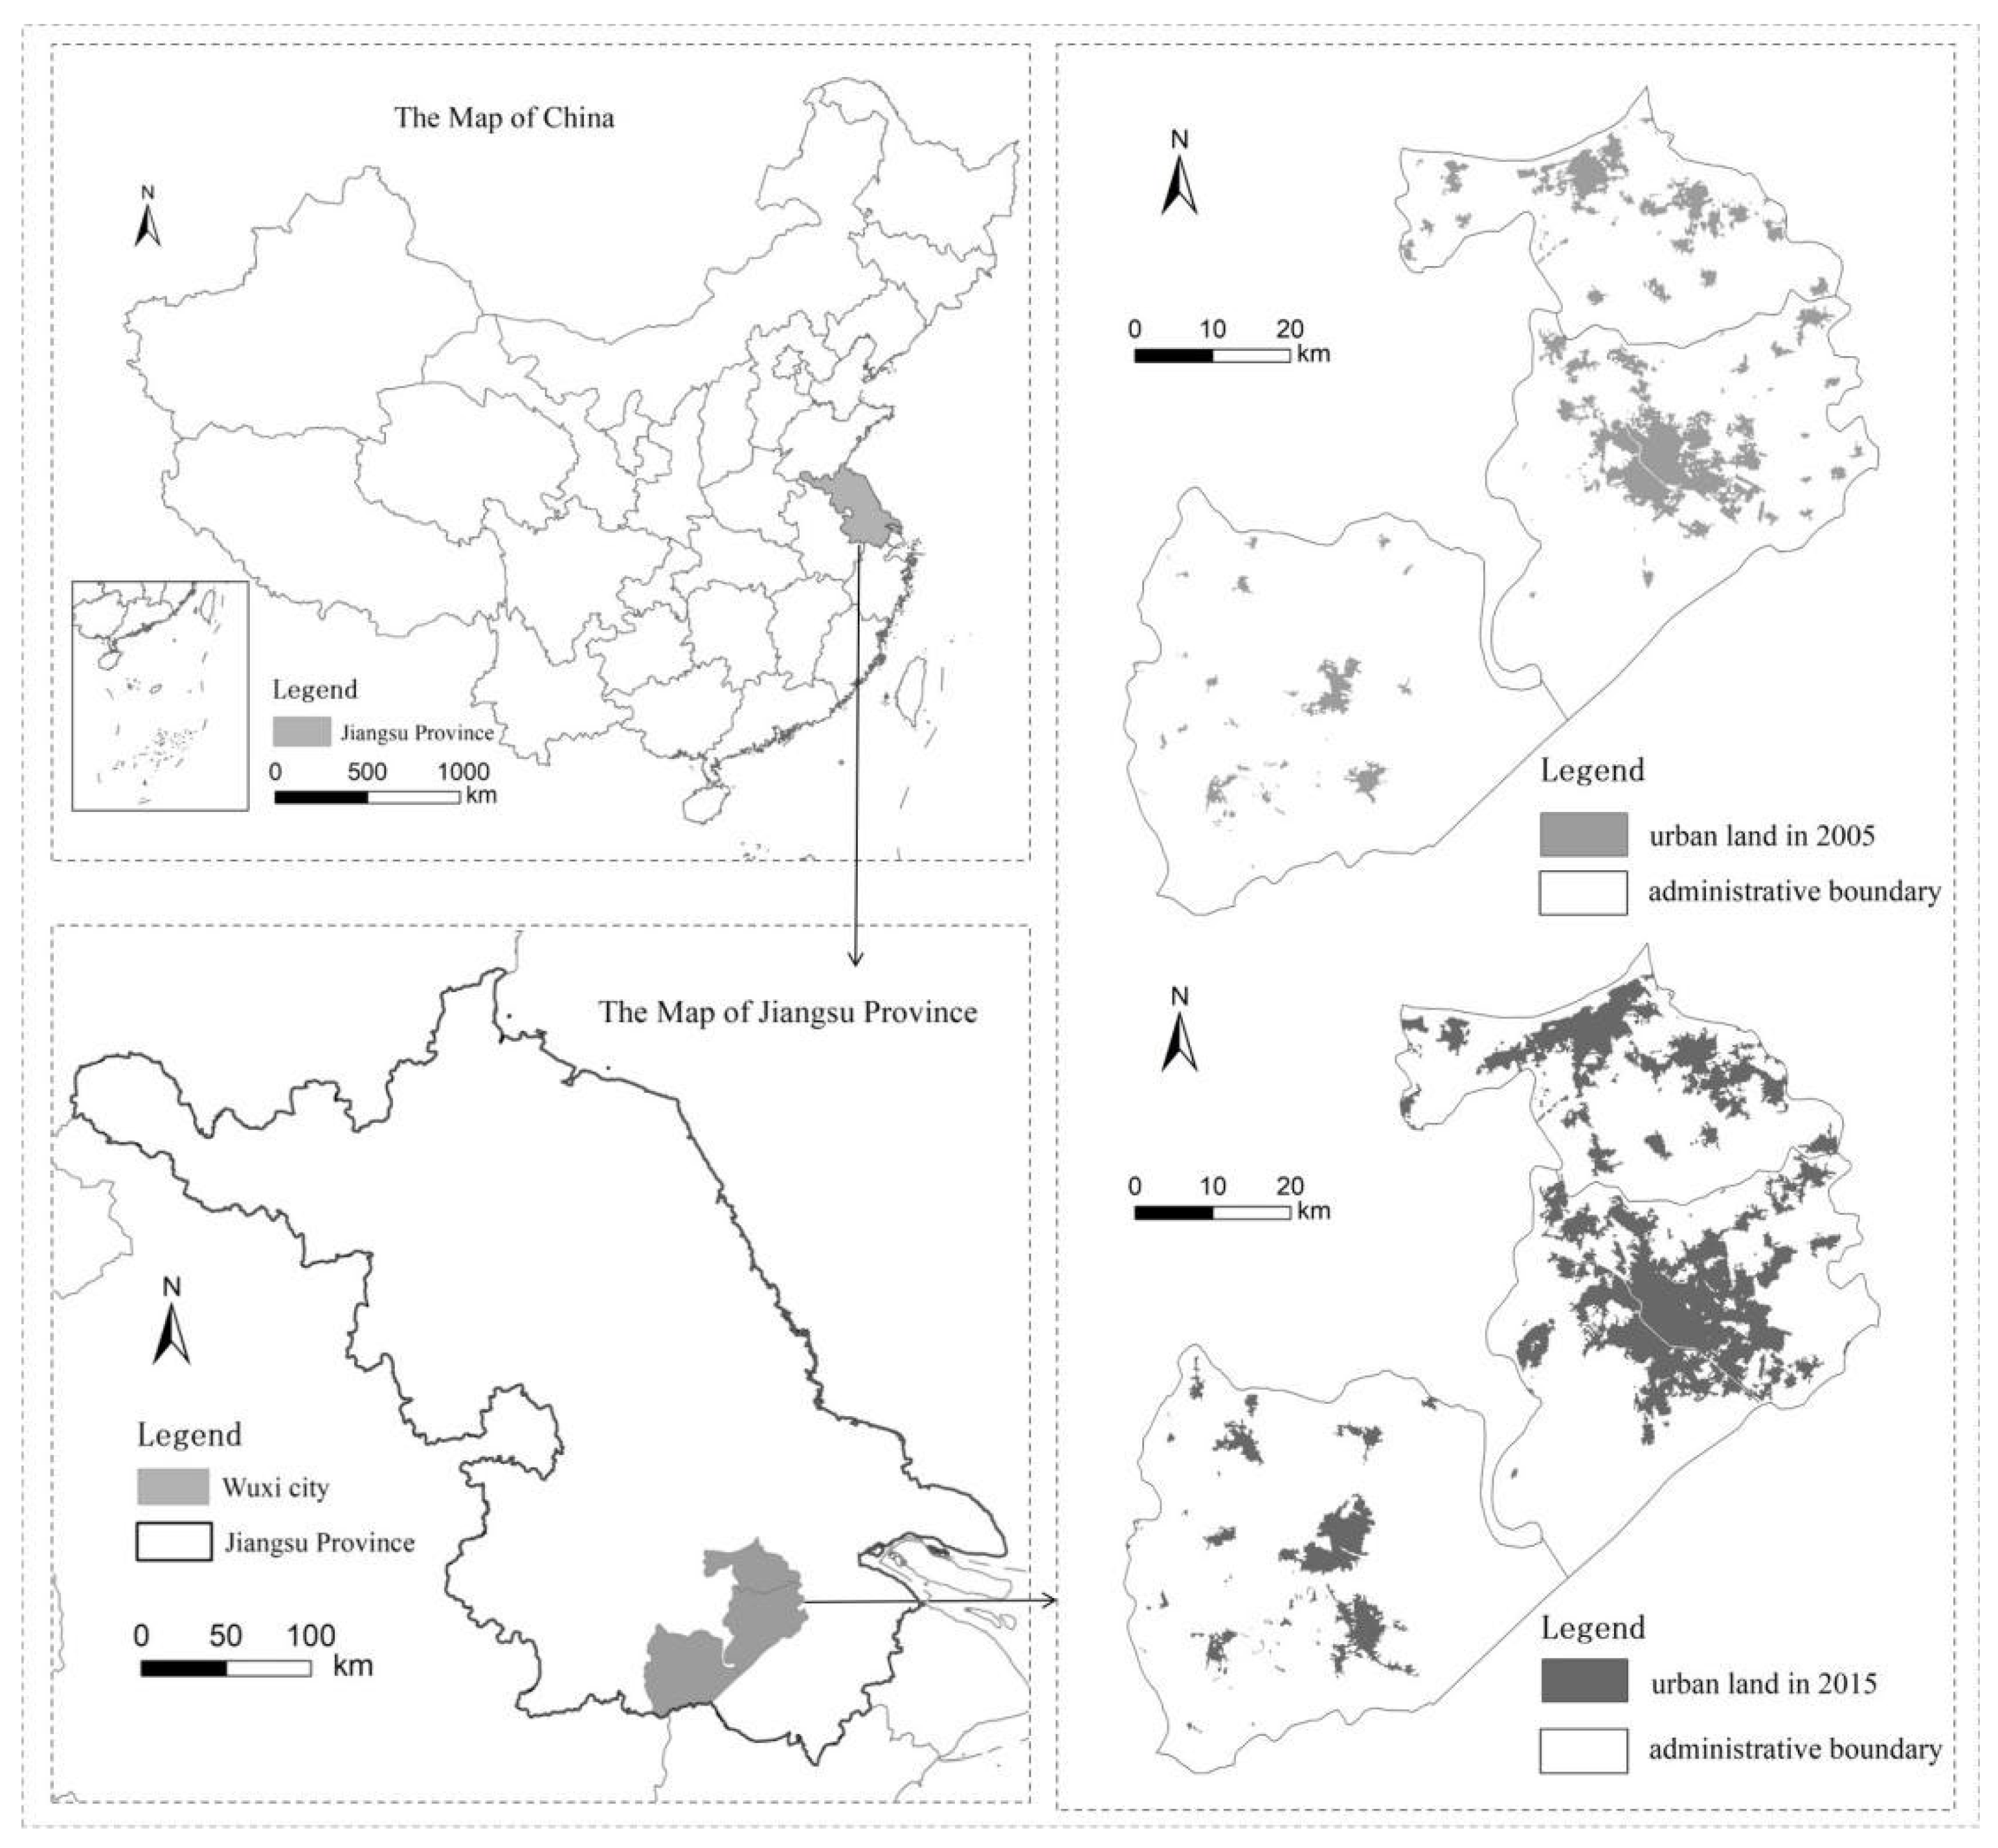
2.1. Study Area
2.2. Data
- (1)
- Land use data
- (2)
- Resource and environmental data
- (3)
- POI and network data
- (4)
- Socioeconomic data
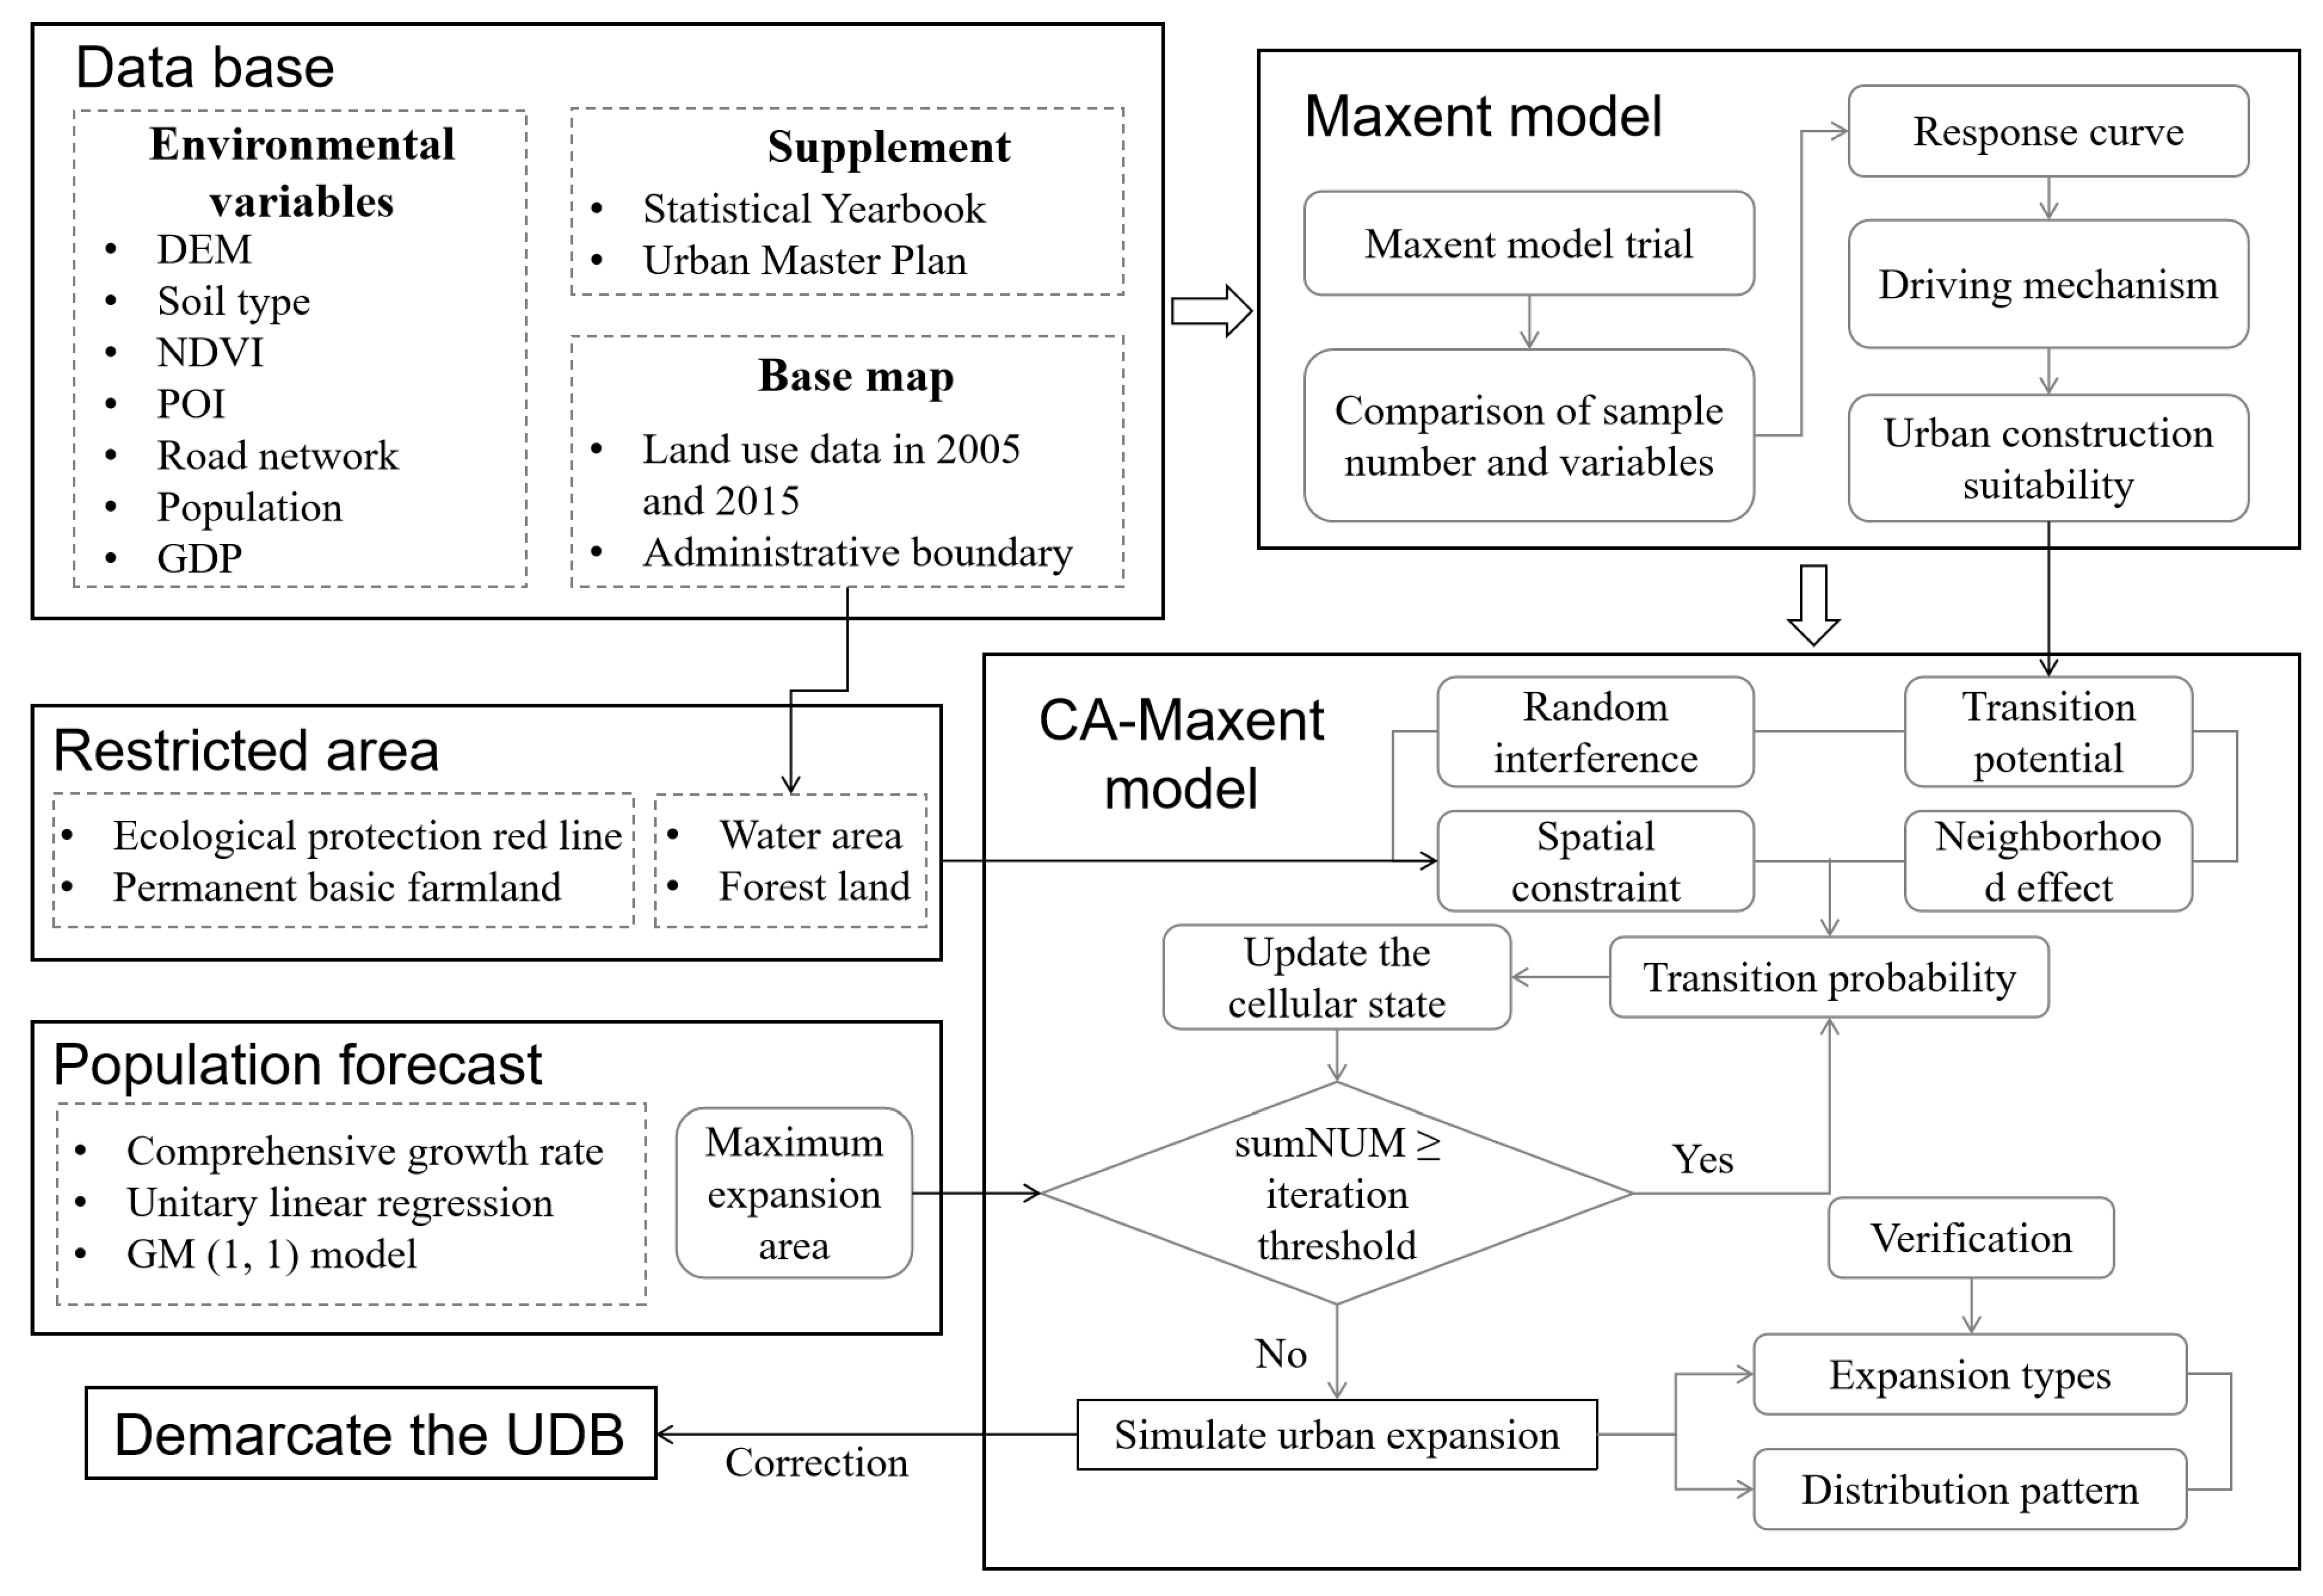
2.3. Method
2.3.1. Index System
2.3.2. Suitability Evaluation of Urban Construction Based on the Maxent Model
2.3.3. Simulation of Urban Expansion Based on the CA Model
Permanent Resident Population Forecast
CA Model
2.3.4. Identification of Three Urban Expansion Types
3. Results
3.1. Analysis of the Maxent Model
3.1.1. Influence of the Sample Size on the Model Accuracy
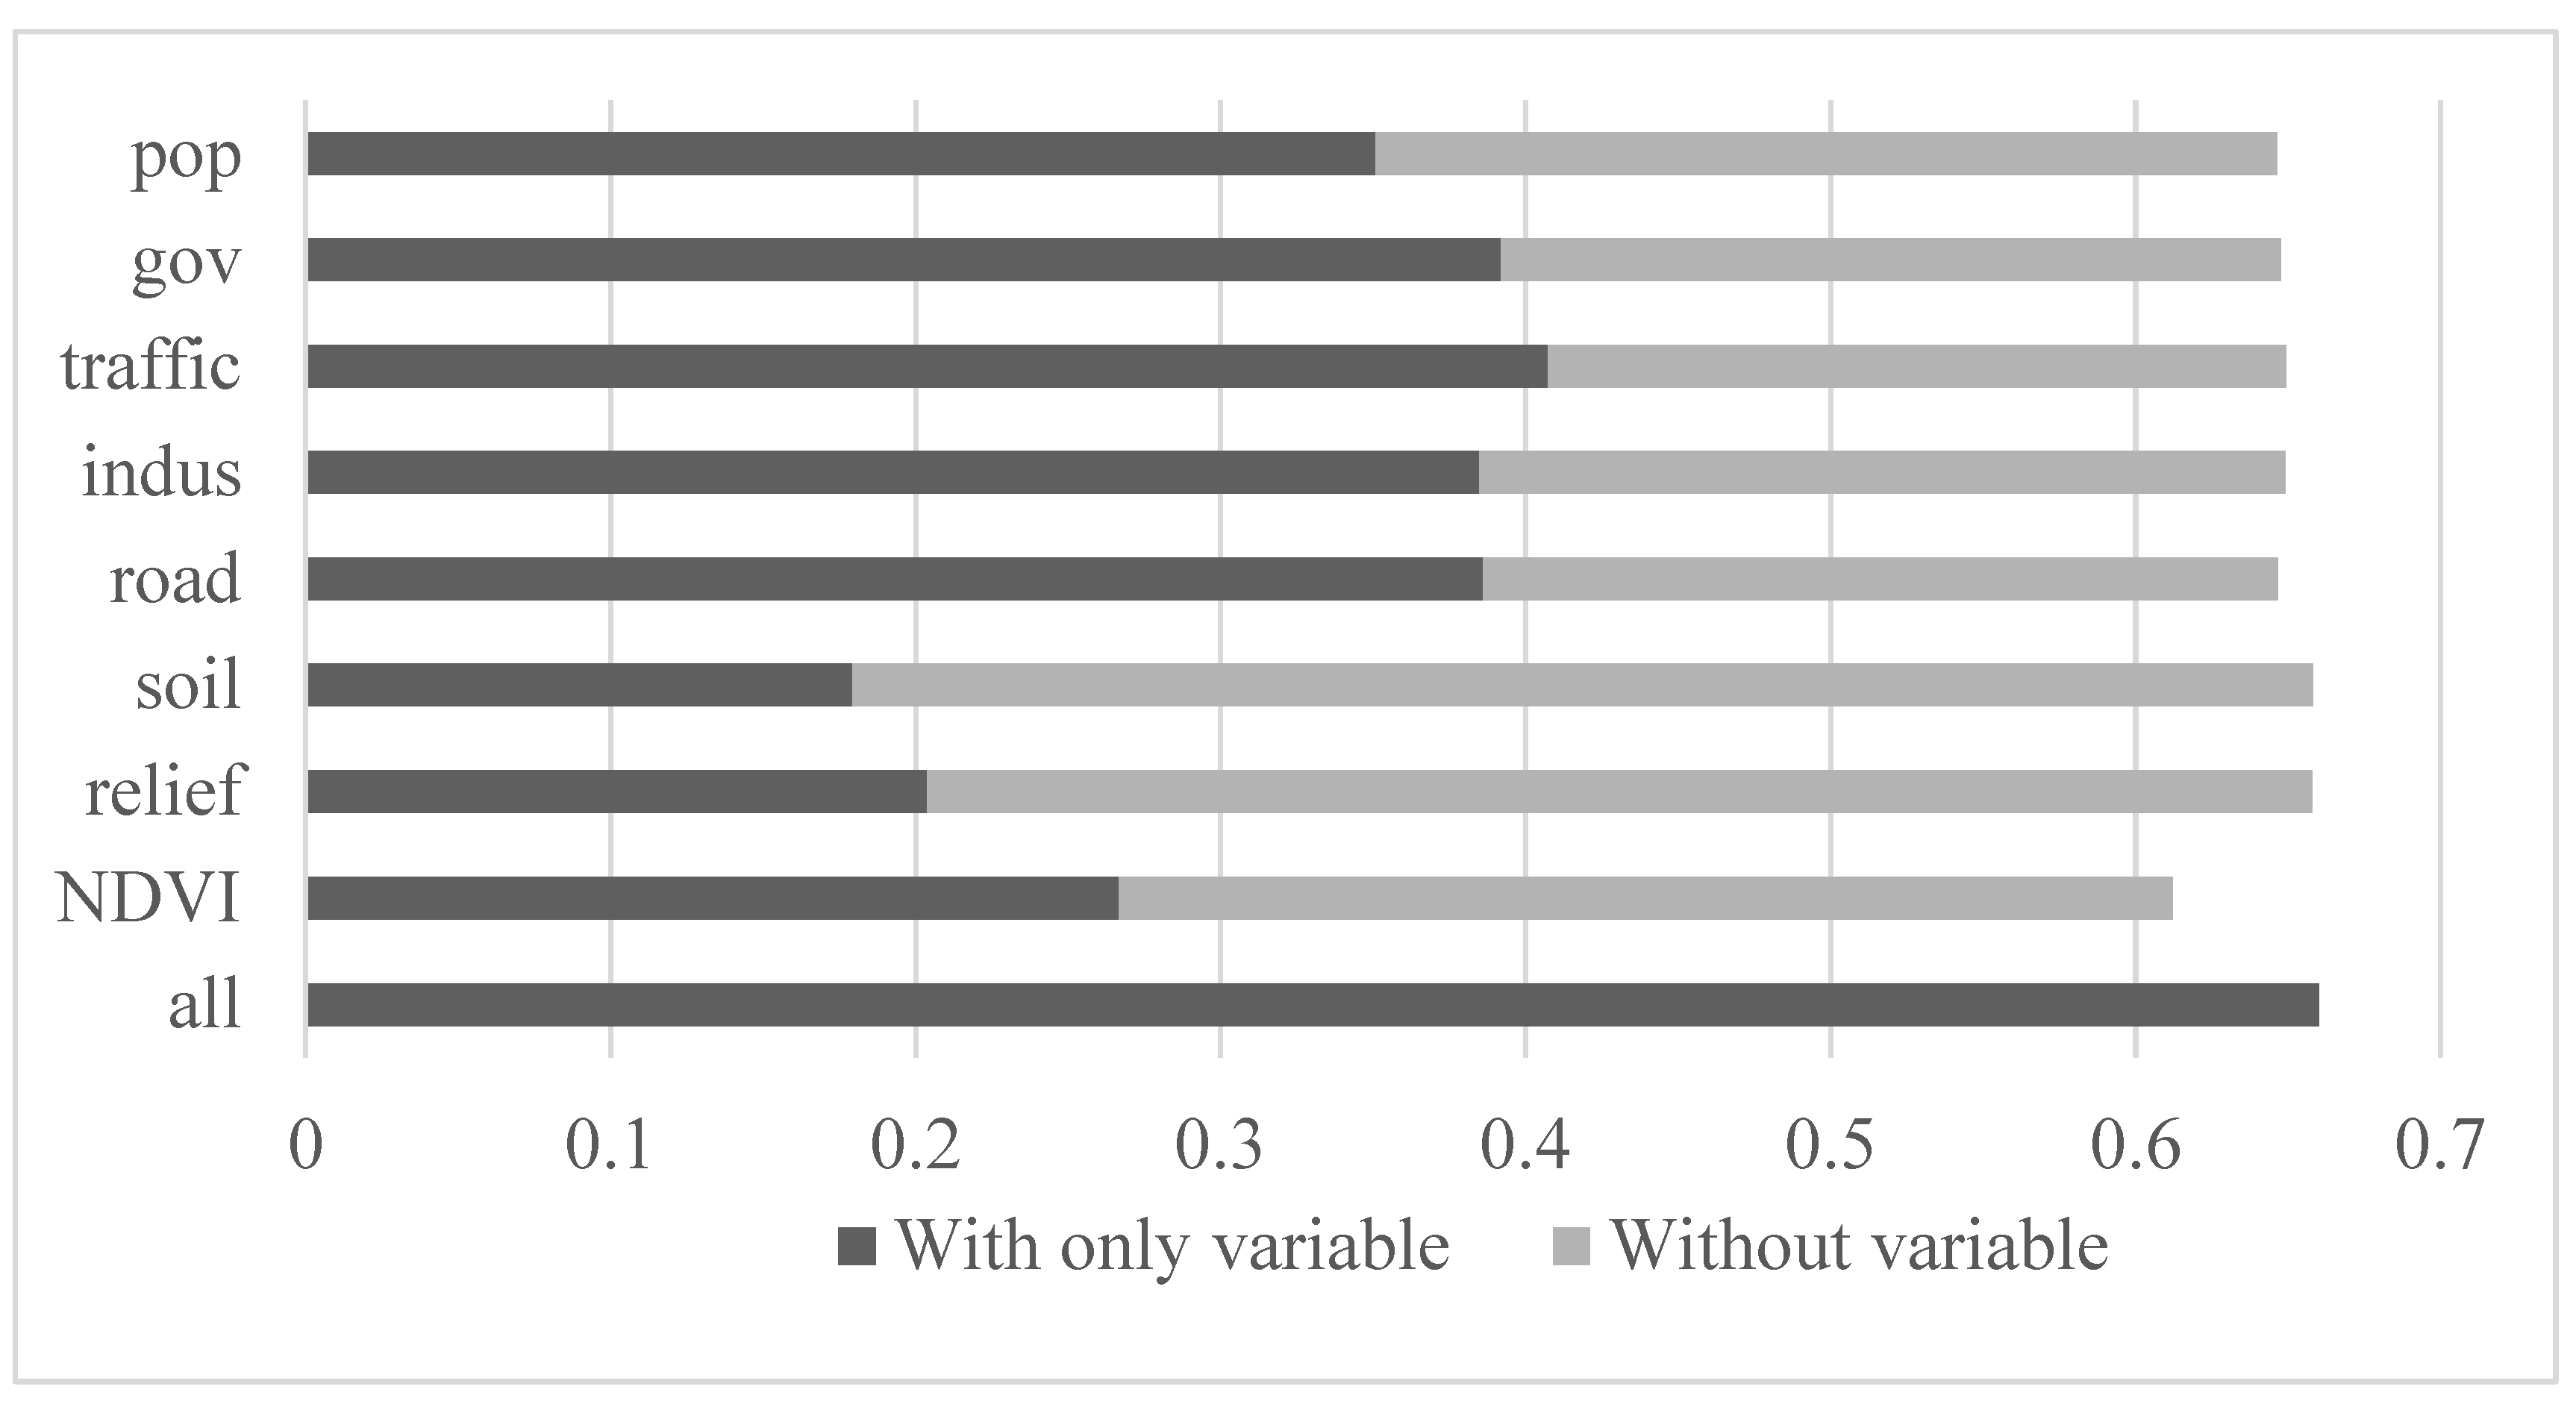
3.1.2. The Contribution and Importance of Variables
3.1.3. The Relationship between the Probability Distribution of Urban Land and Variables
3.1.4. Maximum Entropy Distribution of Urban Land Based on the Maxent Model
3.2. Analysis of the Maxent-CA Model
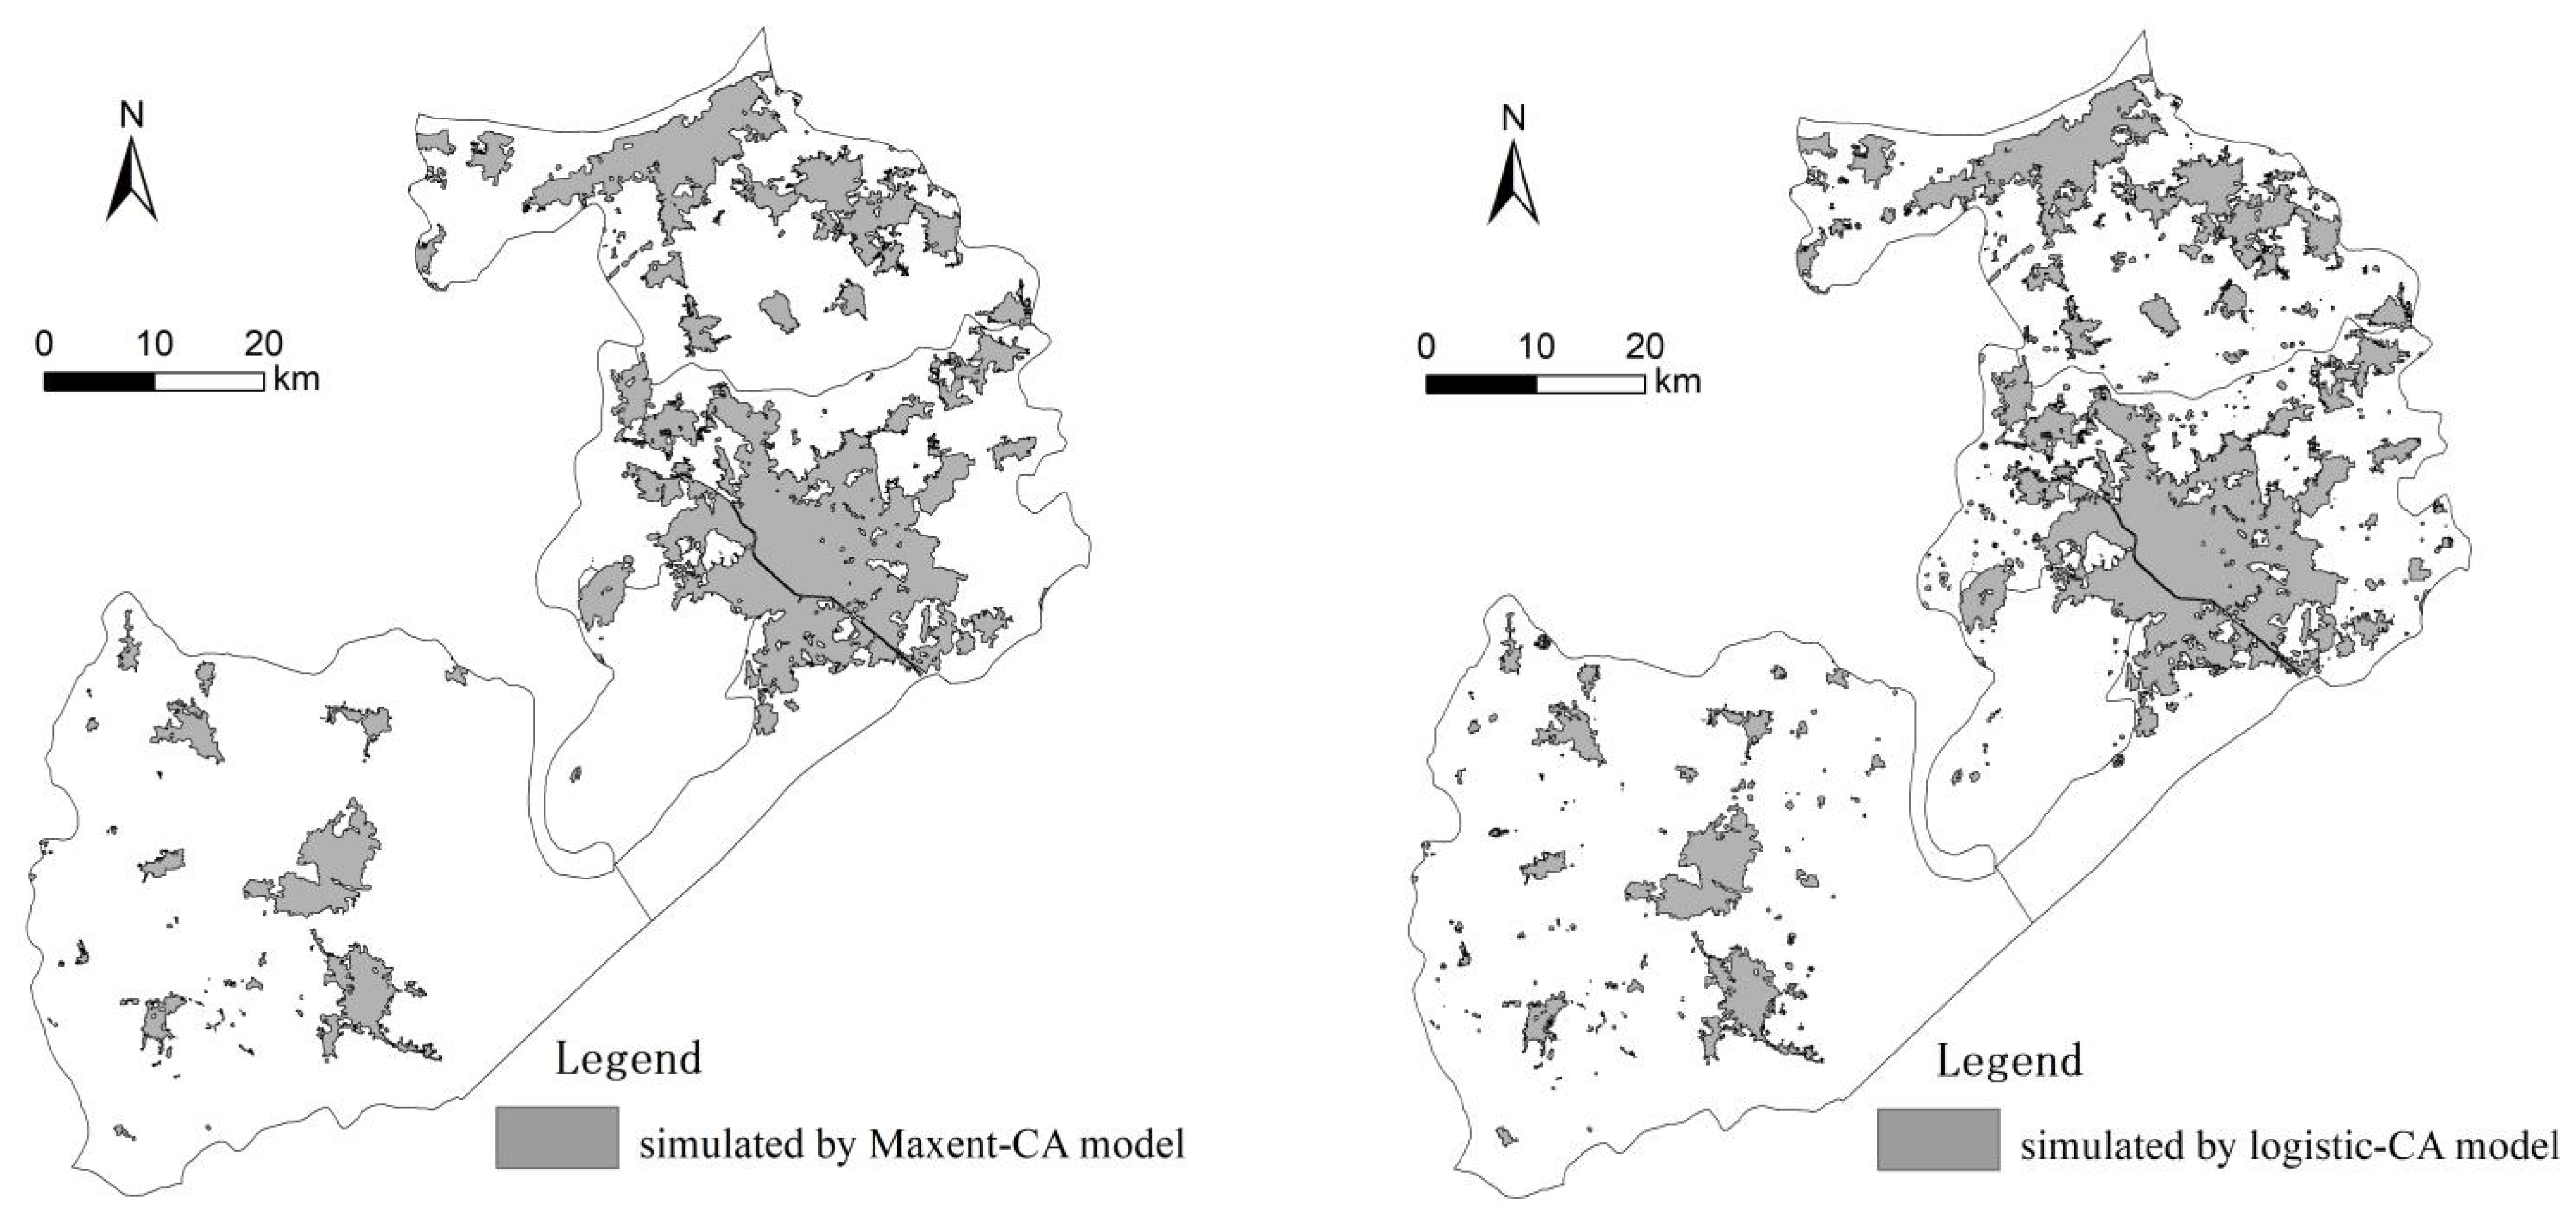
3.2.1. The Simulation of Urban Expansion Based on the Maxent-CA Model
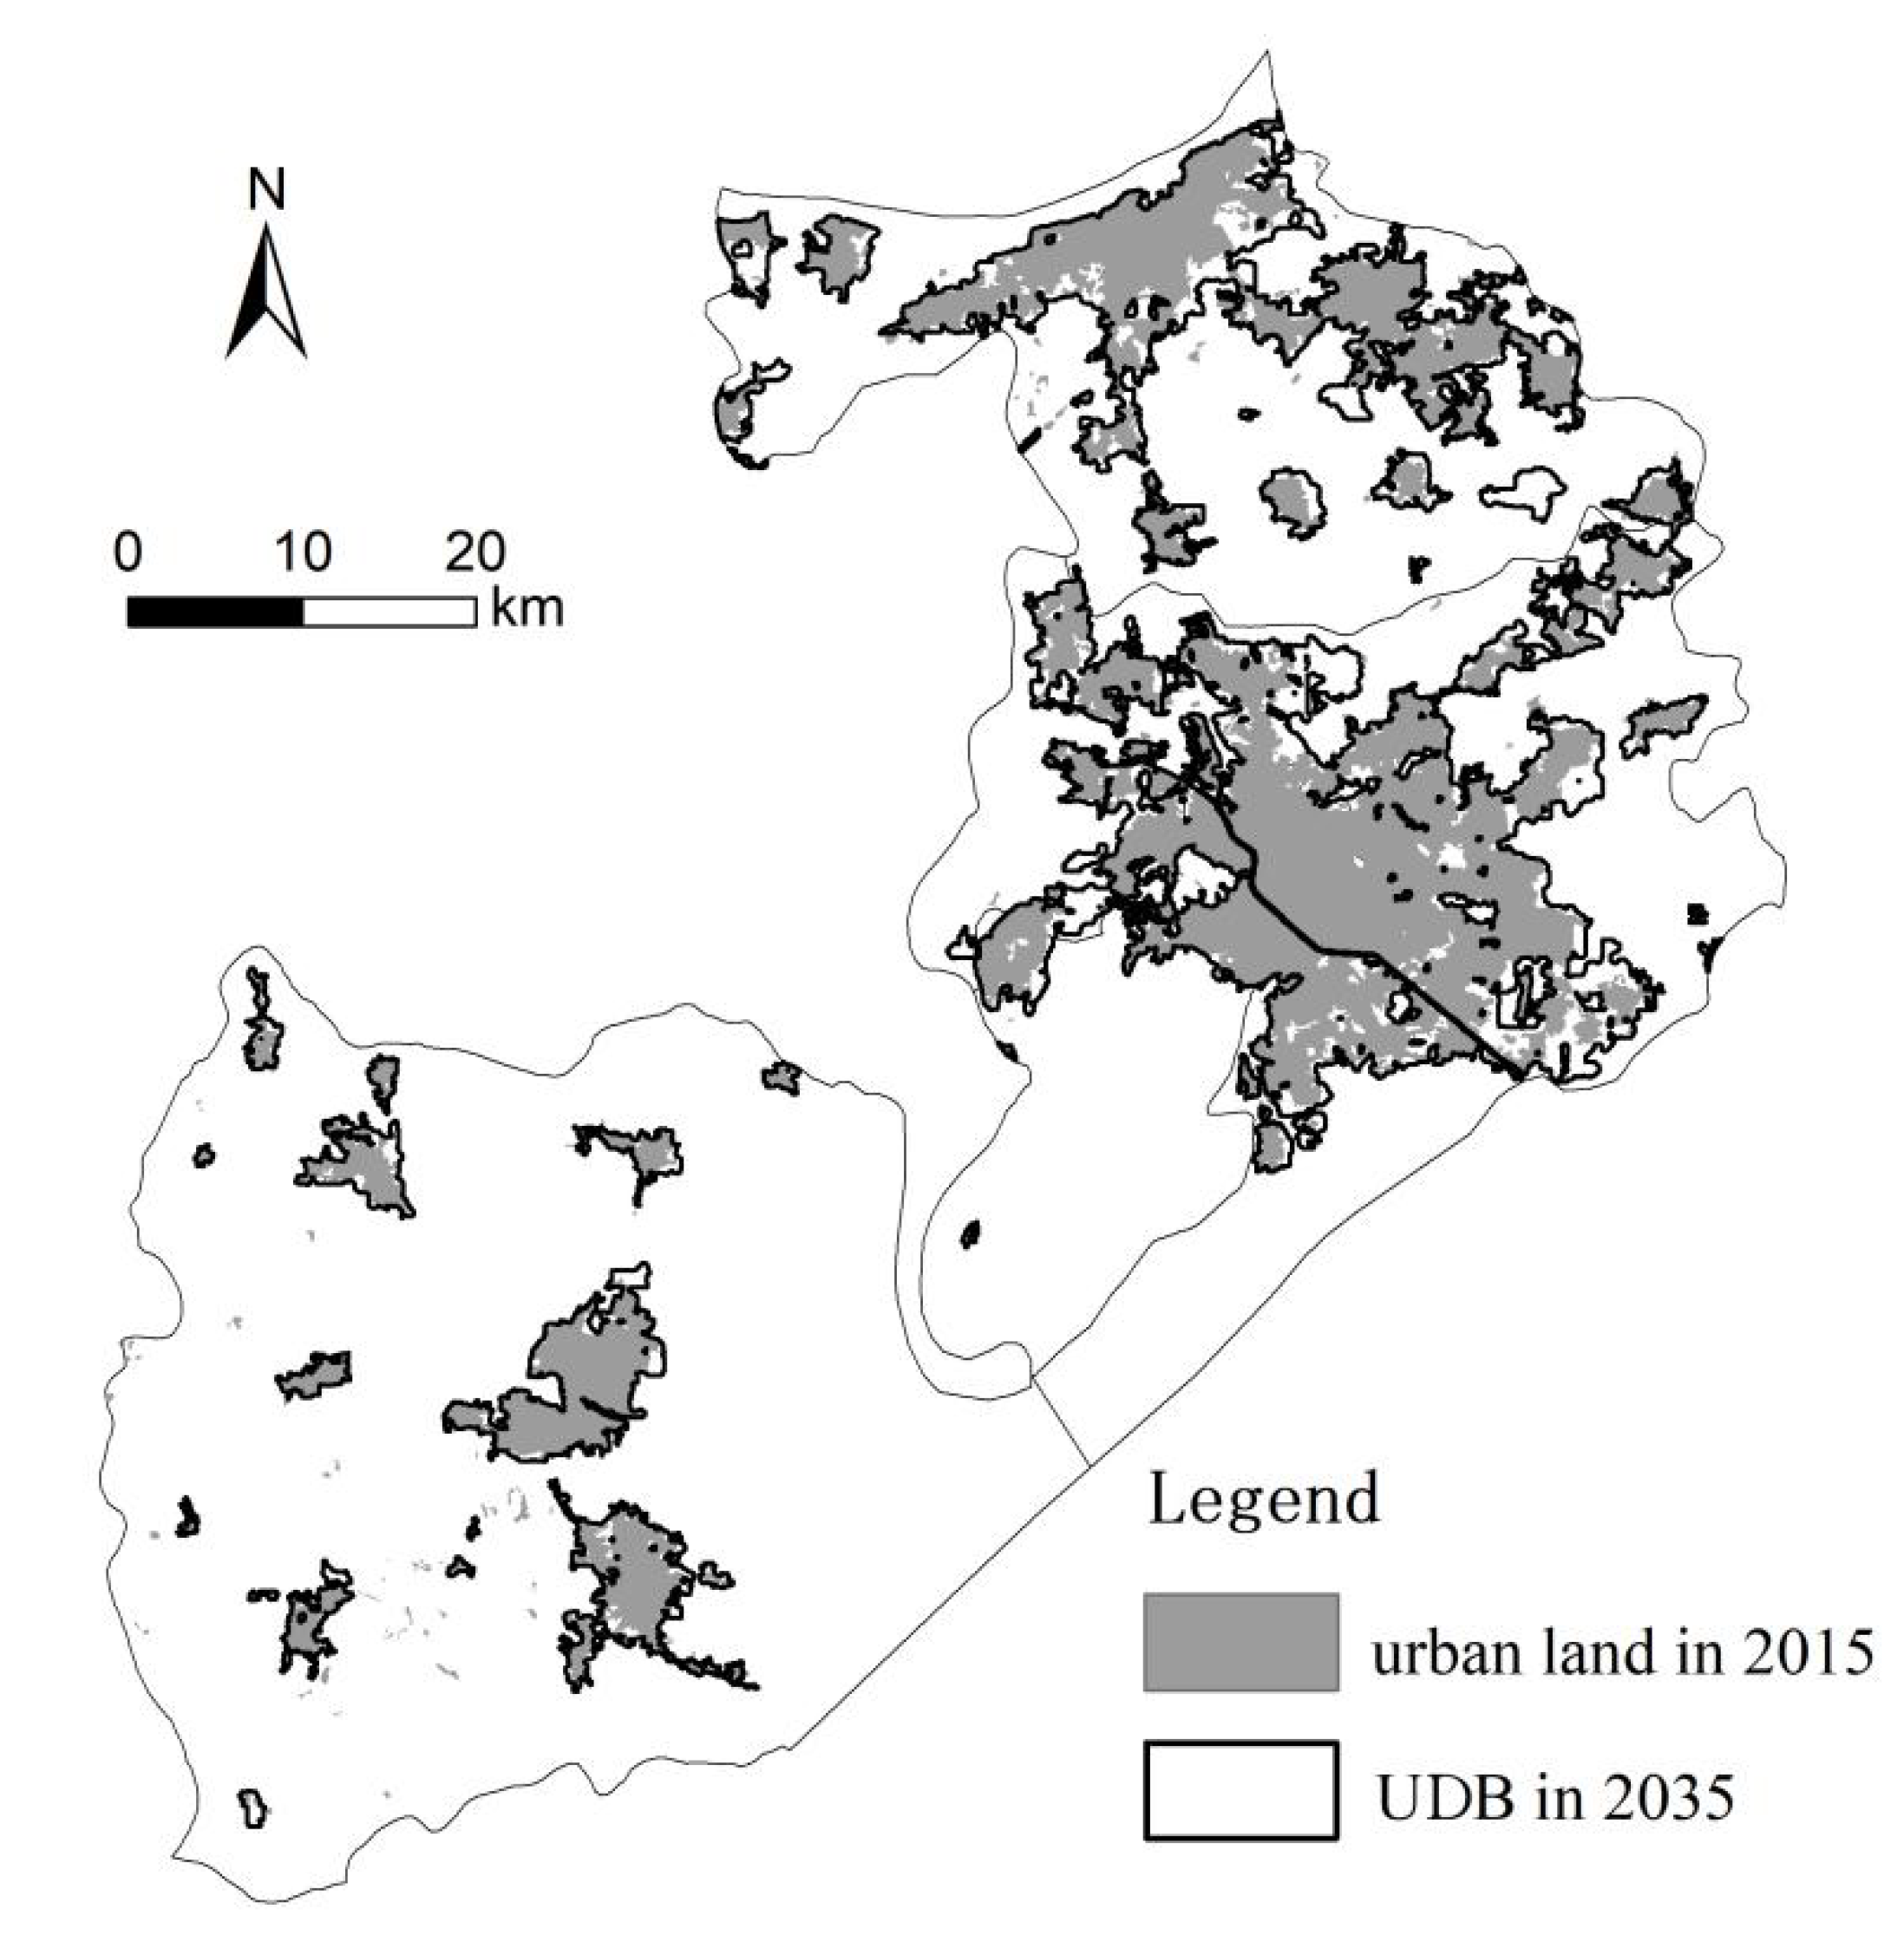
3.2.2. The Demarcation of the UDB
4. Discussion and Conclusions
4.1. Discussion
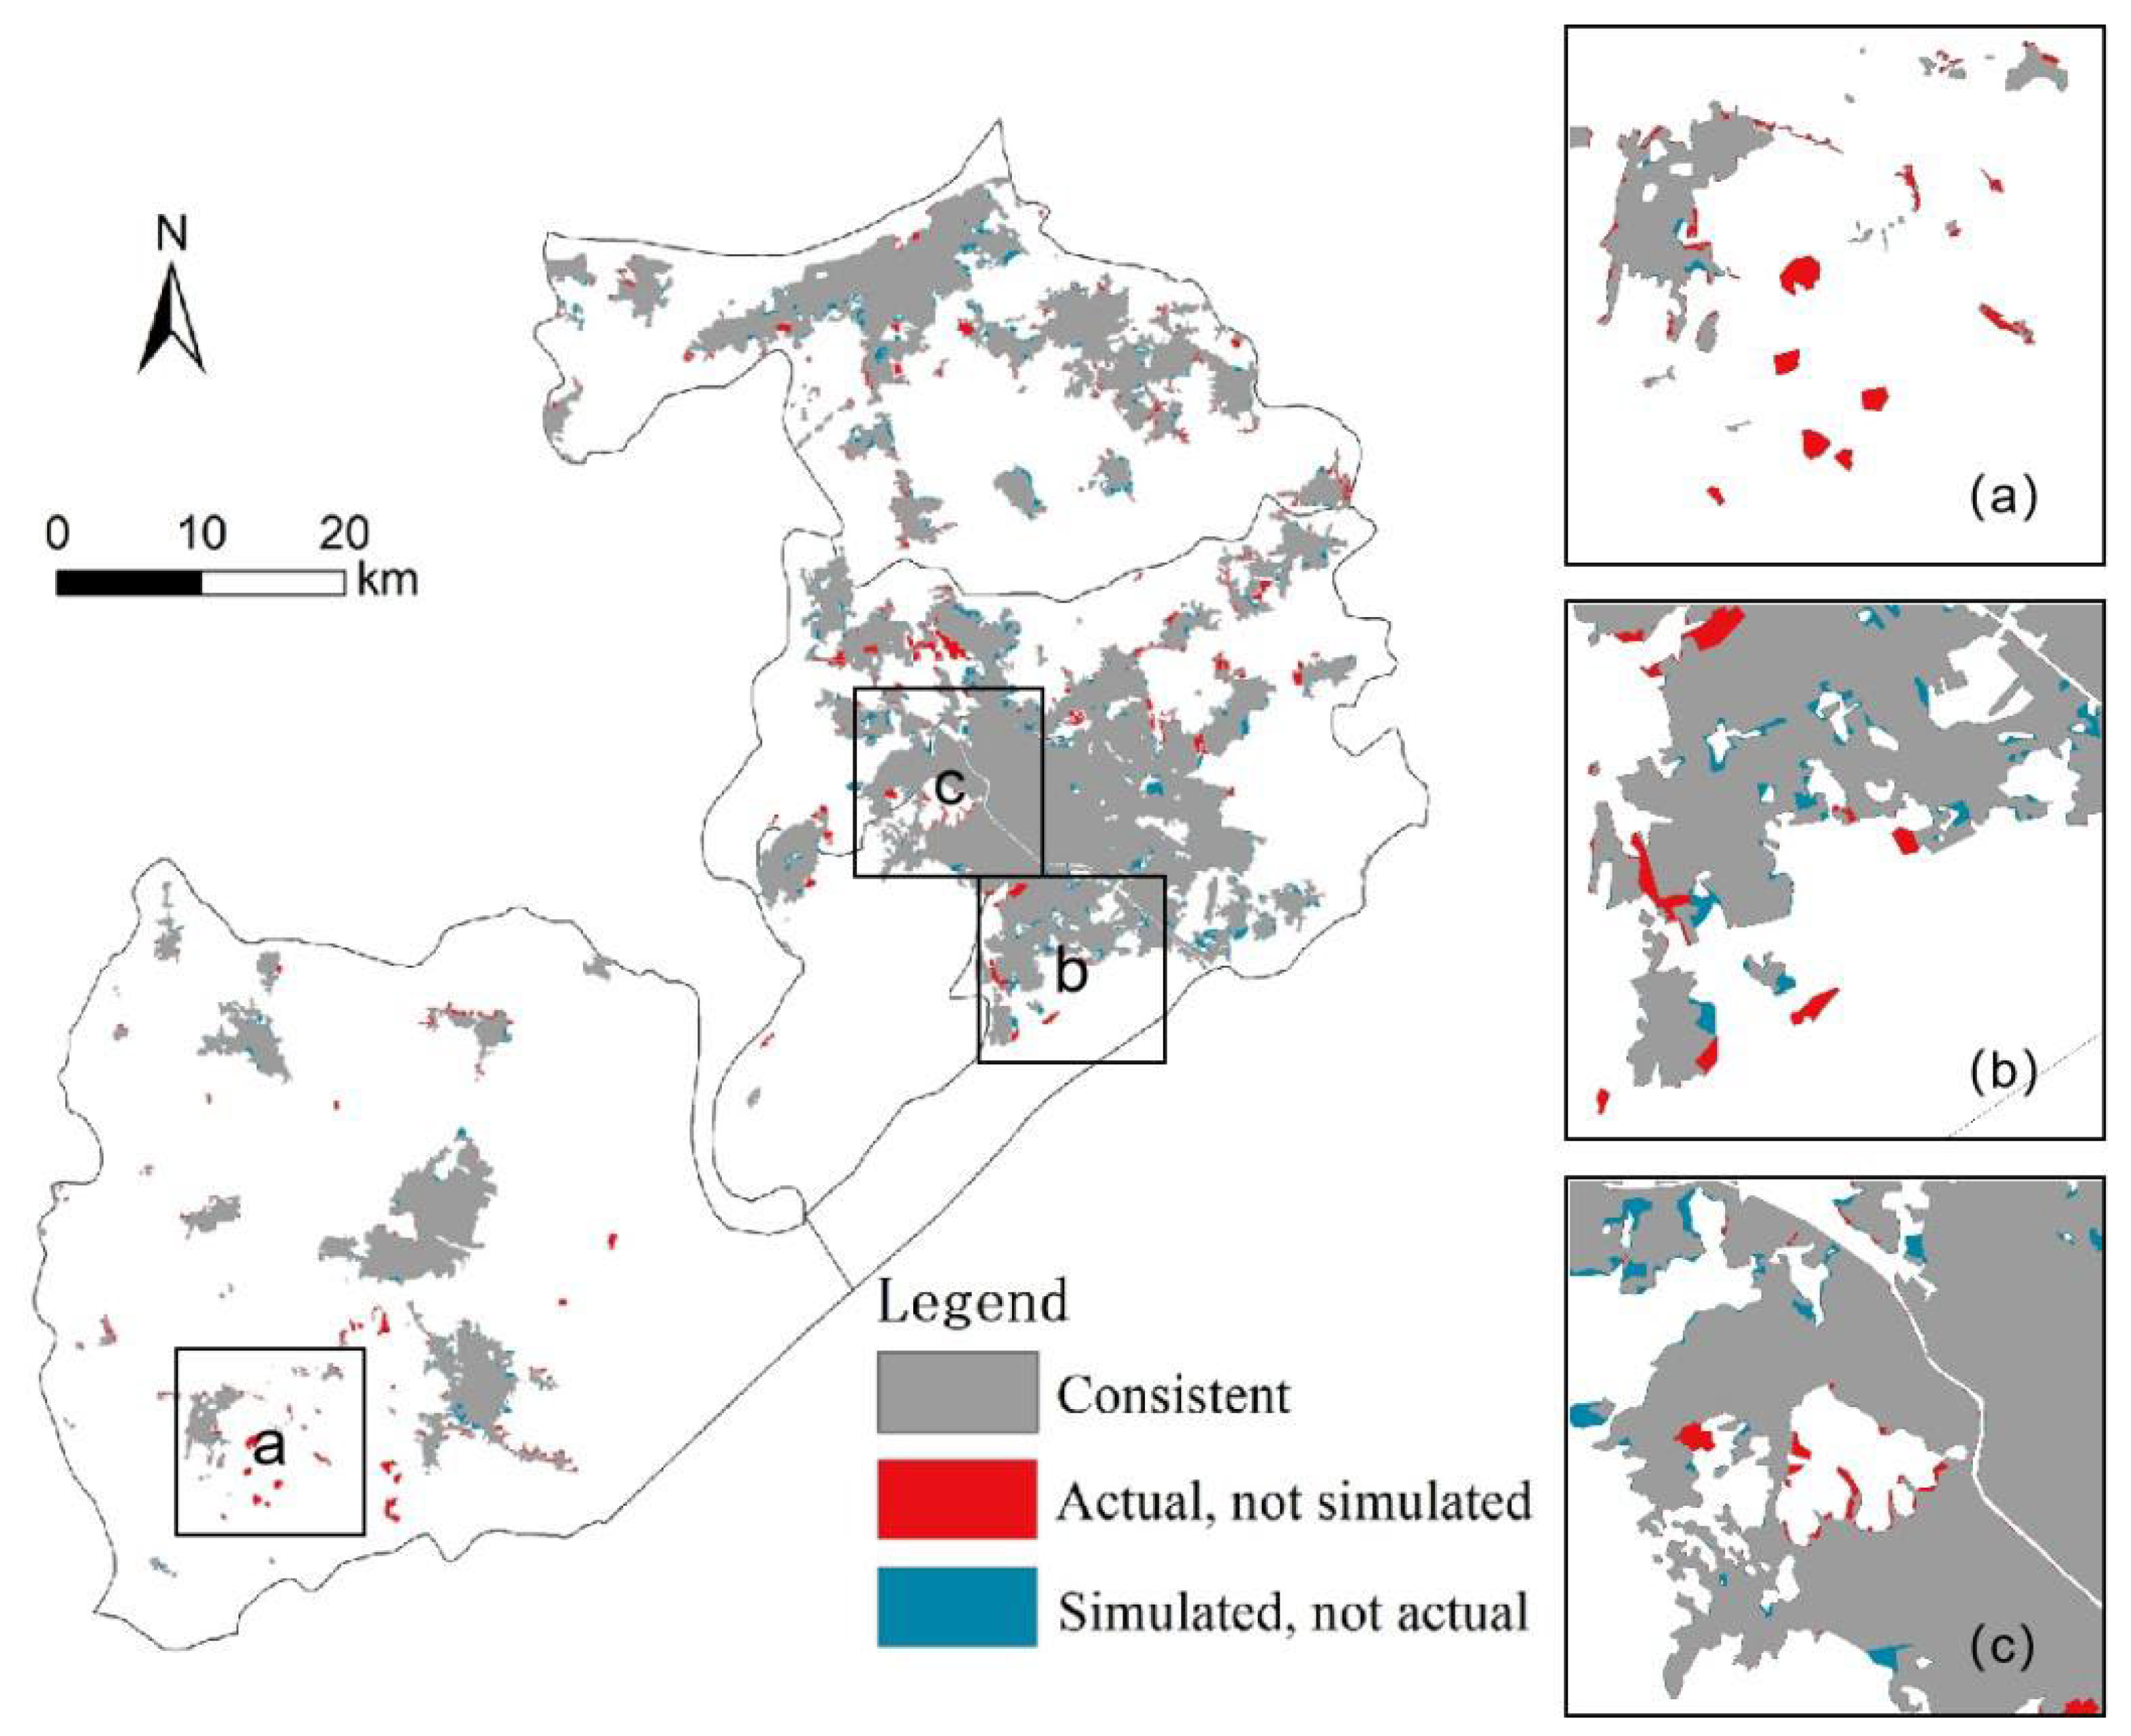
4.1.1. The Accuracy of the Maxent-CA Model
4.1.2. Further Analysis
4.2. Conclusions
- (1)
- The Maxent-CA model proposed in this paper can be applied to demarcate the UDB of specific cities. This study comprehensively considered the relationship between the urban construction suitability, neighborhood effect, spatial constraint, and random interference of urban expansion and fully embodied the principle of combining top-down and bottom-up UDB demarcation approaches in the land use master plan.
- (2)
- The Maxent-CA model can intuitively reflect the driving mechanism of urban expansion. From the perspective of the importance of a single variable, NDVI and gov were found to have higher influences. However, road and indus were shown to contribute more to the model influenced by the interactions between variables. Moreover, the response relationship between urban expansion and environmental variables is complex and non-linear.
- (3)
- The expansion of new urban land is dominated by the infilling expansion type, followed by edge expansion, with outlying expansion being the least common. The accuracy of the model was shown to decrease when simulating outlying expansion and in situations where the key ecological restricted areas were not adequately protected. Future study needs to consider the influence of political decisions and human activities on urban expansion more comprehensively. The relevant departments should pay attention to the phenomenon of urban land occupation and coordinate the scale of urban and rural land.
Author Contributions
Funding
Conflicts of Interest
References
- Bai, X.; Shi, P.; Liu, Y. Society: Realizing China’s urban dream. Nature 2014, 509, 158–160. [Google Scholar] [CrossRef] [PubMed]
- Kuang, W. 70 years of urban expansion across China: Trajectory, pattern, and national policies. Sci. Bull. 2020, 65, 1970–1974. [Google Scholar] [CrossRef]
- Guo, B.; Bian, Y.; Pei, L.; Zhu, X.; Zhang, D.; Zhang, W.; Guo, X.; Chen, Q. Identifying Population Hollowing Out Regions and Their Dynamic Characteristics across Central China. Sustainability 2022, 14, 9815. [Google Scholar] [CrossRef]
- Lyu, X.; Peng, W.; Niu, S.; Qu, Y.; Xin, Z. Evaluation of sustainable intensification of cultivated land use according to farming households’ livelihood types. Ecol. Indic. 2022, 138, 108848. [Google Scholar] [CrossRef]
- Liu, Y.; Li, J.; Yang, Y. Strategic adjustment of land use policy under the economic transformation. Land Use Policy 2018, 74, 5–14. [Google Scholar] [CrossRef]
- Long, H.; Liu, Y.; Hou, X.; Li, T.; Li, Y. Effects of land use transitions due to rapid urbanization on ecosystem services: Implications for urban planning in the new developing area of China. Habitat Int. 2014, 44, 536–544. [Google Scholar] [CrossRef]
- Lyu, X.; Peng, W.; Yu, W.; Xin, Z.; Niu, S.; Qu, Y. Sustainable intensification to coordinate agricultural efficiency and environmental protection: A systematic review based on metrological visualization. J. Land Use Sci. 2021, 16, 313–338. [Google Scholar] [CrossRef]
- Niu, S.; Lyu, X.; Gu, G. A New Framework of Green Transition of Cultivated Land-Use for the Coordination among the Water-Land-Food-Carbon Nexus in China. Land 2022, 11, 933. [Google Scholar] [CrossRef]
- Liu, Y.; Zhou, Y. Territory spatial planning and national governance system in China. Land Use Policy 2021, 102, 105288. [Google Scholar] [CrossRef]
- Lu, X.; Qu, Y.; Sun, P.; Yu, W.; Peng, W. Green Transition of Cultivated Land Use in the Yellow River Basin: A Perspective of Green Utilization Efficiency Evaluation. Land 2020, 9, 475. [Google Scholar] [CrossRef]
- Xie, X.; Kang, H.; Behnisch, M.; Baildon, M.; Krüger, T. To What Extent Can the Green Belts Prevent Urban Sprawl?—A Comparative Study of Frankfurt am Main, London and Seoul. Sustainability 2020, 12, 679. [Google Scholar] [CrossRef]
- Ball, M.; Cigdem, M.; Taylor, E.; Wood, G. Urban growth boundaries and their impact on land prices. Environ. Plan. A 2014, 46, 3010–3026. [Google Scholar] [CrossRef]
- Wang, Y.; Gu, C.; Li, X. Research progress of urban growth boundary at home and abroad. Urban Plan. Int. 2014, 29, 1–11. Available online: http://lib.cqvip.com/Qikan/Article/Detail?id=661962783 (accessed on 8 December 2020). (In Chinese).
- Ding, C.; Knaap, G.J.; Hopkins, L.D. Managing urban growth with urban growth boundaries: A theoretical analysis. J. Urban Econ. 1999, 46, 53–68. [Google Scholar] [CrossRef]
- Hepinstall-Cymerman, J.; Coe, S.; Hutyra, L.R. Urban growth patterns and growth management boundaries in the Central Puget Sound, Washington, 1986–2007. Urban Ecosyst. 2013, 16, 109–129. [Google Scholar] [CrossRef]
- Nelson, A.C.; Moore, T. Assessing urban growth management: The case of Portland, Oregon, the USA’s largest urban growth boundary. Land Use Policy 1993, 10, 293–302. [Google Scholar] [CrossRef]
- Zhang, J. Urban growth management in the United States. Urban Plan. Overseas 2002, 2, 37–40. (In Chinese) [Google Scholar] [CrossRef]
- Lin, J.; Qiao, Z.; Ye, Z. “Delimitation” and “implementation” of urban growth boundary: Analysis and thoughts on the practice in 14 pilot cities in China. Urban Plan. Forum 2017, 4, 37–43. (In Chinese) [Google Scholar] [CrossRef]
- Wang, W.; Jiao, L.; Zhang, W.; Jia, Q.; Su, F.; Xu, G.; Ma, S. Delineating urban growth boundaries under multi-objective and constraints. Sustain. Cities Soc. 2020, 61, 102279. [Google Scholar] [CrossRef]
- Wang, Z.; Zhang, Q.; Zhang, X.; Guan, X. Urban growth boundary delimitation of Hefei City based on the resources and environment carrying capability. Geogr. Res. 2013, 32, 2302–2311. (In Chinese) [Google Scholar] [CrossRef]
- Li, X.; Yeh, A.G.O. Cellular automata for simulating complex land use systems using neural networks. Geogr. Res. 2005, 24, 19–27. (In Chinese) [Google Scholar] [CrossRef]
- He, Q.; Tan, R.; Gao, Y.; Zhang, M.; Xie, P.; Liu, Y. Modeling urban growth boundary based on the evaluation of the extension potential: A case study of Wuhan city in China. Habitat Int. 2018, 72, 57–65. [Google Scholar] [CrossRef]
- Liu, X.; Wei, M.; Li, Z.; Zeng, J. Multi-scenario simulation of urban growth boundaries with an ESP-FLUS model: A case study of the Min Delta region, China. Ecol. Indic. 2022, 135, 108538. [Google Scholar] [CrossRef]
- Salem, M.; Bose, A.; Bashir, B.; Basak, D.; Roy, S.; Chowdhury, I.R.; Alsalman, A.; Tsurusaki, N. Urban Expansion Simulation Based on Various Driving Factors Using a Logistic Regression Model: Delhi as a Case Study. Sustainability 2021, 13, 10805. [Google Scholar] [CrossRef]
- Tayyebi, A.; Pijanowski, B.C.; Tayyebi, A.H. An urban growth boundary model using neural networks, GIS and radial parameterization: An application to Tehran, Iran. Landsc. Urban Plan. 2011, 100, 35–44. [Google Scholar] [CrossRef]
- Silva, E.A.; Clarke, K.C. Calibration of the SLEUTH urban growth model for Lisbon and Porto, Portugal. Comput. Environ. Urban Syst. 2002, 26, 525–552. [Google Scholar] [CrossRef]
- Yin, H.; Kong, F.; Yang, X.; James, P.; Dronova, I. Exploring zoning scenario impacts upon urban growth simulations using a dynamic spatial model. Cities 2018, 81, 214–229. [Google Scholar] [CrossRef]
- Liu, X.; Liang, X.; Li, X.; Xu, X.; Ou, J.; Chen, Y.; Li, S.; Wang, S.; Pei, F. A future land use simulation model (FLUS) for simulating multiple land use scenarios by coupling human and natural effects. Landsc. Urban Plan. 2017, 168, 94–116. [Google Scholar] [CrossRef]
- Ma, S.; Li, X.; Cai, Y. Delimiting the urban growth boundaries with a modified ant colony optimization model. Comput. Environ. Urban Syst. 2017, 62, 146–155. [Google Scholar] [CrossRef]
- Liu, J.; Chen, Y. GIS-based cellular automata models and researches on spatial complexity of man-land relationship. Geogr. Res. 2002, 21, 155–162. (In Chinese) [Google Scholar] [CrossRef]
- White, R.; Engelen, G.; Uljee, I. The use of constrained cellular automata for high-resolution modelling of urban land-use dynamics. Environ. Plan. B 1997, 24, 323–343. [Google Scholar] [CrossRef]
- Li, X.; Chen, G.; Liu, X.; Liang, X.; Wang, S.; Chen, Y.; Pei, F.; Xu, X. A new global land-use and land-cover change product at a 1-km resolution for 2010 to 2100 based on human-environment interactions. Ann. Am. Assoc. Geogr. 2017, 107, 1040–1059. [Google Scholar] [CrossRef]
- Clarke, K.C.; Gaydos, L.J. Loose-coupling a cellular automaton model and GIS: Long-term urban growth prediction for San Francisco and Washington/Baltimore. Int. J. Geogr. Inf. Sci. 1998, 12, 699–714. [Google Scholar] [CrossRef] [PubMed]
- Liang, X.; Liu, X.; Li, X.; Chen, Y.; Tian, H.; Yao, Y. Delineating multi-scenario urban growth boundaries with a CA-based FLUS model and morphological method. Landsc. Urban Plan. 2018, 177, 47–63. [Google Scholar] [CrossRef]
- Lv, J.; Wang, Y.; Liang, X.; Yao, Y.; Ma, T.; Guan, Q. Simulating urban expansion by incorporating an integrated gravitational field model into a demand-driven random forest-cellular automata model. Cities 2021, 109, 103044. [Google Scholar] [CrossRef]
- Long, Y.; Han, H.; Lai, S.; Mao, Q. Urban growth boundaries of the Beijing Metropolitan Area: Comparison of simulation and artwork. Cities 2013, 31, 337–348. [Google Scholar] [CrossRef]
- Sun, W.; Liu, C.; Wang, S. Simulation research of urban development boundary based on ecological constraints: A case study of Nanjing. J. Nat. Resour. 2021, 36, 2913–2925. [Google Scholar] [CrossRef]
- Barredo, J.I.; Demicheli, L. Urban sustainability in developing countries’ megacities: Modelling and predicting future urban growth in Lagos. Cities 2003, 20, 297–310. [Google Scholar] [CrossRef]
- Yi, D.; Zhao, X.; Guo, X.; Zhao, L.; Zhang, H.; Han, Y.; Roshan, S.; Luo, Z. Delimitation of urban development boundary based on ecological sensitivity evaluation and CA-Markov simulation in plain city: A case of Nanchang, Jiangxi, China. Chin. J. Appl. Ecol. 2020, 31, 208–218. (In Chinese) [Google Scholar] [CrossRef]
- Phillips, S.J.; Anderson, R.P.; Dudík, M.; Schapire, R.E.; Blair, M.E. Opening the black box: An open-source release of Maxent. Ecography 2017, 40, 887–893. [Google Scholar] [CrossRef]
- Kaky, E.; Nolan, V.; Alatawi, A.; Gilbert, F. A comparison between Ensemble and MaxEnt species distribution modelling approaches for conservation: A case study with Egyptian medicinal plants. Ecol. Inform. 2020, 60, 101150. [Google Scholar] [CrossRef]
- Wang, Y.; Chao, B.; Dong, P.; Zhang, D.; Yu, W.; Hu, W.; Ma, Z.; Chen, G.; Liu, Z.; Chen, B. Simulating spatial change of mangrove habitat under the impact of coastal land use: Coupling MaxEnt and Dyna-CLUE models. Sci. Total Environ. 2021, 788, 147914. [Google Scholar] [CrossRef] [PubMed]
- Lin, C.; Hong, Y.; Tu, W.; Liu, J. Multiperiod Dynamic Programming Algorithm for Optimizing a Nature Reserve. Sustainability 2022, 14, 3266. [Google Scholar] [CrossRef]
- Tan, J.; Li, A.; Lei, G.; Xie, X. A SD-MaxEnt-CA model for simulating the landscape dynamic of natural ecosystem by considering socio-economic and natural impacts. Ecol. Model. 2019, 410, 108783. [Google Scholar] [CrossRef]
- Zhang, Y.; Liu, X.; Chen, G.; Hu, G. Simulation of urban expansion based on cellular automata and maximum entropy model. Sci. Sin. 2020, 50, 339–352. [Google Scholar] [CrossRef]
- Chen, Z. Simulation and Prediction Analysis of Land Use Change in Changzhou Based on Maxent-CA. Geomat. World 2020, 27, 29–35,41. (In Chinese) [Google Scholar] [CrossRef]
- Tian, G.; Jiang, J.; Yang, Z.; Zhang, Y. The urban growth, size distribution and spatio-temporal dynamic pattern of the Yangtze River Delta megalopolitan region, China. Ecol. Model. 2011, 222, 865–878. [Google Scholar] [CrossRef]
- Liu, J.; Zhang, Z.; Zhuang, D.; Wang, Y.; Zhou, W.; Zhang, S.; Li, R.; Jiang, N.; Wu, S. A study on the spatial-temporal dynamic changes of land-use and driving forces analyses of China in the 1990s. Geogr. Res. 2003, 22, 1–12. (In Chinese) [Google Scholar] [CrossRef]
- Tripathy, P.; Kumar, A. Monitoring and modelling spatio-temporal urban growth of Delhi using Cellular Automata and geoinformatics. Cities 2019, 90, 52–63. [Google Scholar] [CrossRef]
- Maimaitijiang, M.; Ghulam, A.; Sandoval, J.S.O.; Maimaitiyiming, M. Drivers of land cover and land use changes in St. Louis metropolitan area over the past 40 years characterized by remote sensing and census population data. Int. J. Appl. Earth Obs. 2015, 35, 161–174. [Google Scholar] [CrossRef]
- Zhang, R.; Pu, L.; Zhu, M. Impacts of transportation arteries on land use patterns in urban-rural fringe: A comparative gradient analysis of Qixia District, Nanjing City, China. Chin. Geogr. Sci. 2012, 23, 378–388. [Google Scholar] [CrossRef]
- Sun, C.; Wu, Z.; Lv, Z.; Yao, N.; Wei, J. Quantifying different types of urban growth and the change dynamic in Guangzhou using multi-temporal remote sensing data. Int. J. Appl. Earth Obs. 2013, 21, 409–417. [Google Scholar] [CrossRef]
- Yang, J.; Xi, J.; Xie, P.; Ge, Q.; Li, X.; Gao, H. Spatio-temporal simulation and application of the tourist town growth based on cellular automaton model: A case study of Sanpo Town in Hebei Province. Geogr. Res. 2013, 32, 915–923. (In Chinese) [Google Scholar] [CrossRef]
- Zhang, Q.; Su, S. Determinants of urban expansion and their relative importance: A comparative analysis of 30 major metropolitans in China. Habitat Int. 2016, 58, 89–107. [Google Scholar] [CrossRef]
- Phillips, S.J.; Dudík, M.; Schapire, R.E. Maxent Software for Modeling Species Niches and Distributions (version 3.4.1). Available online: http://biodiversityinformatics.amnh.org/open_source/maxent/ (accessed on 25 November 2020).
- Phillips, S.J.; Anderson, R.P.; Schapire, R.E. Maximum entropy modeling of species geographic distributions. Ecol. Model. 2006, 190, 231–259. [Google Scholar] [CrossRef]
- Swets, J.A. Measuring the accuracy of diagnostic systems. Science 1988, 240, 1285–1293. [Google Scholar] [CrossRef]
- Feng, Y.; Tong, X. Dynamic land use change simulation using cellular automata with spatially nonstationary transition rules. GISci. Remote Sens. 2018, 55, 678–698. [Google Scholar] [CrossRef]
- Feng, Y.; Han, Z. Impact of neighbor configurations on spatially-explicit modeling results. Geogr. Res. 2011, 30, 1055–1065. (In Chinese) [Google Scholar] [CrossRef]
- Xu, C.; Liu, M.; Zhang, C.; An, S.; Yu, W.; Chen, J. The spatiotemporal dynamics of rapid urban growth in the Nanjing metropolitan region of China. Landsc. Ecol. 2007, 22, 925–937. [Google Scholar] [CrossRef]
- Wilson, E.H.; Hurd, J.D.; Civco, D.L.; Prisloe, M.P.; Arnold, C. Development of a geospatial model to quantify, describe and map urban growth. Remote Sens. Environ. 2003, 86, 275–285. [Google Scholar] [CrossRef]
- Dadashpoor, H.; Azizi, P.; Moghadasi, M. Land use change, urbanization, and change in landscape pattern in a metropolitan area. Sci. Total Environ. 2019, 655, 707–719. [Google Scholar] [CrossRef] [PubMed]


| Type | Variable | Abbreviation | Min | Max | Unit |
|---|---|---|---|---|---|
| Natural conditions | Surface relief | relief | 0 | 175 | m |
| Aspect | aspect | 0 | 360 | ° | |
| NDVI | NDVI | 0.008 | 0.9 | ||
| Soil type | soil | Iron bauxite: 1; alfisols: 2; primary soil: 3; semi-hydromorphic soil: 4; anthropogenic soil: 5; lake–reservoir: 6; river: 7 | |||
| Socio-economic conditions | Distance to road | road | 0 | 13,872.1 | m |
| Distance to transport station | traffic | 0 | 13,754.7 | m | |
| Distance to infrastructure | infra | 0 | 15,171.5 | m | |
| Distance to industrial enterprise | indus | 0 | 15,540.8 | m | |
| Distance to government department | gov | 0 | 13,738.7 | m | |
| GDP density | GDP | 834 | 248,673 | yuan/km2 | |
| Population density | pop | 501.3 | 10,949.5 | pop/km2 | |
| Method | Population/Thousand People | Area/m2 | Raster Number | Accuracy |
|---|---|---|---|---|
| Comprehensive growth rate | 9194.77 | 1011.42 | 1,123,805 | |
| Unitary linear regression | 9640.30 | 1060.43 | 1,178,259 | R2 = 0.9371 |
| GM (1, 1) model | 10,064.83 | 1107.13 | 1,230,146 | δ = 2.14% |
| Average | 9633.30 | 1059.66 | 1,177,403 |
| Sample Size | 600 | 800 | 1000 | 2000 | 5000 | 10,000 | |
|---|---|---|---|---|---|---|---|
| 11 environment variables | AUC of the training data set | 0.825 | 0.822 | 0.816 | 0.786 | 0.739 | 0.685 |
| AUC of the test data set | 0.809 | 0.811 | 0.813 | 0.779 | 0.734 | 0.684 | |
| 8 environment variables | AUC of the training data set | 0.825 | 0.817 | 0.814 | 0.785 | 0.738 | 0.685 |
| AUC of the test data set | 0.784 | 0.806 | 0.805 | 0.777 | 0.734 | 0.692 |
| Variable | Contribution (%) | Importance (%) |
|---|---|---|
| road | 27.74 | 20.56 |
| NDVI | 23.51 | 22.86 |
| pop | 13.99 | 11.37 |
| indus | 10.80 | 9.99 |
| traffic | 9.04 | 11.06 |
| relief | 8.75 | 2.77 |
| gov | 3.63 | 11.32 |
| soil | 1.14 | 2.67 |
| GDP | 0.58 | 3.34 |
| infra | 0.55 | 3.03 |
| aspect | 0.28 | 1.04 |
| Type | Variable | Contribution (%) | Importance (%) |
|---|---|---|---|
| Natural conditions | NDVI | 22.69 | 22.91 |
| relief | 6.24 | 3.11 | |
| soil | 0.55 | 3.64 | |
| Socio-economic conditions | road | 30.23 | 17.24 |
| indus | 16.07 | 9.53 | |
| traffic | 11.38 | 14.63 | |
| gov | 7.38 | 17.52 | |
| pop | 5.46 | 11.43 |
| Type | Outlying Expansion | Edge Expansion | Infilling Expansion | Total |
|---|---|---|---|---|
| Area (km2) | 11.08 | 87.30 | 132.40 | 230.78 |
| Percent (%) | 4.80 | 37.83 | 57.37 | 100.00 |
Publisher’s Note: MDPI stays neutral with regard to jurisdictional claims in published maps and institutional affiliations. |
© 2022 by the authors. Licensee MDPI, Basel, Switzerland. This article is an open access article distributed under the terms and conditions of the Creative Commons Attribution (CC BY) license (https://creativecommons.org/licenses/by/4.0/).
Share and Cite
Zhang, J.; Chen, Y.; Yang, X.; Qiao, W.; Wang, D. The Demarcation of Urban Development Boundary Based on the Maxent-CA Model: A Case Study of Wuxi in China. Sustainability 2022, 14, 11426. https://doi.org/10.3390/su141811426
Zhang J, Chen Y, Yang X, Qiao W, Wang D. The Demarcation of Urban Development Boundary Based on the Maxent-CA Model: A Case Study of Wuxi in China. Sustainability. 2022; 14(18):11426. https://doi.org/10.3390/su141811426
Chicago/Turabian StyleZhang, Jiaying, Yi Chen, Xuhong Yang, Wenyi Qiao, and Danyang Wang. 2022. "The Demarcation of Urban Development Boundary Based on the Maxent-CA Model: A Case Study of Wuxi in China" Sustainability 14, no. 18: 11426. https://doi.org/10.3390/su141811426
APA StyleZhang, J., Chen, Y., Yang, X., Qiao, W., & Wang, D. (2022). The Demarcation of Urban Development Boundary Based on the Maxent-CA Model: A Case Study of Wuxi in China. Sustainability, 14(18), 11426. https://doi.org/10.3390/su141811426