Abstract
Precision ventilation is developed to achieve thermal comfort for occupants in an office by creating micro-climate zones. The present study aims to achieve individual thermal comfort for occupants with different metabolic rates by using higher airspeeds for enhancing heat transfer. The variable jet interaction between two ACBs with JetCone adjustments cause higher velocity jets to reach different regions of the occupied zone. The colliding jets from the center of a thermal isolated room were moved towards different zones in an office configuration with a constant room temperature of 23 °C. This study was conducted for five different cases in a room divided into four zones according to occupants’ metabolic rates. The experimental and CFD results show that occupants facing symmetrical airflow distribution and with a constant 1.2 metabolic rate (Case 1) had a similar predicted mean vote (PMV) index. The zones with higher-metabolic-rate occupants, i.e., 1.4 met and 1.6 met in cases 2 and 3 were exposed to air velocities up to 0.4 and 0.5 m/s, respectively. In case 4, the air velocity in the single zone with 1.6 met occupants was raised to 0.6 m/s by targeted airflow distribution achieved by adjusting JetCones. These occupants with higher metabolic rates were kept thermally neutral, in the −0.5 to +0.5 PMV range, by pushing the high velocity colliding jets from the center towards them. In case 5, the results showed that precision ventilation can maintain the individual thermal comfort of up to three different zones (in the same office space) by exposing the occupants with metabolic rates of 1.2, 1.4, and 1.6 met to airspeeds of 0.15, 0.45, and 0.55 m/s, respectively.
1. Introduction
Modern offices are designed with different layouts to promote communication and knowledge-sharing among employees. Open-plan office configurations are the most used office layouts in Scandinavia [1]. These open-plan offices involve the absence of partitions to accommodate many employees by reducing individual space [2]. Studies have shown that employee’s satisfaction with comfort and productivity can be enhanced by providing a comfortable environment along with a sustainable open-plan office design [3,4]. It is a widely known fact that people spend up to 90% of their time indoors [5] and the need for individual thermal comfort is necessary to enhance their productivity [6]. This can improve the occupant’s ability to perform manual tasks. Thermal comfort is defined as the condition of mind that provides satisfaction with the thermal environment [7,8]. Fanger’s theory about thermal comfort showed that thermal comfort is dependent on metabolic rate, clothing insulation, and environmental conditions [9,10]. Hence, for a large-scale office setup, managing individual thermal comfort for the occupants of different ages, gender, and health seems challenging with conventional HVAC systems such as mixing ventilation [11,12].
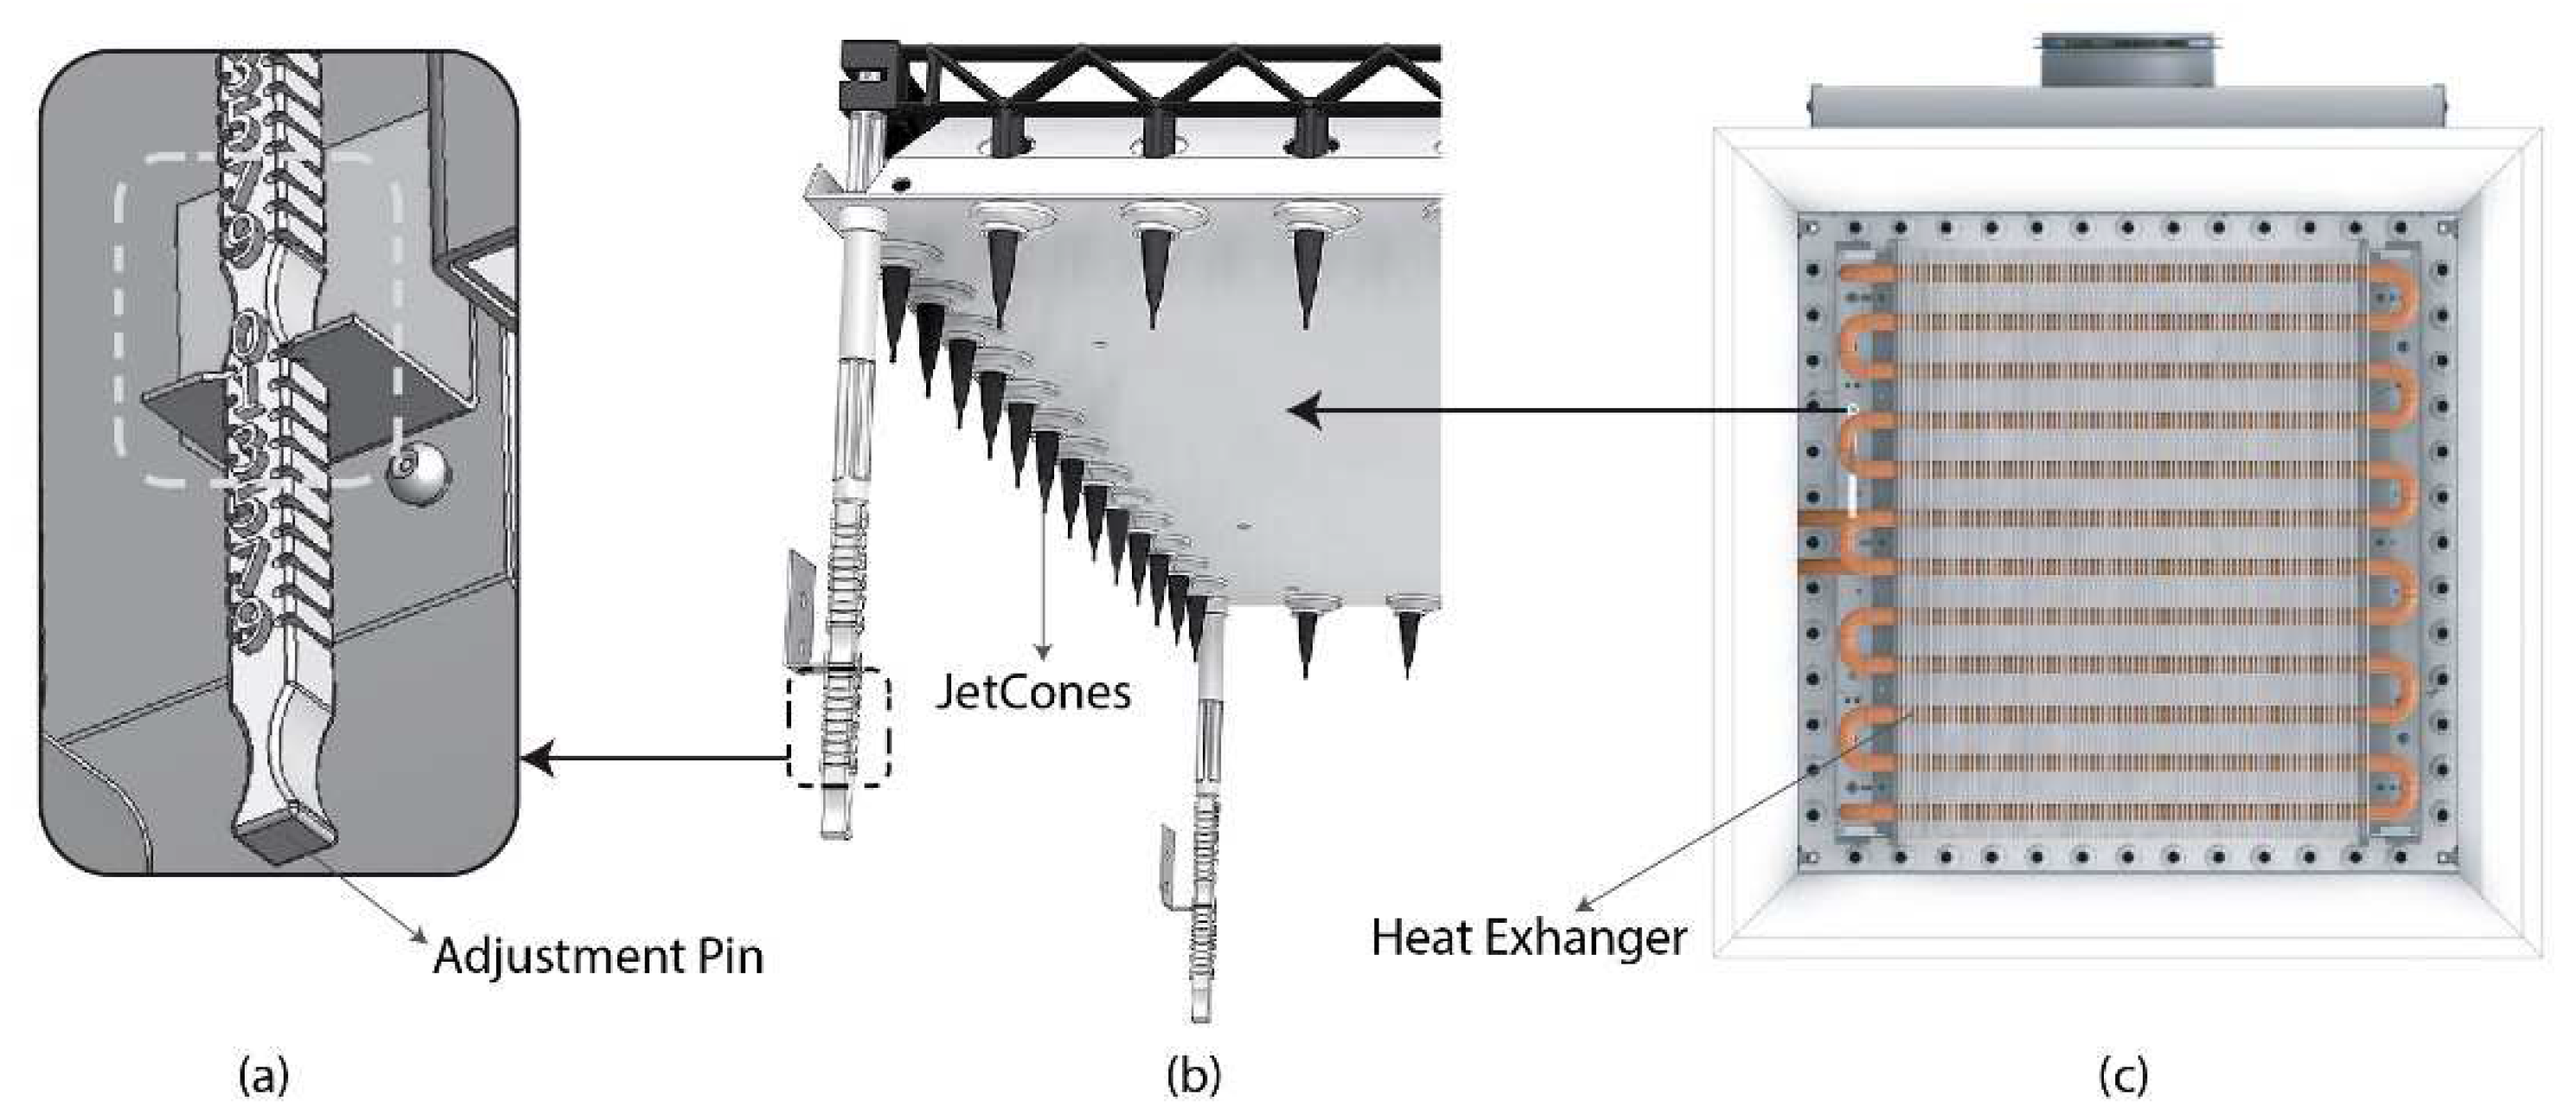
Mixing ventilation systems are the most-used ventilation systems due to their ability to provide thermal uniformity [13]. In these systems, the cool air is supplied through the ceiling and the airflow in the room is continuously driven by the inertia of the supply air to maintain temperature symmetry. Active chilled beams (ACBs) are a type of mixing ventilation system. Studies have shown that ACBs are successful in maintaining thermal uniformity due to adequate air mixing [14]. Latif et al. [15] concluded that most of the studies on ACBs are carried out for large-scale open-plan office configurations. These office types have greater occupant density and may require multiple ACBs to meet a sensible cooling demand [16]. A typical ACB generally consists of a primary air plenum, mixing chamber, nozzles, and a heat exchanger. Processed air from the Air Handling Unit (AHU) is forced into the set of nozzles as primary air [17]. The purpose of the nozzles is to provide high-speed primary air and consequently create high dynamic pressure and low static pressure to facilitate induction, i.e., pressure differences between the mixing chamber and room. ACBs with JetCones can provide adjustable airflow patterns by controlling adjustment regulators [18,19]. These adjustment pins (see Figure 1) can be moved from 0 to 9 to vary the magnitude and direction of the airflow coming out of the ACB.
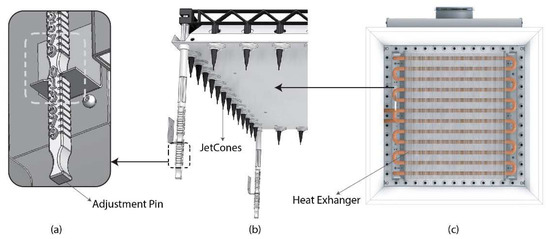
Figure 1.
(a) Adjustment pin regulator, (b) JetCones system, and (c) ACB unit without an induction grill [15].
Personalized ventilation systems (PV) (also known as task ambient systems) have been used over the decades to create a micro-climate thermal environment around office occupants [20,21,22]. These systems include multiple air terminal devices (ATDs) (around an individual or an office desk) which operate simultaneously to blow different air jets directly on the occupants [23,24]. The combination of mixing ventilation and personalized ventilation systems are also applied in the office rooms to build micro-climate zones with different ATDs [25,26]. However, these systems involve multiple ATDs and a direct blow of air on the occupants, which is not pleasing for the office aesthetics. Unlike PV systems, the supply jets from the ACBs inlets spread horizontally across the ceiling due to the Coandă effect [27]. These horizontal jets move along the ceiling and collide with incoming supply jets from other ACBs to result in a colliding effect [28]. Studies have shown that the downfall of these colliding inlet jets creates maximum local airspeeds [29]. In this study, the collision of supply air jets with each other and with the walls is used to create different velocity zones in the same office space. These high- and low-velocity zones are established based on the metabolic requirements of occupants in the same shared office space.
Precision ventilation [30] involves advantages of both mixing ventilation and personalized ventilation to achieve individual thermal comfort. Precision ventilation is achieved by using ACBs (with JetCones) which can direct airflow in different directions along the ceiling. This use of ACBs eliminates the need for multiple air terminal devices around a single workstation in order to achieve individual thermal comfort [23]. In our previous study [30], precision ventilation achieved individual thermal comfort for a dual desk-chair setup by directing more airflow towards occupants with higher air velocity needs (metabolic rates). This paper expands the previous work by including an experimental and a CFD study in order to achieve precision ventilation by using the variable jet interaction between two ACBs as part of larger open plan offices, i.e., four-desk-chair setup. This variable jet interaction or the movement of colliding jets is achieved by adjusting the JetCones of two ACBs to establish different air velocity zones in an office space.
2. Methodology
2.1. Experimental and Simulation Setup
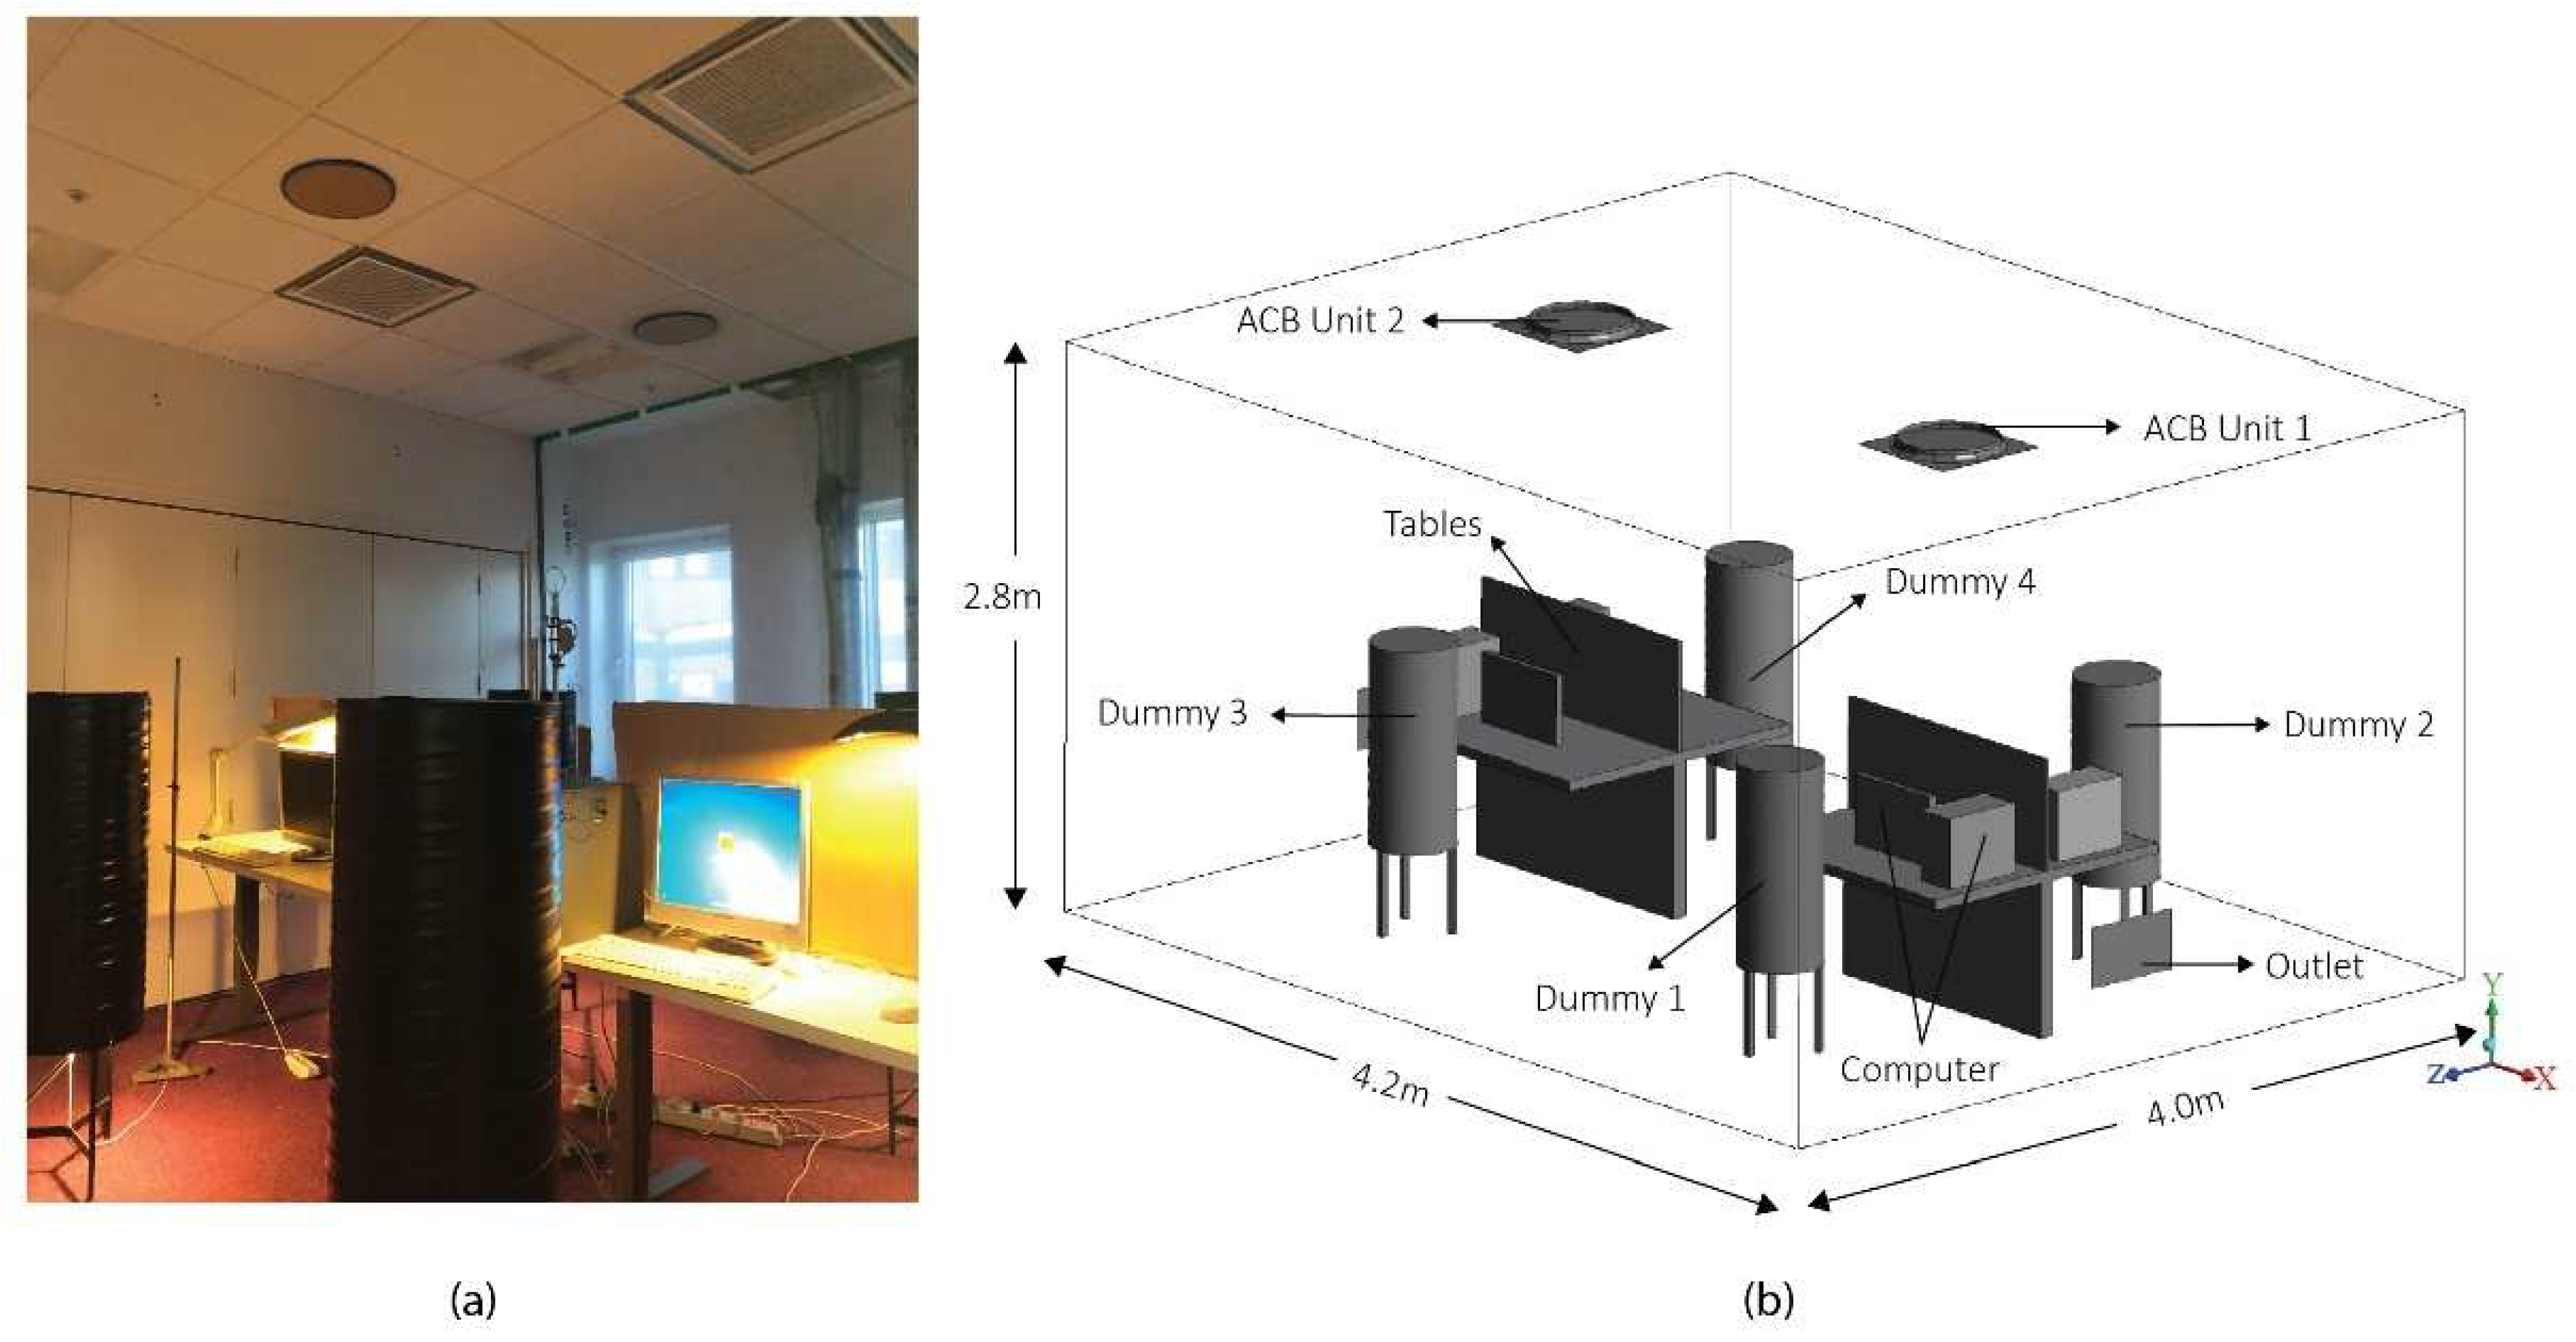
Full-scale laboratory experiments were conducted in a room with dimensions 4.2 × 4 × 2.8 m (length (L) × width (W) × height (H)) at the Aalborg University, Copenhagen. The experiments were carried out during summers (between the months of May–September). The two ACBs used in the study were connected to a duct network, which delivered 15 L/s of primary air to each unit. The supply air temperature from the ACBs was set at 20 °C and a temperature difference (Δt) of 3.5 K was maintained between supply and room air temperatures. The constant airflow of 50 L/s was supplied from each ACB, such that 100 L/s of total airflow (w) was maintained in the room.
According to the Equation (1), 22 W/m2 of heat load was maintained in the room measuring 16.8 m2, which is considered acceptable in Scandinavia. The heat balance in the room was maintained by the cooling power of the ACBs. Table 1 shows the features of the ACBs used in this study.

Table 1.
ACB specifications.
The test room was built with an open-plan office configuration, consisting of four workstations and two ACBs installed in the ceiling, each 2 m apart. Each workstation consisted of a desktop, computer, and a lamp as a heat source as shown in Figure 2a. The room was divided into four zones to establish different velocity (or individual thermal comfort) zones. The positions of the four dummies (1.4 m, the height of a seated person), were 1.85 m apart so that their thermal flux had a negligible effect on each other [31]. The dummies were separated by open-plan 40 × 75 cm desks (L × W) under the plexus. The real office atmospheric environment was established for replicating human heat release by placing electric bulbs inside the dummies. The metabolic rate of each dummy was varied by changing the number and capacity of the electric bulbs installed inside. The heat fluxes of 65, 80, and 95 W/m2 were applied for 1.2, 1.4, and 1.6 met, respectively. Dantec hot sphere anemometers with an absolute accuracy of ±2% of the reading (between the range of 0–1 m/s) were used to measure the air velocity in the room [32].

Figure 2.
(a) Experimental office setup; (b) office geometry.
Figure 2b shows the geometry of the actual experimental setup made in Solidworks 2020 version. The geometry was imported to ANSYS 17.1 to conduct simulations for different cases [33]. The grid independence test was carried out and tetrahedral meshes were generated in the entire computational domain with a 3.67 million element size (see Appendix A). The RNG k-ε turbulence model along with a similar setup (solver, boundary conditions, and numerical algorithm) was applied according to previous studies on precision ventilation [30,34,35,36]. In simulations, the geometry of the ACBs was made circular in order to have radial flow and 50 L/s airflow (sum of primary and secondary airflows) produced from each ACB unit. The airflow distribution in the ACBs was altered according to the different cases described below.
2.2. ACB Airflow Distribution
In this study, ACBs consisted of four adjustment regulators to be able to adjust JetCones on each side of the unit. Four dummies (D1, D2, D3, and D4) were used as a heat source with heat flux adjusted with respect to changing metabolic rates in each case. Two ACBs in five different cases were investigated to achieve precision ventilation for an open-plan office configuration.
Table 2 shows the cases in which JetCones are positioned according to different metabolic rates. In each case, the adjustment pins of each ACB were regulated relative to the JetCone positions of the other ACB unit. The following cases were studied in this paper under non-isothermal conditions:
Table 2.
Different cases of precision ventilation with respect to metabolic rates and JetCone positions.
- In case 1, the metabolic rates in all zones were kept at 1.2 met. The adjustment pins of both the ACBs were kept at the same position (position 5) to achieve a uniform thermal environment for all four velocity zones.
- In case 2, the metabolic rates of the two dummies in zones 1 and 2 were raised to 1.4 met. The pin positions were adjusted to push more airflow towards zones 1 and 2.
- In case 3, the metabolic rates of the two dummies in zones 1 and 2 were raised to 1.6 met. The pin positions were adjusted to push maximum airflow towards zones 1 and 2.
- In case 4, the metabolic rate of the dummy in zone 1 was raised to 1.6 met. The pin positions were adjusted to push maximum airflow towards zone 1 to achieve individual thermal comfort.
- In case 5, the metabolic rates of the two dummies in zones 1 and 4 were raised to 1.6 and 1.4 met, respectively. The pin positions were adjusted to push maximum airflow towards zone 1 and medium level airflow to zone 4.
2.3. Measuring Points and Thermal Comfort Criteria
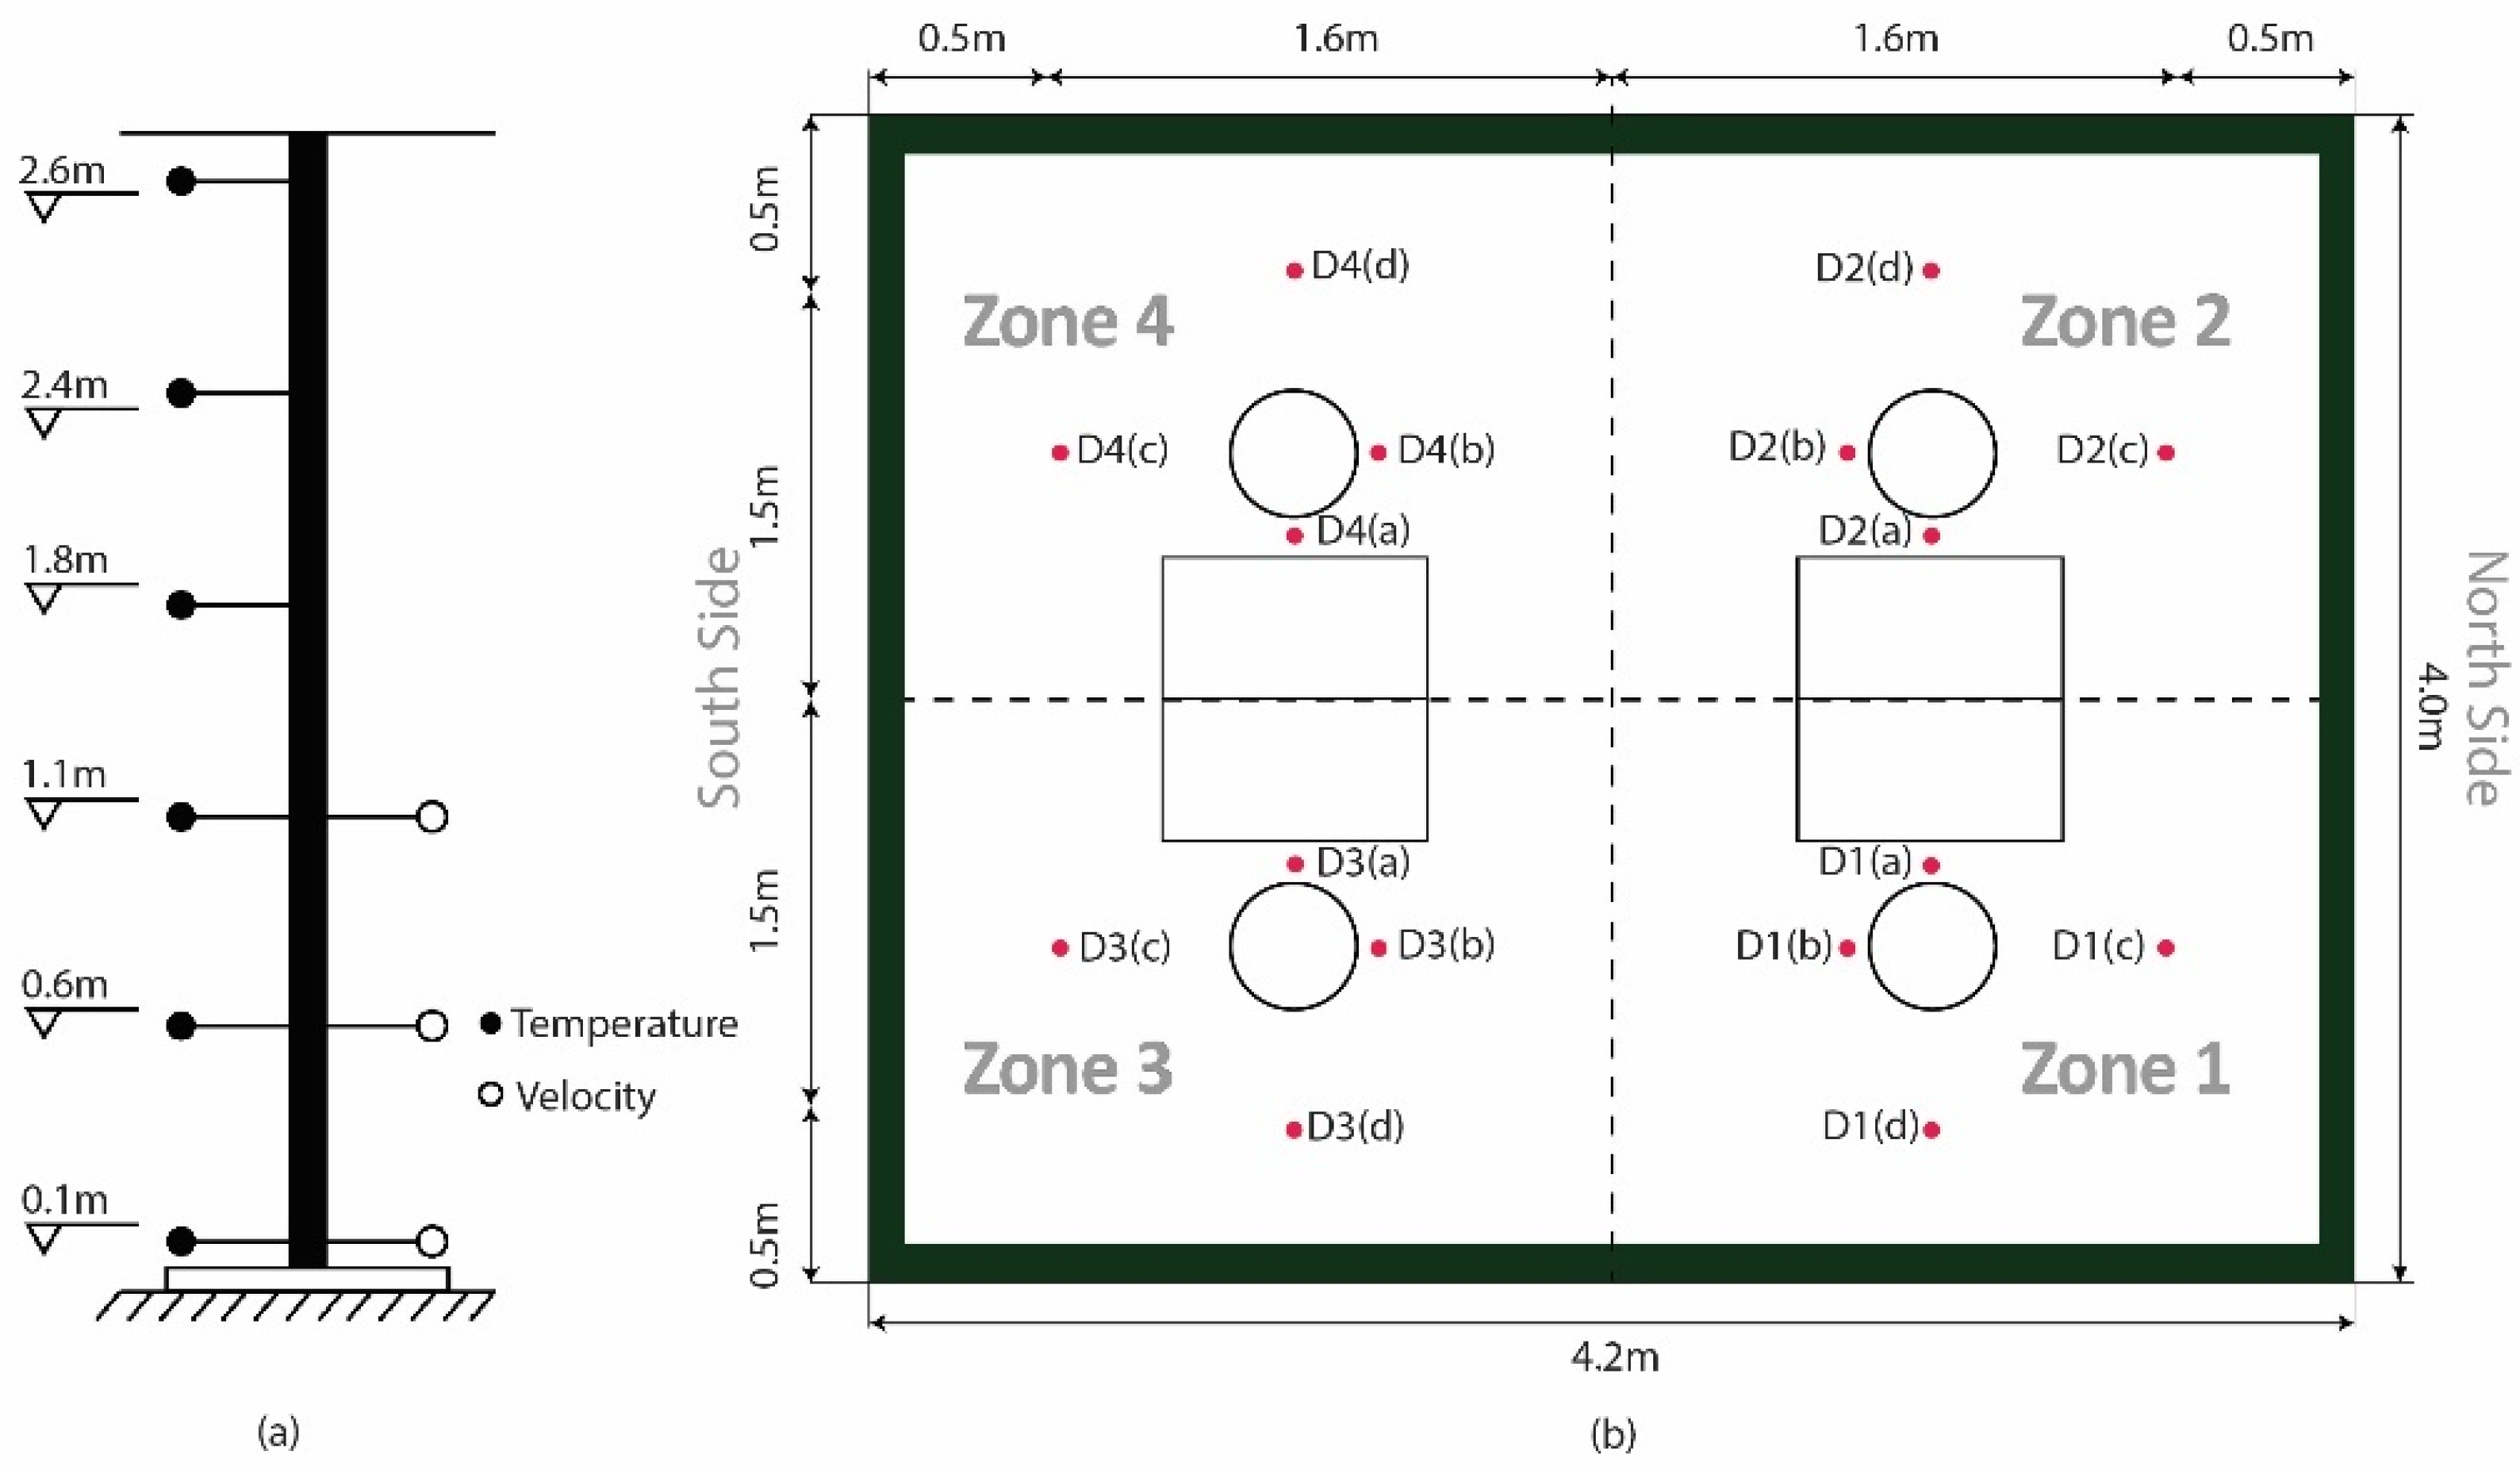
The horizontal air velocity and temperature measuring points were taken as shown in Figure 3. The vertical velocity measuring points were taken at the heights of the ankle (0.1 m), abdomen (0.6 m), and face (1.1 m) of a seated person (see Figure 3a). Temperature measuring points were taken at six different heights from the floor to ceiling to observe air temperature symmetry (see Figure 3a). The horizontal measuring points were taken at 16 different positions in the room for thermal comfort measurements as shown in Figure 3b.
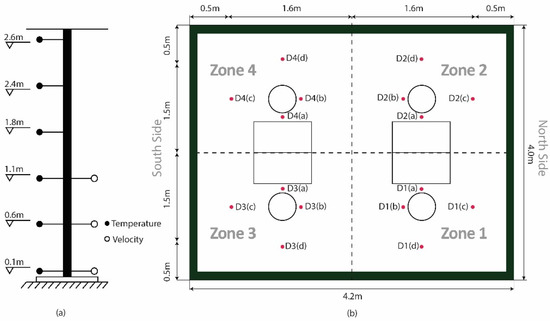
Figure 3.
Velocity and temperature measuring points: (a) vertical and (b) horizontal.
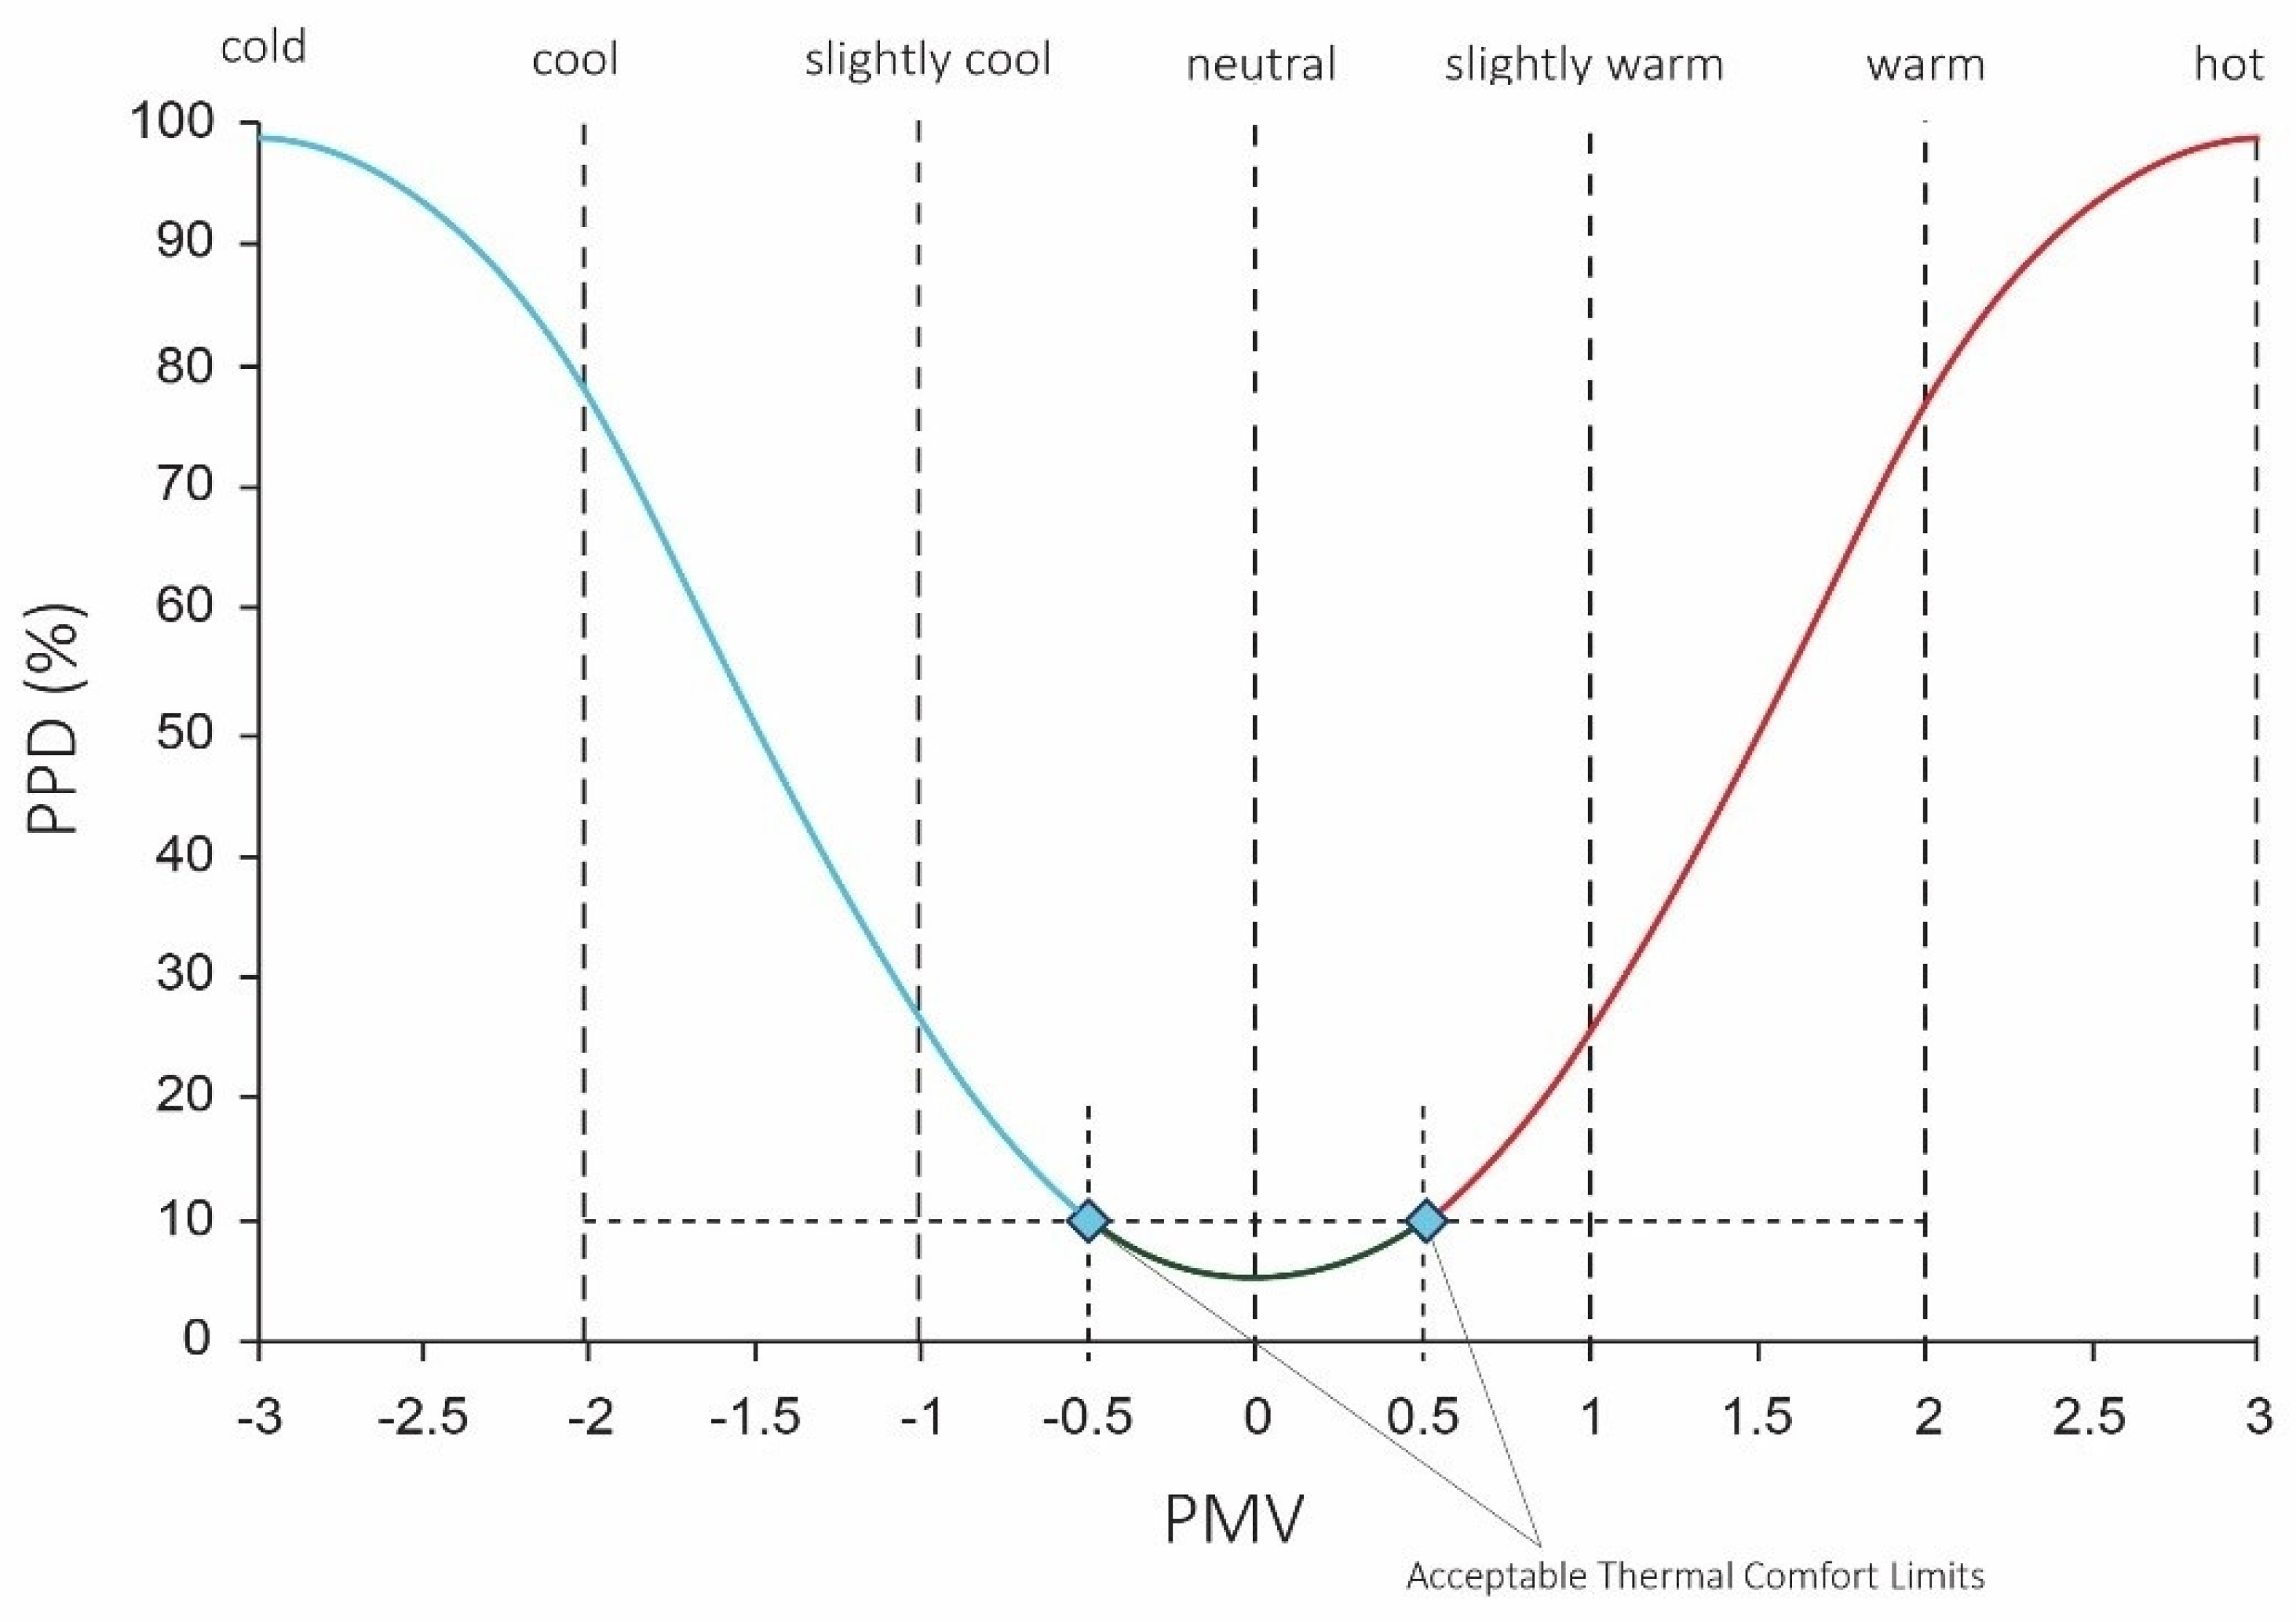
Predicted mean vote (PMV) and predicted percentage dissatisfied (PPD) indices were used to calculate thermal comfort for human dummies in an enclosed environment. In the PMV-PPD model, measuring points were taken along the length of the room to calculate thermal comfort, i.e., PMV-PPD indices for each zone. Figure 4 shows the PMV-PPD curve used to represent thermal comfort according to Fanger’s method. The horizontal PMV axis represents the seven-point thermal sensation scale (i.e., cold to hot). The vertical PPD axis shows the percentage of people predicted to experience local discomfort. According to ISO 7730 and ASHRAE 55 standards, the acceptable thermal comfort limit lies between −0.5 and 0.5 [37,38,39], as highlighted in Figure 4.
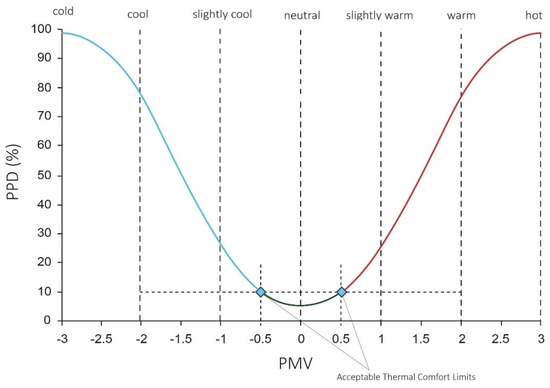
Figure 4.
PMV-PPD measurement graph with thermal comfort limits [9].
The Equations (1) and (2) indicate the variables contributing to the calculation of PMV-PPD indices using Fanger’s method. These variables were calculated based on mean measured values of the local air temperature (Ta), mean radiant temperature (Tr), and local air velocity (Vr). The mean radiant temperature air temperature was assumed equal to local air temperature [40] and relative humidity (RH) was measured at 60%. The clothing factor was assumed to be 0.6 clo during the summer [41]. The metabolic rates (M) in the equation were varied depending on the type of case. The metabolic rates for 1.2, 1.4, and 1.6 met were kept at 65, 80, and 95 W/m2 per dummy, respectively. Whereas the rate of mechanical work (W) was kept at zero. The clothing surface area (fcl) and the convective heat transfer coefficient (hc) were calculated iteratively.
PMV = (0.303e−0.036M + 0.028) {(M − W) − 3.05 × 10⁻³ [5733 − 6.99(M − W) − pa] − 0.42[(M − W) − 58.15] − 1.7 × 10⁻⁵ M (5867 − pa) − 0.0014 M (34 − Ta) − 3.96 × 10⁻⁸ fcl [(Tcl + 273)4 − (Tr + 273)4] − fcl.hc(Tcl − Ta)},
PPD = 100 − 95exp [−(0.03353PMV4 + 0.2179PMV2)]
The room was divided into four zones and PMV-PPD values were measured at 16 different positions (see Figure 3b) for each case. Four different points were taken in each zone to measure air velocity and air temperatures for calculating PMV-PPD thermal comfort indices under different scenarios.
3. Results and Discussion
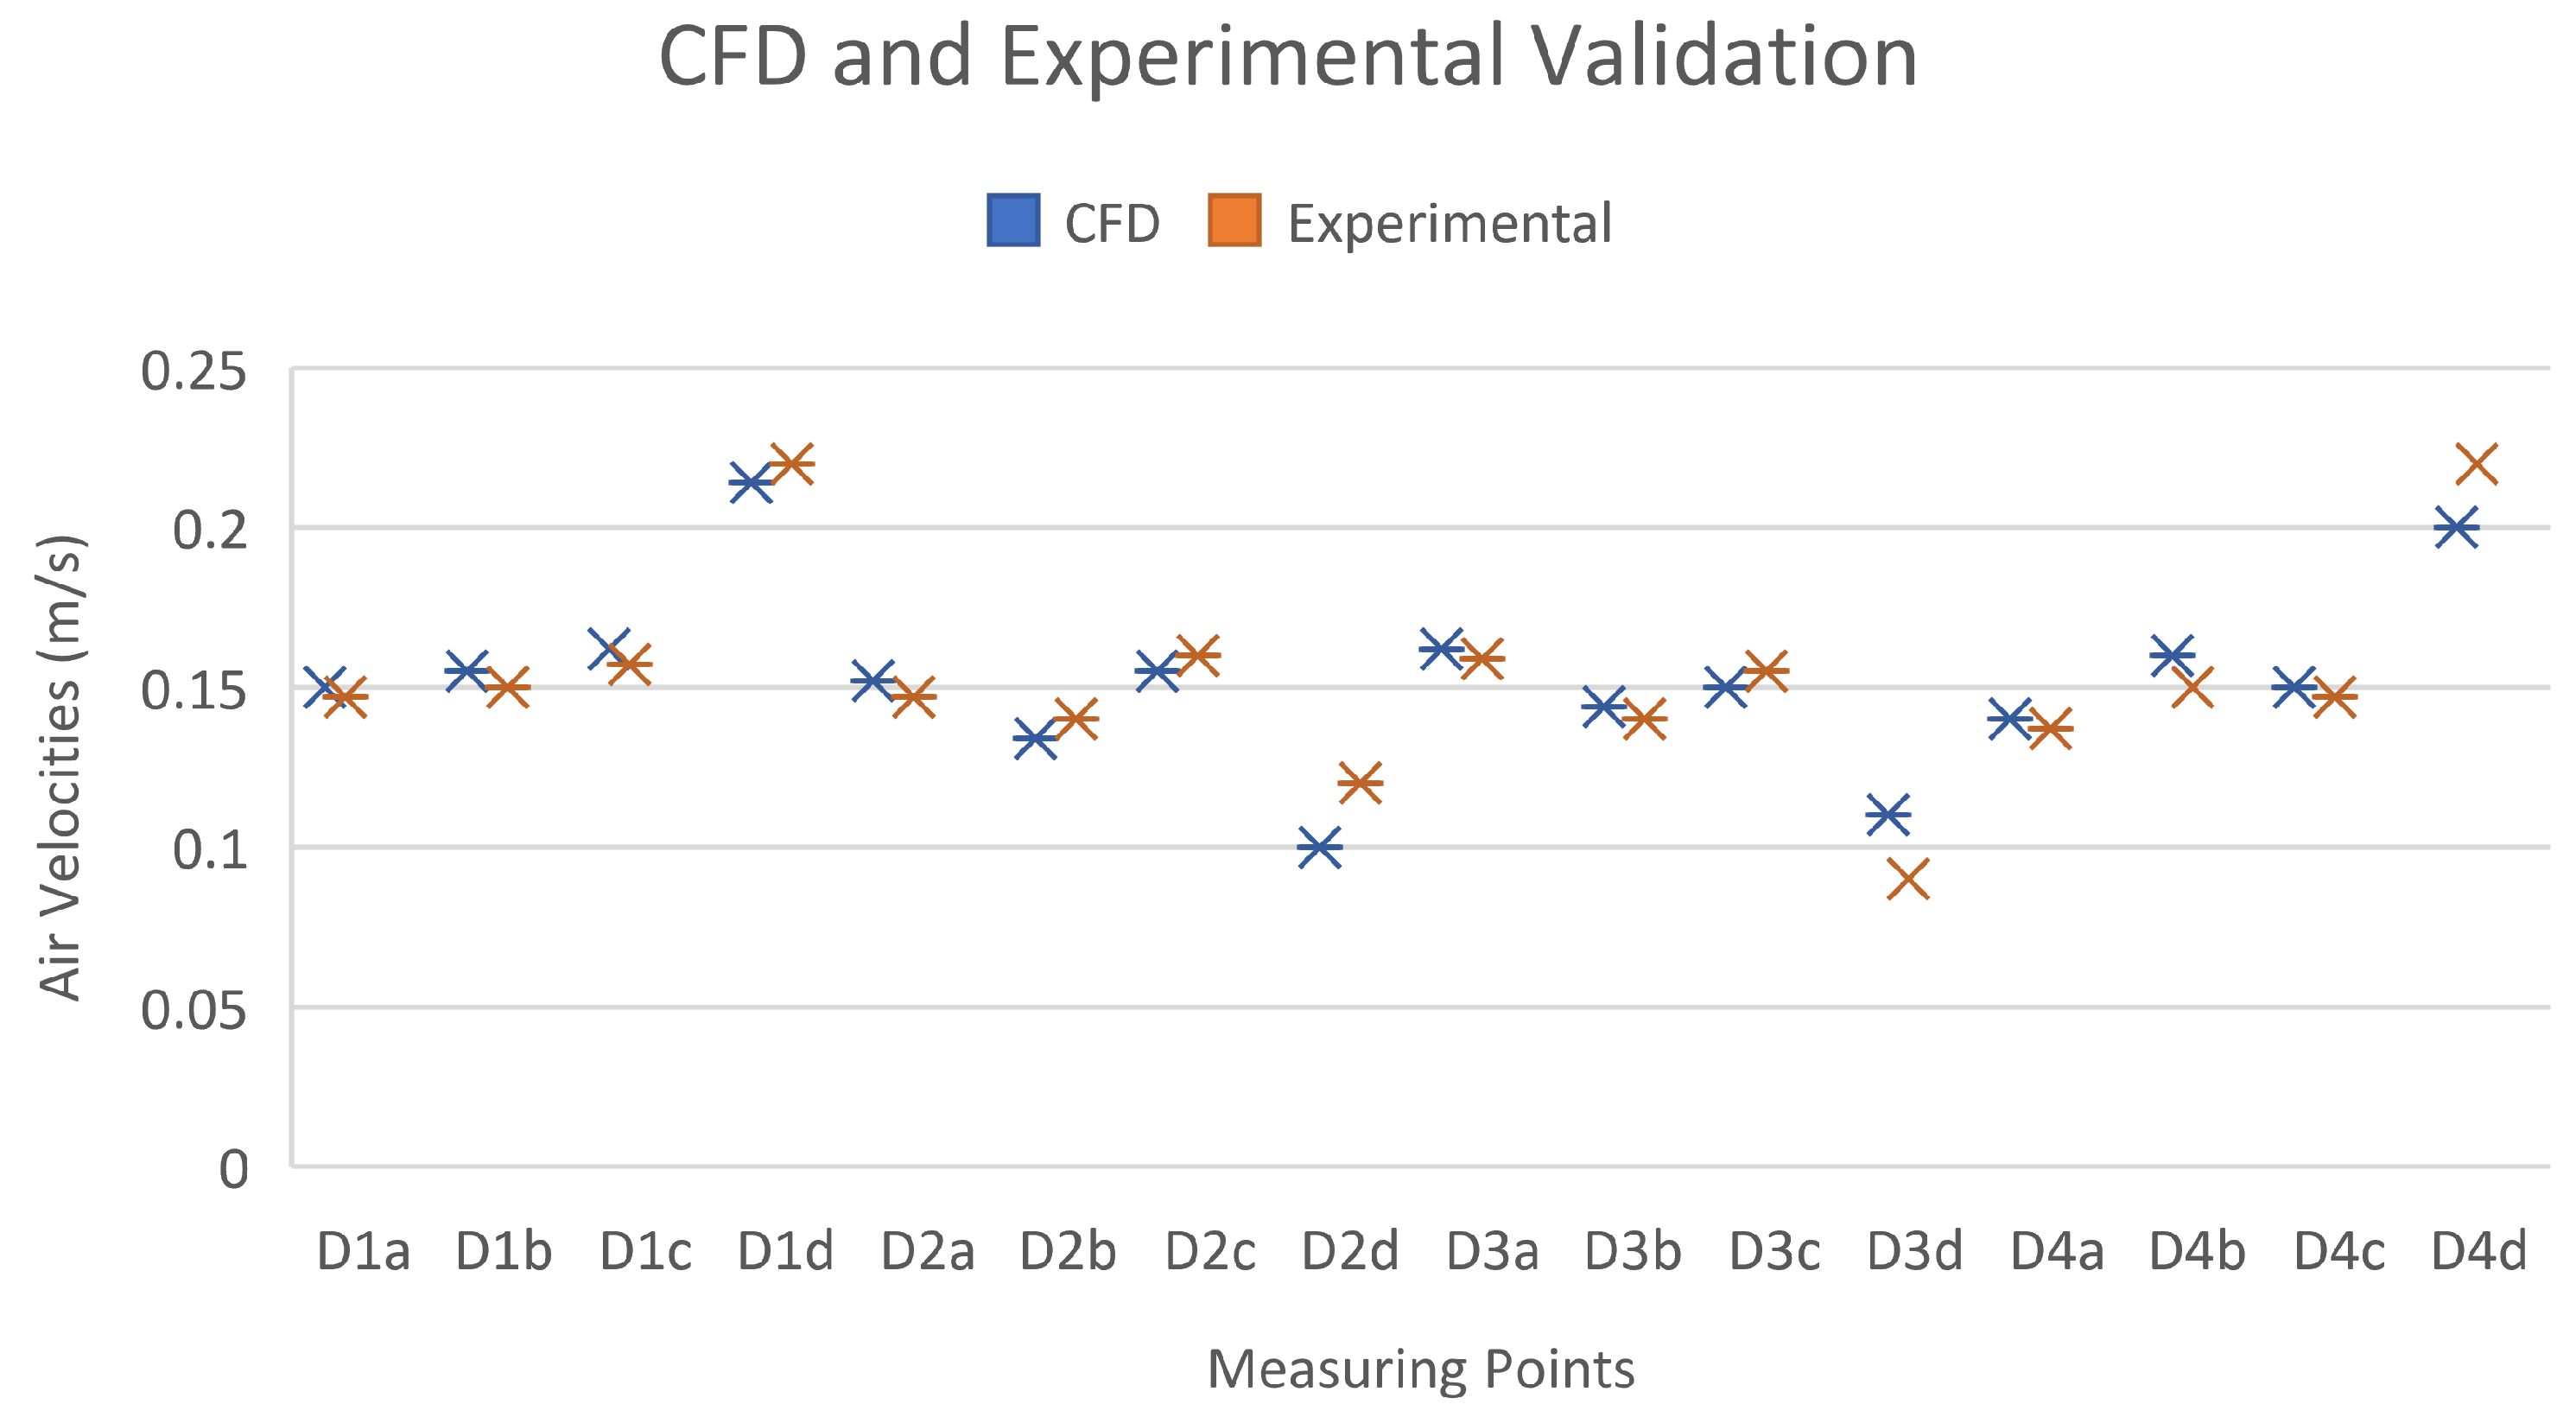
This study was conducted in five different cases of precision ventilation in an open-plan office through the jet interaction of two ACBs. The experimental results were verified through data validity with CFD. The experimental air velocities measured at 16 different points in the room were compared with the fixed velocity points taken in the ZX velocity plane in a three-dimensional room. The air velocity points (of both experiments and CFD) were considered for case 1 (as shown in Figure 3) at a fixed height of 1.1 m from the floor. Validation showed a less than 10% deviation from the simulation results as shown in Figure 5. The maximum deviation was shown at points D2d and D3d, but the results were still considered acceptable to perform thermal calculations using PMV-PPD equations [42].
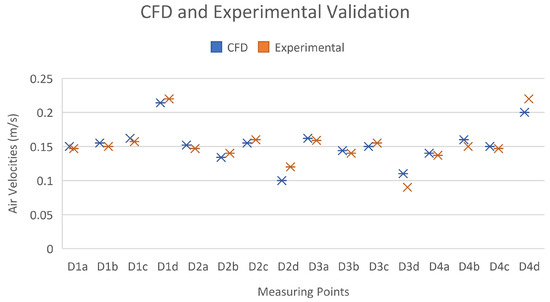
Figure 5.
CFD and experimental velocity graph for validation.
3.1. Air Velocity Distribution
Optimal airflow is the requirement of maintaining the heat balance between the human body and the surrounding environment [43]. Occupants with higher metabolic rates require higher air velocities to accelerate the heat transfer [44]. Previous studies have shown that a local air velocity range up to 1.2 m/s is considered acceptable by raising room temperatures up to 28 °C during experiments [43,45]. In the previous study on precision ventilation [30], single ACBs established high velocity zones by pushing more airflow towards the targeted zones. The airflow along the ceiling and walls reached the occupied zone for creating micro-climate zones in the dual desk-chair setup. This study took advantage of high velocity colliding air jets to create high velocity micro-climate zones for an open-plan office setup. The jet interaction between two ACBs of all five cases is shown in the figures below (Figure 6).

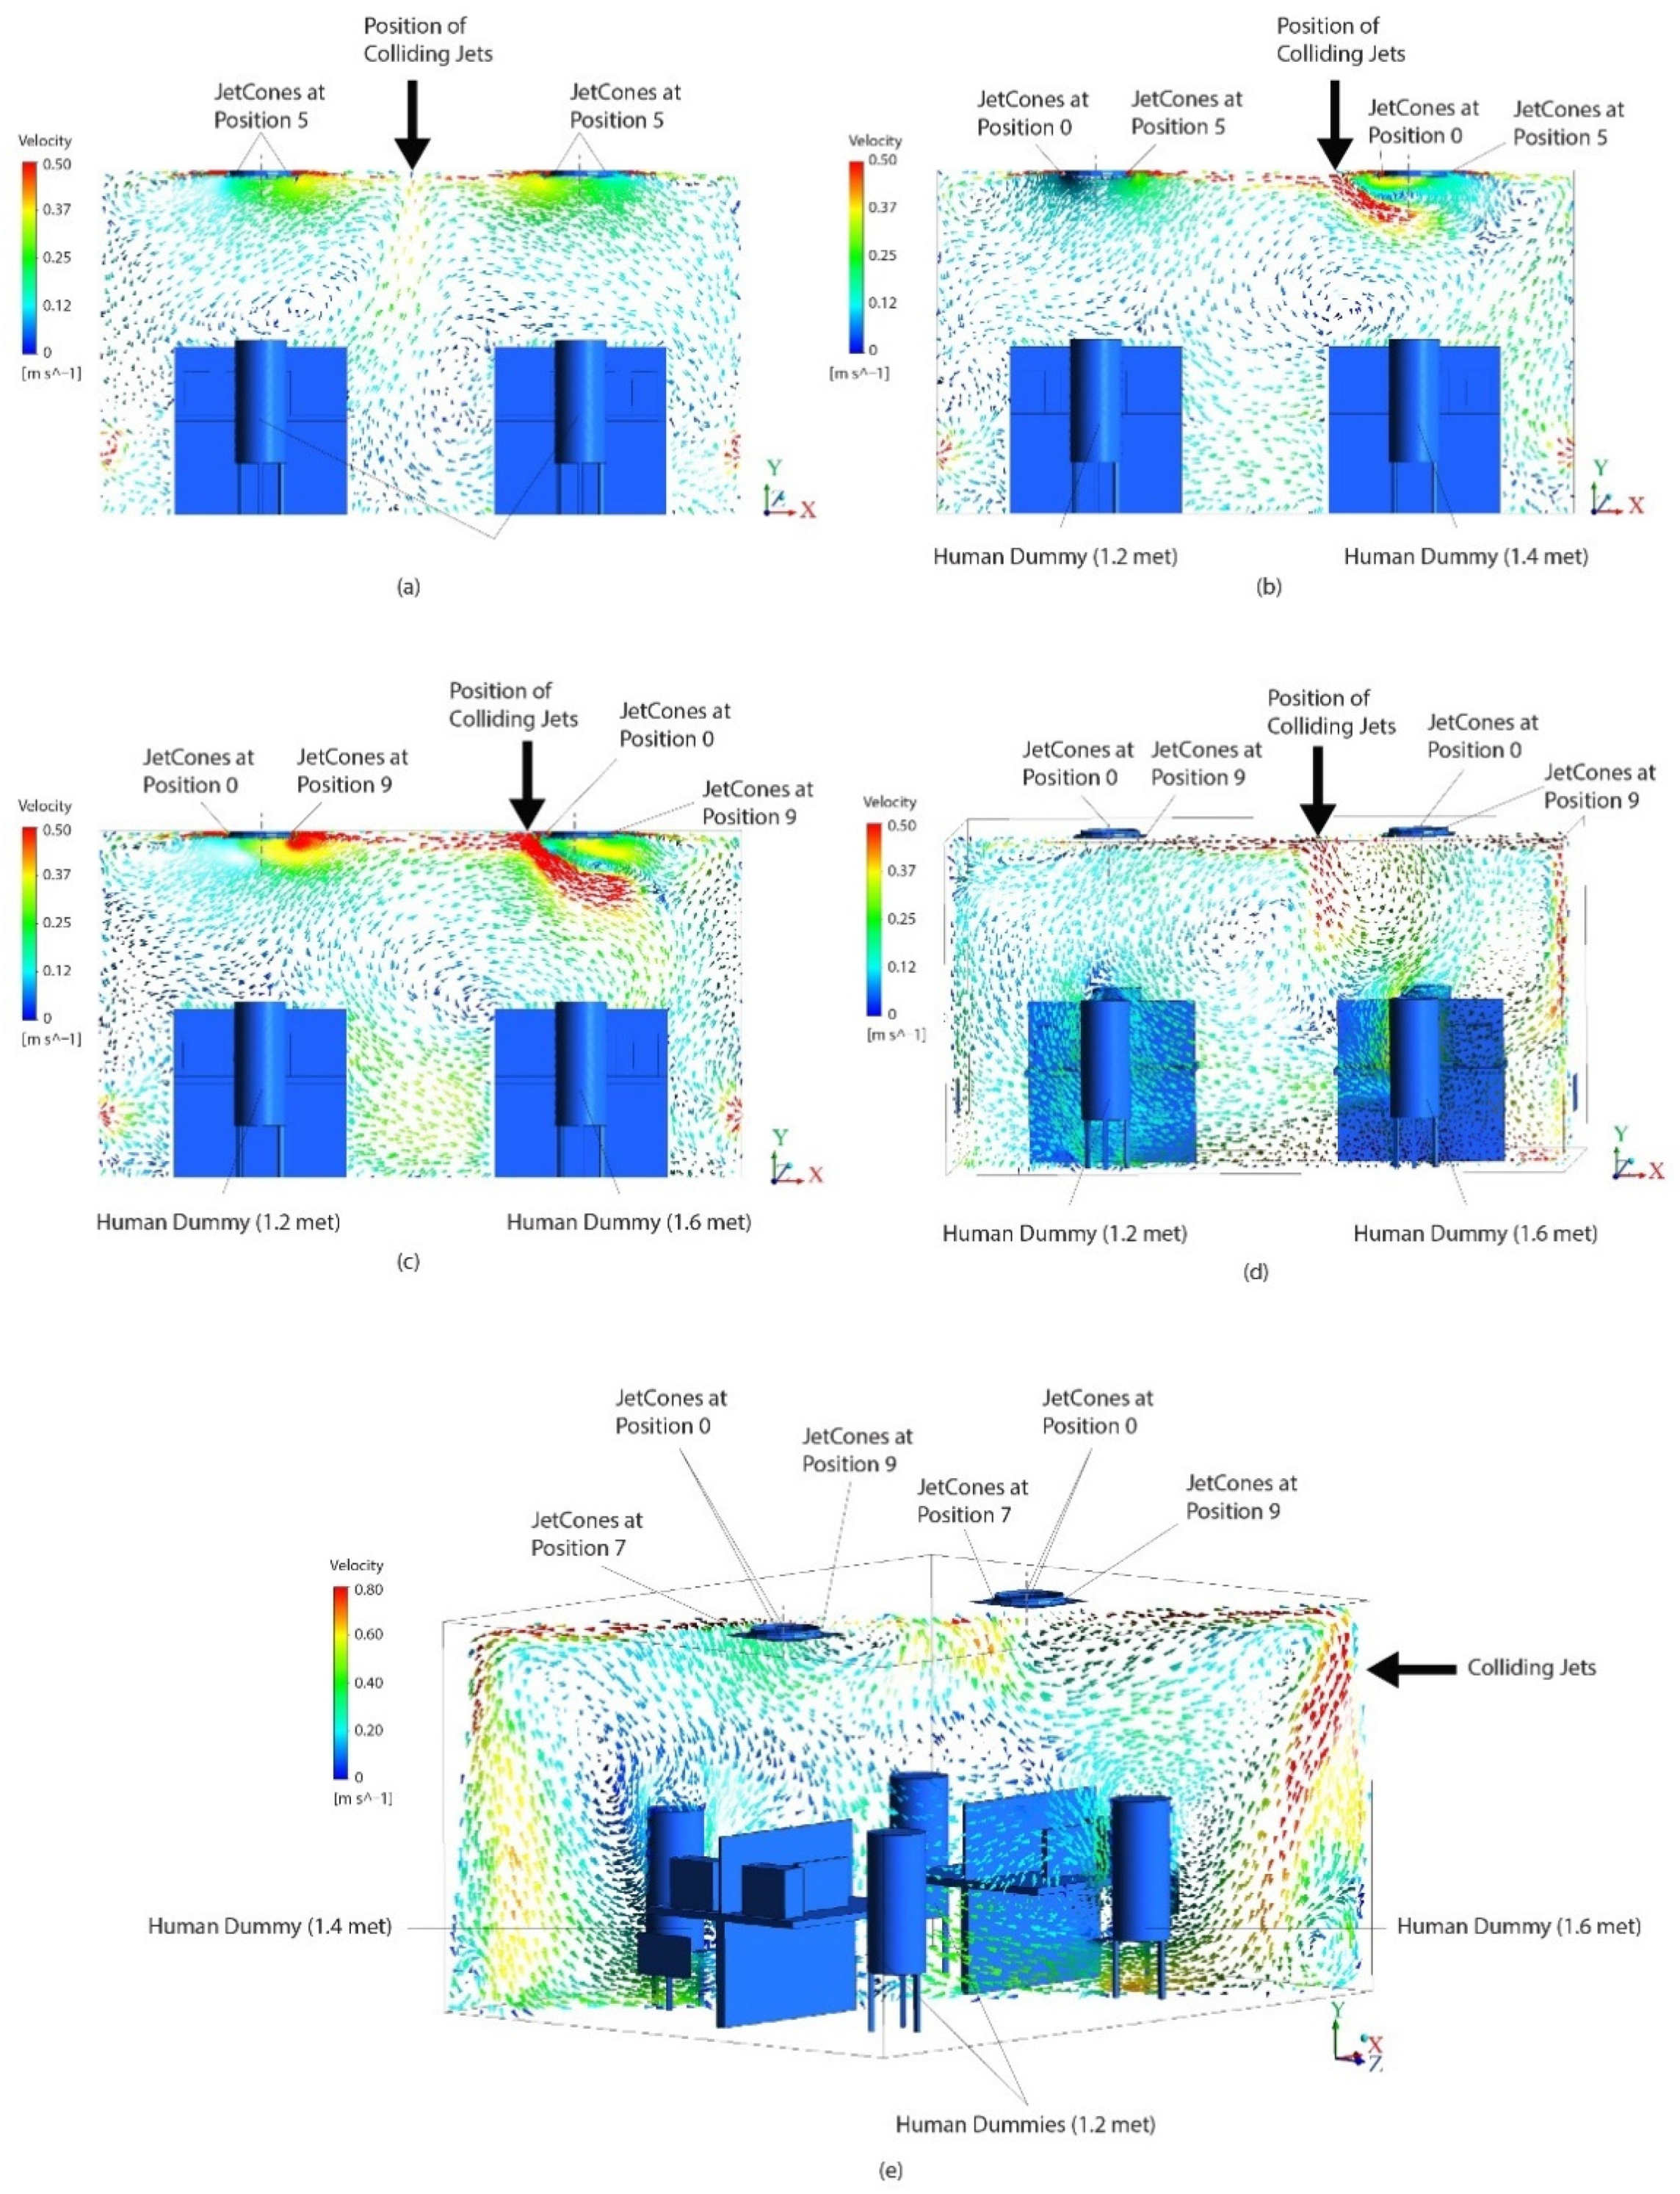
Figure 6.
Airflow distribution from the ACBs: (a) case 1, (b) case 2, (c) case 3, (d) case 4, and (e) case 5.
Figure 6 shows the movement of colliding air jets from the two ACBs in an office room. The air velocities up to 0.8 m/s were reached following the collision of supply jets near the ceiling. Figure 6a–c shows that high speed colliding jets are moved (from the center) to the right side of the room by changing the JetCone positions from 0 to 9. In Figure 6b,c it was observed that higher air velocities are seen around dummies with 1.4 and 1.6 met due to the change in position of JetCones from 5 to 9, respectively. The single zone with metabolic rate of 1.6 met in case 4 was dealt with by directing higher air velocity jets towards one corner of the room with JetCone adjustments. Figure 6d shows the 2D velocity plane 1 m away from the center of the room to show the shift in colliding jets from the center to the high metabolic zone, i.e., zone 1. Figure 6e shows the 3D illustration of case 5, where two dummies (positioned diagonally) were supplied with two different velocity streams from the two ACBs. The JetCones were positioned (as shown in Figure 6e) to supply maximum air velocities (up to 0.8 m/s) to the dummy with 1.6 met and up to 0.6 m/s air velocities to the 1.4 met dummy; whereas the airflow to human dummies with 1.2 met was kept unchanged. To observe the precision of airflow distribution in the occupied part of each zone, the air velocity vectors at heights of 0.1 and 1.1 m from the floor were taken for each case. The JetCones in ACBs were positioned (as in Table 2) to create micro-climate zones with respect to occupants’ metabolic rates as shown in Figure 7, Figure 8, Figure 9, Figure 10 and Figure 11.

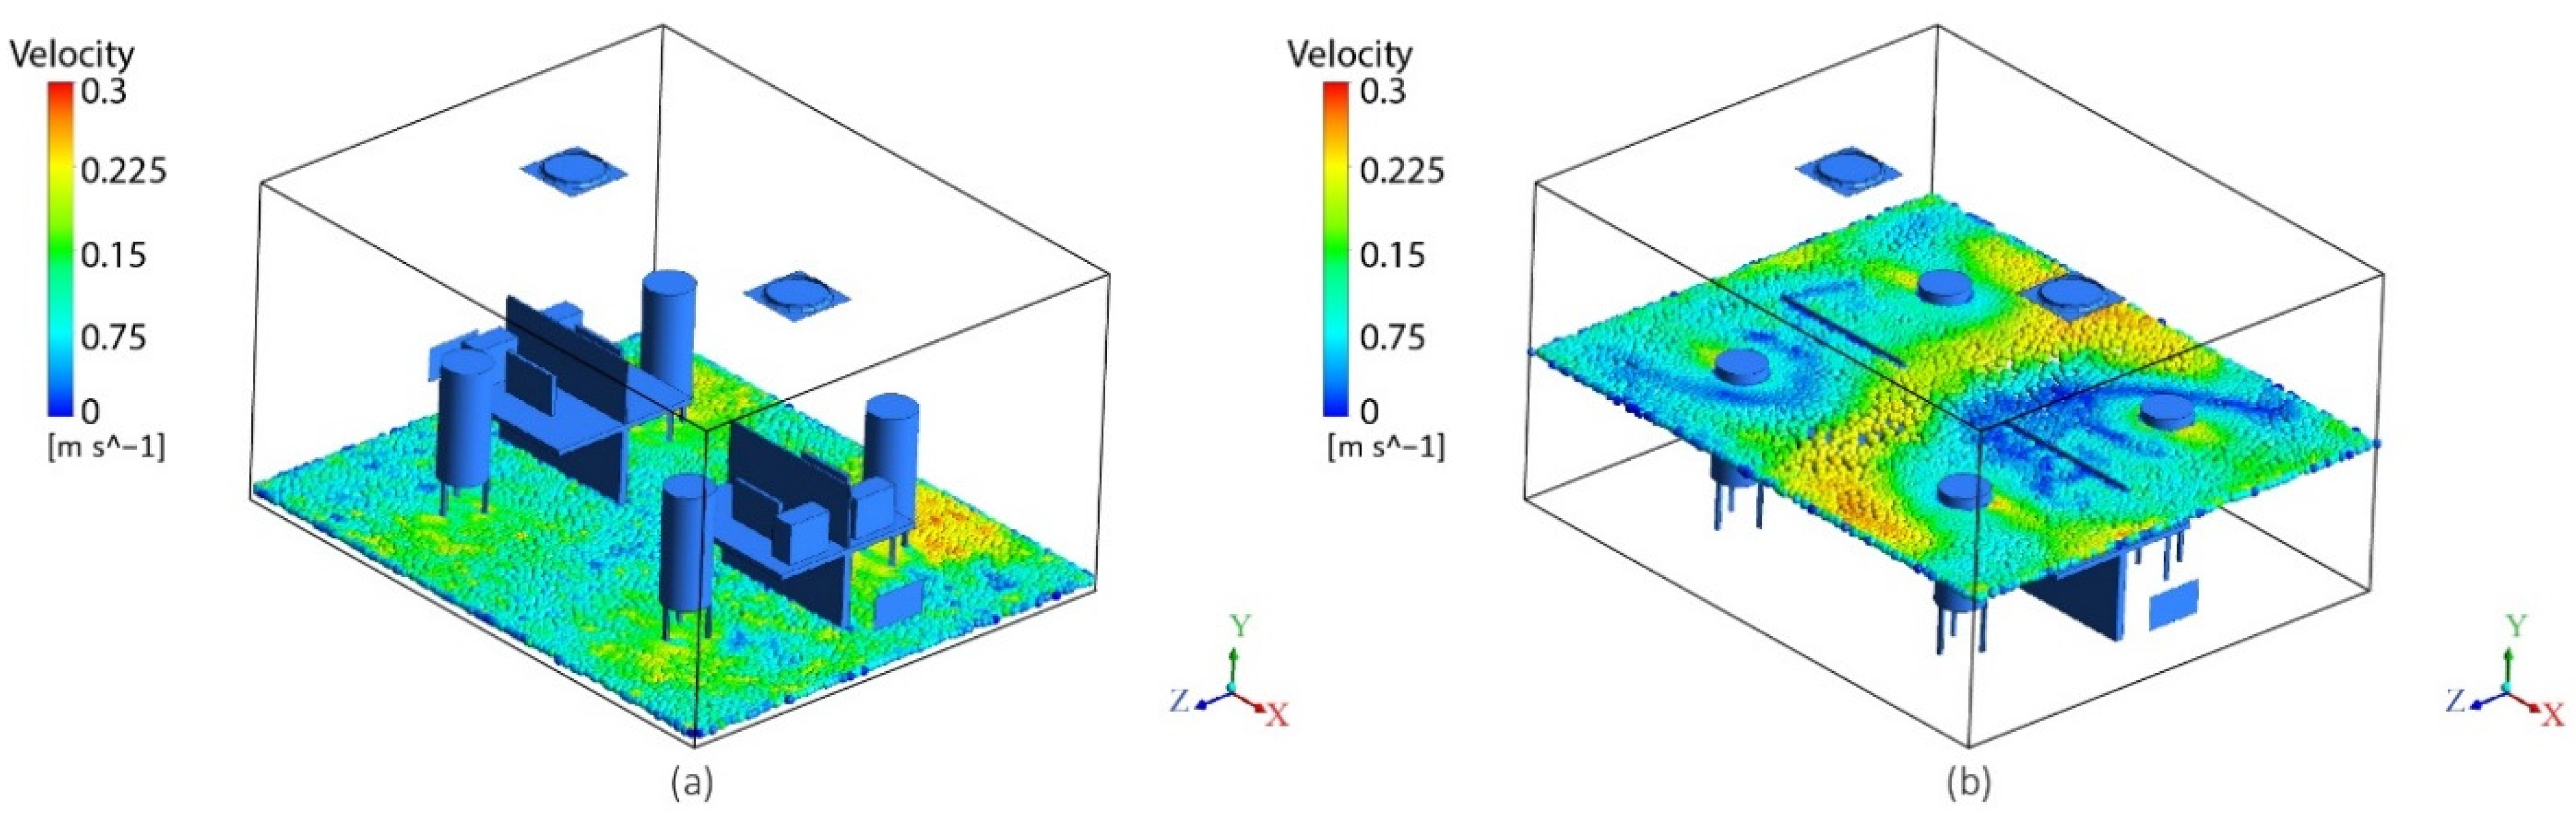
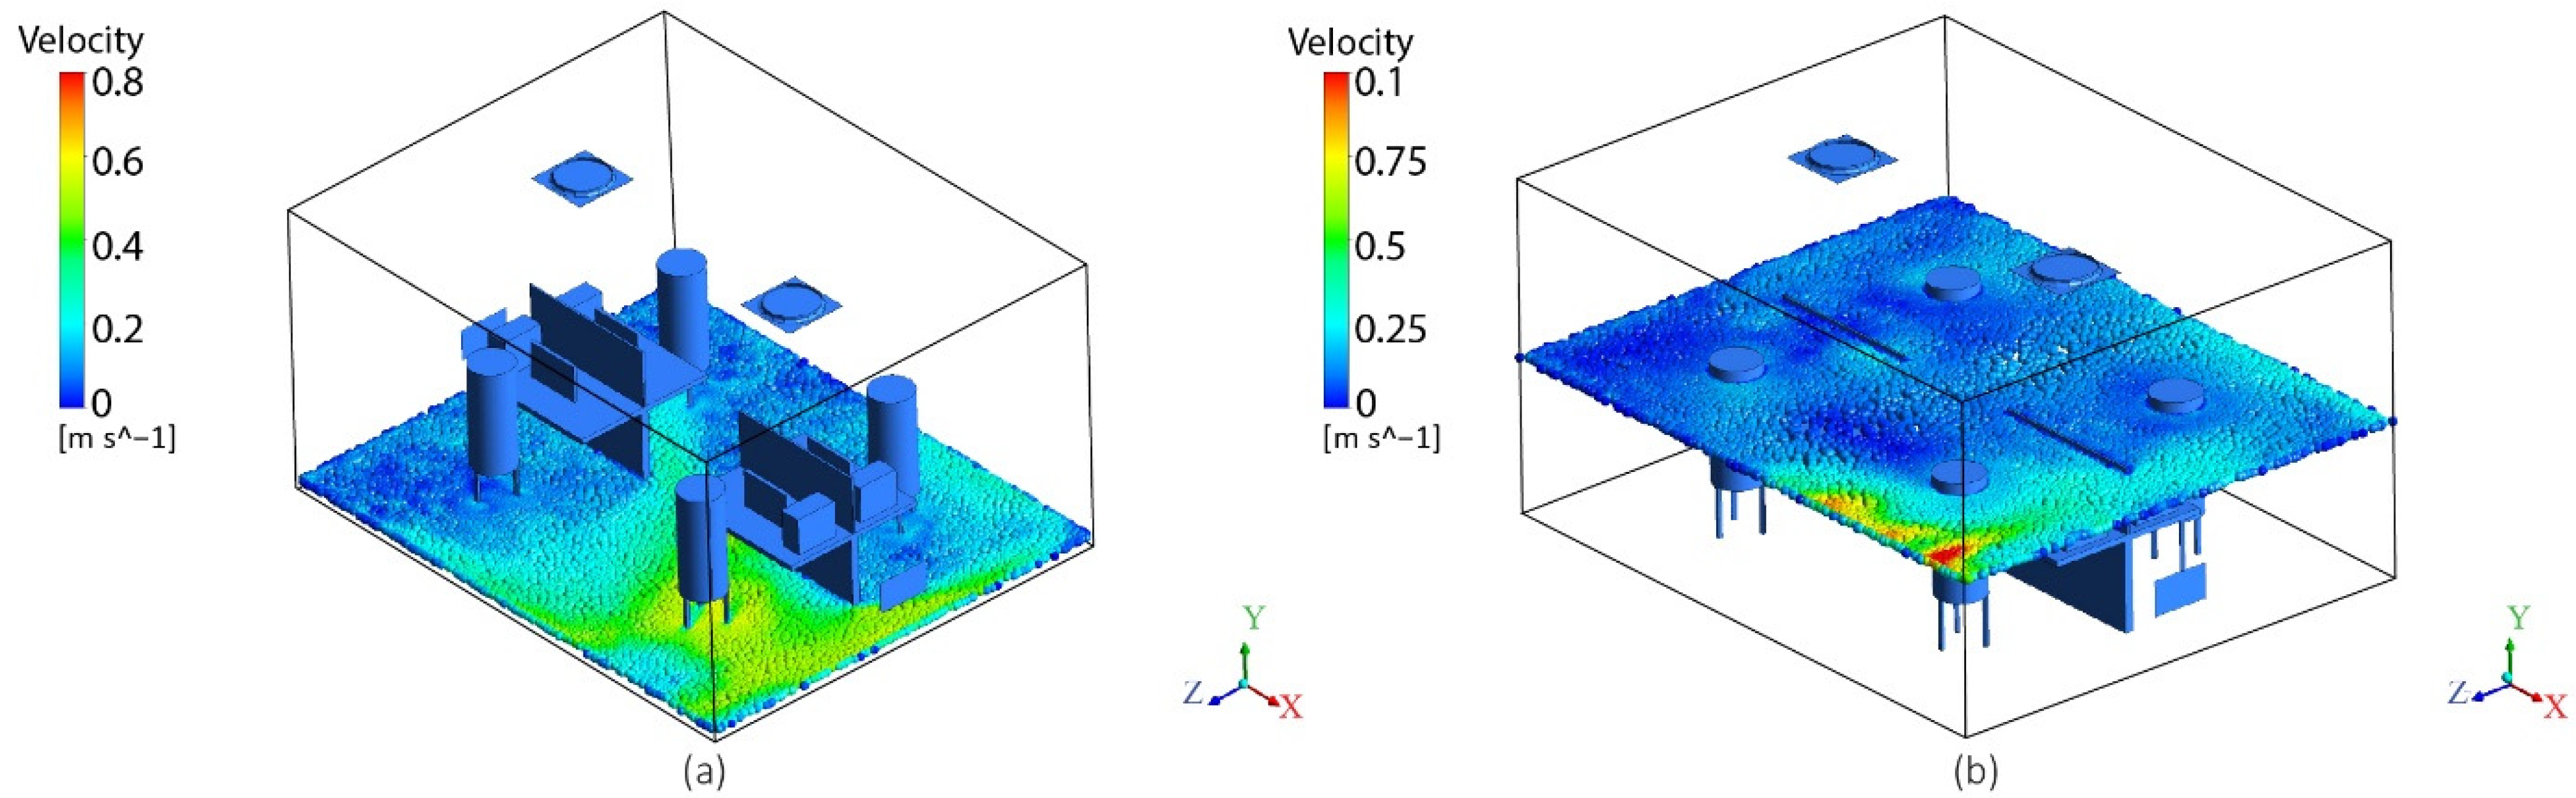
Figure 7.
Case 1 air velocity distribution: (a) 0.1 m from the floor and (b) 1.1 m from the floor.

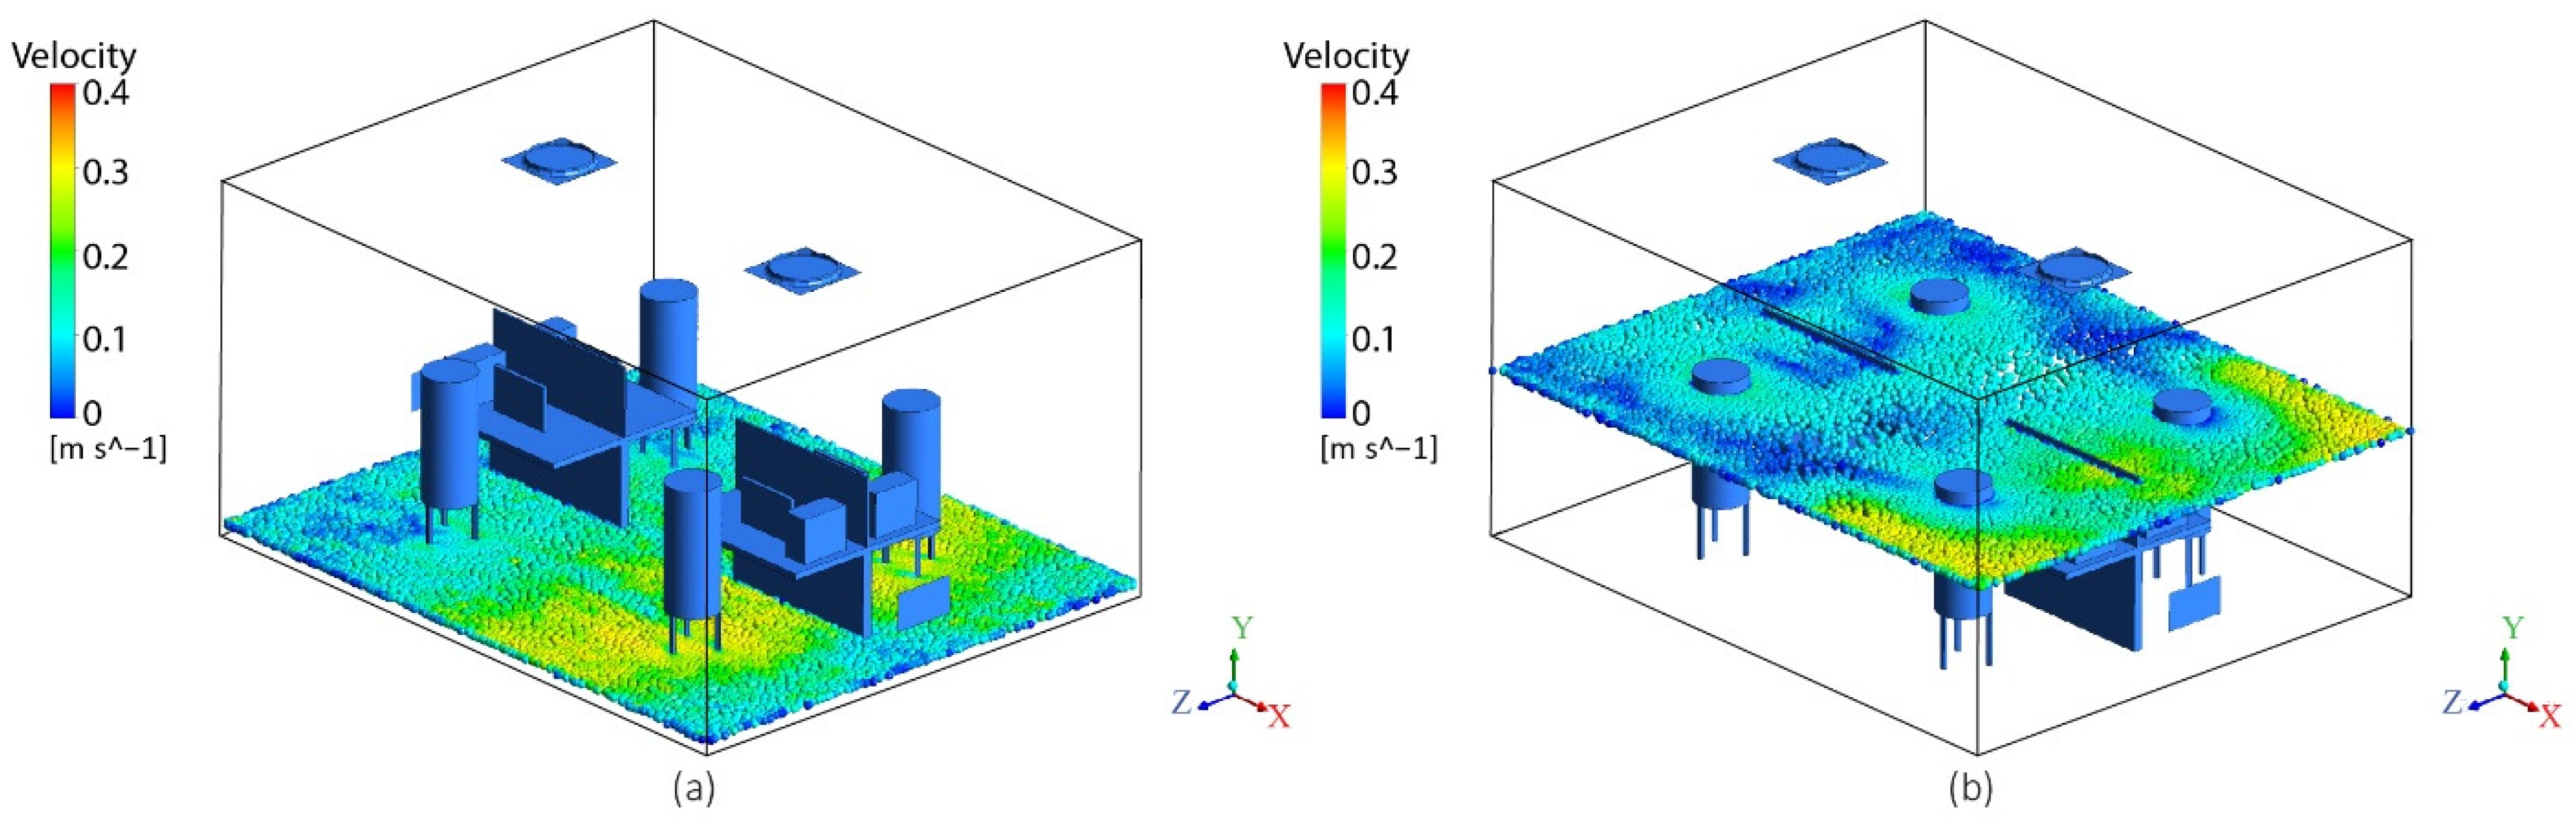
Figure 8.
Case 2 air velocity distribution: (a) 0.1 m from the floor and (b) 1.1 m from the floor.

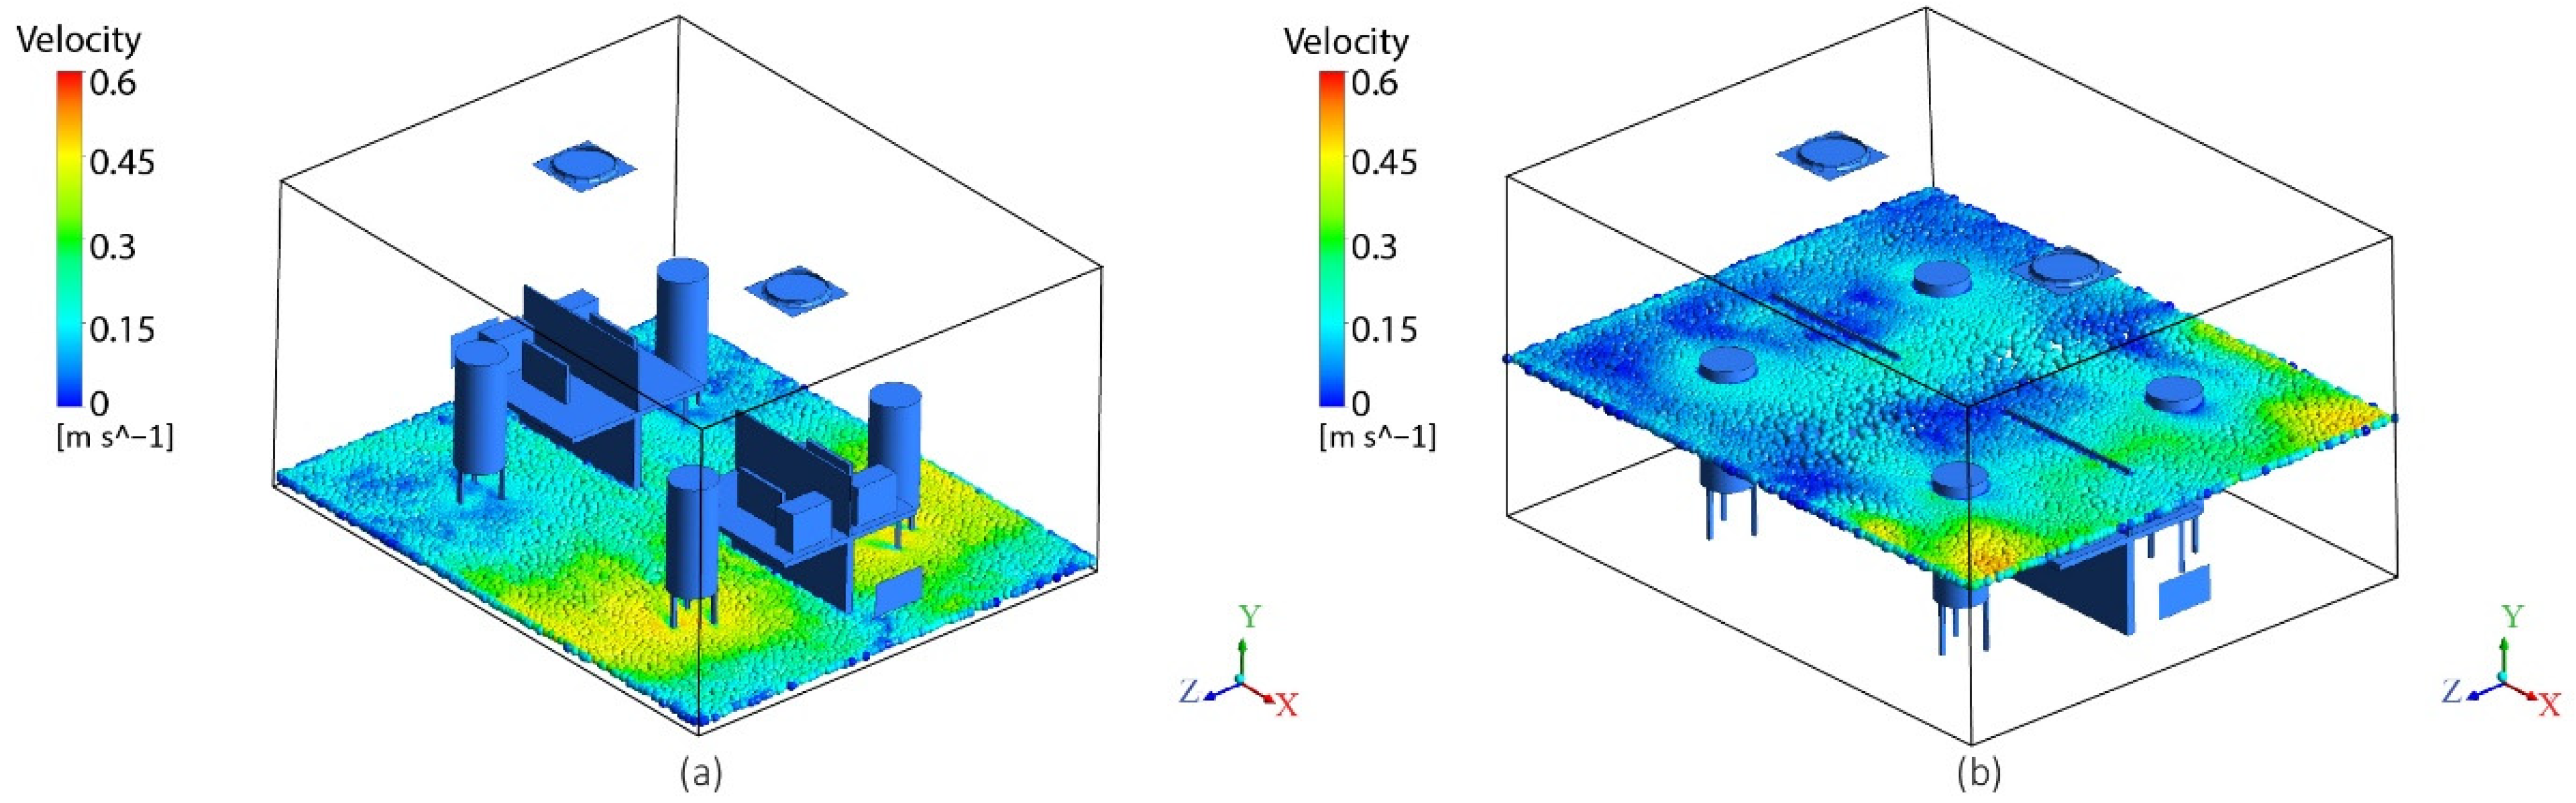
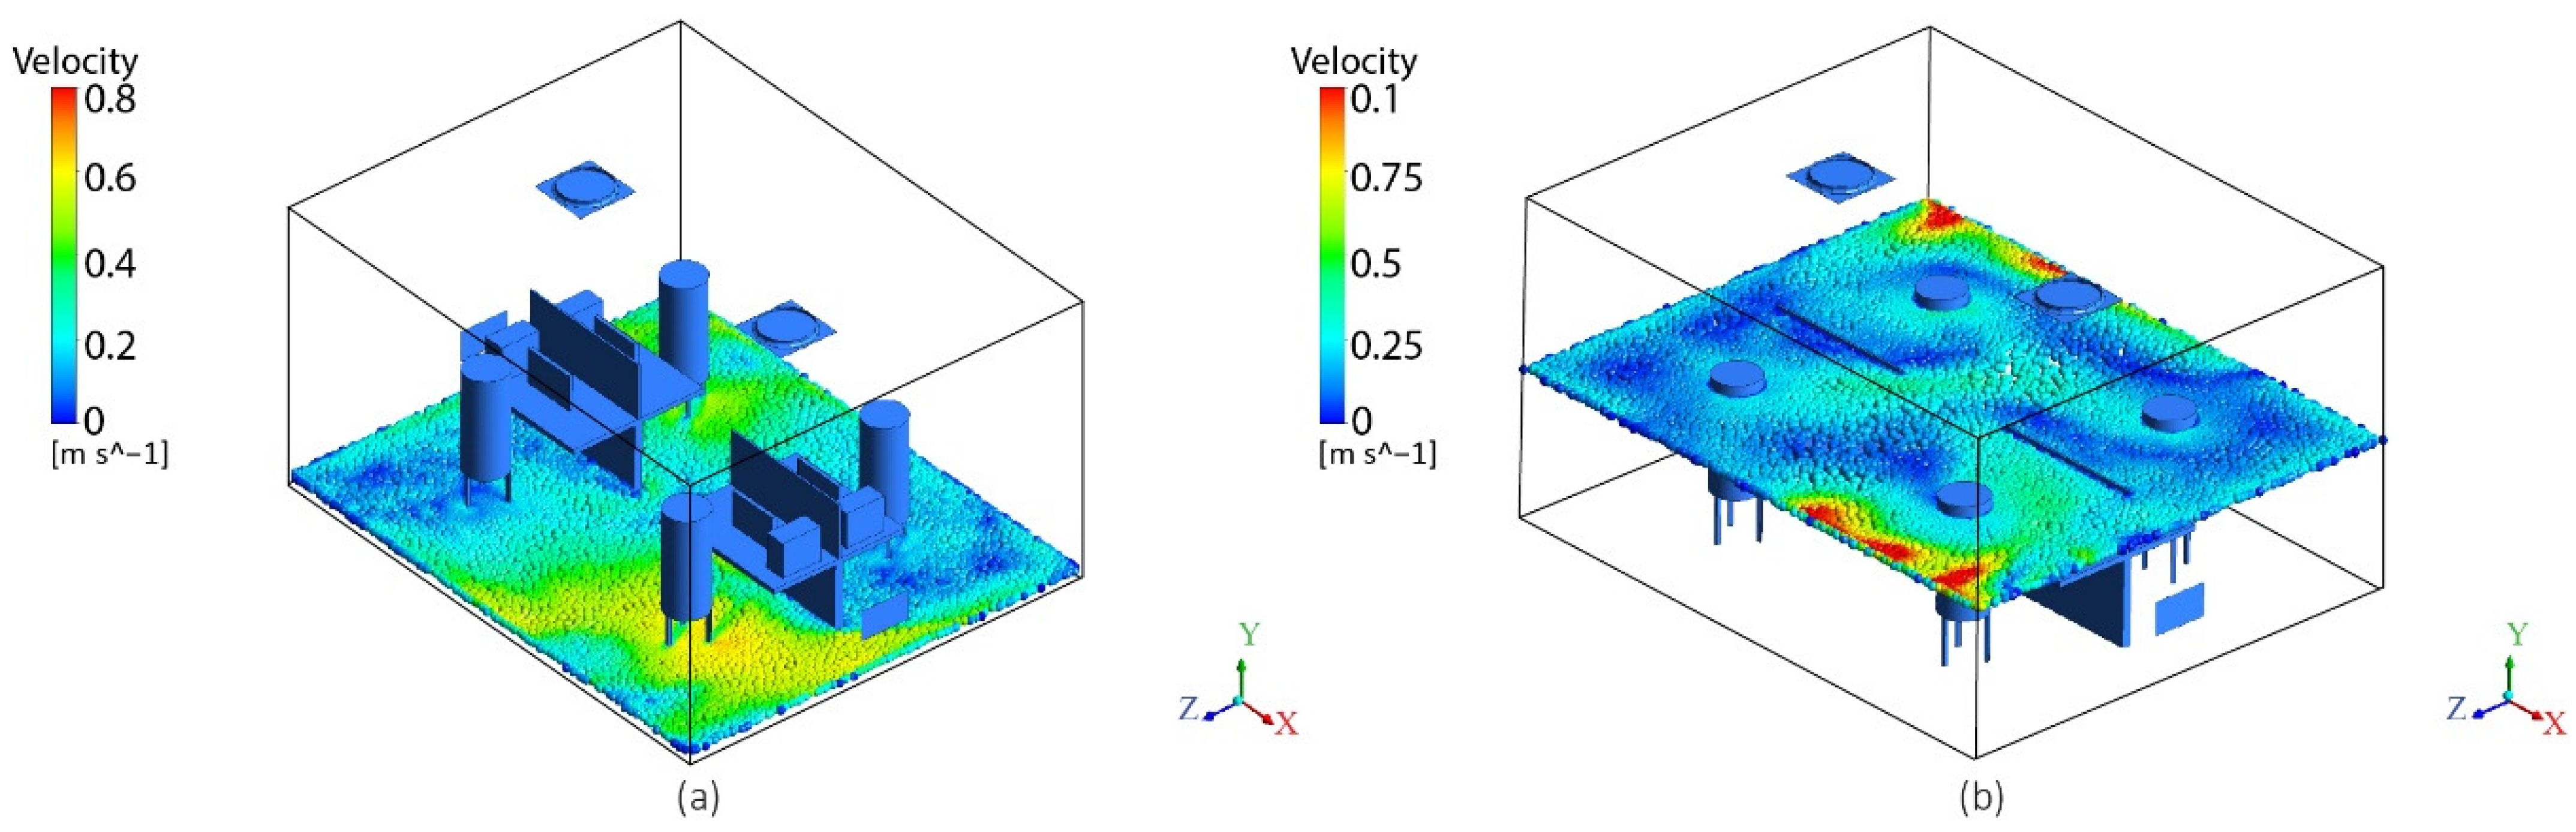
Figure 9.
Case 3 air velocity distribution: (a) 0.1 m from the floor and (b) 1.1 m from the floor.

Figure 10.
Case 4 air velocity distribution: (a) 0.1 m from the floor and (b) 1.1 m from the floor.
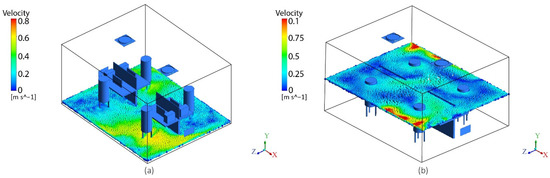
Figure 11.
Case 5 air velocity distribution: (a) 0.1 m from the floor and (b) 1.1 m from the floor.
Figure 7, Figure 8, Figure 9, Figure 10 and Figure 11 show that different velocity zones can be established by moving the colliding jets from the center towards or away from the occupancy zones. This movement of jets was used to create high- and low-velocity zones according to the metabolic rates set for the human dummy. Figure 7 shows the basic case where all dummies had the same metabolic rates, i.e., 1.2, and all four zones were supplied with uniform air velocities. The average air velocities for all four zones were kept at 0.15 m/s, due to the low metabolic rates. The pin positions of both the ACBs in this case were kept at position 5 in order to keep high momentum created by the collision of air jets at the center of the room (away from the four seating zones). In Figure 8 and Figure 9, the high-velocity colliding jets are directed from the center to (zones 1 and 2) the dummies with metabolic rates of 1.4 and 1.6 met, respectively. The average air velocities in these high-velocity zones (zones 1 and 2) for cases 2 and 3 were raised to 0.35 and 0.45 m/s, respectively. This maintained the internal body heat balance and individual thermal comfort. Case 4 (Figure 10) shows velocity changes in only one zone (zone 1) for achieving individual thermal comfort of the dummies with metabolic rates (higher heat release) of 1.6 met. The JetCones of the two ACBs were positioned (see Table 2) to increase the average air velocities of zone 1 to 0.6 m/s. However, the velocities of zone 4 in the same case were also seen to increase at (points D4a and D4b) 0.1 m from the floor (see Figure 10a). Figure 11 shows a case with a combination of metabolic rates (1.2, 1.4, and 1.6 met) in a single office space. The pin positions were adjusted to have air velocities of 0.15, 0.45, and 0.55 m/s in the specific zones with human dummies with metabolic rates of 1.2, 1.4, and 1.6 met, respectively. The results of this case show that precision ventilation can be achieved by creating low- and high-velocity zones in different combinations by targeting the airflow according to the metabolic requirements.
3.2. Air-Temperature Distribution
Vertical air temperature difference plays an important role when considering local discomfort. The problem with local discomfort through the vertical temperature difference is mainly observed in displacement ventilation systems where the airflow supply is near the floor [46]. In mixing ventilation, the local discomfort caused by the vertical temperature difference is low due to adequate turbulent mixing between supply and room air. Figure 12 shows the vertical air-temperature distribution for all five cases measured at 16 different points (see Figure 3). The vertical temperature gradient in the occupied zone (up to a height of 1.8 m from the floor) in all cases was found to be comparatively less than the temperature gradient between the floor and ceiling heights.
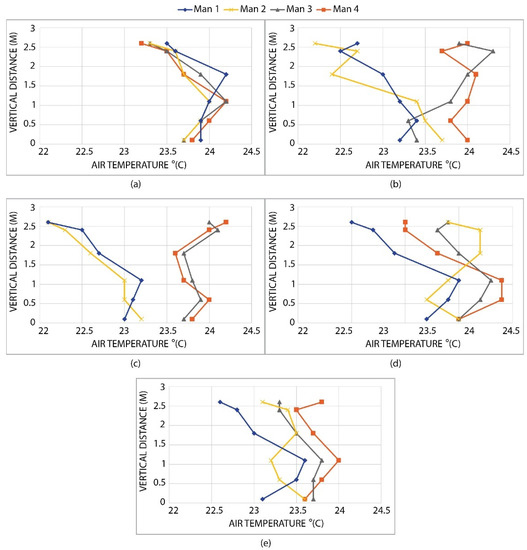
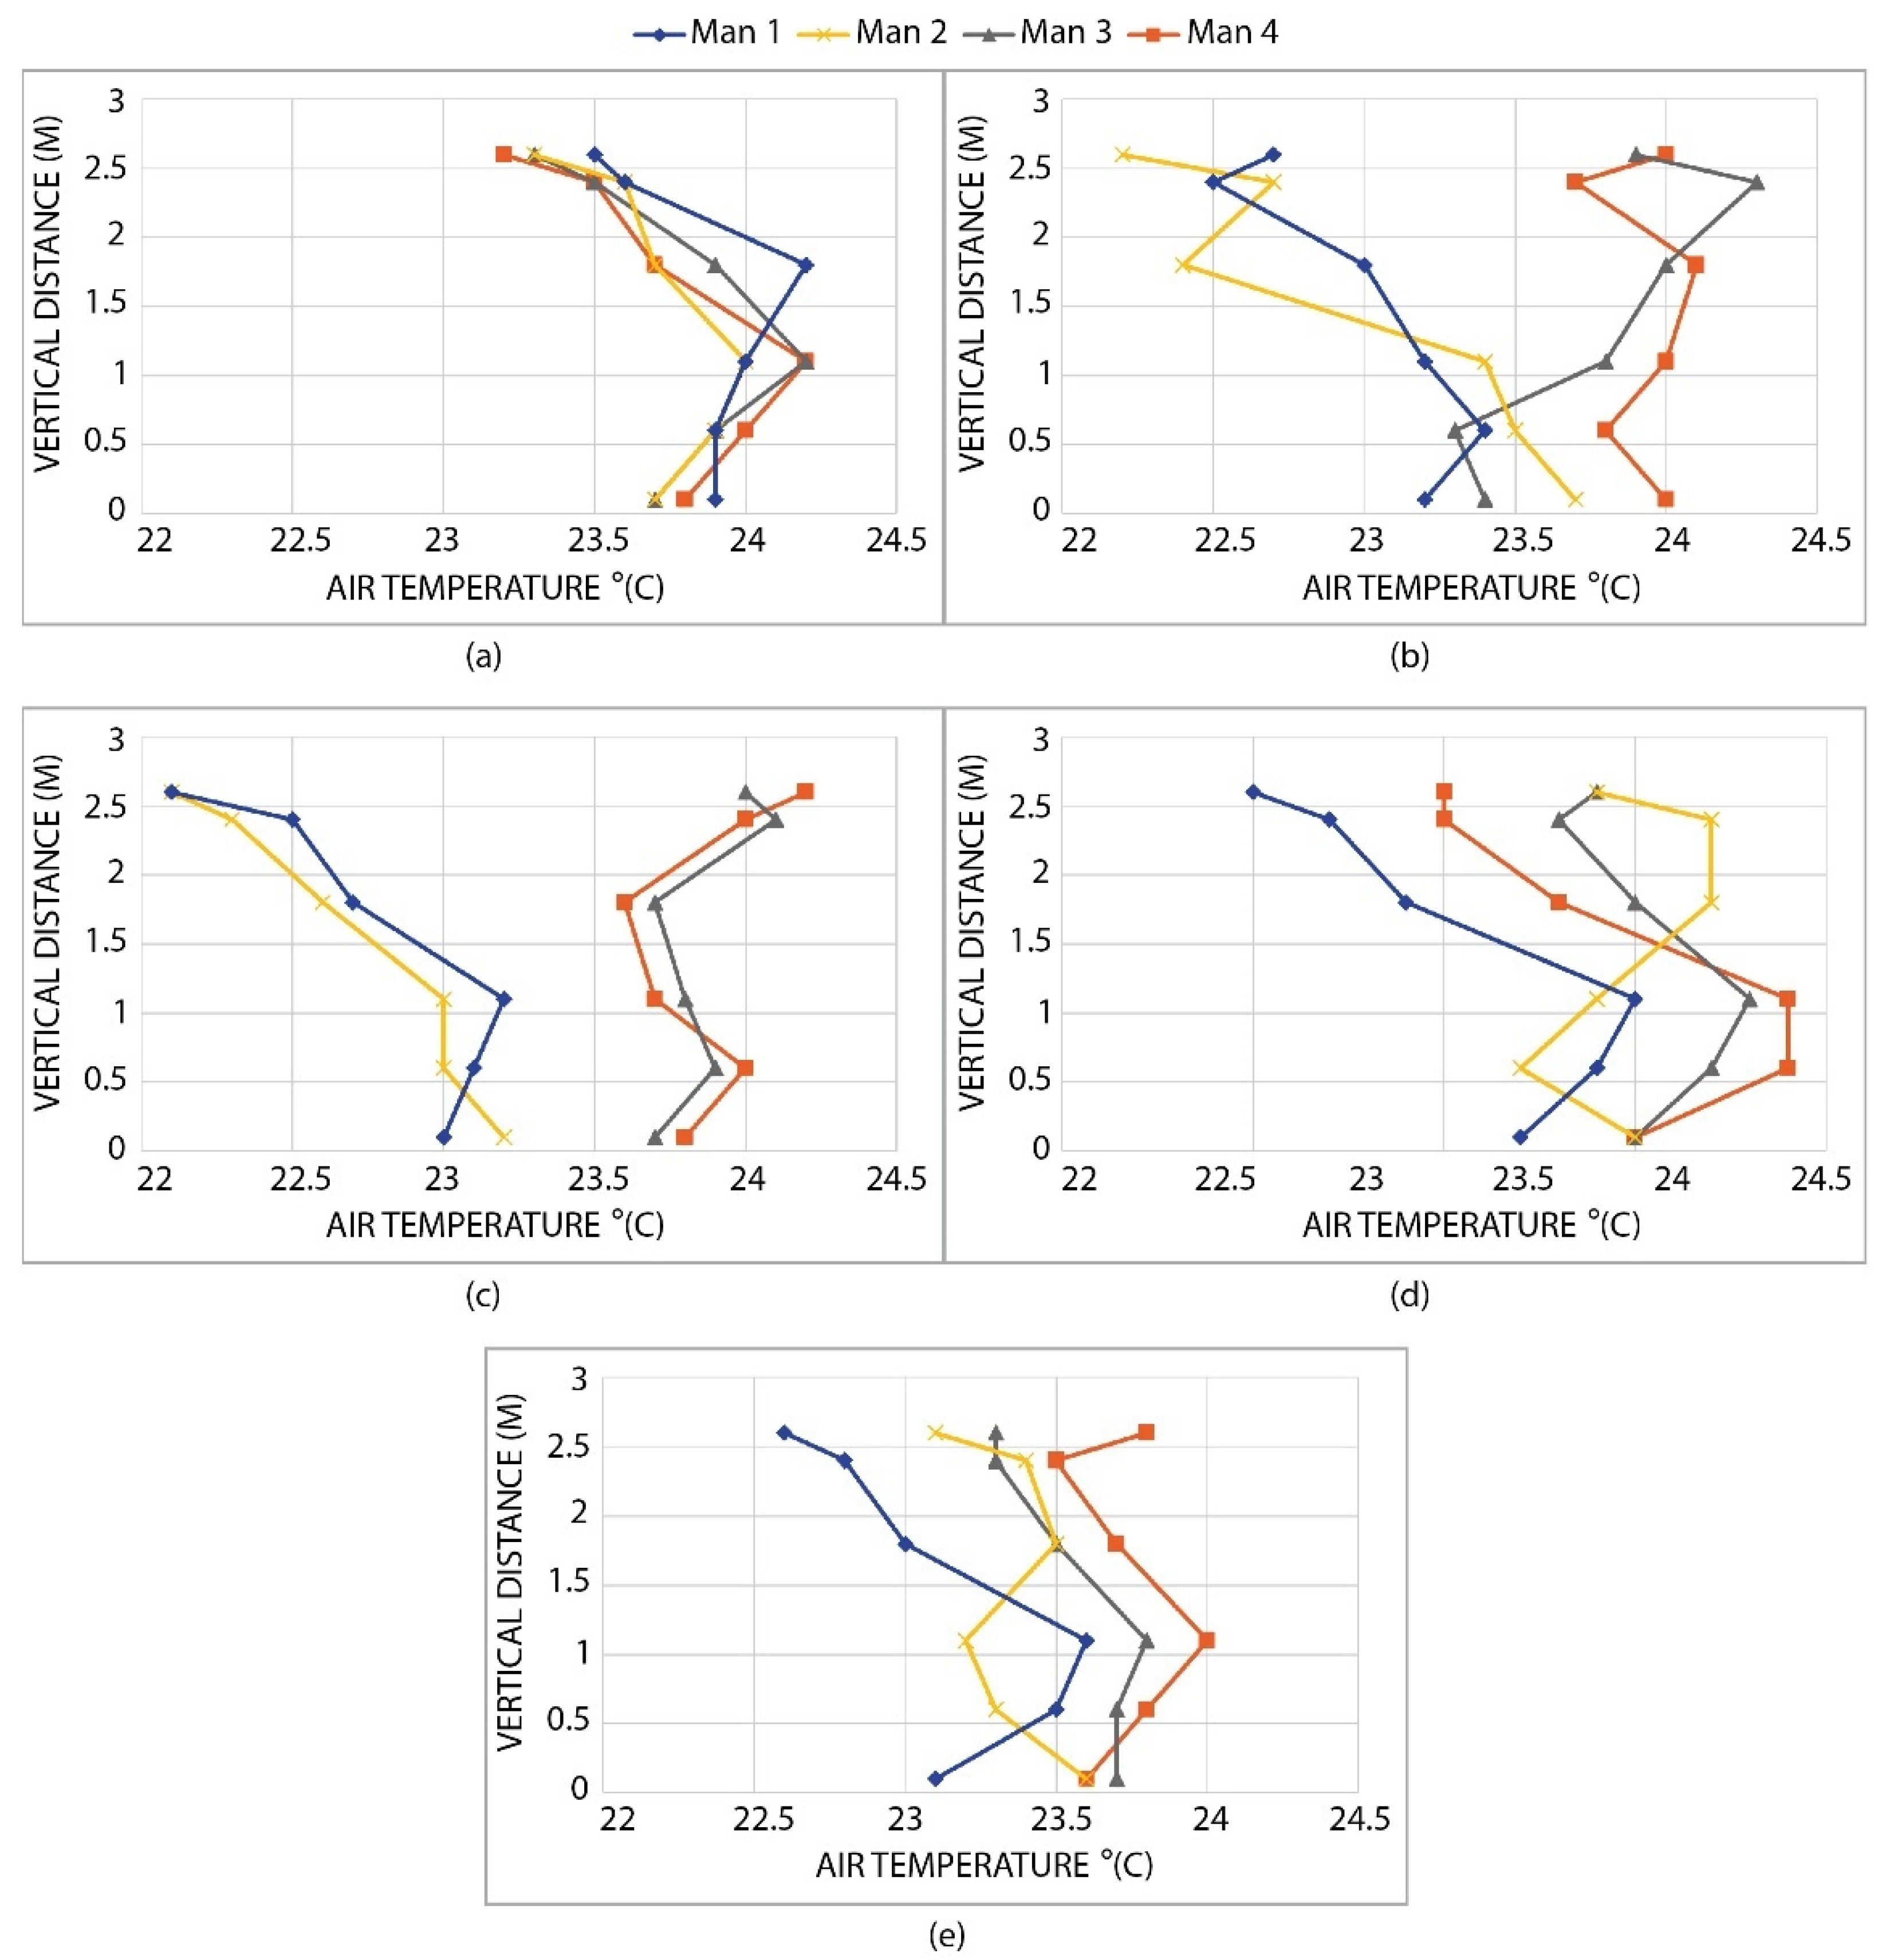
Figure 12.
Measured vertical air temperature distribution: (a) case 1, (b) case 2, (c) case 3, (d) case 4, and (e) case 5.
In case 1, the temperature difference for all points was less than 1 °C due to a uniform thermal environment (see Figure 12a). In cases 2 and 3, the airflow is directed more towards zones 1 and 2. Hence, the colliding jets (with higher momentum and lower temperature) were moved towards zones 1 and 2 from the ceiling. The temperature near the ceiling (the height of the seated persons) above zones 1 and 2 was found to be 0.5 °C less than in zones 3 and 4. Hence, a temperature stratification up to 1.5 °C was observed in high-velocity zones 1 and 2, compared to 1 °C for zones 3 and 4 (Figure 12b,c). In Figure 12d,e, the results of cases 4 and 5 show that the maximum vertical temperature gradient of 1.5 °C was reached, which is within an acceptable thermal limit [47]. The literature shows that greater airflow results in lower vertical temperature difference in the room [48]. However, in precision ventilation, greater airflow in any zone is supplied to the zone where there is more heat release and the vertical temperature difference is seen to be slightly increased above that specific zone. In addition to this, no substantial increase in horizontal temperature difference was observed in any case. The horizontal air temperature difference (from the north to the south side of the room) in all cases was found to be within the ±1 °C range.
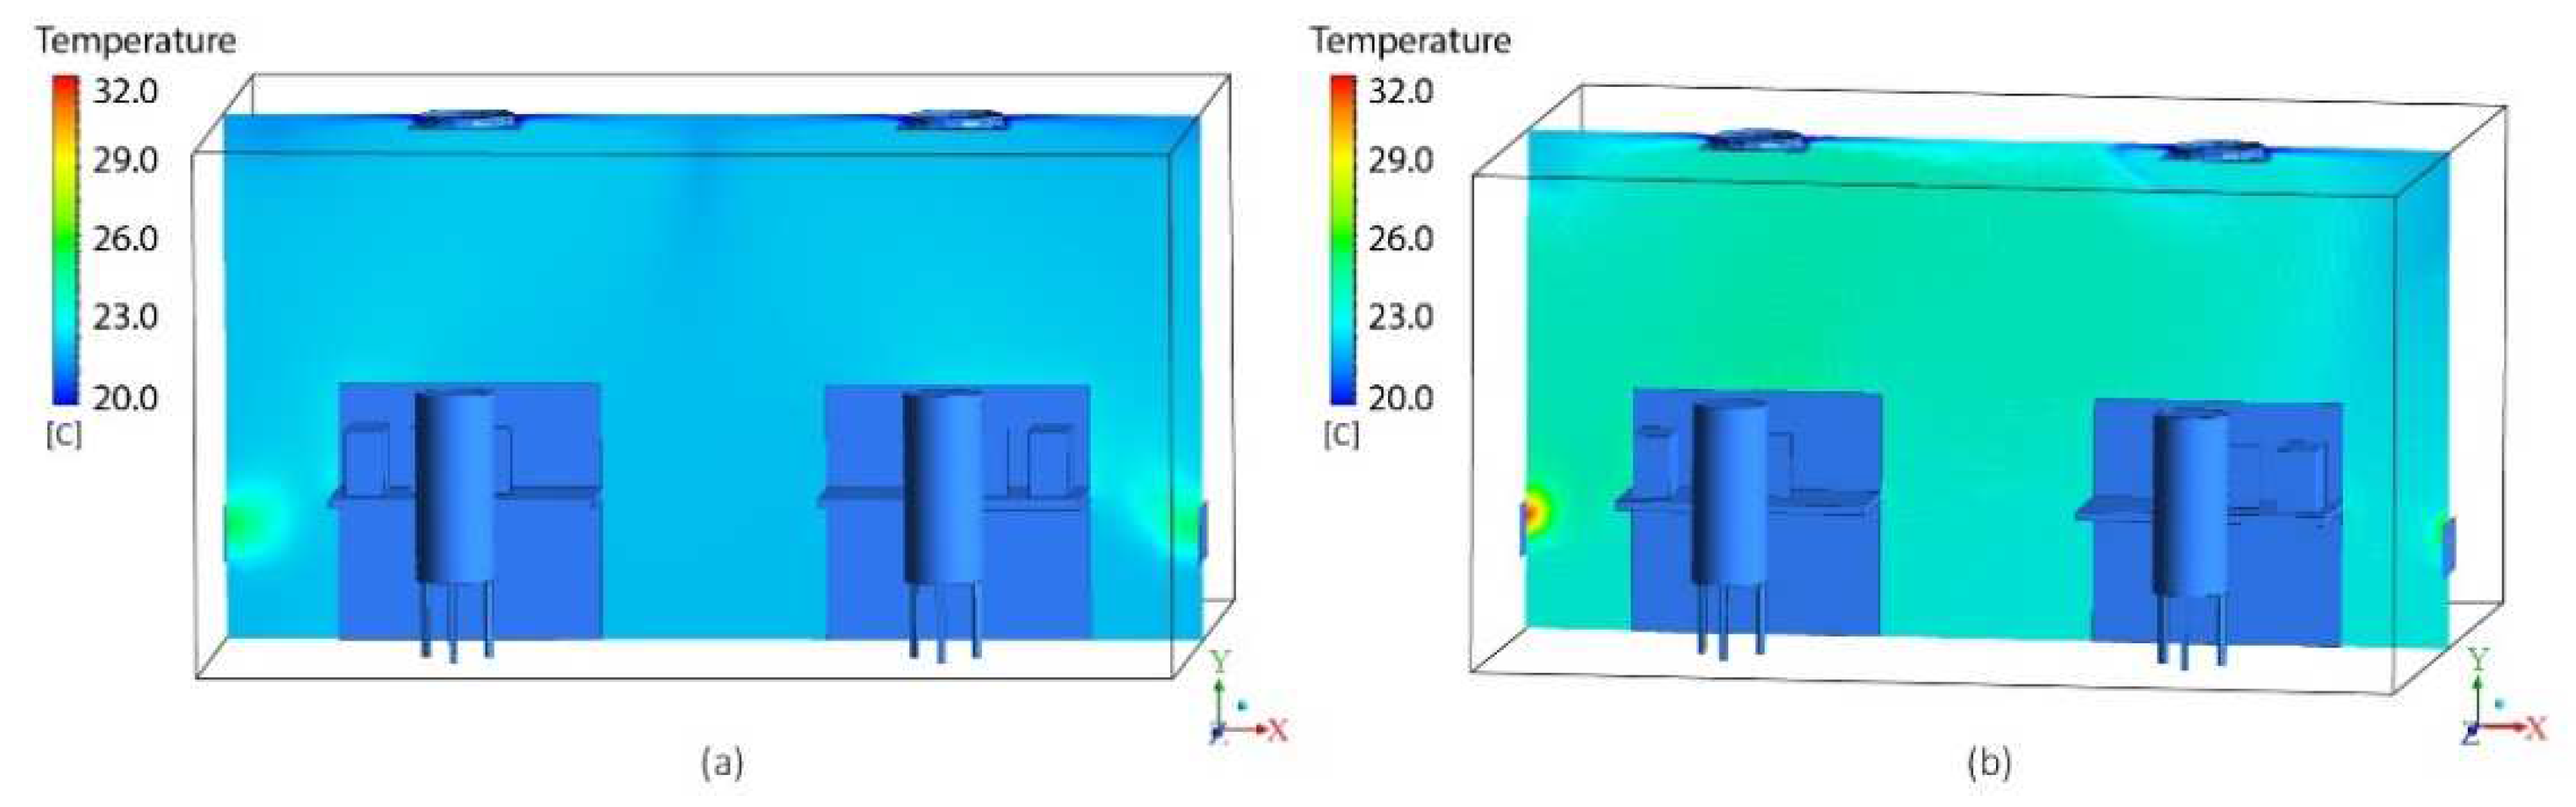
One of the main characteristics of mixing ventilation, to maintain thermal uniformity, was fulfilled through these results. This thermal uniformity was maintained by providing cooling power to balance the heat released from the heat sources in the room. Figure 13 shows the temperature contours of the two selected cases (1 and 3). For all cases, temperature contours were identical to the experimental results with an average room air temperature of 23 °C. Figure 13b shows that thermal uniformity is maintained even when supply air jets at 20 °C are pushed towards a specific side of the room. The temperature difference between the supply air and room air was maintained at around 3.5 K. Room temperatures can be raised in cooling modes to save energy while maintaining thermal comfort by utilizing higher air velocities. This reduction in energy use by increasing room temperatures can lead to an improvement in the overall energy efficiency of the system, hence providing optimal and flexible energy management [49,50].

Figure 13.
Simulated temperature contour across the central plane of the room: (a) case 1 and (b) case 3.
3.3. PMV-PPD Calculations
PMV and PPD thermal comfort calculations were calculated based on experimental and simulation data from all five cases. The PMV and PPD values at the height of a seated person are determined by taking mean values of air temperature, radiant temperature, and air velocity at 16 different positions (see Figure 3b). The mean values were taken at heights of 0.1, 0.6, and 1.1 m, respectively. The PMV and PPD were calculated from the expressions (2) and (3). The PPD is the function of PMV and was plotted in Figure 14. The PMV and PPD points were plotted after this using measured and assumed variables, as shown in the graphs below.
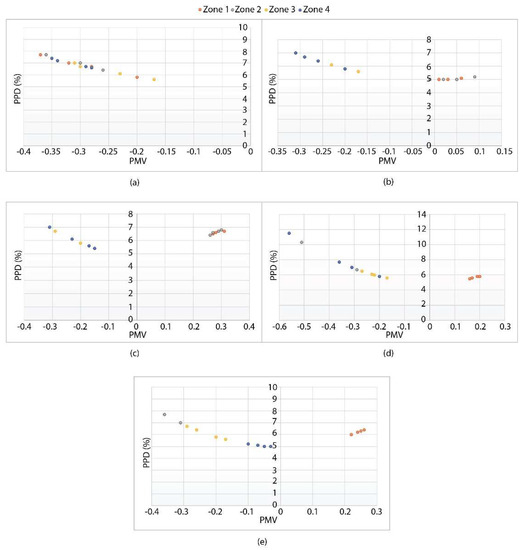
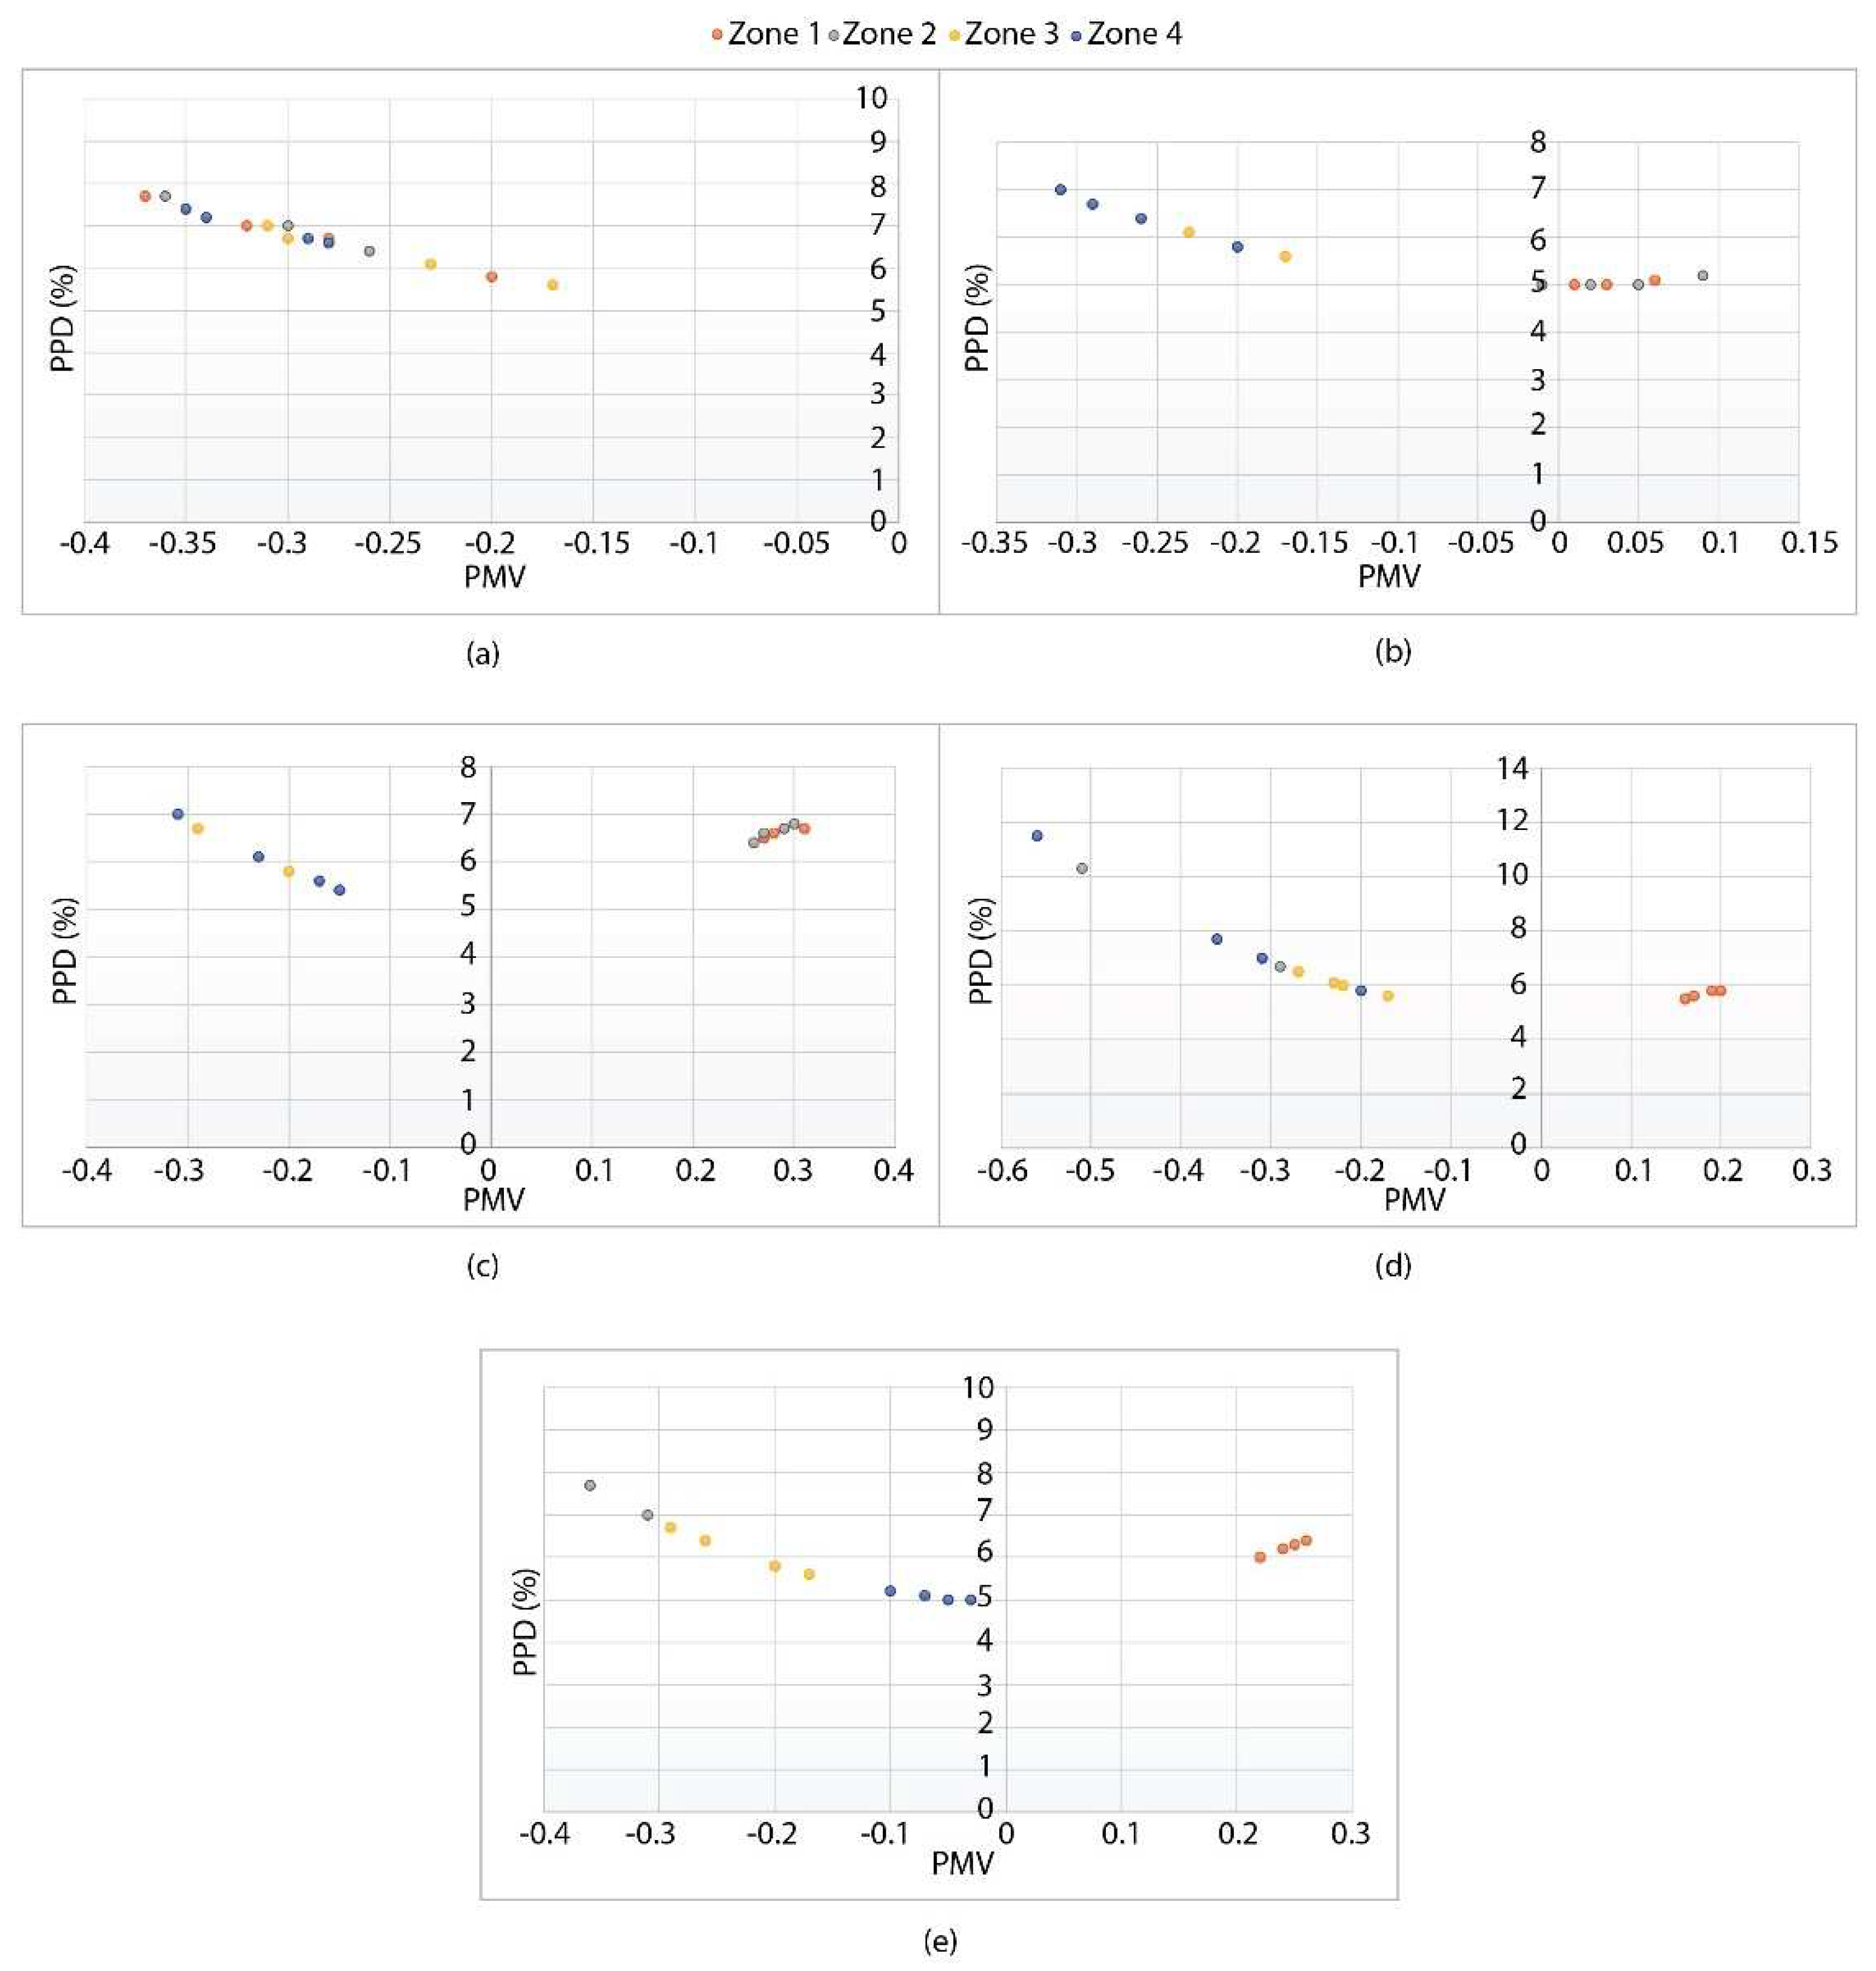
Figure 14.
PMV and PPD: (a) case 1, (b) case 2, (c) case 3, (d) case 4, and (e) case 5.
In case 1, Figure 14a shows that ACBs airflow distribution was kept symmetrical and PMV values are found within the acceptable thermal range of −0.5 to +0.5 [18]. The PPD values are also less than 10%. Figure 14b,c show PMV-PPD values for cases 2 and 3, where thermal comfort range is maintained by providing higher air velocities to zones 1 and 2. At the same time, PMV-PPD values were maintained for zones 3 and 4 (dummies with a metabolic rate of 1.2 met) by directing less airflow to these zones. Case 4 shows the individual thermal comfort for zone 1 and PMV values are seen to be between 0.2 and 0.3. In case 4, the PMV-PPD values for zone 4 also seem to get slightly affected from the high-velocity zone, i.e., zone 1 (see Figure 14d). Furthermore, the PMV values are increased up to 0.6% and PPD up to 11.5%, but overall PPD values show that more than 80% of occupants were satisfied. Case 5 included a combination of metabolic rates and ACB pin adjustments, which were used to keep the PMV values within the −0.5 to +0.5 range, and PPD less than 10% (Figure 14e). Hence, precision ventilation can effectively be applied to create multiple micro-climate zones for real office occupants with different metabolic rates.
4. Conclusions
The occupants with higher metabolic rates working in offices require higher air velocities to balance body heat. In this regard, a precision ventilation technique is used to maintain the individual thermal comfort according to ISO 7730 and ASHRAE 55 standards by creating high and low velocity zones. The collision of supply jets from the two ACBs resulted in maximum air velocities up to 0.8 m/s. These high-velocity colliding jets established micro-climate zones in an open-plan office through ACB’s JetCone adjustments. These JetCones adjustments moved these high velocity colliding jets to the targeted zones. The following conclusions were drawn from the experimental and CFD study:
- -
- The change in momentum caused by ACB JetCone adjustments resulted in up to three variable air velocity zones in the same office space. The human dummies with low metabolic rates (1.2 met) could be exposed to air velocities as low as 0.1 m/s. Whereas dummies with metabolic rates of 1.4 and 1.6 met were able to become exposed to 0.45 and 0.55 m/s air velocities, respectively.
- -
- The acceptable PMV range for thermal comfort i.e., −0.5–0.5, could be maintained for the occupants with high metabolic rates using airflow adjustments. This also led to an overall PPD of less than 10% for all five cases.
- -
- Controlling the microclimate solely for a single velocity zone, i.e., case 4 with two ACBs in a large office space showed PMV and PPD values slightly above acceptable limits.
- -
- The local thermal discomfort through the vertical temperature difference was not found to be a problem while implementing precision ventilation. Both vertical and horizontal temperature distribution in all cases was maintained with a temperature difference in the occupied zone of less than 1.5 °C.
5. Limitations and Further Work
This study highlighted the significance of jet interaction and colliding air jets from two ACBs for precision ventilation applications. Hence, colliding jets require more in-depth study as psychometric parameters such as the temperature of the room and plumes from the heat sources may affect the distribution.
Author Contributions
Conceptualization, H.L.; methodology, H.L.; software, H.L.; P.V.N. and C.R.B.; validation, H.L., G.H. and A.A.; formal analysis, H.L.; investigation, H.L.; resources, A.A. and C.R.B.; data curation, H.L.; writing—original draft preparation, H.L.; writing—review and editing, S.R., A.M.; visualization, A.A., G.H.; supervision, A.A., G.H., S.R., A.M.; project administration, A.A.; funding acquisition, A.A. All authors have read and agreed to the published version of the manuscript.
Funding
This research received no external funding.
Institutional Review Board Statement
Not applicable.
Informed Consent Statement
Informed consent was obtained from all subjects involved in the study.
Data Availability Statement
The data presented in this study are available on request from the corresponding author.
Acknowledgments
The authors express their appreciation to Lindab A/S for research support and funding.
Conflicts of Interest
The authors declare no conflict of interest.
Nomenclature
| Parameter | Description | Unit |
| ACB | Active chilled beams | - |
| AHU | Air handling unit | - |
| ASHRAE | American society of heating, refrigerating and air-conditioning engineers | - |
| ATD | Air terminal device | - |
| CFD | Computational fluid dynamics | - |
| HVAC | Heating ventilation and air conditioning | - |
| ISO | International organization for standardization | - |
| PMV | Predicted mean vote | - |
| PPD | Predicted percentage dissatisfied | - |
| RNG | Renormalization group | - |
| w | Total airflow in the room | L/s |
| Cp | Specific heat constant for air | J/(kg °C) |
| Δt | Temperature difference | K |
| q | Total heat load | W |
| fcl | Clothing surface area factor | - |
| hc | Convective heat transfer coefficient | W/(m2.K) |
| ta | Air temperature | °C |
| var | Relative air velocity | m/s |
| tcl | Clothing surface temperature | °C |
| pa | Partial water vapor pressure | Pa |
Appendix A
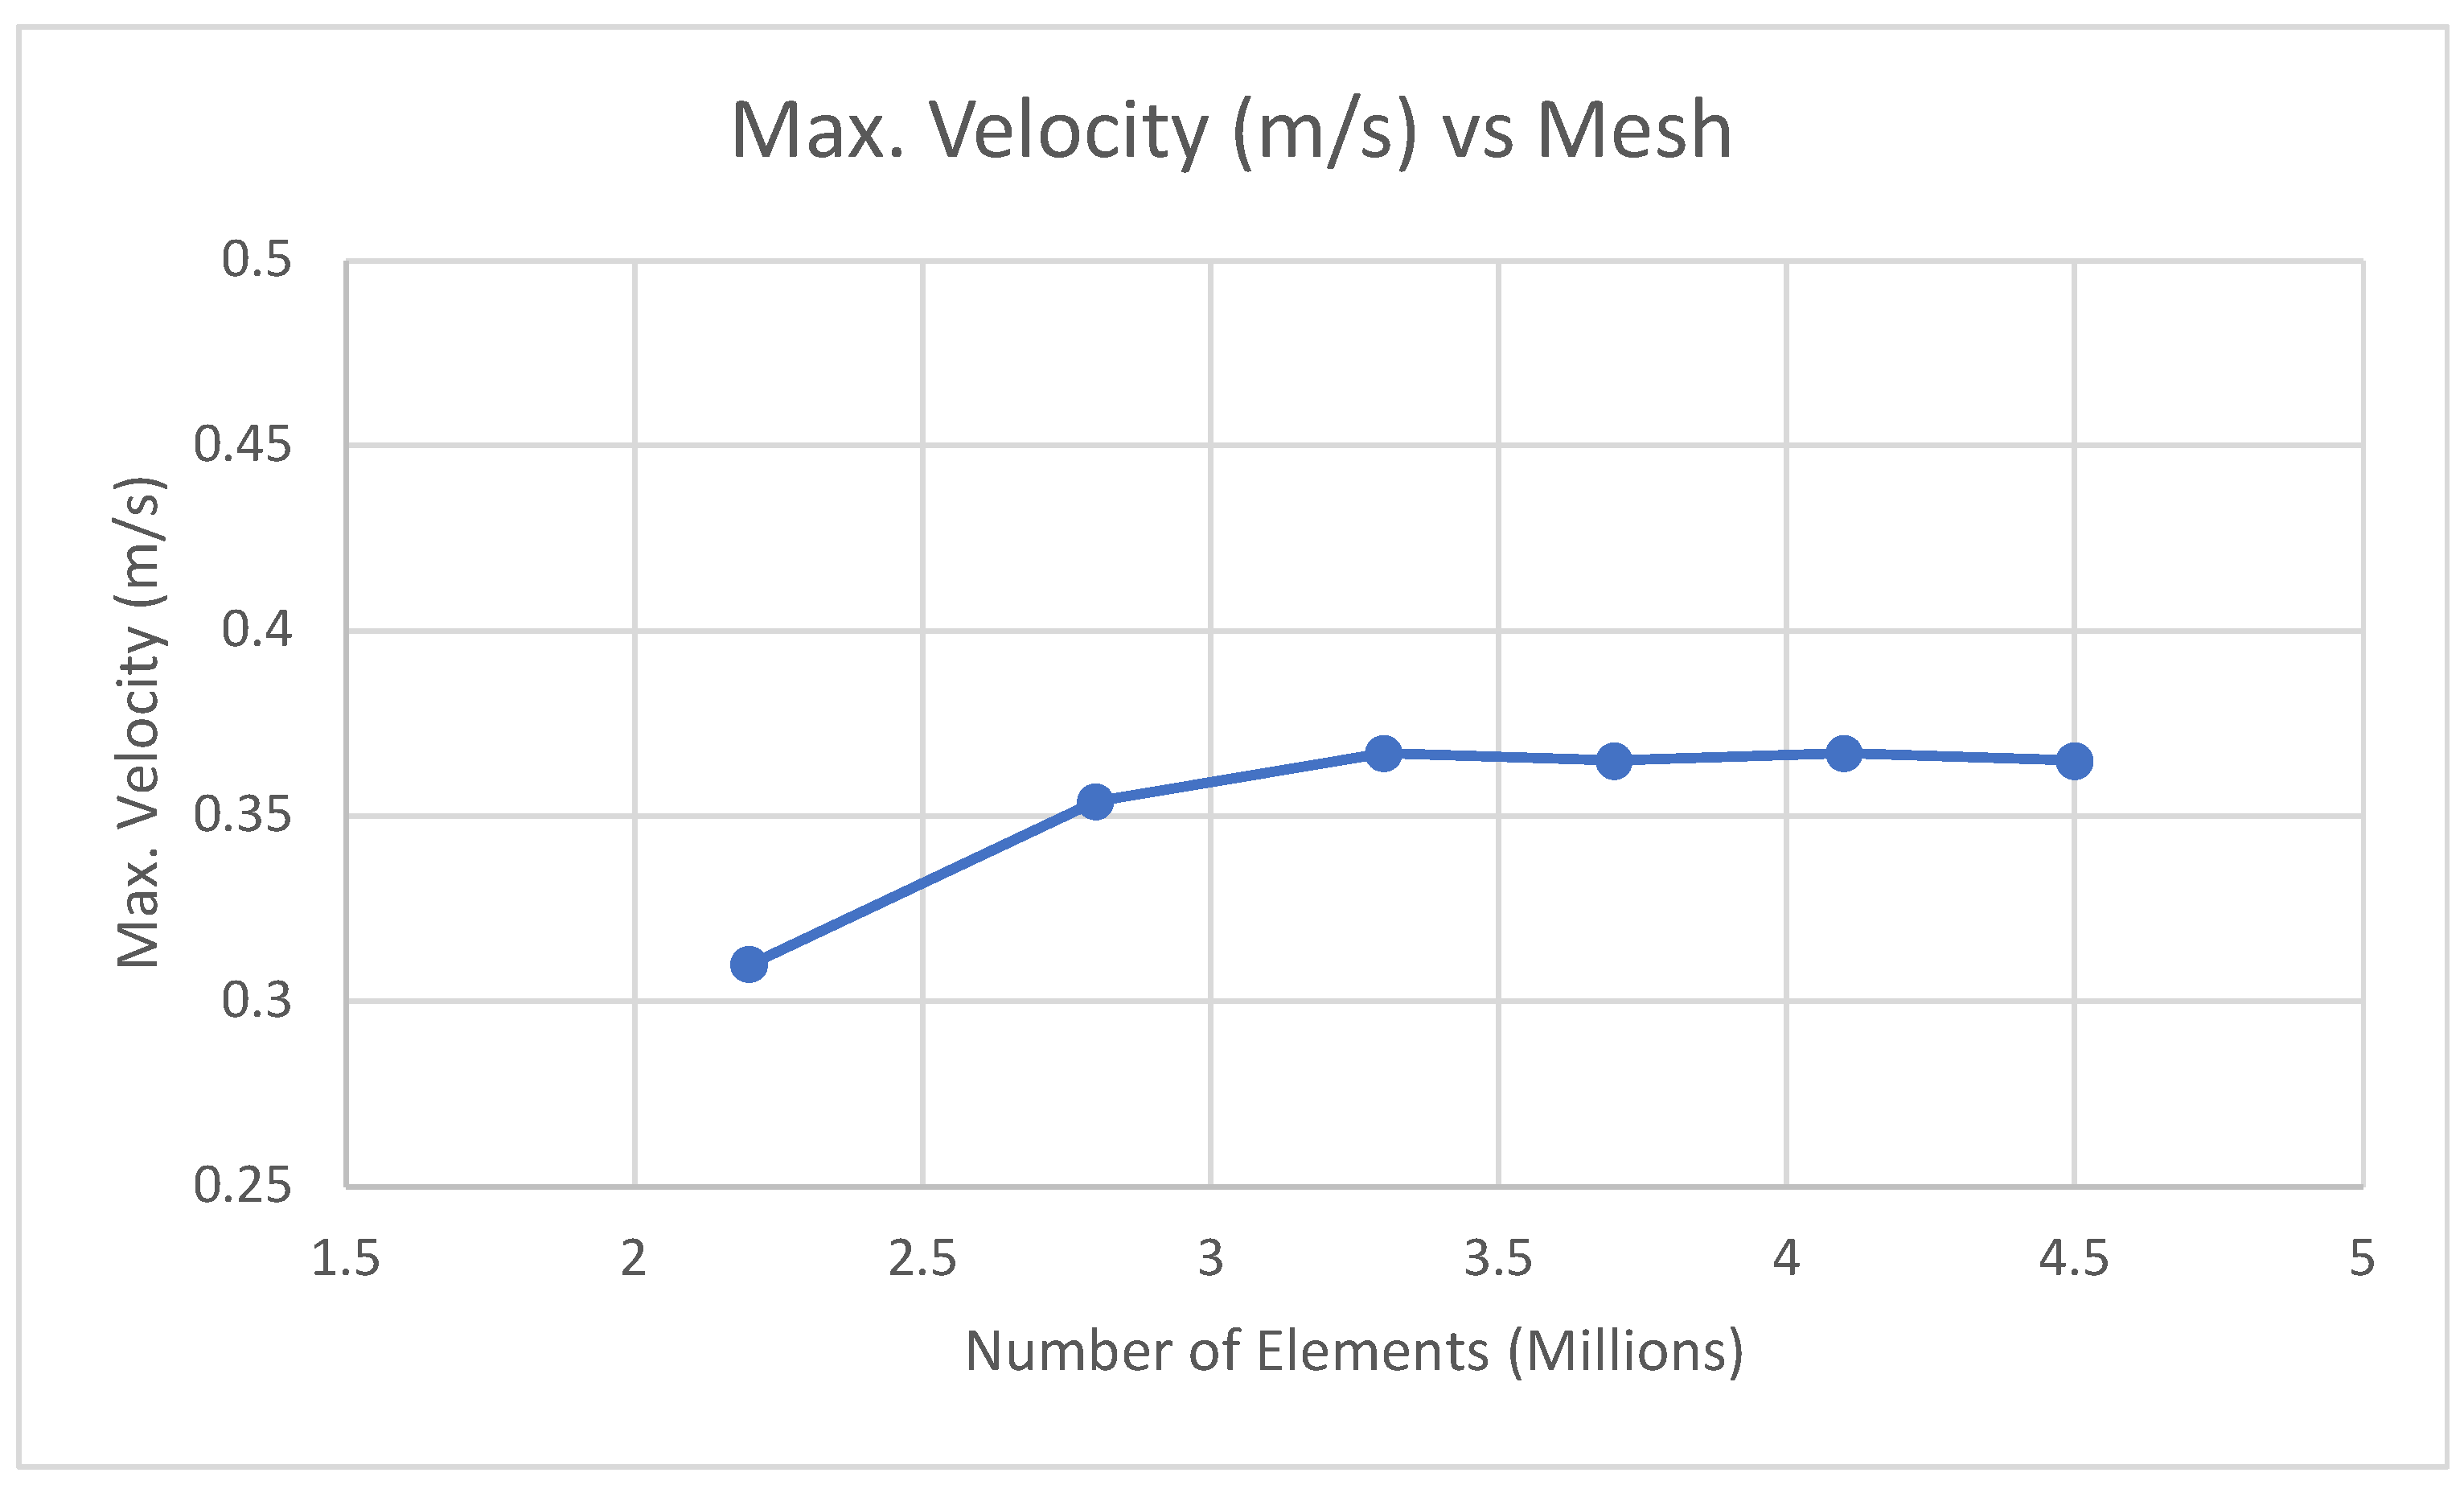
A grid independence test was carried out with different mesh densities at line y1 = −0.5 y2 = −1.1 in the middle of the two desks. The variations after 3.67 million elements were not observed and this grid size was considered suitable due to the insignificant influence of higher grid size on the solutions and to avoid computational cost, see Figure A1.
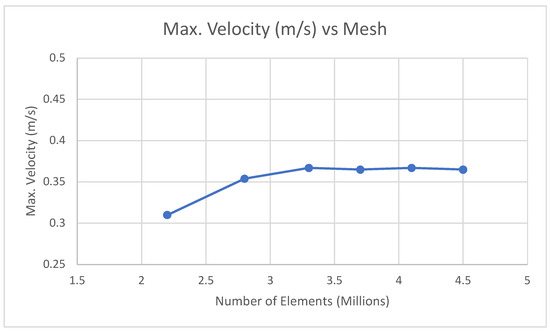
Figure A1.
Grid independence test.
Figure A1.
Grid independence test.
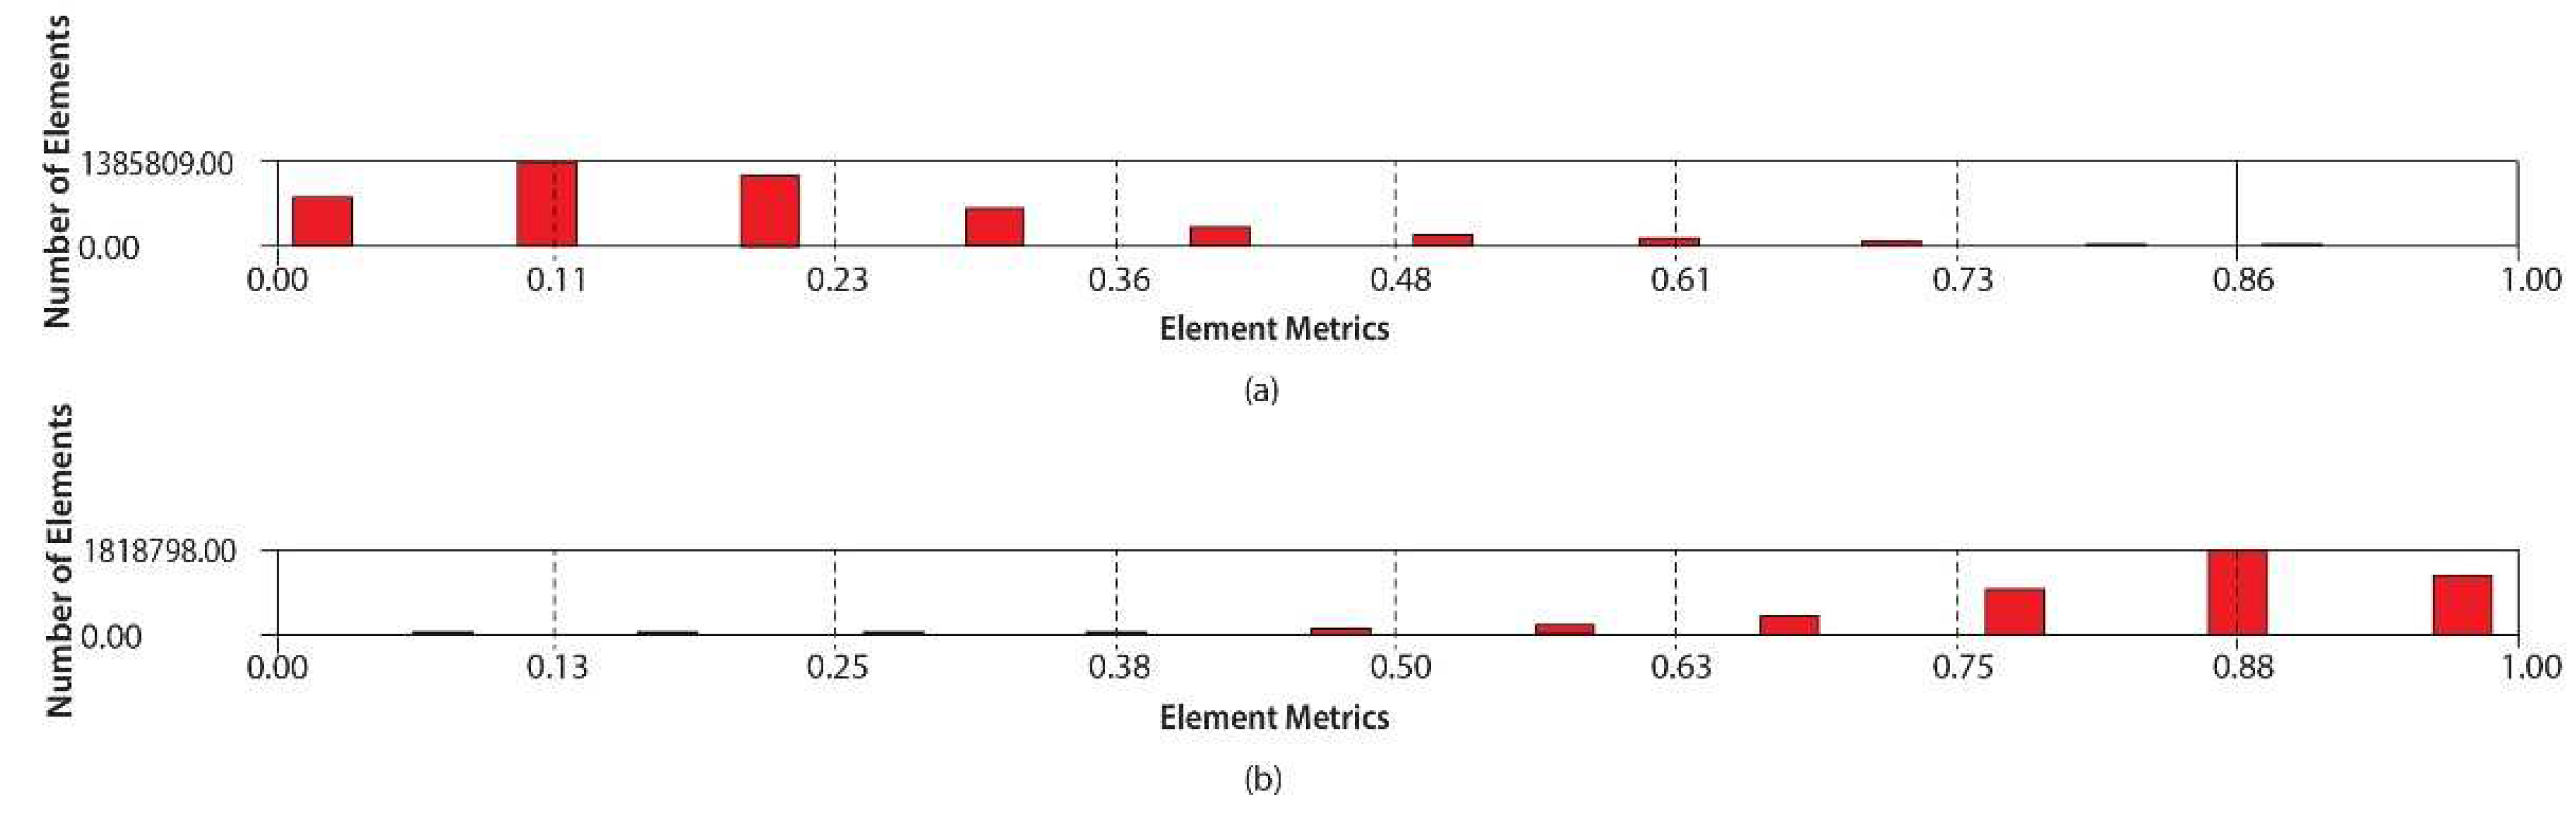
The mesh metrics on the horizontal axis in Figure A2a,b show mesh skewness and element quality, respectively. For 3D geometry, skewness with a value of 0 indicates an equilateral cell and value 1 of element quality is a perfectly shaped tetrahedral element. Figure A2 shows that most of the elements had an element quality between 0.75 and 0.95 and a maximum average skewness of 0.1. This means that the skewness and quality of the obtained mesh structure is acceptable for stable numerical computation.
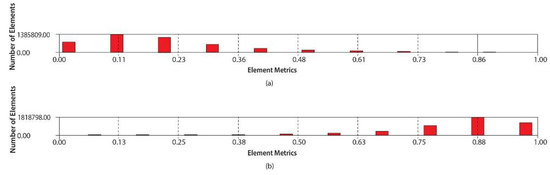
Figure A2.
(a) Mesh skewness and (b) element quality.
Figure A2.
(a) Mesh skewness and (b) element quality.
The boundary conditions were used with respect to the actual setup made for the experiments. The SIMPLE (semi-implicit method for pressure linked equations) algorithmic scheme was applied to implicitly solve pressure and momentum equations. The convergence domain was set to 10e−6 to have a completely converged solution.
Table A1.
Boundary conditions for the simulated model.
Table A1.
Boundary conditions for the simulated model.
| Zones | Boundary Type |
|---|---|
| ACB Inlets | Velocity-inlet |
| Human Dummies | Wall |
| Tables and Equipment | Wall |
| Outlets | Pressure-outlet |
| Room Walls (Adiabatic) | Wall |
References
- Shahzad, S.; Brennan, J. Energy and comfort in contemporary open plan and traditional personal offices. Appl. Energy 2017, 185, 1542–1555. [Google Scholar] [CrossRef]
- Shafaghat, A.; Keyvanfar, A. Enhancing staff’s satisfaction with comfort toward productivity by sustainable Open Plan Office Design. Sustain. Cities Soc. 2015, 19, 151–164. [Google Scholar] [CrossRef]
- Mulville, M.; Callaghan, N.; Isaac, D. The impact of the ambient environment and building configuration on occupant productivity in open-plan commercial offices. J. Corp. Real Estate. 2016, 18, 180–193. [Google Scholar] [CrossRef]
- Rožman, M.; Peša, A.; Rajko, M.; Štrukelj, T. Building Organisational Sustainability during the COVID-19 Pandemic with an Inspiring Work Environment. Sustainability 2021, 13, 11747. [Google Scholar] [CrossRef]
- Gonzalez-Martin, J.; Kraakman, N.J.R. A state–of–the-art review on indoor air pollution and strategies for indoor air pollution control. Chemosphere 2021, 262, 128376. [Google Scholar] [CrossRef]
- Ageel, H.K.; Harrad, S. Occurrence, human exposure, and risk of microplastics in the indoor environment. Environ. Sci Process. Impacts 2022, 24, 17–31. [Google Scholar] [CrossRef]
- Nicol, J.F.; Roaf, S. Rethinking thermal comfort. Build. Res. Inf. 2017, 45, 711–716. [Google Scholar] [CrossRef]
- Brager, G.; Zhang, H. Evolving opportunities for providing thermal comfort. Build. Res. Inf. 2015, 43, 274–287. [Google Scholar] [CrossRef]
- Van Hoof, J. Forty years of Fanger’s model of thermal comfort: Comfort for all? Indoor Air 2008, 18, 182–201. [Google Scholar] [CrossRef]
- Sun, K.; Chen, X. Dynamic simulation of hydrogen-based off-grid zero energy buildings with hydrogen storage considering Fanger model thermal comfort. Int. J. Hydrog. Energy 2022, 47, 26435–26457. [Google Scholar] [CrossRef]
- Wang, Z.; de Dear, R. Individual difference in thermal comfort: A literature review. Build. Environ. 2018, 138, 181–193. [Google Scholar] [CrossRef]
- Ma, Z.; Zhao, D. Personal thermal management techniques for thermal comfort and building energy saving. Mater. Today Phys. 2021, 20, 100465. [Google Scholar] [CrossRef]
- Cao, G.; Awbi, H. A review of the performance of different ventilation and airflow distribution systems in buildings. Build. Environ. 2014, 73, 171–186. [Google Scholar] [CrossRef]
- Rhee, K.N.; Shin, M.S. Thermal uniformity in an open plan room with an active chilled beam system and conventional air distribution systems. Energy Build. 2015, 93, 236–248. [Google Scholar] [CrossRef]
- Latif, H.; Hultmark, G. Performance evaluation of active chilled beam systems for office buildings–A literature review. Sustain. Energy Technol. Assess. 2022, 52, 101999. [Google Scholar] [CrossRef]
- Yang, S.; Wan, M.P. Experimental study of a model predictive control system for active chilled beam (ACB) air-conditioning system. Energy Build. 2019, 203, 109451. [Google Scholar] [CrossRef]
- Dai, Y.; Qiu, J.; Tu. A review of the structure and application of active chilled beams (ACBs) for central air conditioning systems. Sci. Technol. Built Environ. 2022, 28, 350–367. [Google Scholar] [CrossRef]
- Hultmark, G. Supply Air Terminal Device L.; Lindab: Stockholm, Sweden, 2011; p. 15. [Google Scholar]
- Lindab Architect Plexus. In Lindab Plexus Active Chilled Beam, L.; Lindab A/S: Malmo, Sweden, 2021; p. 15.
- Veselý, M.; Zeiler, W. Personalized conditioning and its impact on thermal comfort and energy performance–A review. Renew. Sustain. Energy Rev. 2014, 34, 401–408. [Google Scholar] [CrossRef]
- Melikov, A.K.; Cermak, R. Personalized ventilation: Evaluation of different air terminal devices. Energy Build. 2002, 34, 829–836. [Google Scholar] [CrossRef]
- Al Assaad, D.; Ghali, K. Evaluation of different personalized ventilation air terminal devices: Inhalation vs. clothing-mediated exposures. Build. Environ. 2021, 192, 107637. [Google Scholar] [CrossRef]
- Latif, H.; Rahnama, S.; Hultmark, G.; Rupnik, K.; Afshari, A. Design strategies for decreasing cooling demand and increasing individual thermal comfort in open-plan offices: A review. In Proceedings of the 16th Conference of the International Society of Indoor Air Quality and Climate: Creative and Smart Solutions for Better Built Environments, Indoor Air 2020, online, 1 November 2020; International Society of Indoor Air Quality and Climate: Herndon, VA, USA, 2020. [Google Scholar]
- Saheb, H.; Mahdi, A.; Al-amir, Q.R. A numerical and experimental study of the effect of using personal ventilation systems on indoor air quality in office rooms. Front. Heat Mass Transf. 2021, 16. [Google Scholar] [CrossRef]
- Zhao, W.; Kilpeläinen, S. Thermal environment and ventilation efficiency in a simulated office room with personalized micro-environment and fully mixed ventilation systems. Build. Environ. 2021, 188, 107445. [Google Scholar] [CrossRef]
- Liu, J.; Dalgo, D.A. Performance analysis of a ductless personalized ventilation combined with radiant floor cooling system and displacement ventilation. Build. Simul. 2019, 12, 905–919. [Google Scholar] [CrossRef]
- Wu, B.; Cai, W. Experimental investigation on airflow pattern for active chilled beam system. Energy Build. 2018, 166, 438–449. [Google Scholar] [CrossRef]
- Saarinen, P.; Koskela, H.M. Asymmetric Collisions of Two Attached Plane Jets; Finnish Institute of Occupational Health: Helsinki, Finland, 2008. [Google Scholar]
- Koskela, H.; Häggblom, H. Air distribution in office environment with asymmetric workstation layout using chilled beams. Build. Environ. 2010, 45, 1923–1931. [Google Scholar] [CrossRef]
- Latif, H.; Rahnama, S. Precision Ventilation in an Open-Plan Office: A New Application of Active Chilled Beam (ACB) with a JetCone Feature. Sustainability 2022, 14, 4242. [Google Scholar] [CrossRef]
- Kristensen, M.H.; Jensen, J.S.; Jensen, R.L. Air Temperature Measurements Using Dantec Draught Probes. ANSYS Fluent. Available online: www.ansys.com/products/fluids/ansys-fluent (accessed on 22 February 2022).
- Zhang, Z.; Zhang, W. Evaluation of various turbulence models in predicting airflow and turbulence in enclosed environments by CFD: Part 2—Comparison with experimental data from literature. HVAC R Res. 2007, 13, 871–886. [Google Scholar] [CrossRef]
- Hussain, S.; Oosthuizen, P.H. Evaluation of various turbulence models for the prediction of the airflow and temperature distributions in atria. Energy Build. 2012, 48, 18–28. [Google Scholar] [CrossRef]
- Blocken, B. LES over RANS in building simulation for outdoor and indoor applications: A foregone conclusion? Build. Simul. 2018, 11, 821–870. [Google Scholar] [CrossRef]
- Fang, Z.; Lin, Z. Investigation into sensitivities of factors in outdoor thermal comfort indices. Build. Environ. 2018, 128, 129–142. [Google Scholar] [CrossRef]
- Fabbri, K. The indices of feeling—predicted mean vote PMV and percentage people dissatisfied PPD. Indoor Therm. Comf. Percept. 2015, 75–125. [Google Scholar]
- Silva, A.S.; Ghisi, E. Performance evaluation of long-term thermal comfort indices in building simulation according to ASHRAE Standard 55. Build. Environ. 2016, 102, 95–115. [Google Scholar] [CrossRef]
- Lenzuni, P. Compliance with limits of acceptability for thermal comfort, and implications for long-term comfort. Build. Environ. 2021, 204, 108067. [Google Scholar] [CrossRef]
- Dawe, M.; Raftery, P. Comparison of mean radiant and air temperatures in mechanically conditioned commercial buildings from over 200,000 field and laboratory measurements. Energy Build. 2020, 206, 109582. [Google Scholar] [CrossRef]
- Wu, B.; Cai, W. Heat source effects on thermal comfort for active chilled beam systems. Build. Environ. 2018, 141, 91–102. [Google Scholar] [CrossRef]
- Turkowski, M.; Szufleński, P. New criteria for the experimental validation of CFD simulations. Flow Meas. Instrum. 2013, 34, 1–10. [Google Scholar] [CrossRef]
- Zhai, Y.; Zhang, H. Comfort under personally controlled air movement in warm and humid environments. Build. Environ. 2013, 65, 109–117. [Google Scholar] [CrossRef]
- Zhang, Y.; Zhou, X. Experimental investigation into the effects of different metabolic rates of body movement on thermal comfort. Build. Environ. 2020, 168, 106489. [Google Scholar] [CrossRef]
- Gong, N.; Tham, K. The acceptable air velocity range for local air movement in the tropics. Hvac&r Res. 2006, 12, 1065–1076. [Google Scholar]
- Yamasawa, H.; Kobayashi, T. Experimental investigation of difference in indoor environment using impinging jet ventilation and displacement ventilation systems. Int. J. Vent. 2020, 1–18. [Google Scholar] [CrossRef]
- Liu, S.; Wang, Z. Schiavon, Predicted percentage dissatisfied with vertical temperature gradient. Energy Build. 2020, 220, 110085. [Google Scholar] [CrossRef]
- Melikov, A.K.; Nielsen, J.B. Local thermal discomfort due to draft and vertical temperature difference in rooms with displacement ventilation. ASHRAE Trans. 1989, 95, 1050–1057. [Google Scholar]
- Pinzon, J.A.; Vergara, P. Optimal management of energy consumption and comfort for smart buildings operating in a microgrid. IEEE Trans. Smart Grid. 2018, 10, 3236–3247. [Google Scholar] [CrossRef]
- Zhang, N.; Sun, Q. Event-triggered distributed hybrid control scheme for the integrated energy system. IEEE Trans. Industr Inform. 2021, 18, 835–846. [Google Scholar] [CrossRef]
- Li, Y.; Zhang, H. Event-triggered-based distributed cooperative energy management for multienergy systems. IEEE Trans. Industr. Inform. 2018, 15, 2008–2022. [Google Scholar] [CrossRef]
Publisher’s Note: MDPI stays neutral with regard to jurisdictional claims in published maps and institutional affiliations. |
© 2022 by the authors. Licensee MDPI, Basel, Switzerland. This article is an open access article distributed under the terms and conditions of the Creative Commons Attribution (CC BY) license (https://creativecommons.org/licenses/by/4.0/).