Article

Performance Enhancement of Radial Power Distribution Networks Using Network Reconfiguration and Optimal Planning of Solar Photovoltaic-Based Distributed Generation and Shunt Capacitors

by
Muthukumar Kandasamy
1,
Renugadevi Thangavel
2,*,
Thamaraiselvi Arumugam
3,
Jayachandran Jayaram
1,
Wook-Won Kim
4 and
Zong Woo Geem
4,*
1
School of Electrical and Electronics Engineering, SASTRA Deemed University, Thanjavur 613401, India
2
School of Computing, SASTRA Deemed University, Thanjavur 613401, India
3
Sakthi Institute of Information and Management Studies, Pollachi 642001, India
4
Department of Smart City &Energy, Gachon University, Seongnam 13120, Korea
*
Authors to whom correspondence should be addressed.
Sustainability 2022, 14(18), 11480; https://doi.org/10.3390/su141811480
Submission received: 16 July 2022 / Revised: 20 August 2022 / Accepted: 7 September 2022 / Published: 13 September 2022

Abstract

:
In this work, an efficient hybrid optimization approach entitled harmony search and particle artificial bee colony algorithm is proposed to deal with the distribution network reconfiguration and solar photovoltaic-based distributed generation and shunt capacitor deployment in power distribution networks to improve the operating performance of power distribution networks. The proposed hybrid algorithm combines the exploration and exploitation capability of both algorithms to achieve optimal results. The optimization problem is formalized which includes distributed generation and shunt capacitor locations, open/close state of switches as discrete decision variables, and the optimum operating point of compensation devices as continuous variables. An efficient spanning tree approach is utilized to track the optimal topology of the network. The validity of the proposed hybrid algorithm in handling the optimal planning problem of the distribution network is assured through eight different operating scenarios at three discrete load levels. The efficiency of the proposed performance enhancement approaches was validated using 69 node and 118 node distribution networks. The obtained results are compared against similar techniques presented in the literature.

1. Introduction

A power distribution system is a vital component of the power system that transmits electrical power from the substation to the consumer’s end. The operation of the distribution network at a low voltage level with a high current will result in poor operating performance of the radial power distribution network (RPDN). Power loss in the RPDN is comparatively higher than that of the transmission network because of the higher R/X ratio and untransposed lengthy feeder lines. Higher resistance in the distribution network escalates more power loss in the feeder lines. This renders the distribution network less efficient in providing quality power to the tail end users. The power utilities follow some traditional approaches to upgrade the performance of the power distribution network by reconfiguring the network, optimally placing substations, transformers, upgrading conductors, shunt capacitors (SCs), and distributed generation units (DGs).

1.1. Network Reconfiguration

Several efforts have been made to restrict the power loss in the lateral and sub laterals in the distribution network. Reconfiguring the network is one of the efficient techniques to alleviate this problem. Another approach to reduce power loss in the network is through structural changes in the existing network by switching ON/OFF the sectionalizing and tie switches. Identification of the optimal radial network topology (ORNT) of the RPDN is considered a combinatorial optimization problem which is NP-hard in nature. The discrete states of switches are utilized to trace all possible radial structures to find the optimal switching pattern. The advantages of reconfiguring the radial topology of the distribution networks are listed below.
  • It augments the voltage profile and reliability of the distribution network;
  • It avoids congestion in the feeder lines during peak load conditions;
  • It helps to restore the power supply when a fault occurs within the distribution network.
In [1], a new technique was proposed for reconfiguration of the RPDN to reduce the power loss. A new index based on load balancing was proposed to balance the load among the feeder lines. A generalized reconfiguration technique suitable to handle the radial network with multiple laterals and sub laterals was proposed in [2]. In [3], the fuzzy-genetic approach was addressed for reconfiguring the distribution network with voltage stability maximization as the objective. The proposed technique claims its suitability to reach the optimal solution with a lesser computational burden. The loss sensitivity and branch exchange technique was proposed in [4] for reconfiguring the distribution network with loss minimization as an objective. During the reconfiguration process, there is a need to trace all the viable radial topologies to find the optimal switching pattern without affecting the network radiality. The discrete states of switches are utilized to trace the ORNT to attain minimum power loss in the networks. Due to the discrete status of tie/sectionalizing switch positions in the network reconfiguration problem, the application of numerical optimization methodologies may not yield an optimal solution. Numerical optimization methodologies may not find the optimal solution for network reconfiguration problems due to the discrete nature of switches in the network branches [5]. There has been more focus on various heuristic search algorithms such as the bacterial foraging optimization algorithm (BFOA), the charged system search (CSS) algorithm, the genetic algorithm (GA), the rain-fall optimization (RFO), the adaptive imperialist competitive algorithm (AICA), the invasive weed optimization (IWO), and the cuckoo search algorithm (CS) to handle the feeder reconfiguration problem efficiently [6,7,8,9,10,11,12].
Various population-based heuristic search techniques are presented in the literature to handle this type of complex optimization problem. Artificial immune systems (AIS) have been used to solve the reconfiguration problem to achieve energy loss minimization [13]. The bacterial foraging optimization (BFO) algorithm, fireworks algorithm (FWA), and harmony search algorithm (HSA) have been utilized in [14,15,16] to trace the ORNT of the distribution network with loss minimization as an objective. Binary group search optimization has been applied to solve the ORNT problem in [17]. Power loss minimization and load balancing have been realized through an efficient network reconfiguration scheme [18]. Distribution network optimization problems with radiality constraints have been proposed in [19]. A mixed-integer linear programming model has been proposed in [20] for solving reconfiguration problems.
Some common loss reduction strategies for enhancing the performance of distribution networks include (a) varying the radial topological nature of electric power distribution networks by altering the ON/OFF conditions of the sectionalizing switches and tie switches, and re-routing power flow under normal and fault conditions; and (b) installation of the appropriate DG units and SCs at optimal nodes in the RPDN. Improper coordination of the loss reduction methodologies can lead to the deterioration of the distribution network performance. Several studies carried out by researchers indicate that imperfectly selected [21,22] locations and sizing of DG units and SCs can have an impact on the performance of RPDN interms of total power loss and voltage profile. Hence, it is emphasized that proper techniques are needed to deal with such complex planning problems of determining the optimal installation and rating of compensating devices.

1.2. Shunt Capacitor Placement

The current flow through the distribution feeders results in resistive (I2R) and reactive (I2X) power loss. Shunt capacitors are installed at the various points of the network to curtail reactive power flow through the feeder branches and thereby reducing the power loss of the distribution network. Additionally, SCs release the feeder capacity and offer an additional financial benefit to both the utility and consumers; it helps to sustain the voltage profile within the tolerable boundary limits [23].
A hybrid approach of the fuzzy and genetic algorithms was suggested in [24] to identify the shunt capacitors in the radial power distribution network. A fuzzy weighted multiobjective function was formulated by combining maximum net savings and minimum node voltage deviation. In [25], the plant growth simulation algorithm (PGSA) which mimics the plant growth process was proposed to find the suitable ratings of SCs in the RPDN. The loss sensitivity factor (LSF) helps to find the appropriate nodes for placing the SCs. The SC placement problem was treated as a multiobjective optimization problem which considers the cost associated with peak power operating conditions, energy loss in the feeder branches, and voltage profile of the RPDN as prime important factors [26]. For optimizing the size of shunt capacitors, the bacterial foraging algorithm (BFA) was utilized, and a fuzzy decision-making process was utilized to trace the optimal locations. The PSO algorithm was utilized in [27] to find out the optimal rating of SCs and power loss indices (PLI)-based node identification for SC locations. Similarly, the ABC algorithm was utilized in [28] to select the suitable rating and location of SCs. The objective function was formulated using the voltage stability index (VSI) and annual savings. The optimal nodes for SC placement were found based on LSF and VSI values.

1.3. Distributed Generation Placement

Electricity generated locally at or near the consumer loads using smaller size clean energy generation sources within the distribution network level has better energy efficiency, and lower SO2 and CO2 emissions than coal-based power generating stations [29,30]. From the literature, it transpires that there are many definitions for the rating of distributed generation (DG) units. The electric power research institute (EPRI) recommended a DG size up to 5 MW; the gas research institute defined its range up to 25 MW; Preston and Rastler defined the rating of DG units from a few kW up to 100 MW; Cardell defined the range of the DG unit as within 500 kW and 1 MW; and the international council on large electric systems (CIGRE) defined the DG unit size between 50 MW and 100 MW [31]. In [32,33], an analytical expression was suggested to trace the optimal rating and power factor of DG units with loss minimization as the objective. The study concluded that the operation of DG units with an optimum power factor closer to the combined load power factor minimizes the losses significantly. In [34], the DG planning problem was treated as two subproblems to handle continuous decision variables (optimal DG size) and discrete decision variables (DG locations). The PSO algorithm was used to address both subproblems simultaneously to decrease the power loss of the RPDN considering the hourly generation profile, DG penetration limits, and the operating power factor of non dispatchable and dispatchable DG units.

1.4. Combined Loss Reduction Methods

Integrated approaches contribute to the complexity of formulating optimization problems that involve discrete and continuous variables. Conventional optimization techniques require more computational time to solve such problems [5]. Heuristic techniques such as the ant colony search (ACS), hybrid differential evolution (HDE), the genetic algorithm (GA), binary gravitational search (BGS), and oppositional krill herd (OKH) algorithms are robust and have the capability of handling such complexities [35,36,37,38,39].
Similarly, some research publications have addressed the simultaneous consideration of network reconfiguration and DG allocation problems. The uncertainty problem in renewable-based DG units, economical and environmental factors, time-varying loads, and multiyear load growth are to be considered by utility planners while integrating such loss reduction methods to realize constructive benefits [40].

1.5. Motivations

Abundant research studies presented in the literature have highlighted the importance of the optimal deployment of shunt capacitors, DG units, and feeder reconfiguration to enhance the performance of RPDN. In recent years, some successful attempts have been made to solve the simultaneous implementation of loss reduction strategies to improve the performance of RPDN. The coordinated approach of loss reduction strategies exploits benefits such as power loss reduction, voltage profile enhancement, peak demand saving, released substation capacity, reduced overloaded operation of distribution feeders, reduced emission, and deferred investments for upgrading existing power delivery networks.
In light of the above discussion, it can be observed that for the efficient planning of a power distribution network, which involves tracing the ORNT, the optimal allocation of shunt capacitors and DG units can be framed as a single or a multiobjective nonlinear optimization problem, and can have few or more decision variables. Furthermore, tracing the optimal radial topology and the optimal rating of SCs and DG units at their appropriate places, which contains discrete (status of tie and sectionalizing switch) and continuous decision variables (rating of SCs and DG units), leads to the problem as a complex combinatorial optimization problem. The ever-increased penetration of solar photovoltaic-based DGs (PV-DGs) will reduce real power import from the grid and lead to poor power factor. Therefore, as solar PV-DG penetration increases, proportionately, the amount of reactive power support from the compensation devices such as shunt capacitors, and FACTS devices also escalates. Hence, the constraints associated with the rating of renewable-based DG units and SCs are dynamic and flexible. As an exemption, the network reconfiguration problem has a stringent topological structure with radiality constraints. Therefore, other optimal planning regimes, except for tracing the ORNT, do not have a prior known global optimum. Solving such problems using heuristic optimization methods will fail to reach better optimal solutions due to an improper balance with its intensification and diversification ability in such complex optimization problems. Hence, there espouses a need to employ a robust hybrid optimization technique to arrive at a global solution for the economic and efficient operation of the distribution networks.
The ability of a hybrid heuristic algorithm, namely, the harmony search algorithm and the particle swarm embedded artificial bee colony algorithm (HSA–PABC), to solve distribution network planning problems has already been published in [41,42,43]. In this article, it was utilized (i) to obtain an optimal topology of the RPDN and (ii) performance enhancement in terms of significant curtailment in power loss with an improved node voltage of the network in the presence of solar photovoltaic-based DG units and SCs. The procedure involved a graph theory-based approach to obtain the ORNT with minimum loss. The efficacy of the hybrid HSA–PABC was tested on 69 and 118 node-balanced RPDNs, and the obtained results were weighed against the results presented in the literature.
This article is organized as follows: Formulation of the optimization problem and directed graph approach for reconfiguration of the RPDN described in Section 2. Overviews of standard HSA and PABC algorithms and their hybridization are introduced in Section 3. Implementation of the proposed hybrid algorithm on standard RPDNs, result outcomes, and its significance are highlighted in Section 4. Section 5 concludes the findings of the results.

2. Problem Formulation

2.1. Formulation of Objective Function

The objective function is formulated to improve the performance of RPDNs in different operating conditions in terms of power loss reduction with a better operating voltage profile via network reconfiguration: placement of solar PV-based DG units and SC compensation.
The simplified recursive Equation (1) to Equation (3) described below are used to obtain the power flow solution after solar PV-DG units and SC placement at arbitrary locations in the network as shown in Figure 1. The power flow through the feeders of the RPDN can be written mathematically as [44] as shown below (Equations (1)–(3)):
P i + 1 = P i , i + 1 ( R i , i + 1 P i , i + 1 2 + Q i , i + 1 2 V i 2 ) P i + 1 L + α PDG P i + 1 DG
  Q i + 1 = Q i , i + 1 ( X i , i + 1 P i , i + 1 2 + Q i , i + 1 2 V i 2 ) Q i + 1 L + α qcp Q i + 1 C
V i + 1 2 = V i 2 + R i , i + 1 2 + X i , i + 1 2 V i 2 ( P i , i + 1 2 + Q i , i + 1 2 ) 2 R i , i + 1 P i , i + 1 + X i , i + 1 Q i , i + 1
where i = 1, 2, …, m; m is the total nodes, P i + 1 ,   Q i + 1 are the i+1th branch active and reactive power flows; P i + 1 L , Q i + 1 L is the active, reactive load demand ati+1th node; R i , i + 1 ,   X i , i + 1 are the resistance, reactance of the feeder line connecting two nodes; |Vi|, V i + 1 are the node voltages; α PDG is a multiplier set as 0 if no active power is delivered from DG unit and otherwise set as 1. α qcp is a multiplier set to 0 if no reactive power is supplied from SC, else set as 1. α PDG   and   α qcp values in Equations (1)–(3) are taken as 0 in the network while performing the network reconfiguration and its values are considered as 1 when the network is operated with DG unit and SC.
The branch current of the RPDN is obtained by using Equation (4):
I i , i + 1 = P i , i + 1 2 + Q i , i + 1 2 V i 2
The total power loss ( P loss   T ) of the RPDN is estimated by using Equation (5):
P loss   T = i = 1 n b I P i , i + 1 2 R i , i + 1 + I q i , i + 1 2 R i , i + 1
where I P i , i + 1 , I q i , i + 1 are the active and reactive part of branch current flow between ith node and i + 1th node.

2.1.1. Constraints

A set of constraints taken into consideration while achieving the minimization of power loss (Min   P loss   T ) is mentioned below.

Power Balance

The constraints associated with the power balance equation of the RPDN can be written as (Equations (6) and (7))
P slack + i = 1 N DG P i DG = j = 1 m P d j + i = 1 n b P loss i , i 1 + 1
Q slcak   + j = 1 n c Q sc j = j = 1 m Q d j + i = 1 n b Q loss i , i + 1
where Pslock, Qslock are the power supplied to active, reactive power loads from the slack node; Q sc j and P i DG are the reactive power support from the jth SC and real power output of the DG placed at ith node; P d j ,   Q d j represents the power demand of the load at jth node; P loss i , i + 1 ,   Q loss i , i + 1 are the power loss in the feeder line connecting ith node and i + 1th node.

Rating and Quantity of SC

For the injection of reactive power in a particular node of the RPDN, multiple integers of the minimum size of SCs are considered (Equation (8)).
QSCj = XQCd, X = 1,2, …, nc
where X is an integer value; QCd is the smallest size of SC considered for the placement. Therefore, for each location, X size of the smallest size of SC {1QSC,2QSC,3QSC,…, XQCd) is considered for injecting a particular amount of reactive power in that location.

Node Voltage

The constraint imposed on the magnitude of the node voltage ( V k sys )   must be within the specified acceptable limits (Equation (9)).
V min spec < V k sys V max spec
k =1, 2, …, m; where m denotes the total number of available nodes in the RPDN.
In this work, the minimum and maximum node voltage boundaries are considered between 0.9 p.u. and 1.1 p.u.

Line Flow Limits

The current through the feeder branches should be maintained below their maximum current carrying capacity (Ibmax), and it can be stated as below (Equation (10))
Ibmax(i) < Ibmax, i = 1, 2, …, nb
where n b denotes the number of feeder branches in the RPDN.

Sizing of DG Units

Different types of DG models are proposed in the literature to host in the electrical distribution network [32]. A DG unit modelled as a PV node to produce an adequate required reactive power to maintain the voltage magnitude may create problematic voltage rise during light load conditions [45]. IEEE Std. 1547-2003 states, “Distributed resources (DR) shall not actively control the voltage magnitude at the point of common coupling (PCC)” [46]. This implies that the DG model can be represented as a PQ model, i.e., as a negative load [47]. Most DG units normally operate at 0.8 lagging and unity power factor [48].
In this work, solar PV (Type-I DG units) is considered as DG units that inject real power at a unity power factor [44]. The active power output of the solar PV-DG units is considered between 10% and 80% of the real power requirement of the RPDN [47]. These limitations are expressed mathematically in the equations given below (Equations (11) and (12)).
  P min   DG   P i DG   P max DG .  
where   P min DG = 0.1 i = 2 m P i   DG   and   P Max   DG = 0.8   i = 2 m P i   DG
PiDG signifies the injected active power of ith DG unit; P max DG   and   P min DG . are the boundary limits of power supplied by the solar PV-DG unit.

2.2. Radial Configuration

In general, the distribution network is designed to operate in radial topology with a single supply source (substation). The problem of determining the best possible radial configuration from the given structure is complex. The optimal network structure created by opening and closing the tie and sectionalizing switches should undergo a radiality and node isolation check.

Directed Graph

In this work, the spanning-tree approach is employed to trace the ORNT of the RPDN. The nodes of the RPDN are represented as the vertices (V) and the feeder branches with sectionalizing and tie switches are represented as edges (E) of the graph. Figure 2 depicts the adjacency matrix (A) generation of the RPDN. More formally, the graph G = (V, E) is represented as (Equation (13))
A   =   [ a ij ] where   a ij   =   { 1   if < i ,   j >     E 0   otherwise
The computation of the in-degree of the vertices is depicted in Figure 3. The in-degree of a vertex v ϵ V is defined as in Equation (14)
indegree v = i ϵ V a ij  
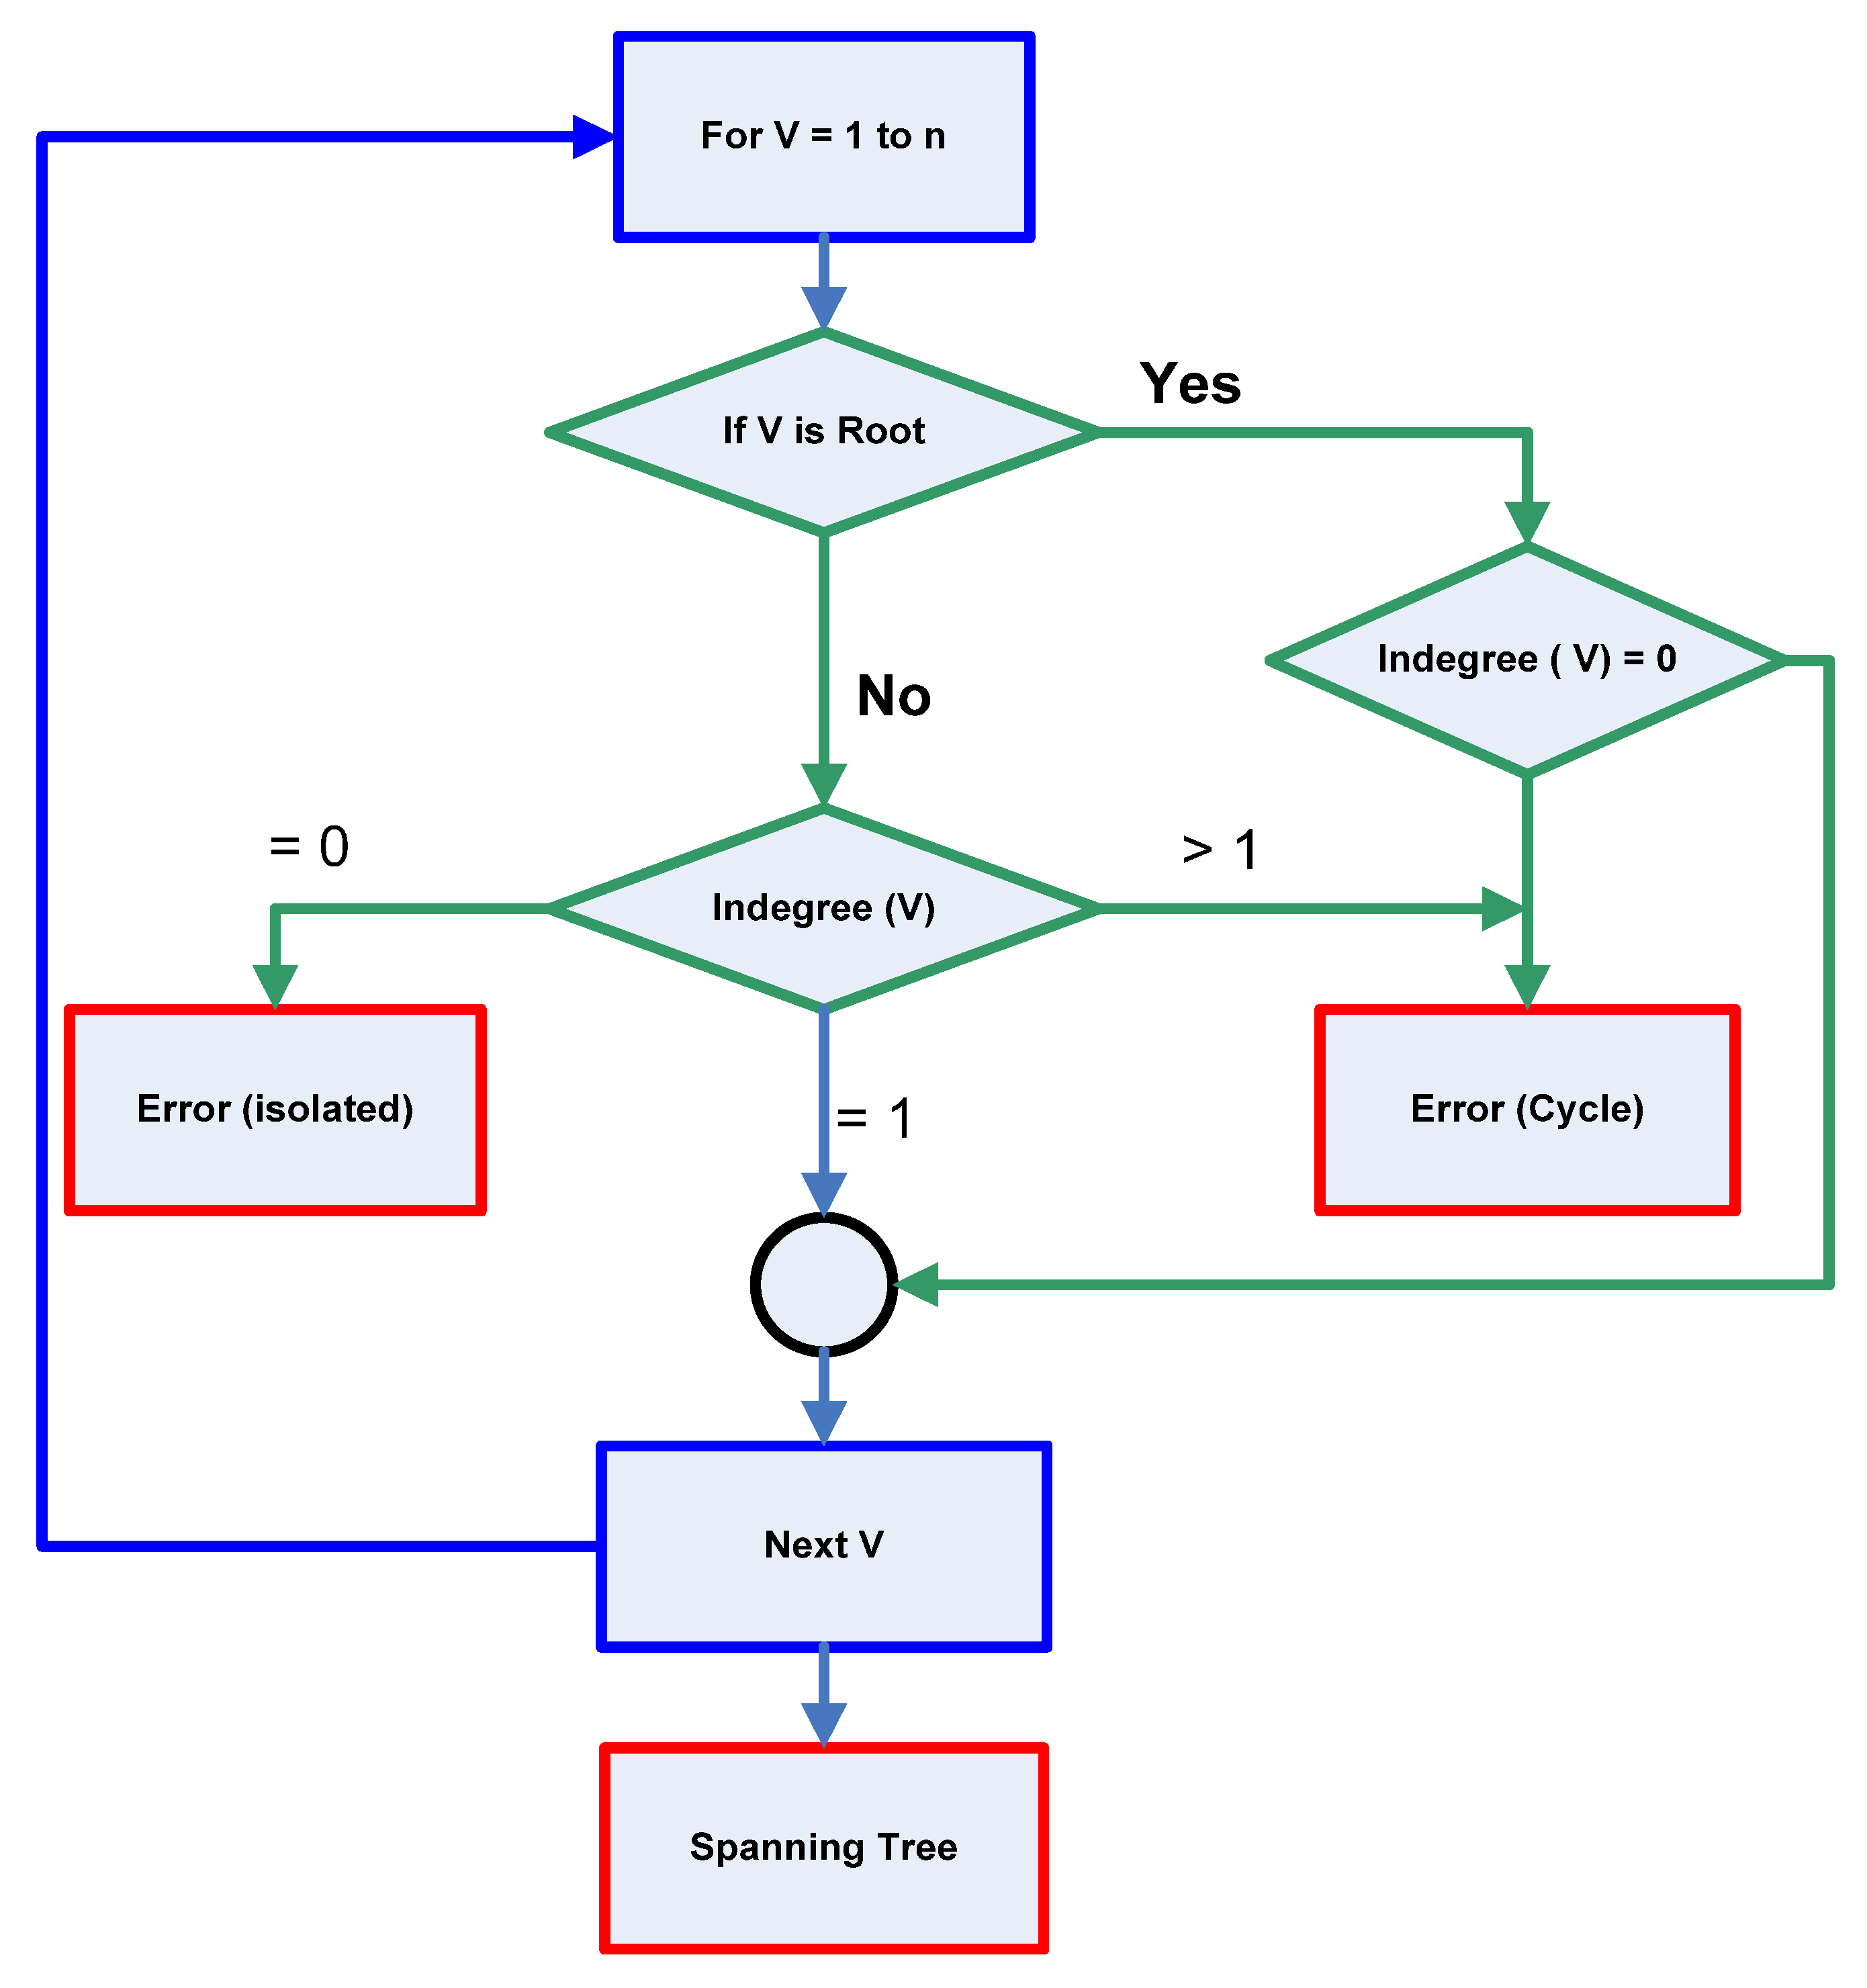
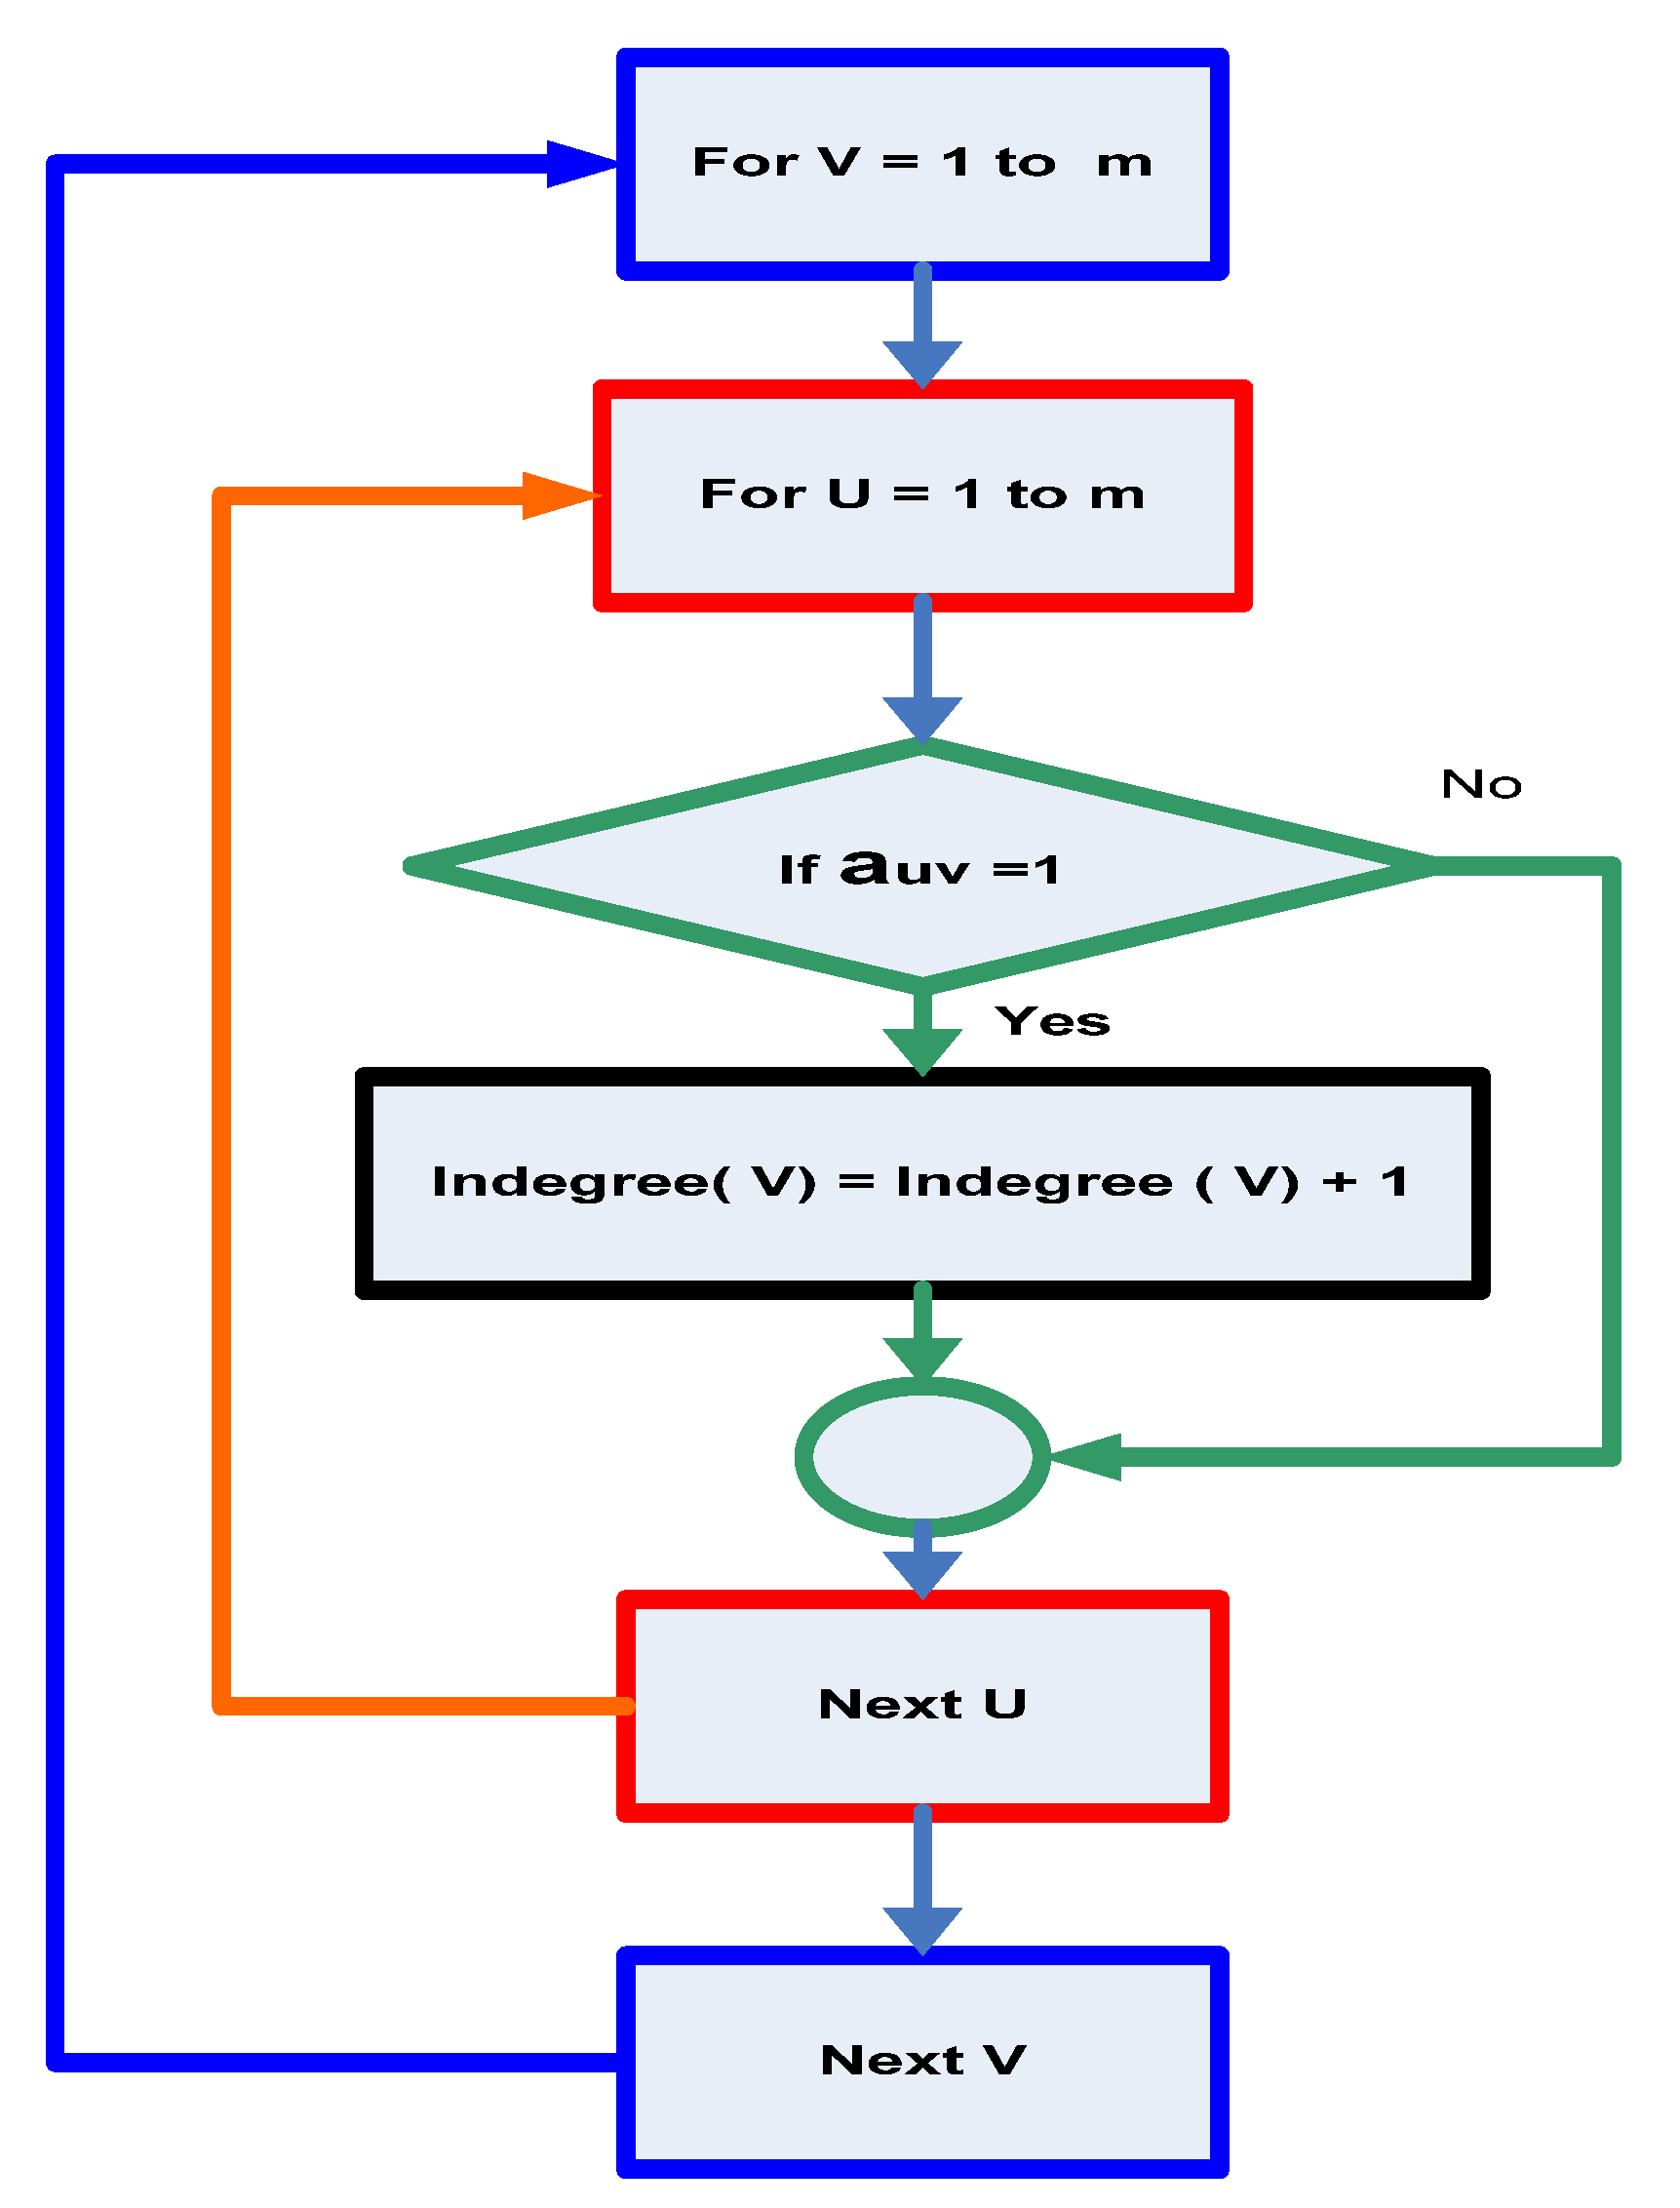
If the radial distribution network forms a tree rooted at the substation node, the corresponding representation graph G should not have any loops and isolated vertices. The vertex corresponding to the substation of the RPDN is designated as the root vertex. If any columns of the adjacency matrix other than the root vertex consist of all zeros, then that vertex is identified as an isolated vertex. If the radial distribution network has no isolated vertices and all vertices except the root vertex have an in-degree of “1”, then the given network topology is taken as a spanning tree. More formally, graph G is a spanning tree if it satisfies Equation (15). Figure 4 depicts the steps for finding the node isolation and radiality of the given network.
v V   indegree   v = 0   if   v   is   root 1   otherwise
The load flow algorithm based on backward forward sweep (BFS) is utilized to get the branch power flow of the RPDN by using the BIBC and BCBV matrices [49]. BIBC and BCBV matrices correlate the injected current at each node with branch current: branch current with node voltage. Based on the topological structure modifications of the RPDN, the BCBV and the adjacency matrix are altered. To traverse the graph from each node, the depth-first search (DFS) discovery order is used. Based on the discovery order sequence from each node of the RPDN, the BIBC matrix is modified by placing ‘1’ in the discovered paths.
Figure 4. Flowchart for finding the node isolation and radiality.
Sustainability 14 11480 g004
Let the set of direct edges of the given RPDN be taken as E. Each component in the adjacency matrix auv = 1 or 0, if (i, j) ϵ E (or) ∉ E.
Steps for tracing the optimal network topology of the given RPDN:
  • Step 1: Compute the adjacency matrix (auv) for the RPDN,
  • Step 2: Create the directed graph with the help of the bio-graph (bg) function in Matlab based on the adjacency matrix (auv),
  • Step 3: Trace the directed graph to form the BIBC matrix by using depth-first search (DFS) order,
  • Step 4: Formulate the branch current matrix [BCM] using the (Equation (16))
[BCM] = [BIBC ∗ I]
  • Step 5: The voltage drop in each branch of the network is obtained using Equation (17)
ΔV = [BCBV] ∗ [BIBC] ∗ [I]
The power flow calculations are carried out by solving the following equations iteratively.
The injected current in (i + 1)th node in the kth iteration can be estimated by Equation (18)
I i + 1 k = P i + 1 2 + Q i + 1 2 V i 2  
The change in (i + 1)th node voltage at (k + 1)th iteration are obtained using Equations (19) and (20)
  Δ V i + 1 K + 1 = BCBV ]     BIBC   [ I i + 1 K
  V I + 1 K + 1 = [ V 0 Δ V I + 1 K + 1 ] .  
where V 0 is the initial voltage of each node.
The node voltages are updated similarly until the difference between the subsequent node current injection is less than a prescribed tolerance limit.

3. Hybrid HSA—PABC

3.1. Overview of HSA

The harmony search algorithm imitates the improvisation steps of music by a variety of possible combinations of musical pitches to obtain a harmonious melody [50]. The stochastic searching capability of the HSA algorithm eliminates derivative information of the problem to be optimized; it is capable of handling discrete and continuous decision variables [51].
The overall performance of HSA depends on the following parameters: harmony memory consideration rate (HMCR), bandwidth (BW), harmony memory vector size (HMVS), and pitch adjustment rate (PAR). The steps to improvise the initial HMVS are as follows. (Equation (21))
Random   initialization   of   harmony   memory   vector   ( HMVS ) Updating   the   HMV   using   HMCR   as if   ( rand 1   ( 0 ,   1 )   <   HMCR ) X ij new X ij     { X i 1 ,   X i 2 ,   , X i HMS } else X ij new X ij     X i end
The decision variable available in HMV is modified as (Equation (21))
if   ( rand 2   ( 0 ,   1 )   <   PAR ) X ij new   =   X ij new   ±   λ
where λ is chosen between the two adjacent discrete decision variable values when the decision variables are discrete (status of open/closed switch in the network branches, DG units, and SC location)
X ij new   =   X ij new   ±   rand 3   ( 1 ,   1 )     BW If   the   decision   variables   are   continuous   ( DG   units   and   SC   ratings ) else X ij new   =   X ij
where “BW” signifies the distance bandwidth. In this manner, the HMV values are enhanced iteratively.

Proposed HSA—PABC Algorithm

The classical HSA is incapable while doing local search and traps in local optima. The local searching ability of the HSA is improvised by integrating the HSA with particle swarm ABC algorithm (PABC) optimization techniques [42]. To produce the best solutions within the search space, the initial food source taken by the PABC algorithm is from the HMV of the HSA. By using the PABC algorithm, the populations in the HMV are explored and exploited by the PABC algorithm. In this way, the HMV is enhanced by using the potency of the PABC algorithm to obtain the best solution. The proposed HSA–PABC works efficiently for both discrete and continuous optimization problems.
The control parameters of the hybrid HSA—PABC algorithm are harmony memory size (HMS), pitch adjustment rate (PAR), harmony memory consideration rate (HMCR), scout bee limit (SBL), and the specified number of maximum cycle number (MCNspecified). The flowchart of the hybrid HSA—PABC algorithm is depicted in Figure 5.
The algorithmic steps are
  • Step 1: Initialize the tuning parameters: HMS, PAR, HMCR, SBL, MCNspecified.
  • Step 2: Initiate the HMV with random populations.
  • Step 3: Update MCN = MCN + 1.
  • Step 4: The random populations stored in the HMV are improved by the employed bee of the PABC algorithm using Equation (23).
Xjknew = [ω Xjk + C1 ϕjk(Xkbest − Xjk) + C2 ϕjk(Xnk − Xjk)]
Apply the greedy selection steps to the obtained solution using Steps 2 to 4. The searching for food sources based on the probability Pj is estimated using Equation (24)
  P j = fitness j j = 1 HMS fitness j
The fitness values in HMV are obtained using the Equation (25).
  fitness j   = ( 1 / ( 1 + objective   function   ( j ) )
For each jth solution, the objective function (j) is computed using Equation (5).
  • Step 5: The new food source location Xjknew is computed by the onlooker bee based on the best fitness probability (Equation (26))
Xjknew = {Xjkold + u (Xjkold − Xnk)}
where n ϵ {1, 2, …, CS} and k ϵ {1, 2, …, D} are arbitrary indexes and D denotes the number of parameters to be optimized; n ≠ j; ‘u’ is the random variable populated within [−1 and 1]. If the food position Xjknew calculated using Equation (26) exceeds the boundary limits, the new values are allocated as boundary values as shown below:
Xjknew = Xjmin, if Xjknew ≤ Xjmin
Xjknew = Xjmax, if Xjknew ≥ Xjmax
  • Step 6: The scout bee replaces the abandoned solution with a new random solution populated using Equation (27):
Xjk(new) = min (Xjk) + rand (0,1) [(max (Xjk) − min (Xjk)]
  • Step 7: Preserve the better optimal solution in HMV.
  • Step 8: HSA steps for updating HMV:
  • Perform the improvisation steps for decision variables stored in the HMV using HMCR, and PAR using Equations (21) and (22).
  • Step 9: Calculate the new HMV and update HMV if it is better than the existing one.
  • Step 10: Update MCN = MCN + 1.
  • Step 11: Verify whether the specified MCN total has been reached.
  • Step 12: If not, rerun from Step 4 until MCN = MCNspecified.
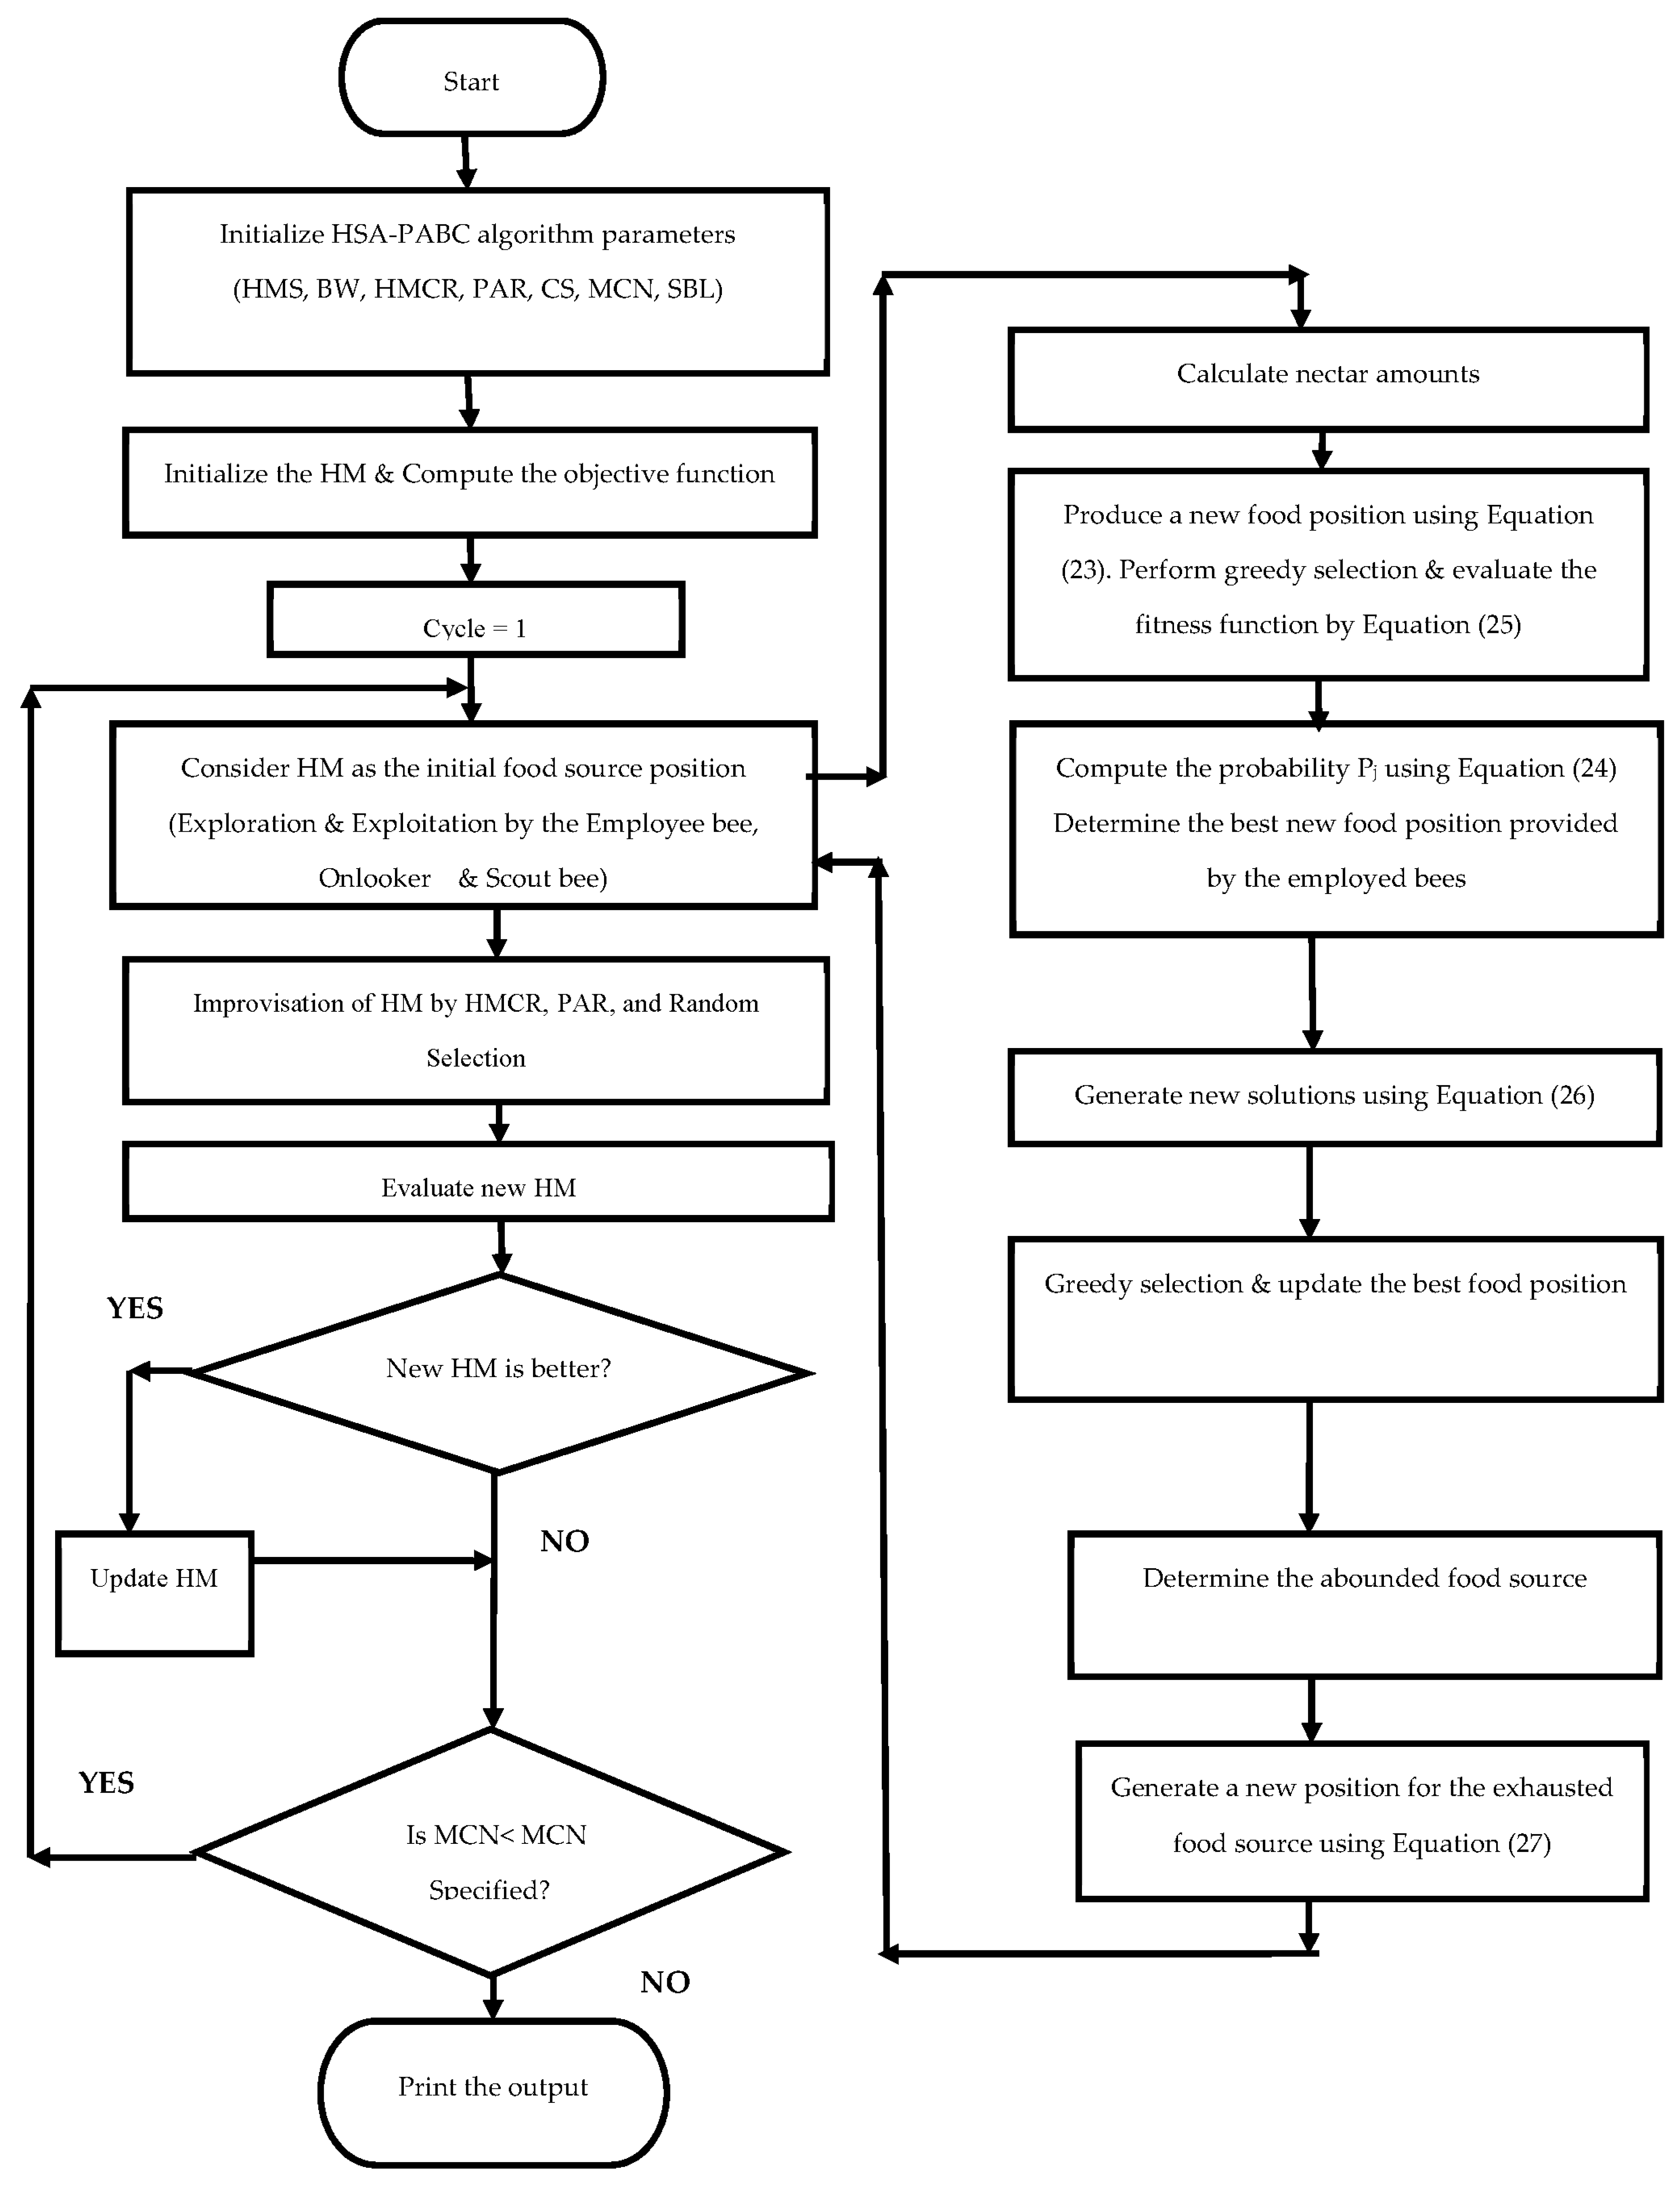
Figure 5. Flowchart of HSA—PABC algorithm.
Sustainability 14 11480 g005

4. Results and Discussion

To demonstrate the efficiency of the hybrid HSA–PABC algorithm, the following eight different scenarios were considered.
Performance of the RPDN before and after network reconfiguration (Scenario-I and II):
  • Scenario-I: System with base case radial topology.
  • Scenario-II: System with optimal reconfiguration topology.
Performance of the RPDN in the presence of DG units and SCs before network reconfiguration (Scenario-III–V):
  • Scenario-III: Placement of SCs at the potential nodes in base case topology.
  • Scenario-IV: Placement of solar PV-DG units at the potential nodes in base case topology.
  • Scenario-V: Placement of solar PV-DG units and SCs at the potential nodes in base case topology.
Performance of the RPDN in the presence of DG units and SCs after network reconfiguration (Scenario-VI–VIII):
  • Scenario-VI: Placement of SCs at the candidate nodes in optimal reconfiguration topology.
  • Scenario-VII: Placement of solar PV-DG units at the potential nodes in optimal reconfiguration topology.
  • Scenario-VIII: Placement of solar PV-DG units and SCs at the potential nodes in optimal reconfiguration topology.

4.1. Performance of the Networks before and after Network Reconfiguration (Scenarios I–II)

The operating conditions and the network data of 69 and 118 node RPDNs before reconfiguration (Scenario-I) at 100% loading condition are depicted in Table 1.

4.1.1. 69 Node RPDN

To evaluate the algorithm suitability, a 69 node RPDN was taken into consideration. This test system consists of 69 nodes, 73 numbers of line branches with 5 tie switches (switches numbered from 69–73), and 68 sectionalizing switches in the branches from 1 to 68. The test system data was acquired from [52].
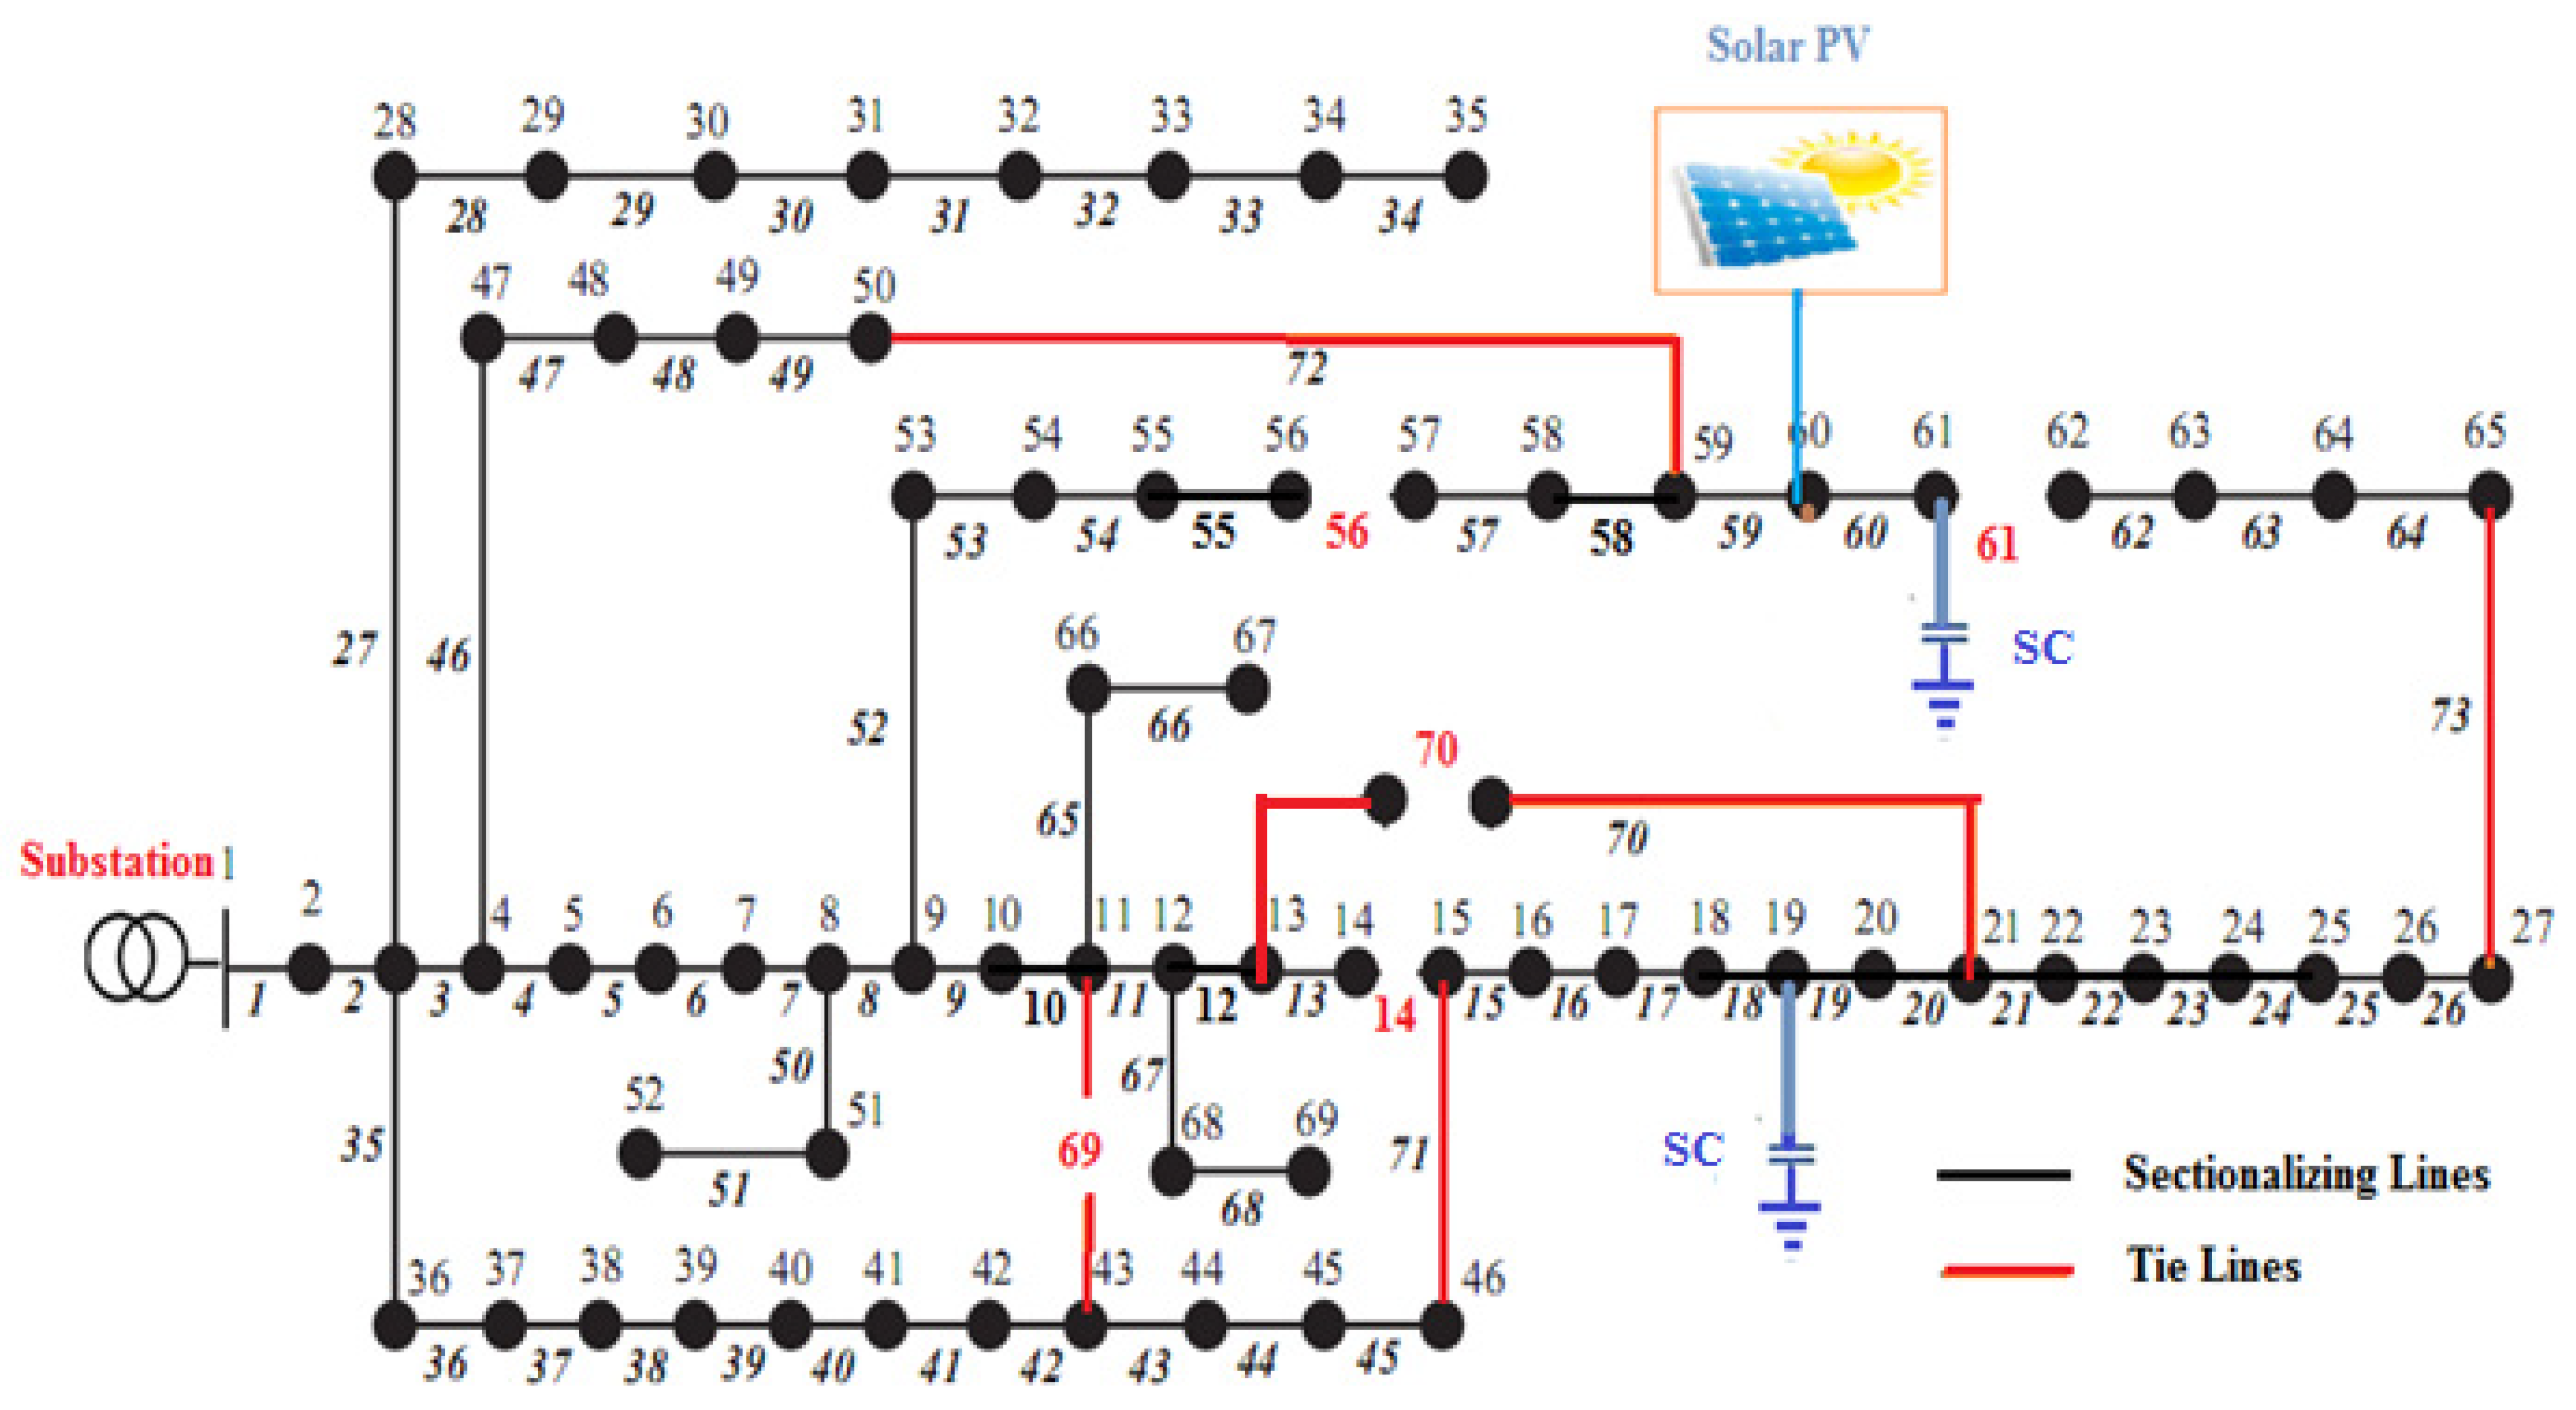
The hybrid HSA–PABC algorithm identifies the optimal radial topology of the network by opening the switches {14-56-61-69-70}. The network’s total power loss is decreased from 224.97 kW to 98.63 kW at 100% load level after reconfiguration, and the minimum voltage magnitude is increased from 0.9092 p.u. to 0.9493 p.u. The optimal reconfiguration topology of the 69 node RPDN is shown in Figure 6.
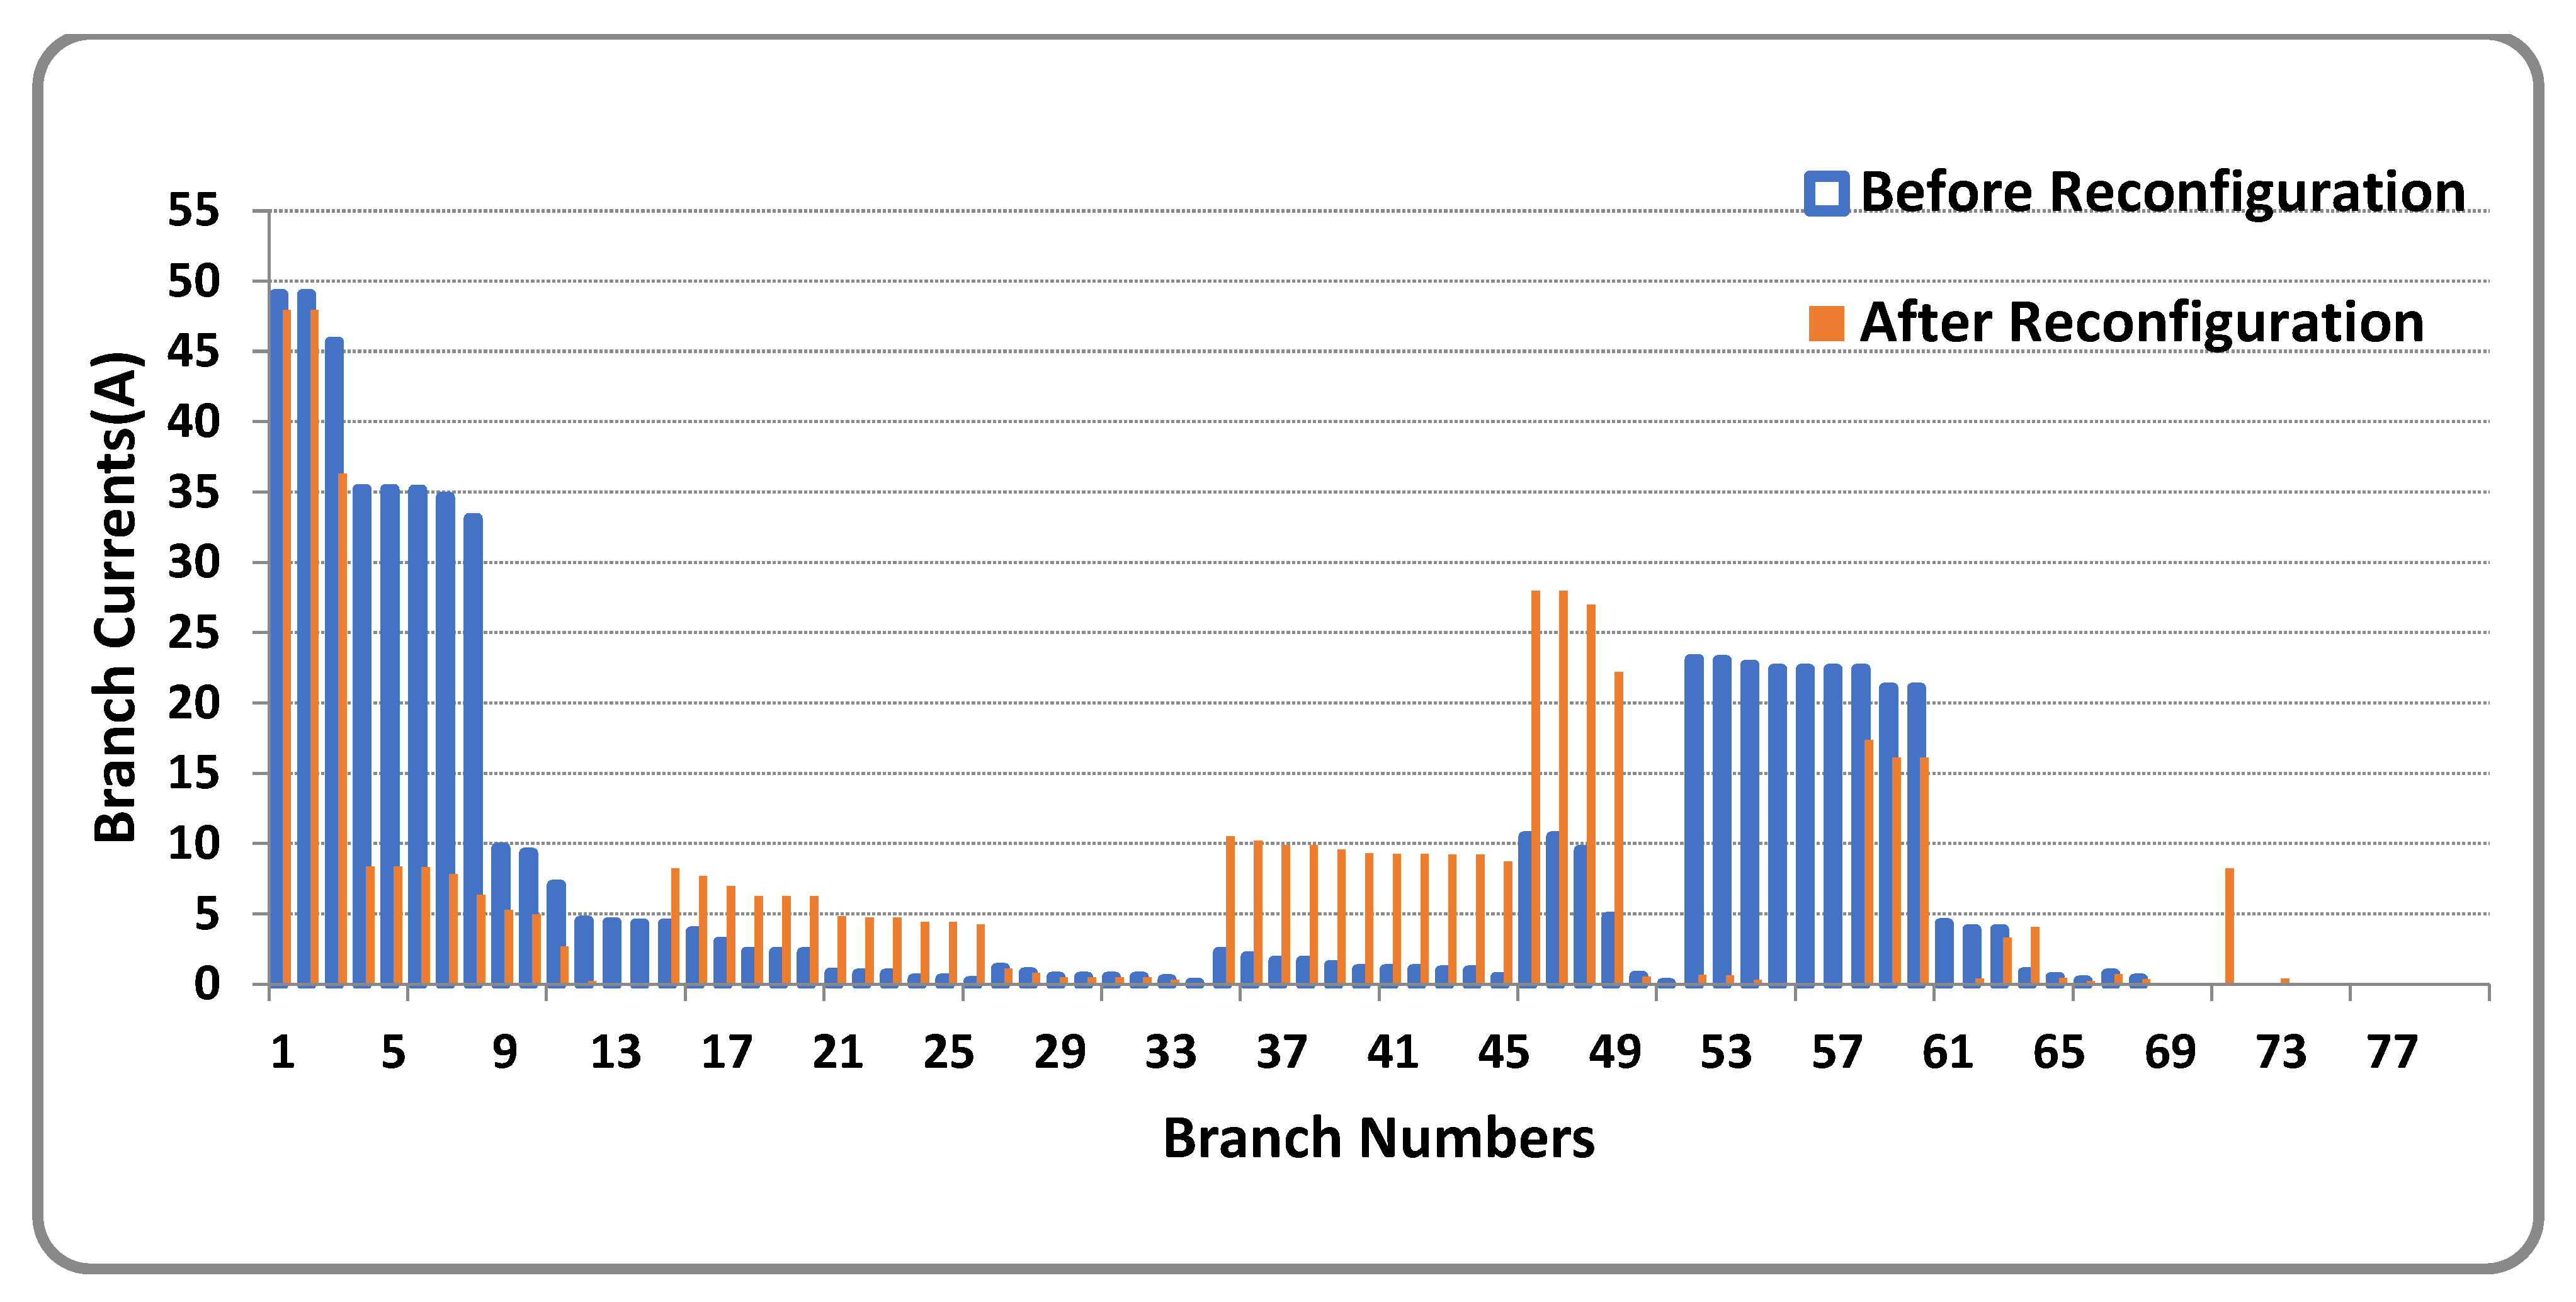
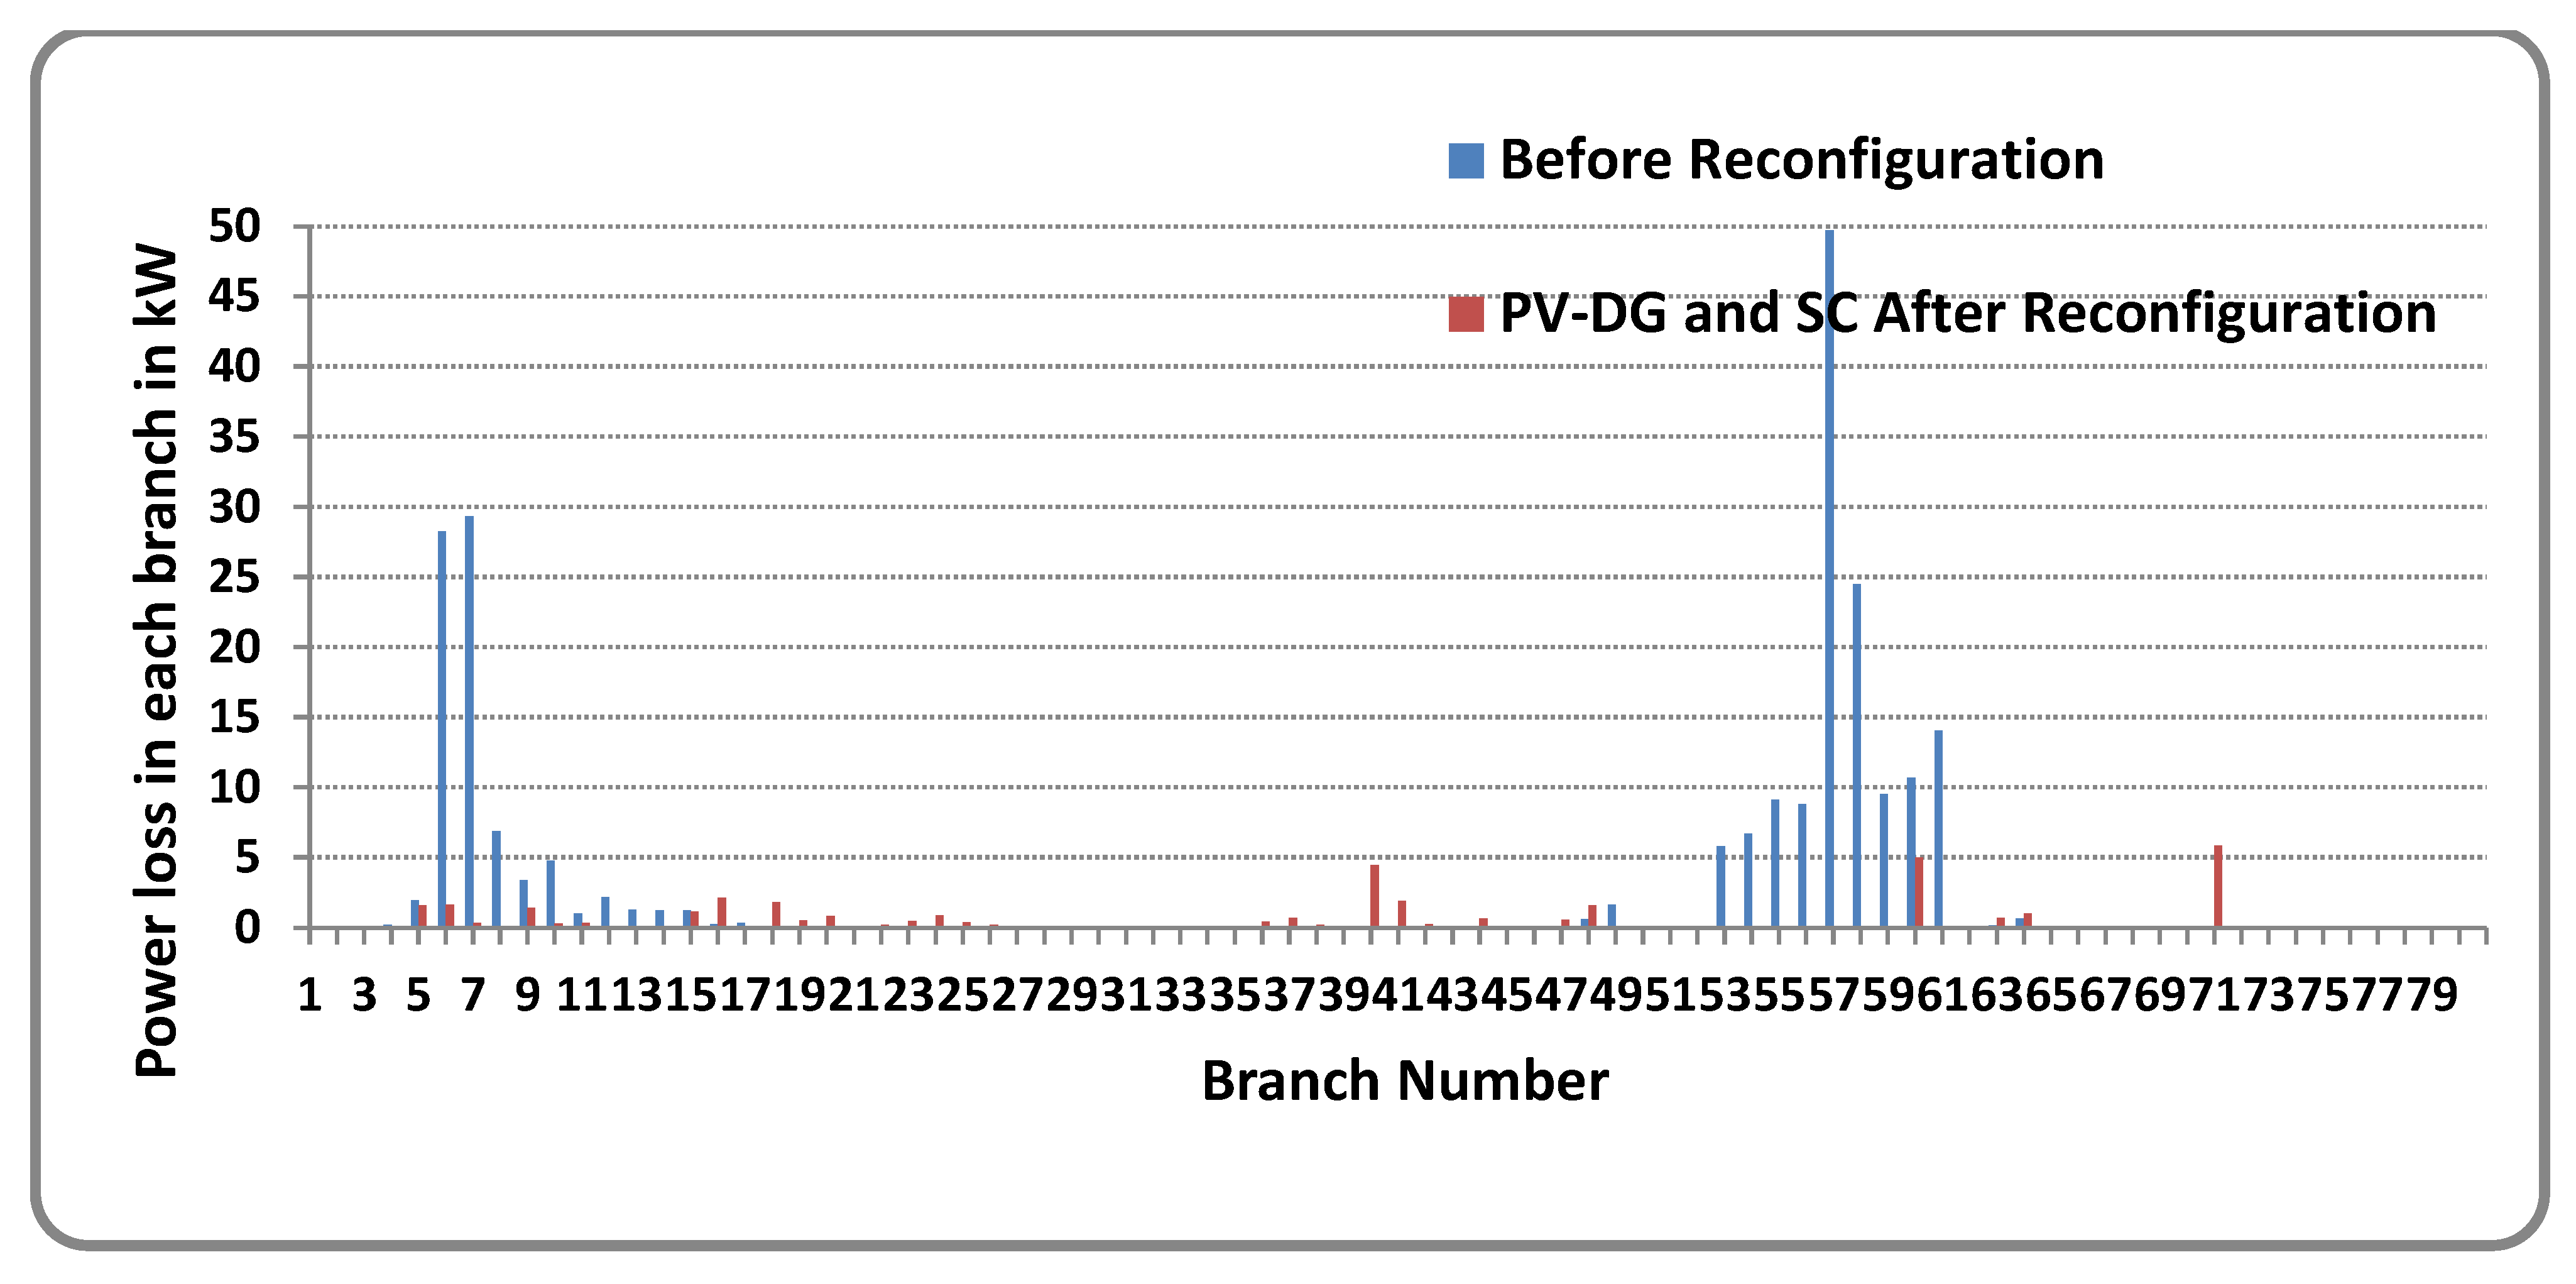
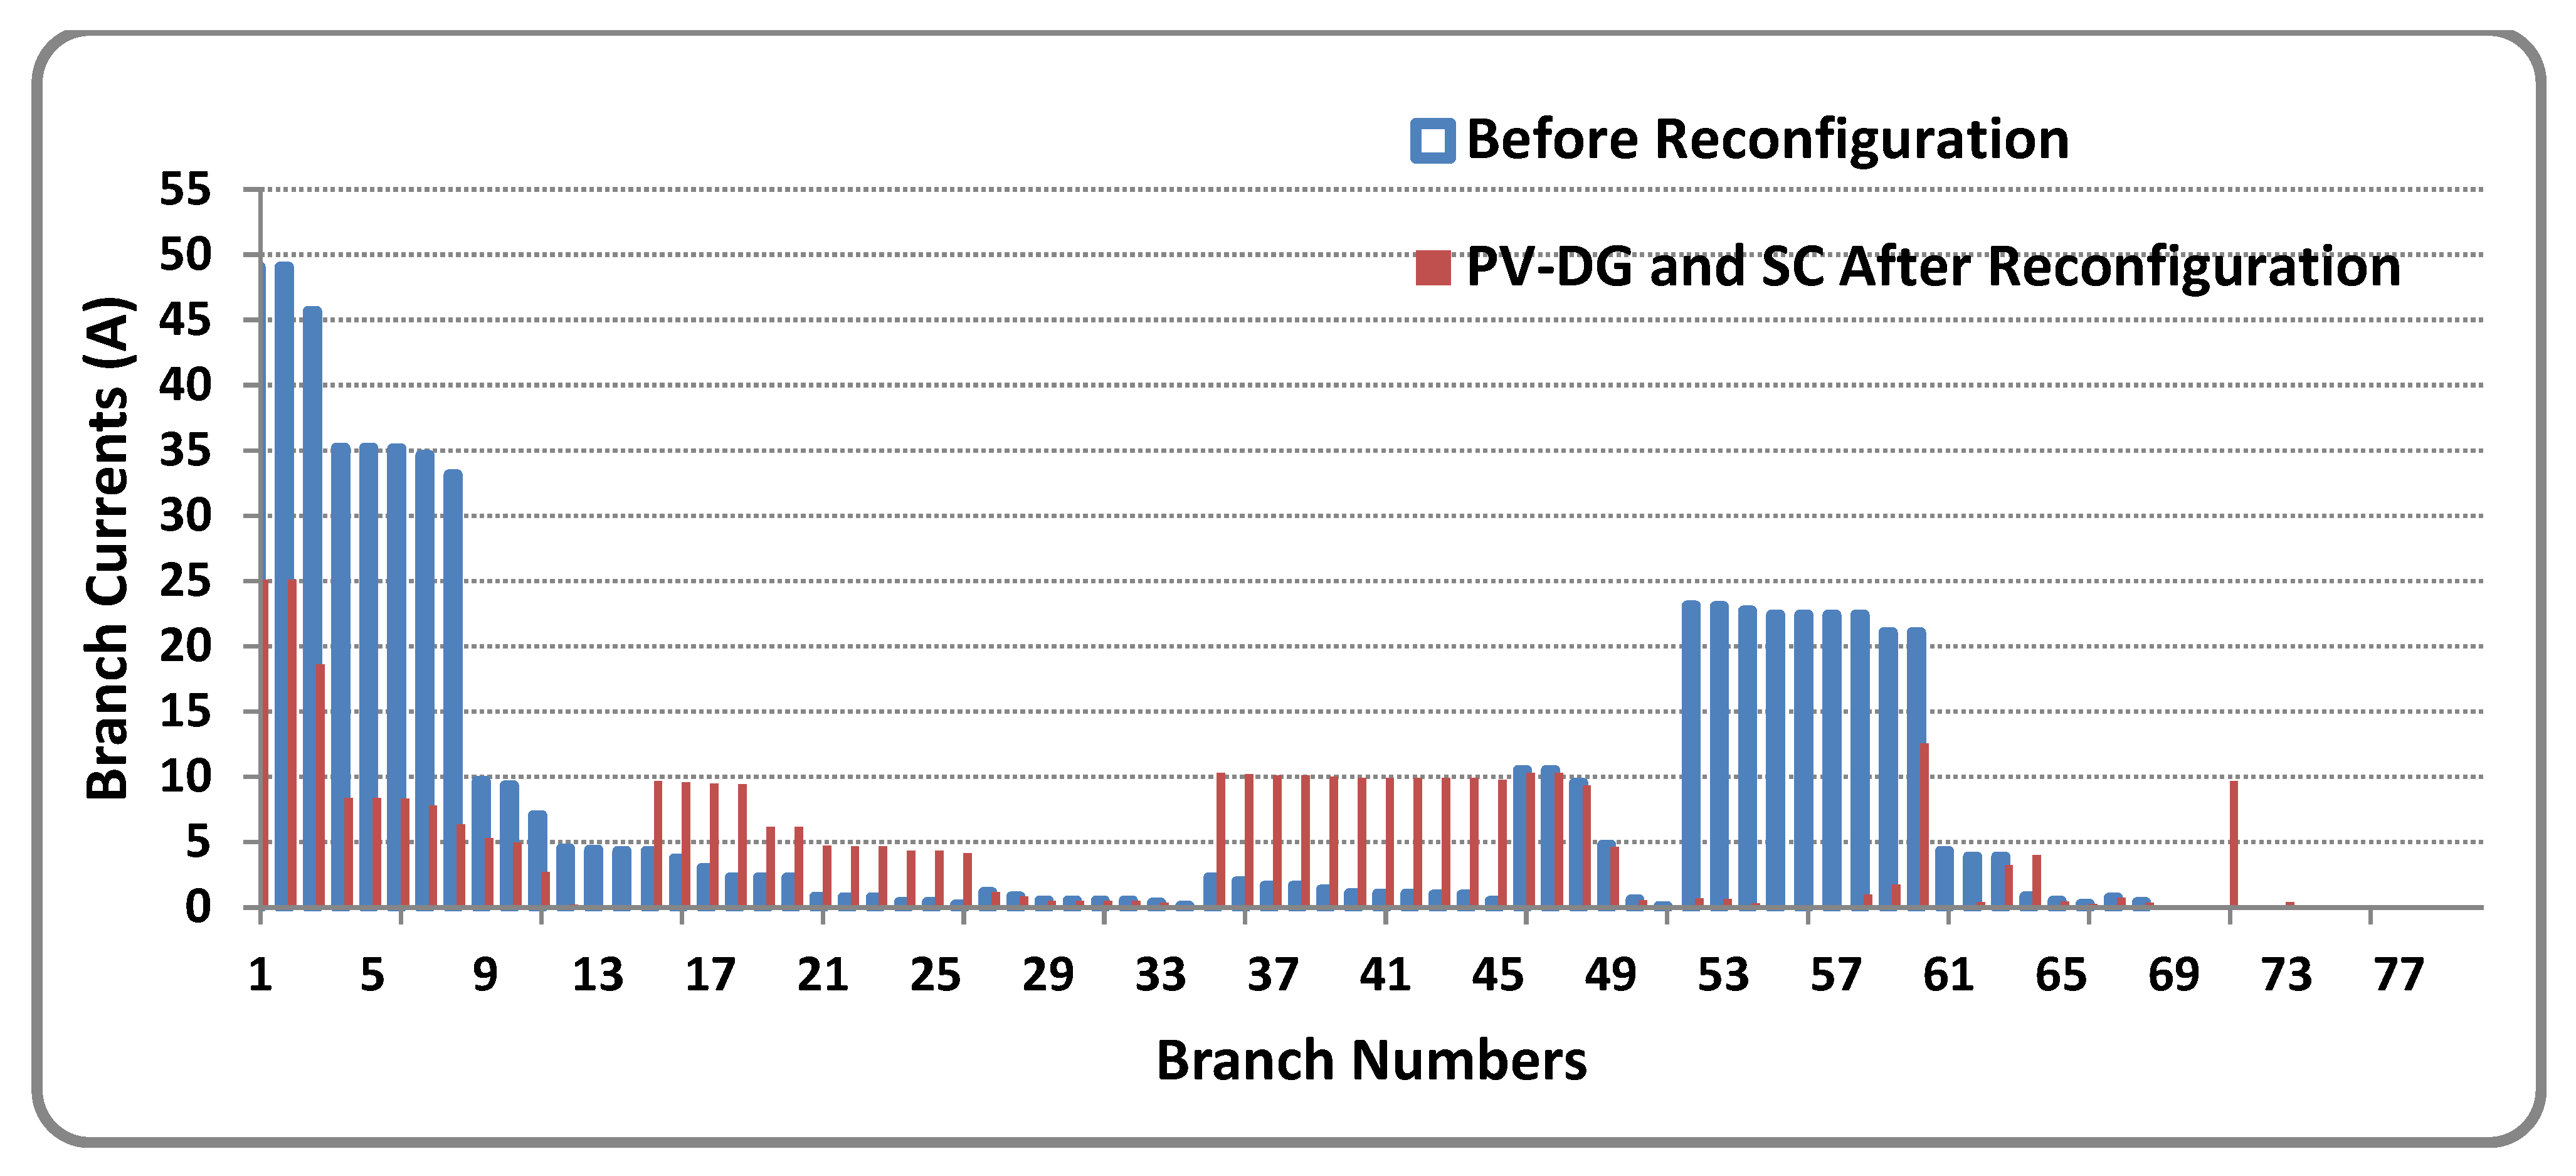
The power loss associated with the network branches with scenario-I and scenario-II is depicted in Figure 7. Red bars and blue bars in Figure 7 and Figure 8 indicate the variation in power flows and the corresponding changes in the currents of the feeder lines before and after topological changes in the network (Scenario-I and Scenario-II). It indicates that as the consequent effect of rerouting the power flows and shifting the load among the feeder lines, the power loss and line flows associated with most of the feeder branches are reduced.
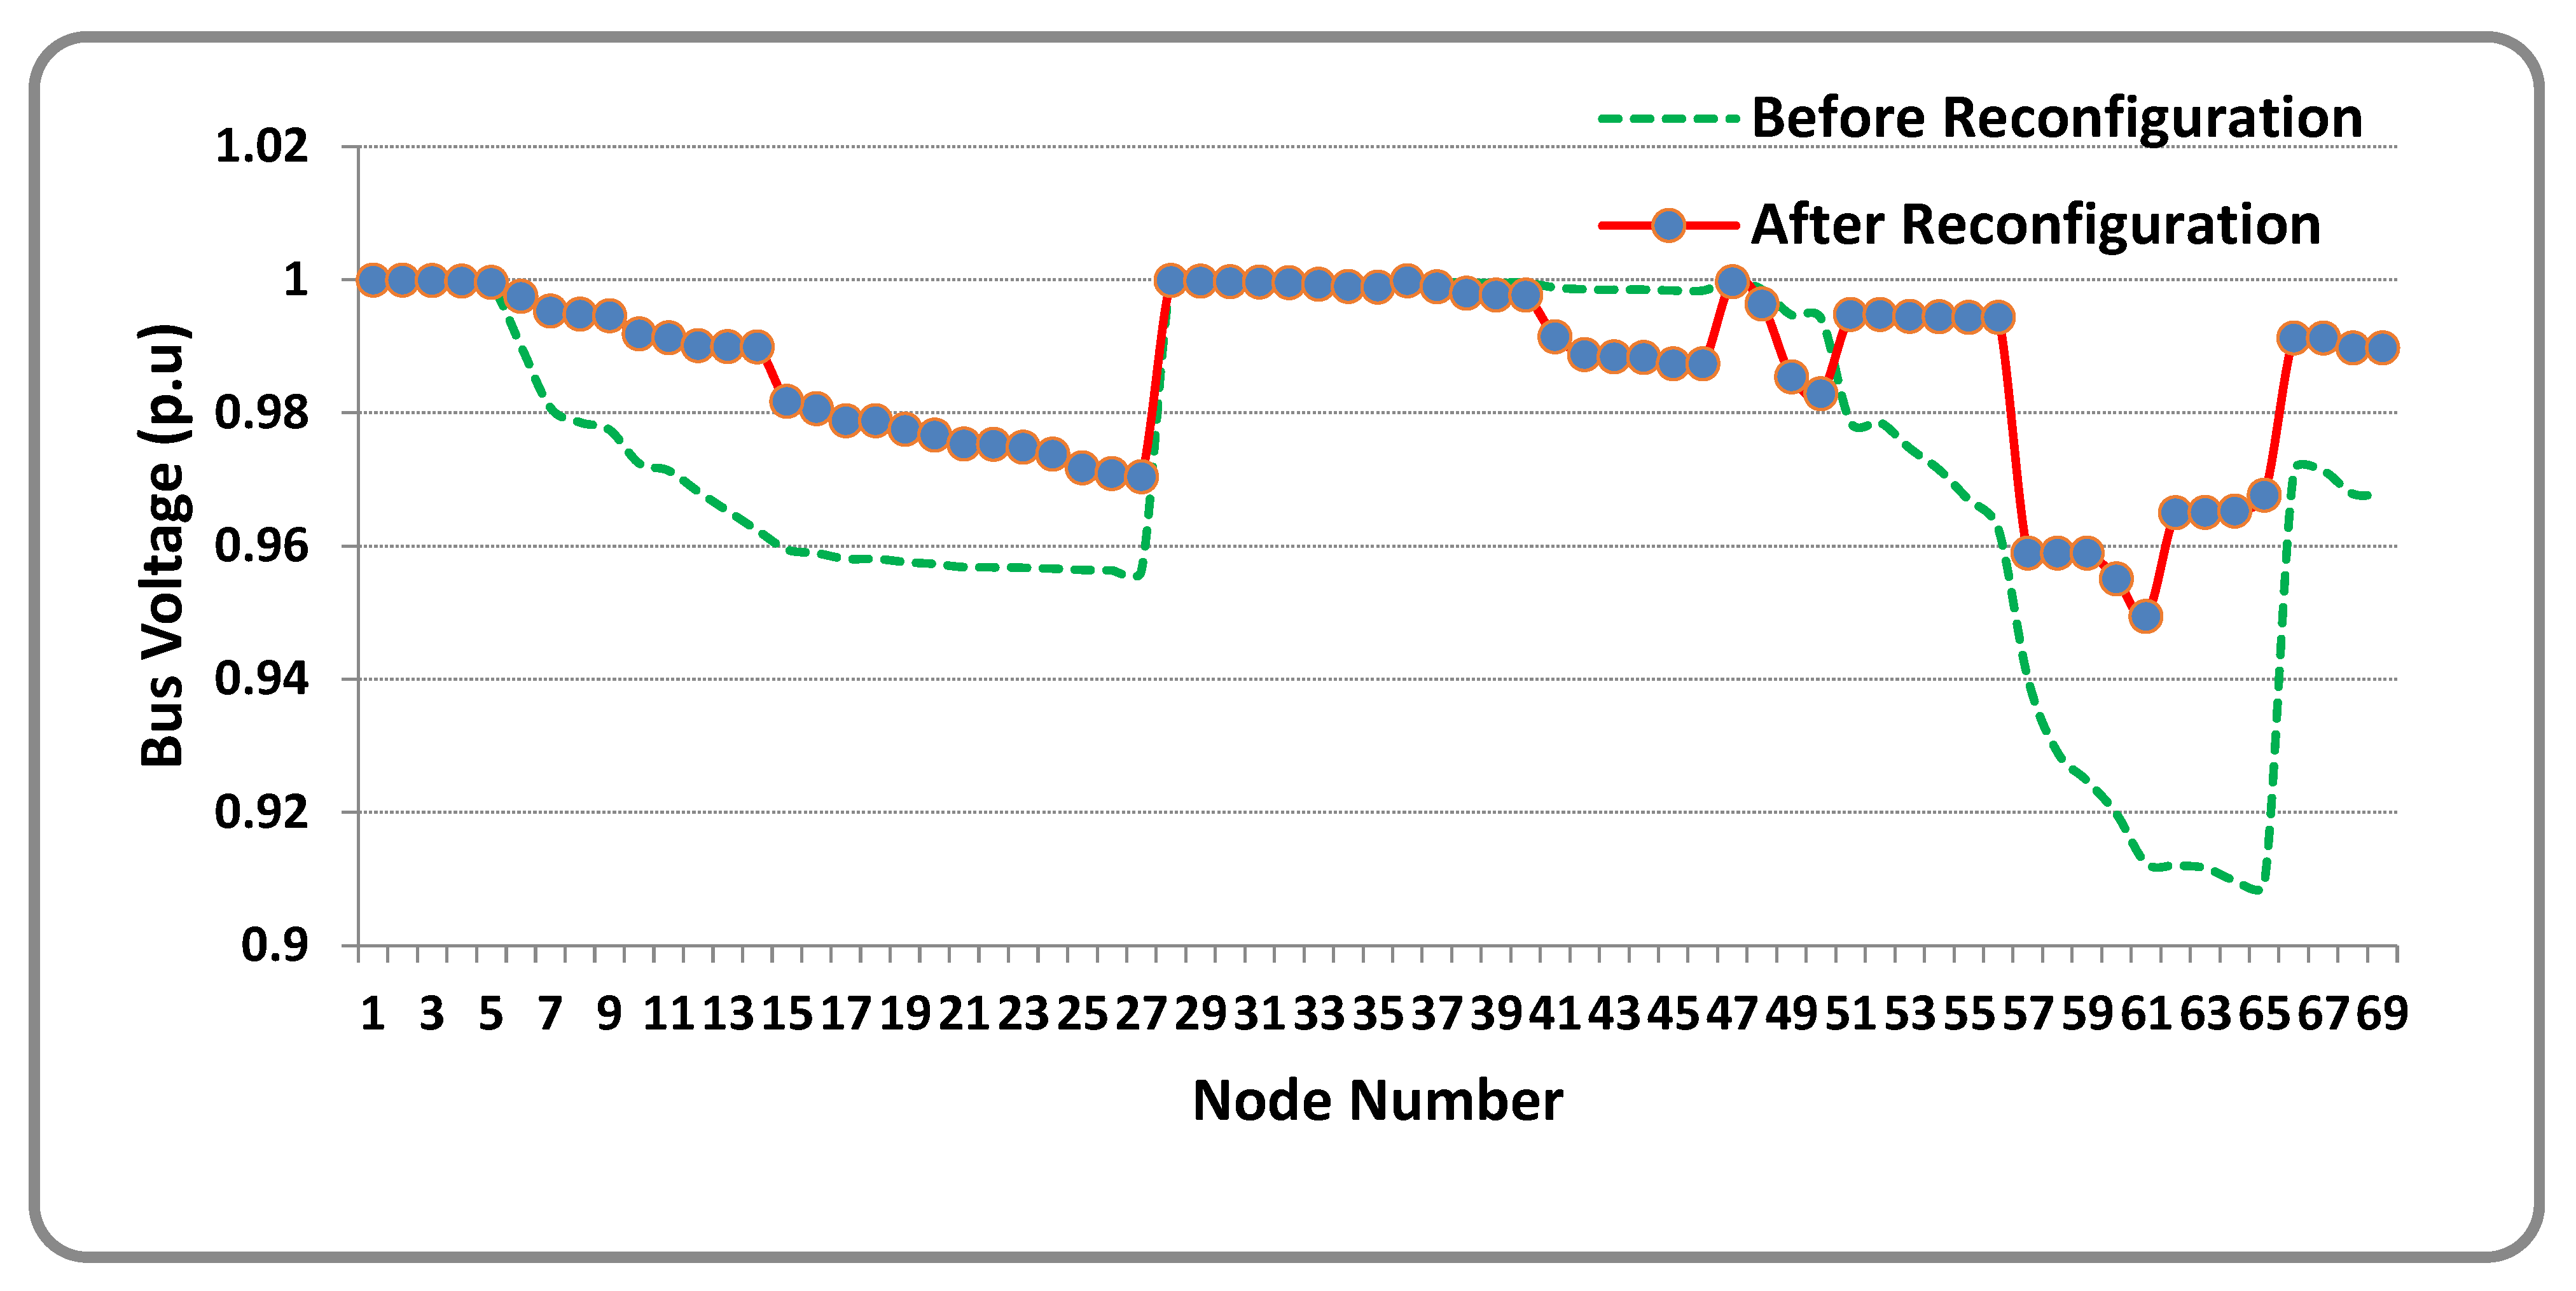
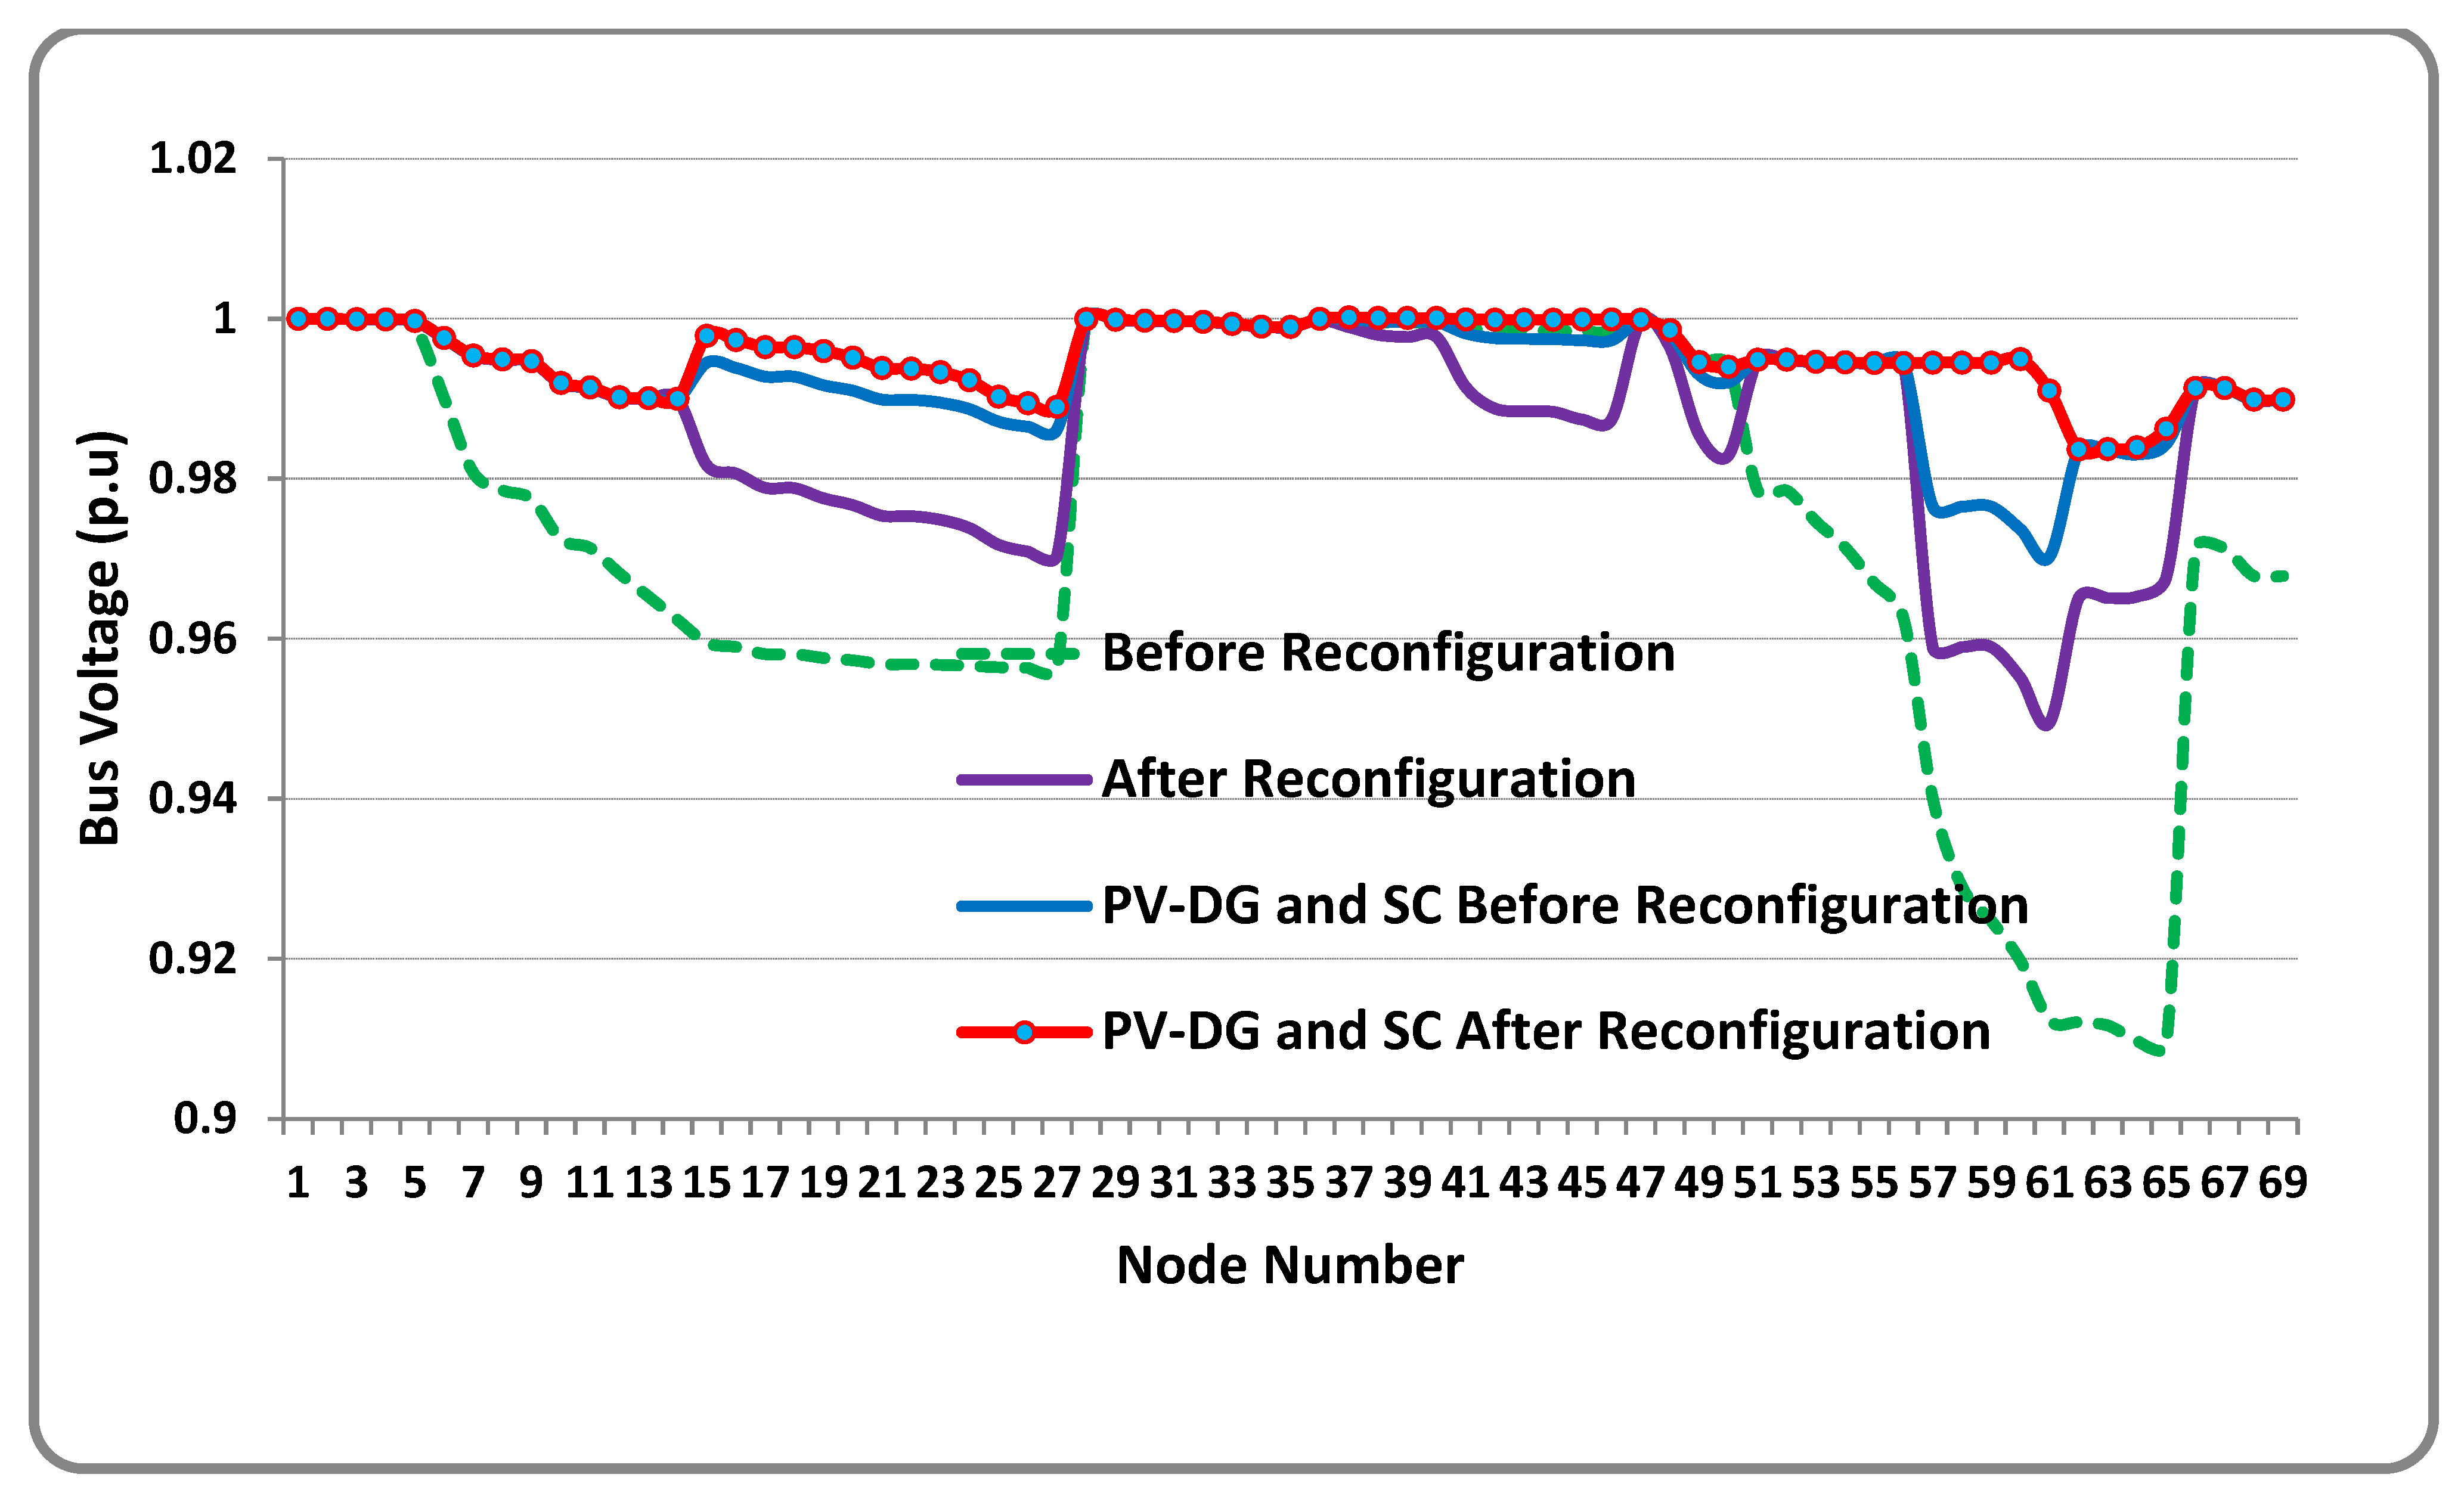
The voltage profile of the network with Scenarios-I and Scenarios-II at 100% load conditions is illustrated in Figure 9, indicating that reconfigured topology (Scenario-II) provides a better voltage profile compared with the voltage profile of the base case radial topological structure of the network (Scenario-I.) As depicted, after reconfiguration, the node voltage of all the nodes raised above 0.9493 p.u. and was found within permissible voltage limits.
Figure 6. ORNT—69 node RPDN (Scenario-II).
Sustainability 14 11480 g006
Figure 7. Real power loss—69 node RPDN (Scenarios I and II at 100% load).
Sustainability 14 11480 g007
Figure 8. Feeder loading—69 node RPDN (Scenarios I and II at 100% load).
Sustainability 14 11480 g008
Simulation findings of the 69 node RPDN for scenarios I and II with three discrete load conditions are depicted in Table 2. The power loss and percentage reduction in power loss with optimal topology (Scenario-II) is 23.60 kW (54.25%), 98.63 kW (56.16%), and 267.07 kW (59.06%) at 50%, 100%, and 160% load levels, respectively.
Figure 9. Node voltage—69 node RPDN (Scenarios I and II at 100% load).
Sustainability 14 11480 g009
To reveal the dominance of the hybrid HSA–PABC at 100% load level, comparative analyses were made with the previous studies presented in the literature. The simulation results of the HSA [53], the enhanced GA [54], the non-revisiting GA [55], the adaptive GA [56], and the proposed hybrid HSA–PABC techniques are presented in Table 3. From the comparative results, the proposed hybrid HSA—PABC identifies the optimum topology of the network by opening the switches {14-56-61-69-70}. The network’s power loss after optimal reconfiguration is 98.63 kW (56.16% loss reduction), which is considerably less than the other solutions shown in Table 3. The minimum voltage magnitude of the network (0.9493 p.u.) obtained is higher than the other methods presented in Table 3.
Table 2. 69 node RPDN for Scenarios I and II with different load levels.
ScenarioItem50% Load100% Load160% Load
Base case radial topology
(Scenario-I)
Open switches69-70-71-72-7369-70-71-72-7369-70-71-72-73
Ploss in kW51.59224.97652.41
Vmin in p.u (Node)0.9566 (65)0.9092 (65)0.8445 (65)
Optimal radial topology (Scenario-II)Open switches14-56-61-69-7014-56-61-69-7014-56-61-69-70
Ploss in kW23.6098.63267.07
Vmin in p.u (Node)0.9753 (61)0.9493 (61)0.9165 (61)
% Loss reduction54.2556.1659.06
Table 3. Performance comparison of HSA—PABC-69 node RPDN at 100% load (Scenario-II).
MethodOpen SwitchesTotal Power Loss (kW)% Loss ReductionVmin (p.u)
Base Topology69-70-71-72-73224.97-0.9092@65
HSA [53]69-70-14-53-61103.2954.080.9411
Enhanced GA [54]15-59-62-70-7199.6255.97-
Non-revisiting GA [55]14-58-61-69-7299.6255.970.9428@50
Adaptive GA [56]15-58-62-70-7199.6055.720.9428@61
Proposed HSA–PABC14-56-61-69-7098.6356.160.9493@61

4.1.2. 118 Node RPDN

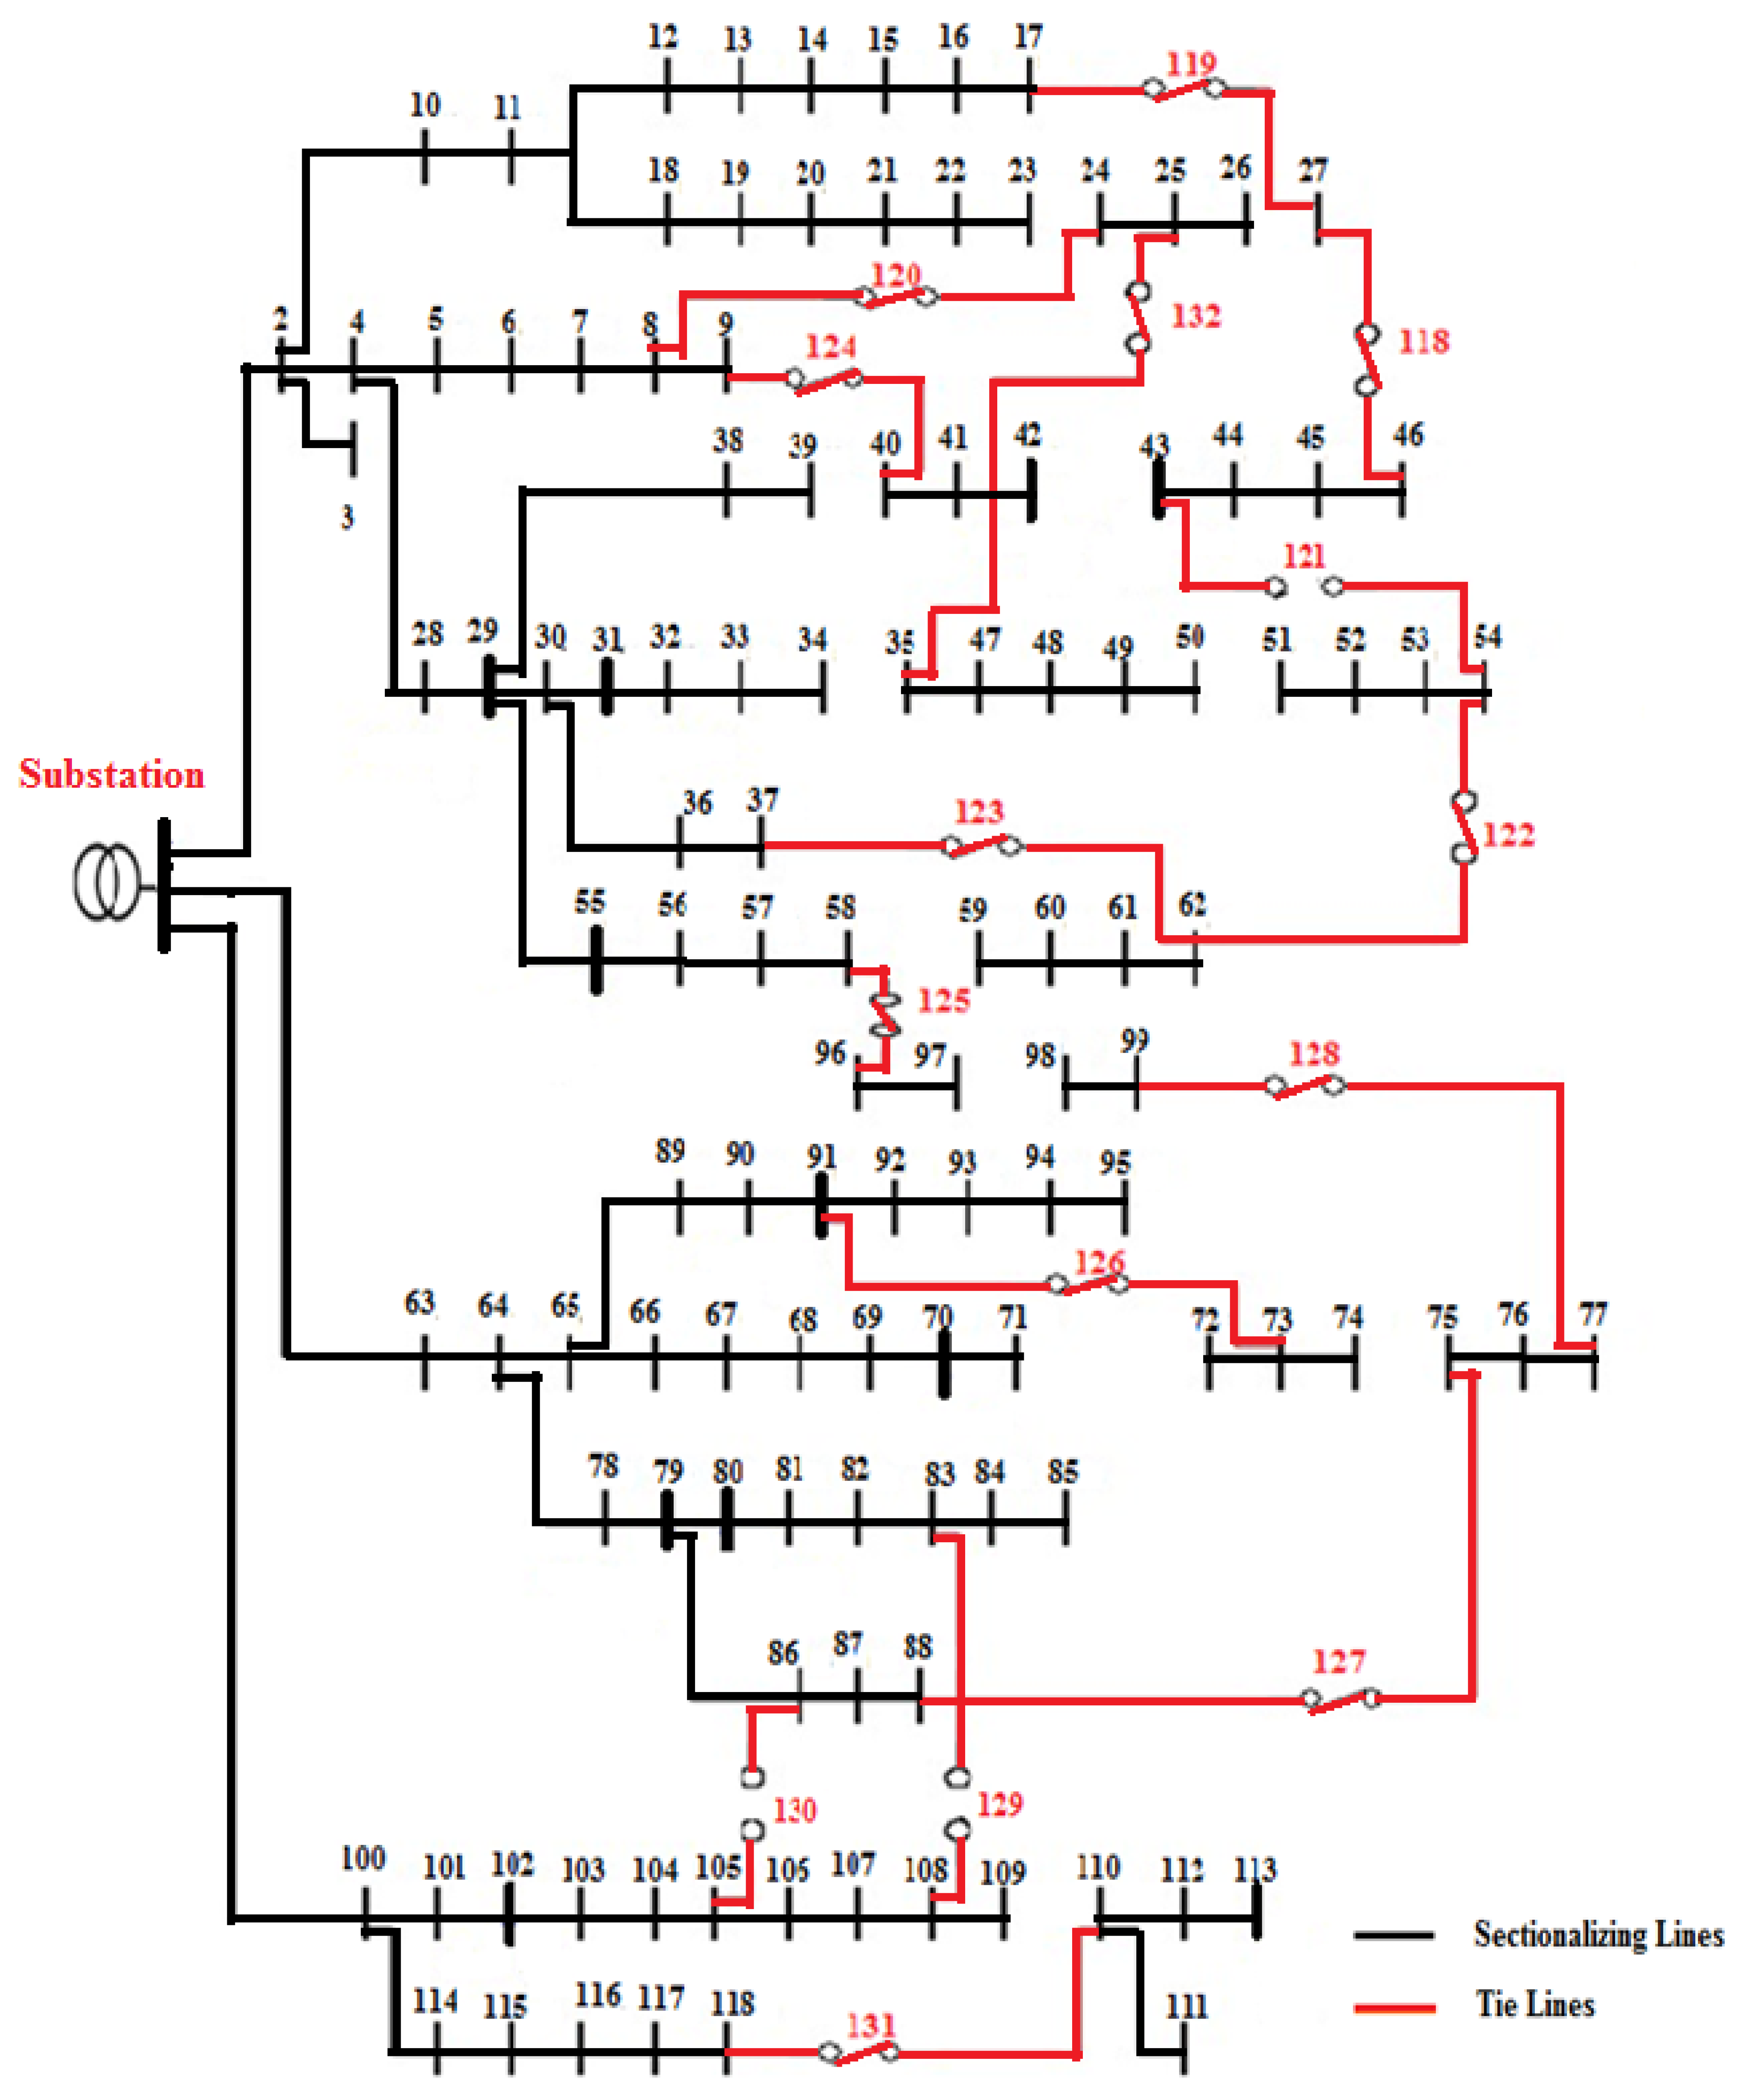
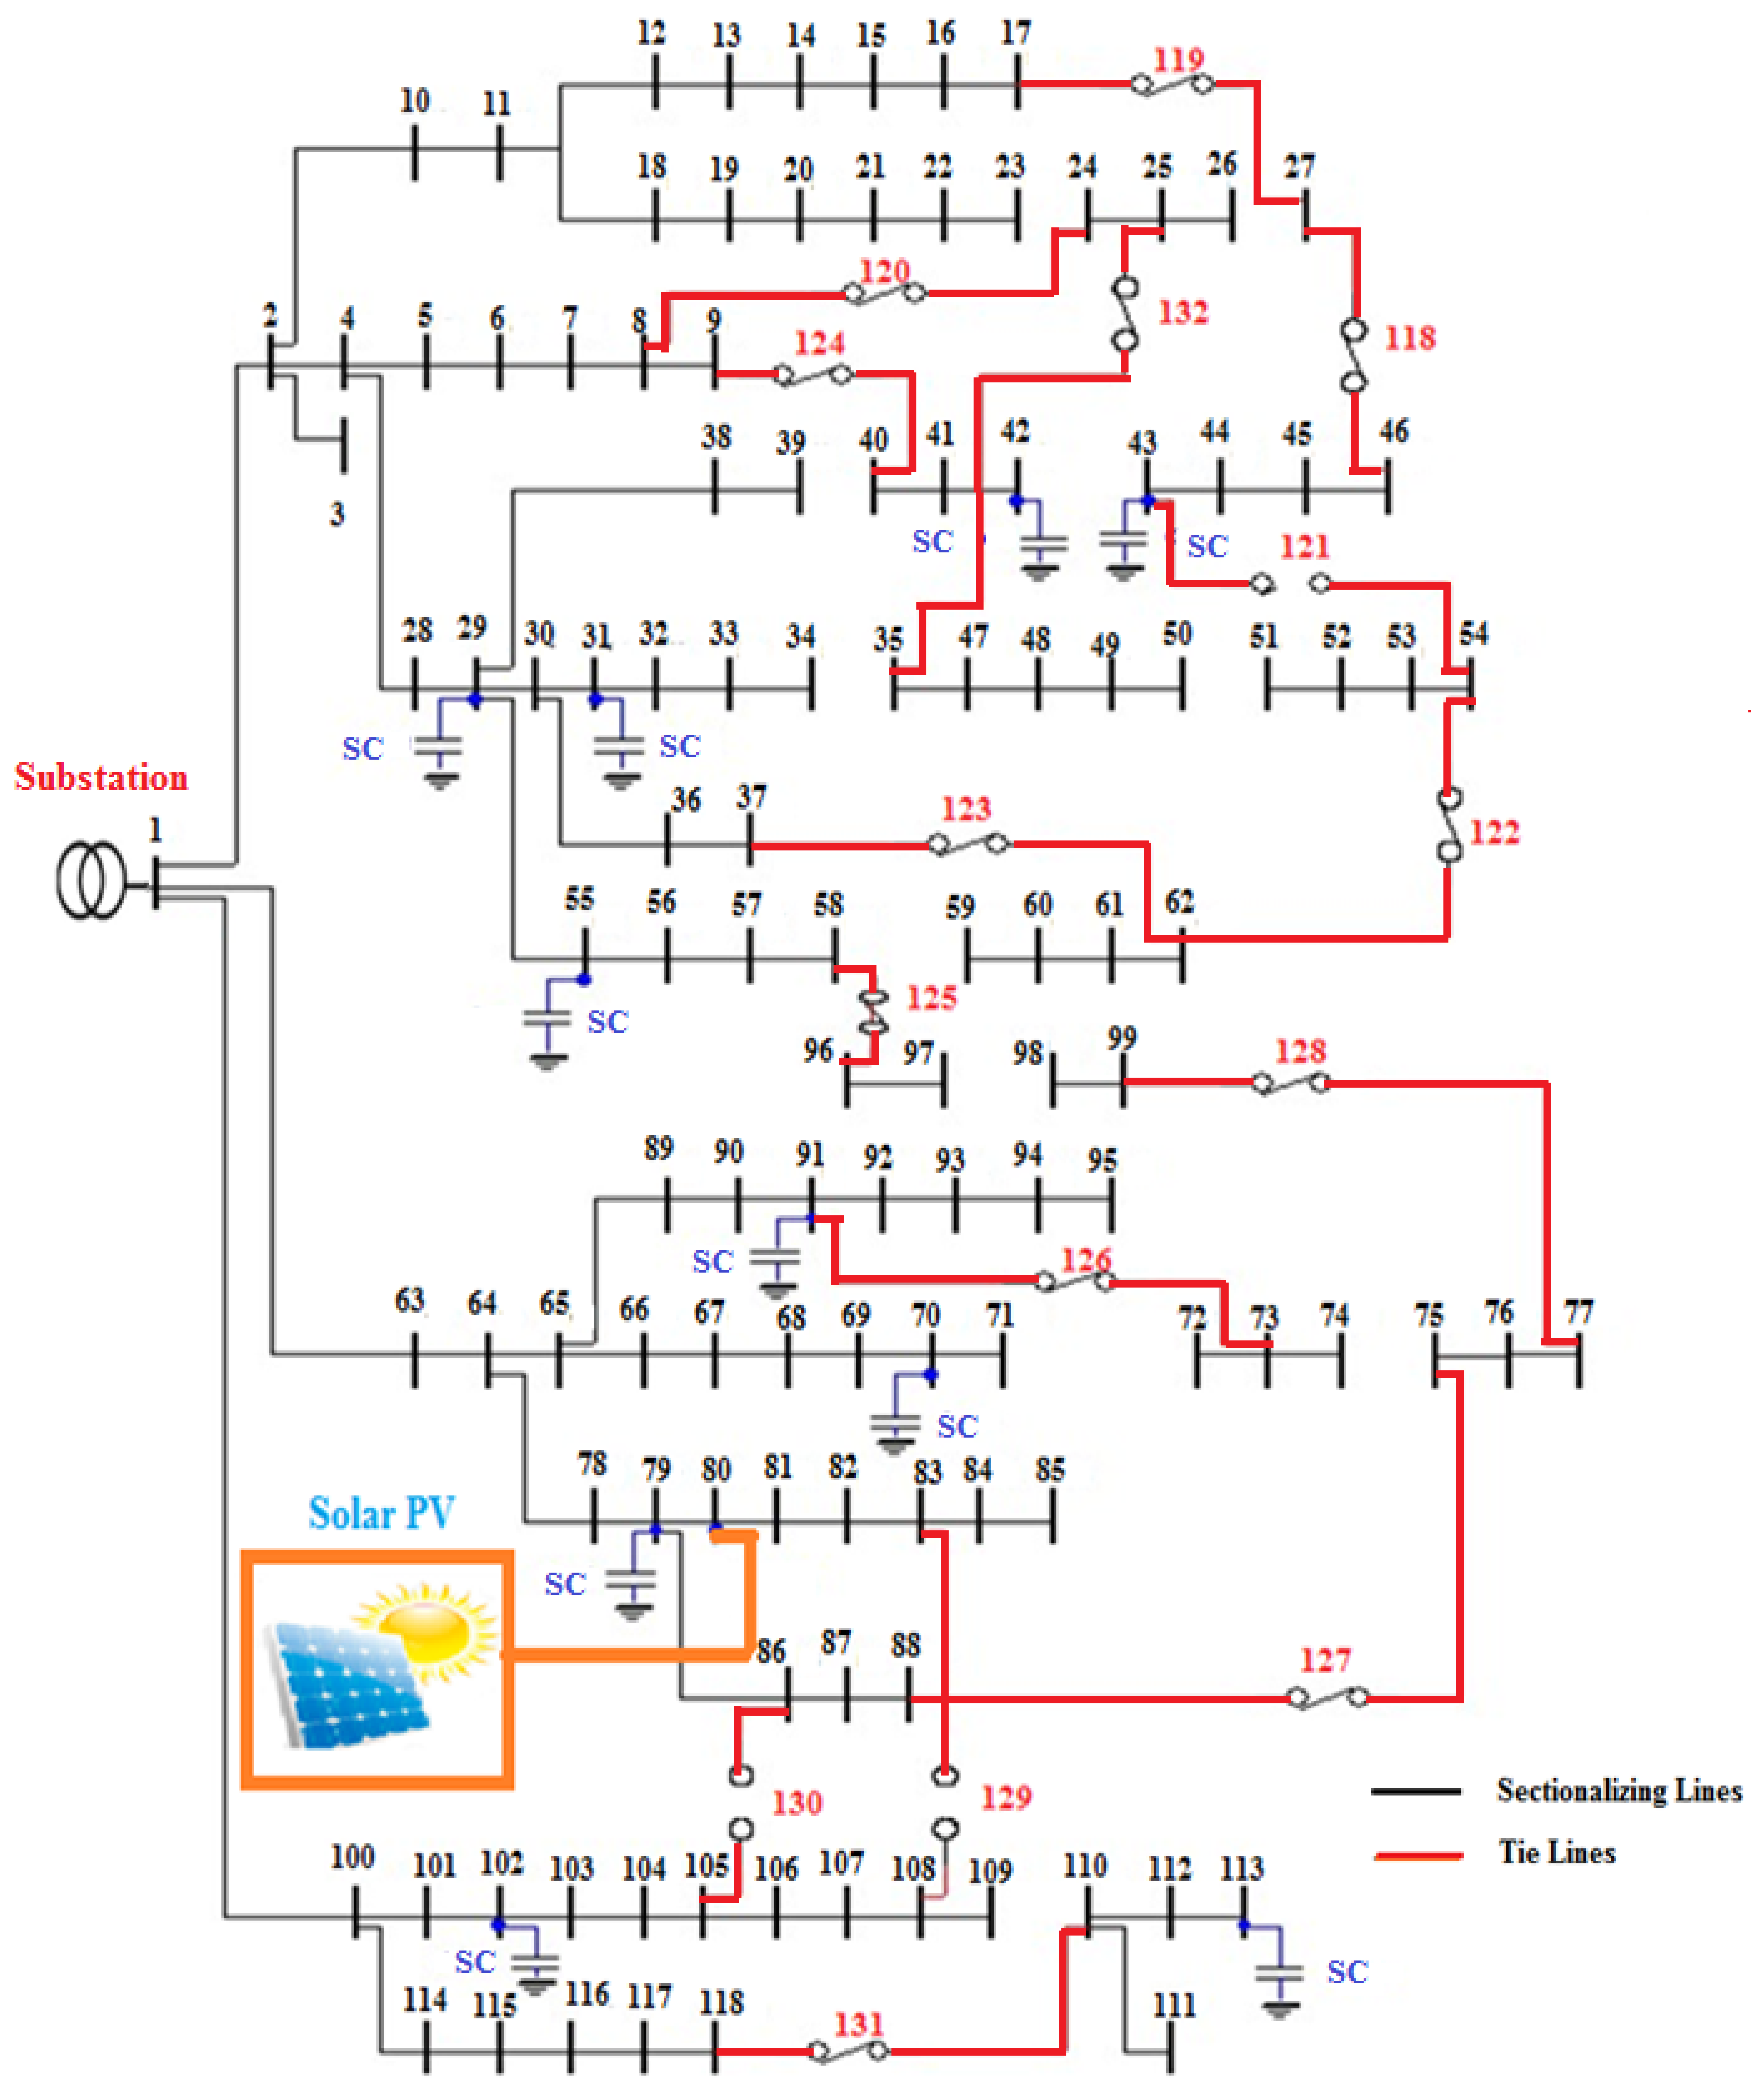
To show the efficiency of the hybrid HSA–PABC algorithm, it was tested on a large-scale 118 node RPDN. The 118 node RPDN data were obtained in [57]. Single-line representation of the RPDN after optimally reconfiguring the network (node numbers are reordered with tie lines highlighted in red colour) is shown in Figure 10 (Scenario-II).
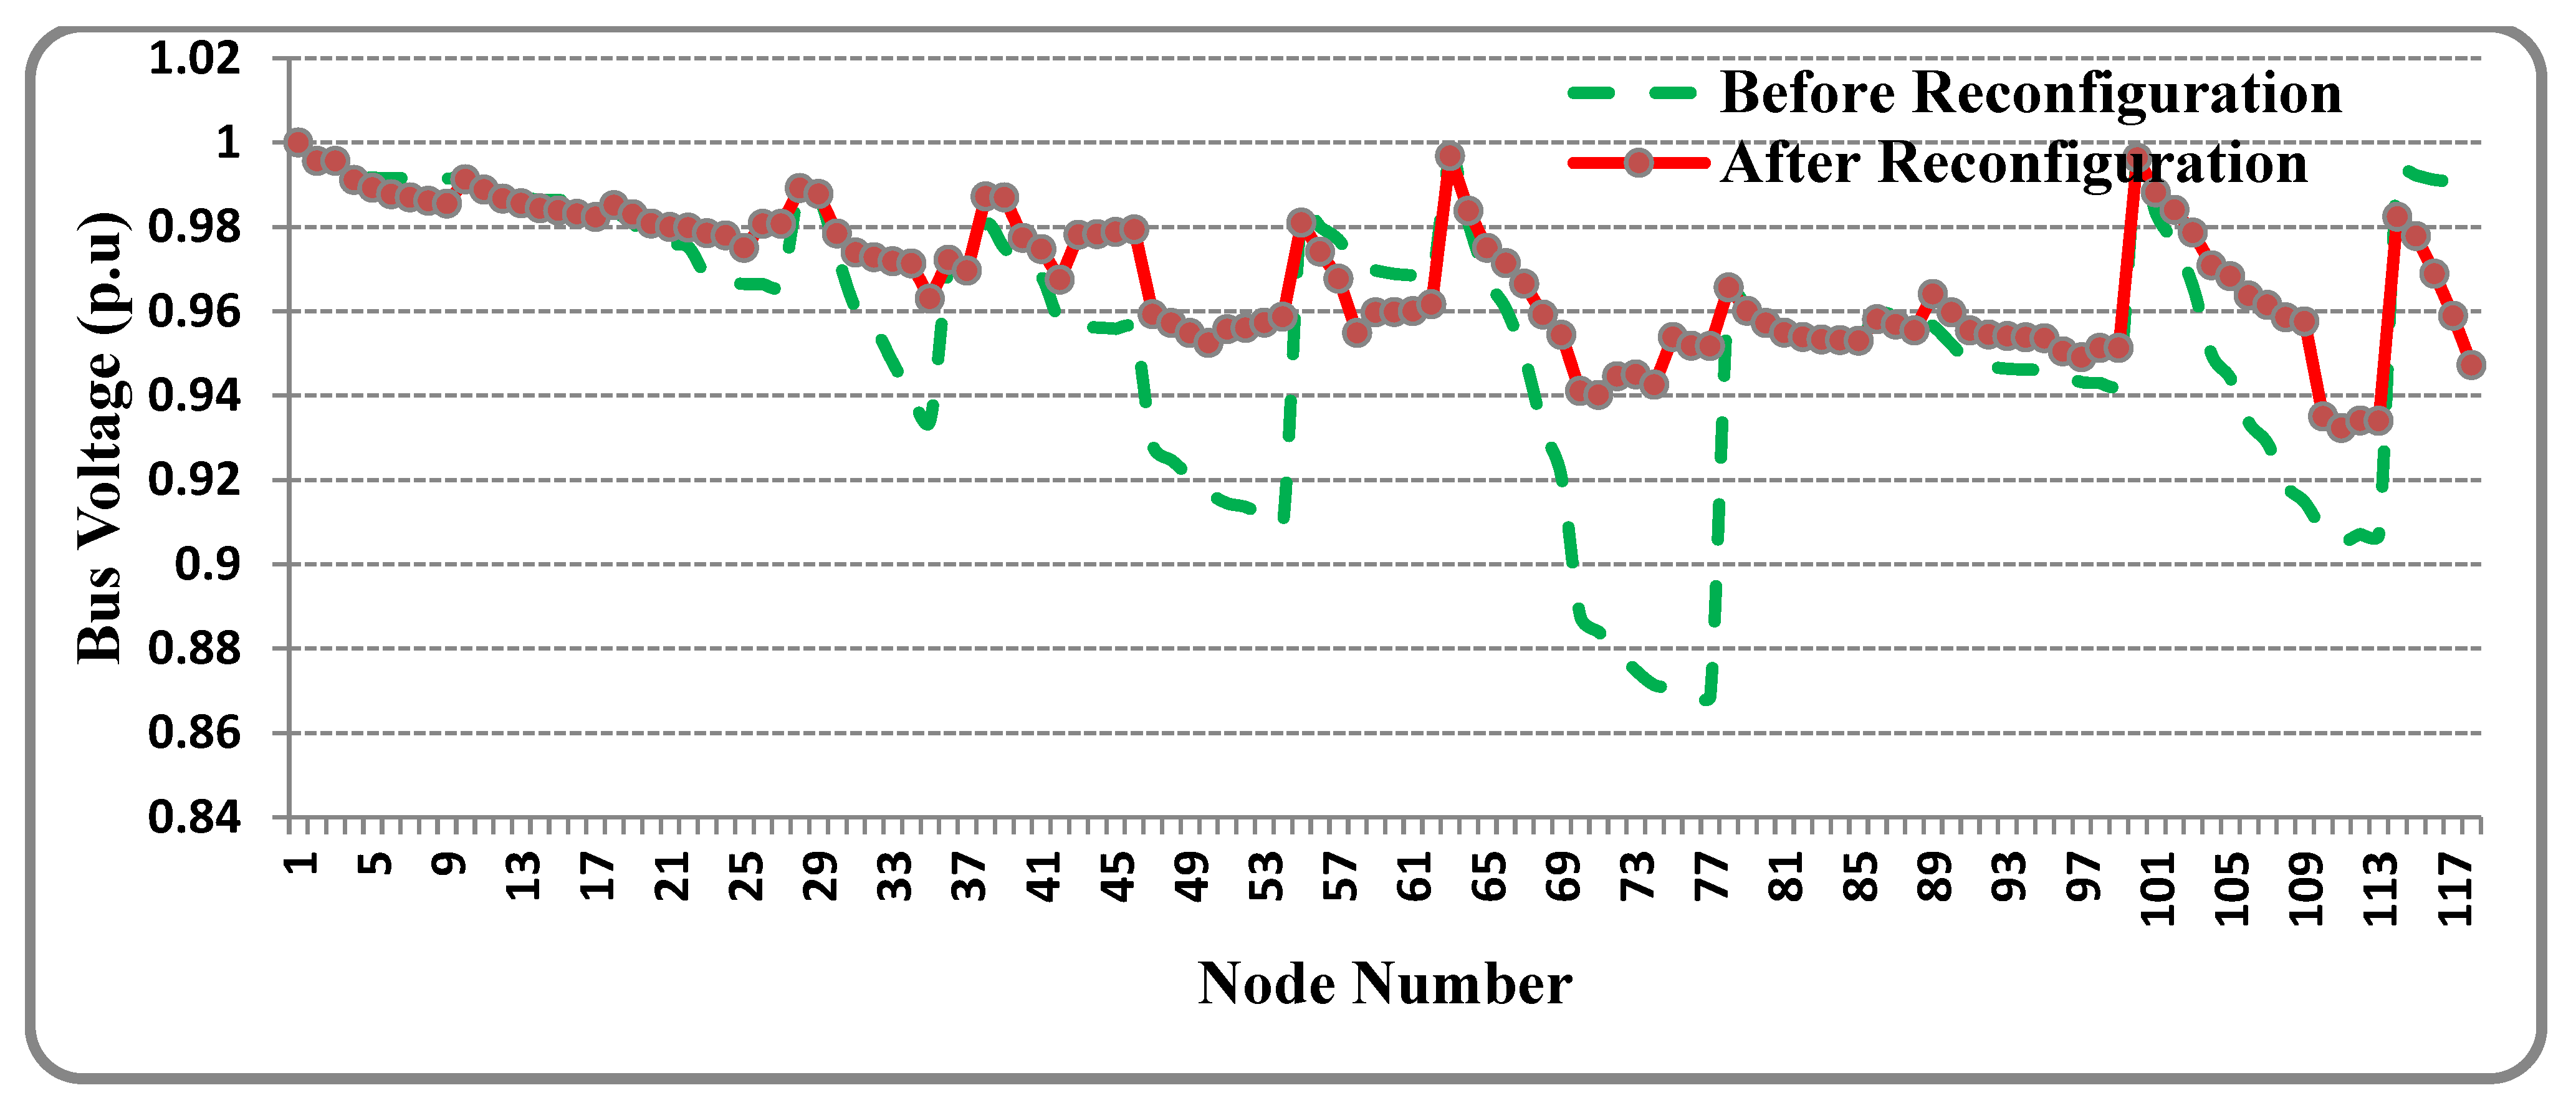
The proposed hybrid algorithm identifies the optimal topology of this test system with the following switches in open condition: 23-26-34-39-42-50-58-71-74-91-97-109-121-129-130. The real power loss with the base case topology is 1298.09 kW with minimum voltage magnitude of 0.8688 in the 77th node at 100% loading condition of the network. After reconfiguration, the power loss of the network was reduced to 853.44 kW with the rise in minimum voltage of 0.9323 p.u at the 111th node of the network.
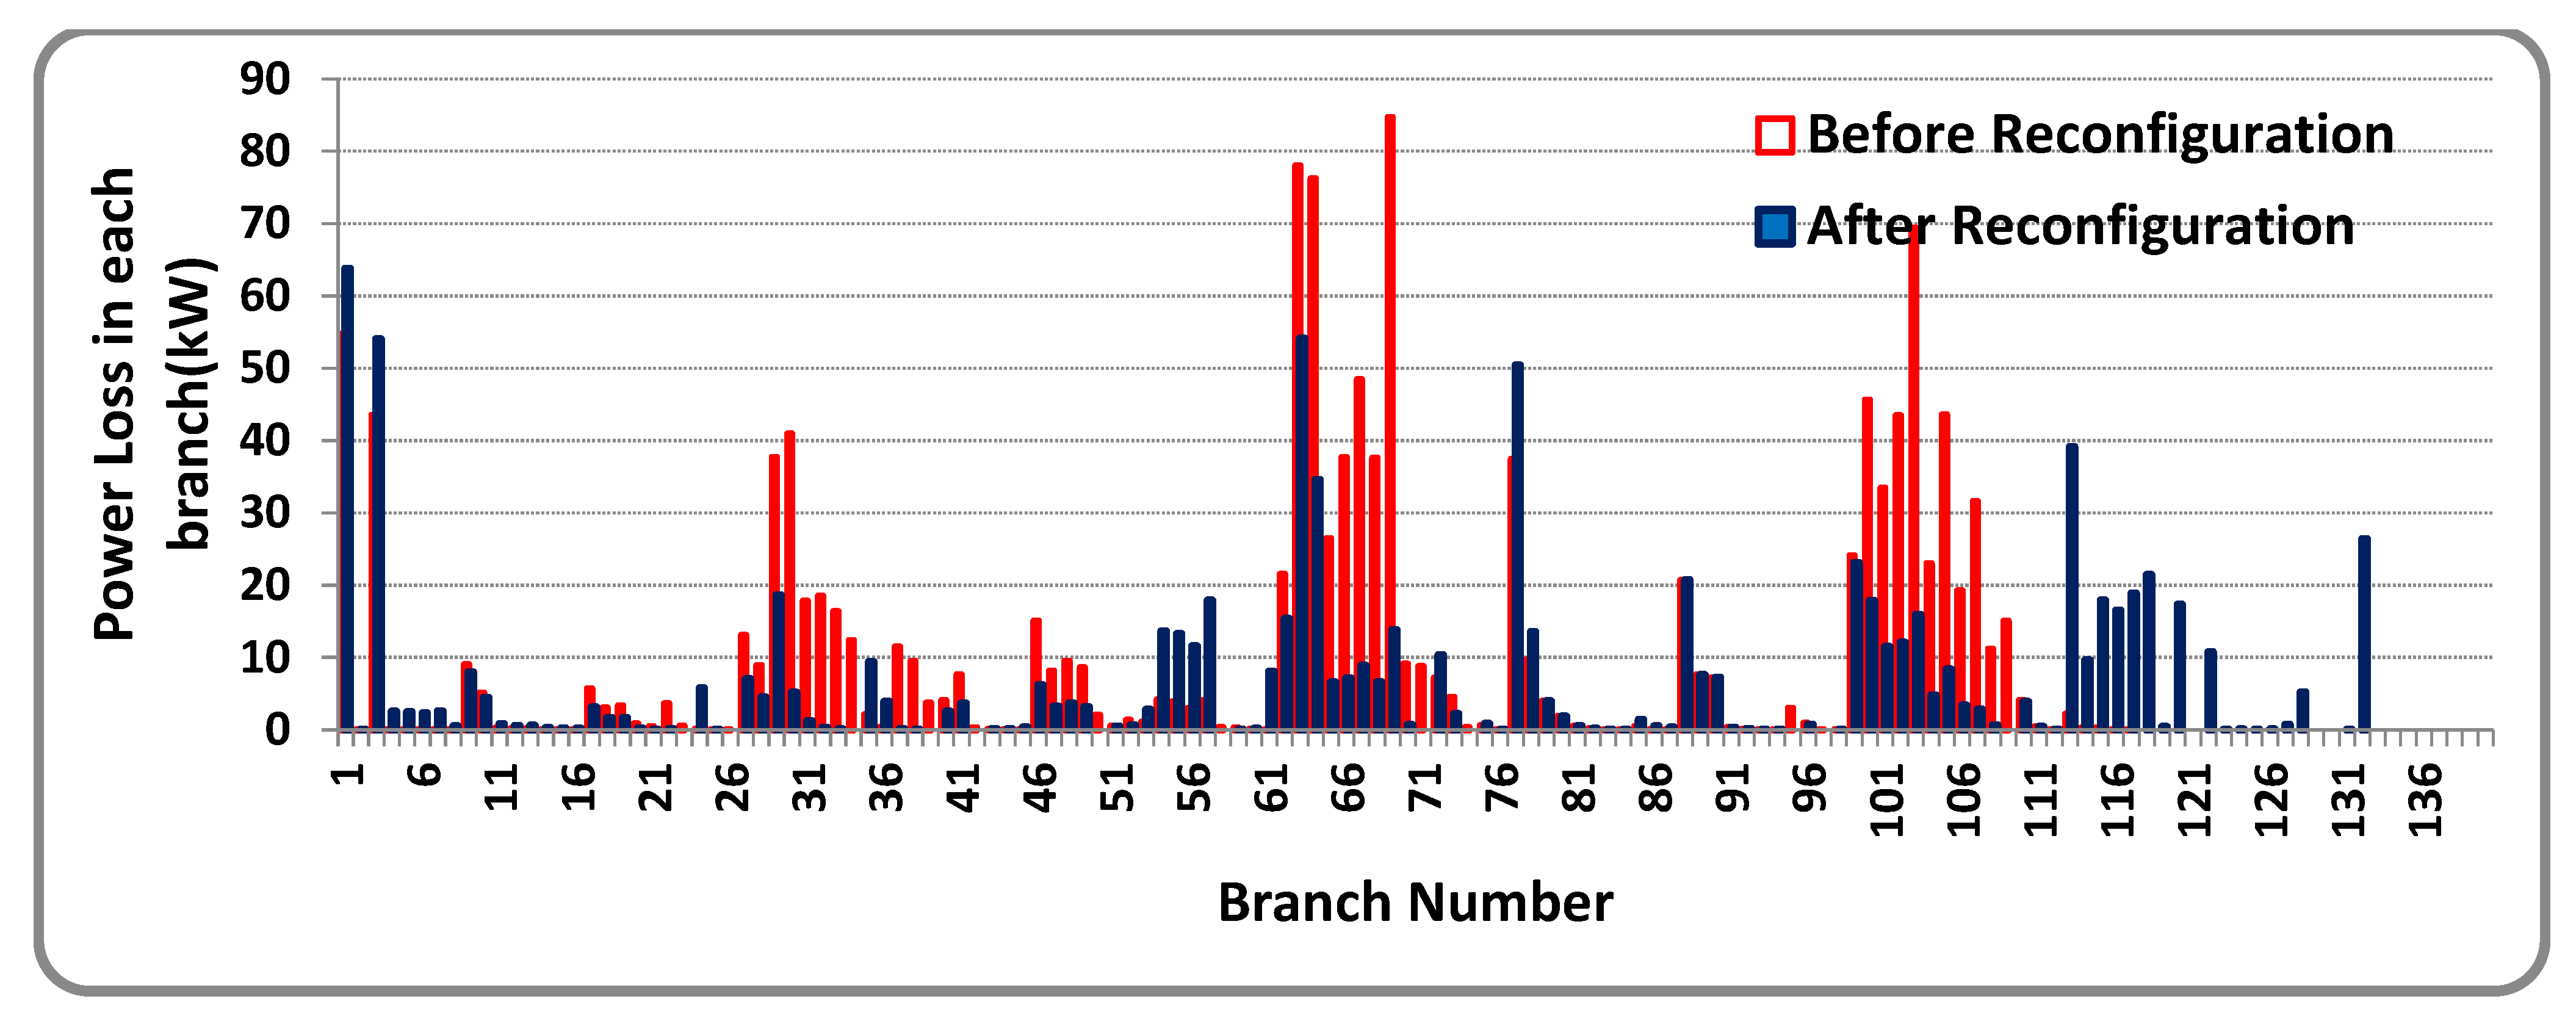
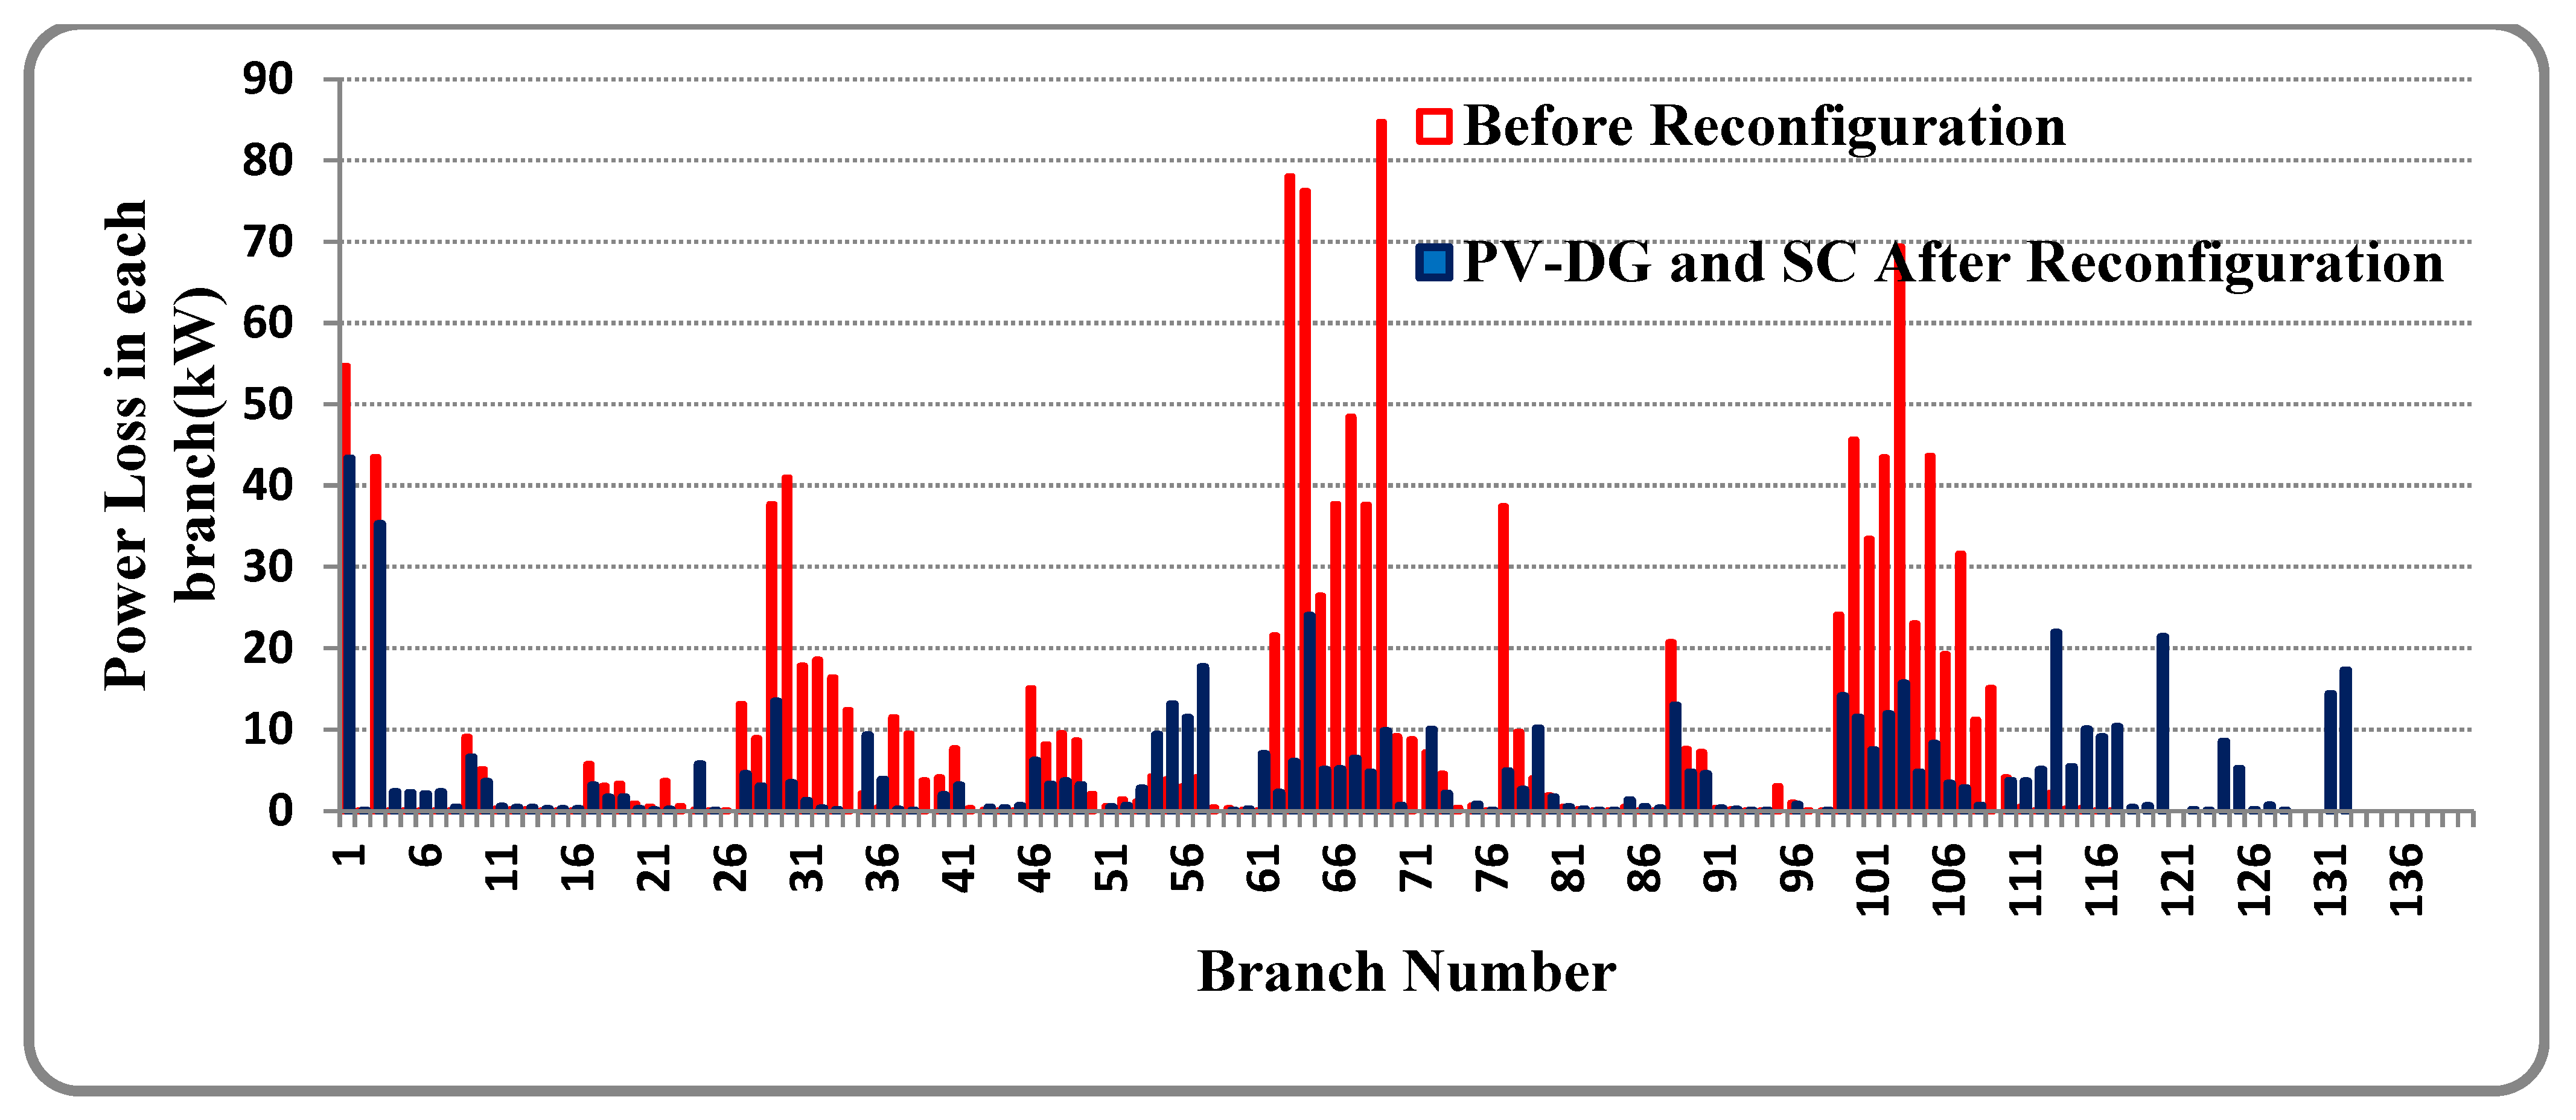
The power loss in each branch of the network before and after reconfiguration (Scenario-I and Scenario-II at 100% loading condition) of the network is depicted in Figure 11. Red bars and blue bars in Figure 11 indicate the variation in power flows in the feeder lines before and after the reconfiguration of the network. It indicates that as the consequent effect of reconfiguring the network, the power loss in the majority of the branches is reduced due to rerouting the power flows and variations in the feeder branch current.
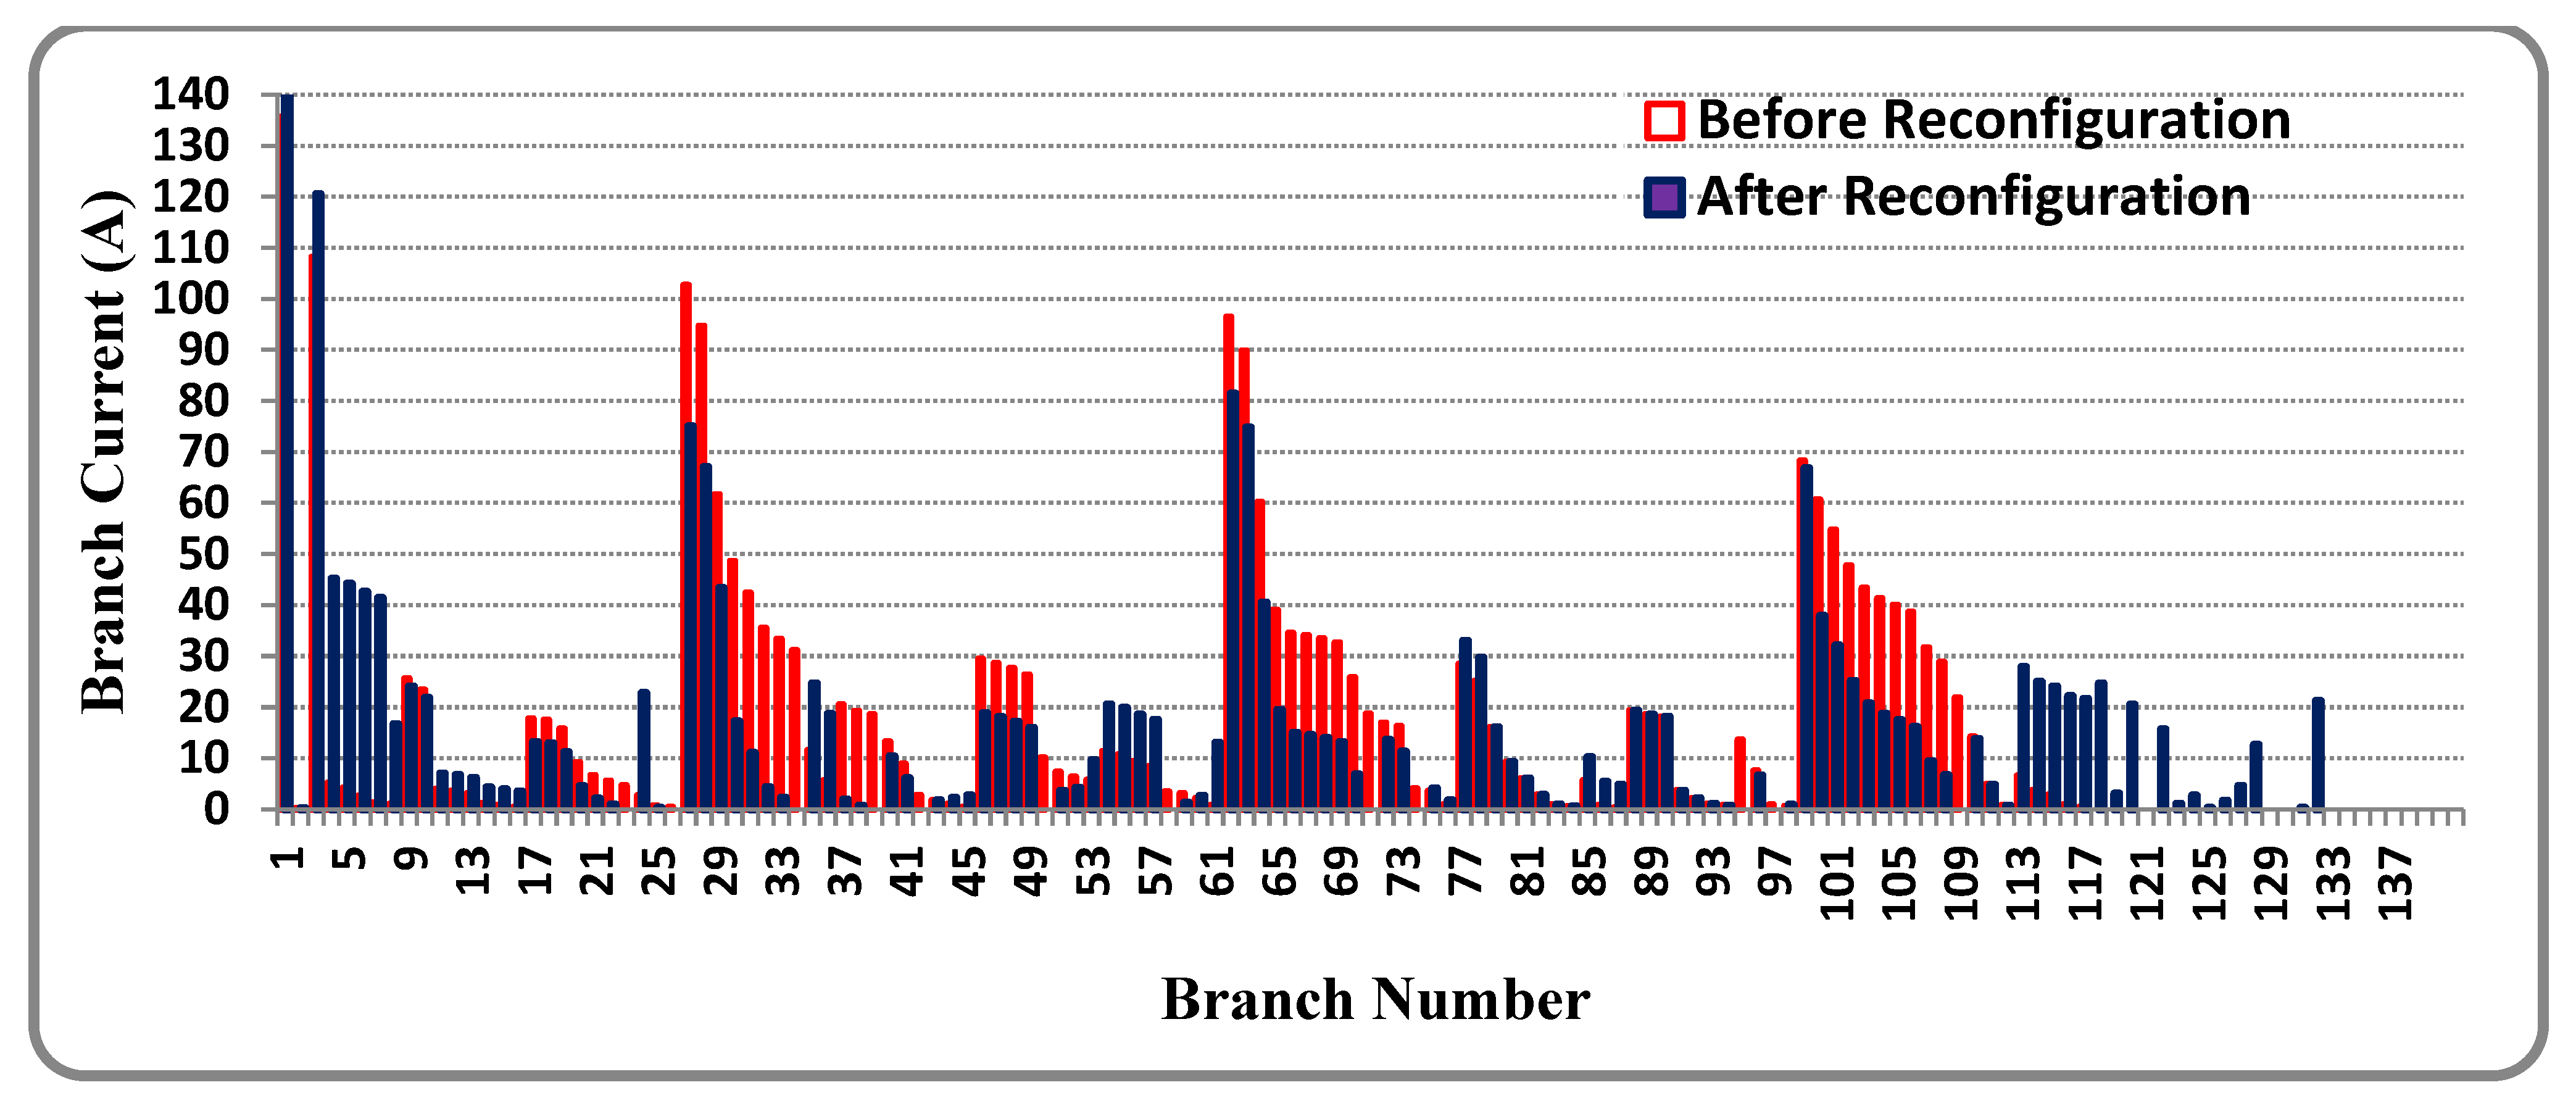
The current through the feeder branches before and after the optimal changes in the topological structure of the RPDN (Scenario-I and Scenario-II at 100% loading condition) are shown in Figure 12. From Figure 12, it can be concluded that there is a significant reduction in current flows in most of the feeder branches after reconfiguring the network (blue bars in Figure 12). With the identified optimal topology of the network, most of the feeder lines carry less current (blue bars in Figure 12) and are relieved from overloading due to the topological structural changes in the network.
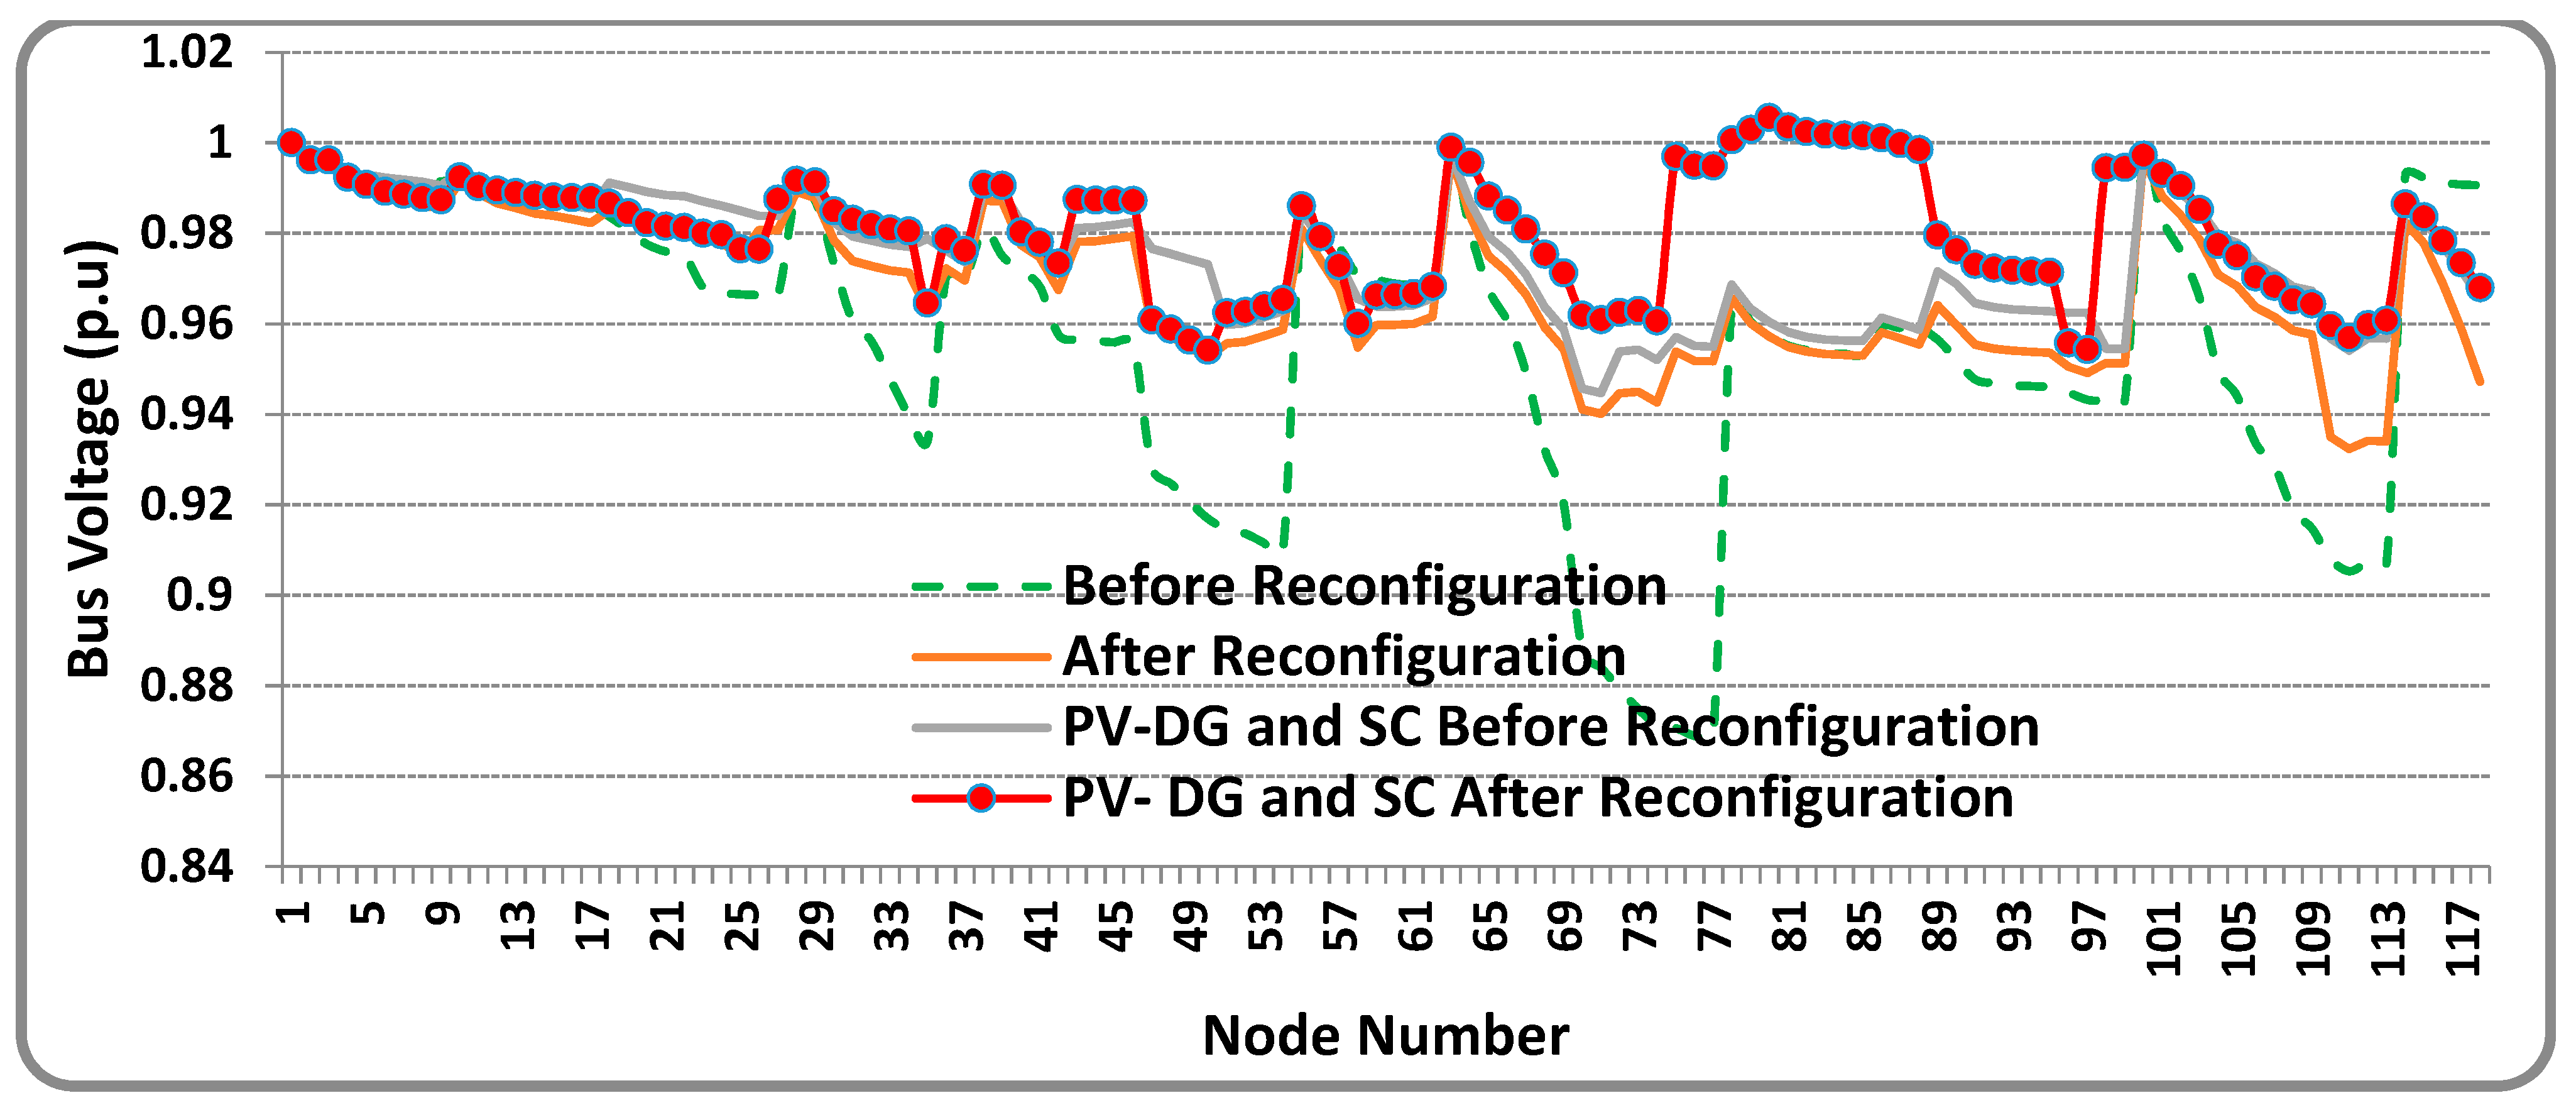
The voltage profile with scenario-I and scenario-II at 100% loading conditions shown in Figure 13 indicates that the reconfigured topology (Scenario-II) provides an enhanced voltage profile as compared with the base case topological structure of the network (Scenario-I). One can observe from the depicted node voltage profile that the minimum voltage of all the nodes lies above 0.9323 p.u.
Figure 10. ORNT—118 node RPDN (Scenario-II).
Sustainability 14 11480 g010
Figure 11. Real power loss—118 node RPDN (Scenarios I and II at 100% load).
Sustainability 14 11480 g011
Figure 12. Feeder loading—118 node RPDN (Scenario-I and Scenario-II at 100% load).
Sustainability 14 11480 g012
Figure 13. Node voltage profile—118 node RPDN (Scenarios I and II at 100% load).
Sustainability 14 11480 g013
The simulation results before and after reconfiguration of the network (Scenarios I and II) with different loading conditions using the hybrid HSA–PABC technique are presented in Table 4. The power loss of the network with the base topology of the network at 50%, 100%, and 160% load levels is 297.15 kW, 1298.09 kW, and 3799.70 kW, respectively. After reconfiguration, the power loss of the network is reduced to 203.48 kW, 853.44 kW, and 2326.72 kW, respectively. The significant enhancement in all the node voltages is observed at three different loading conditions after reconfiguring the network.
To show the suitability of the proposed hybrid HSA–PABC for tracing the optimal topology of the RPDN at 100% loading conditions, comparative analyses were made with the results of the PSO [12], RGA [15], ITS [15], HSA [15], FWA [15], CSA [12] and CGA [12] techniques presented in the literature, which are summarized in Table 5. The proposed hybrid HSA—PABC identifies the optimum topology of the network with a minimum power loss of 853.44 kW, which is comparatively less than the other methods presented in Table 5.
Table 4. 118 node RPDN for Scenarios I and II with different load levels.
ScenarioItem50% Load 100% Load 160% Load
Base case radial topology
(Scenario-I)
Switches opened
(Tie switches)
118-119-120-121-122-123-124-125-126-127-128-129-130-131-132 118-119-120-121-122-123-124-125-126-127-128-129-130-131-132118-119-120-121-122-123-124-125-126-127-128-129-130-131-132
Ploss (kW)297.151298.093799.70
Vmin (Node)0.9385 (77)0.8688 (77)0.7673 (77)
Optimal radial topology (Scenario-II)Switches opened23-26-34-39-42-50-58-71-74
-95-97-109-121-129-130
23-26-34-39-42-50-58-71-74
-95-97-109-121-129-130
23-26-34-39-42-50-58-71-
74-95-97-109-121-129-130
Ploss (kW)203.48853.442326.72
Vmin (Node)0.9673 (111)0.9323 (111)0.8864 (111)
%Loss reduction31.5234.2538.76
Table 5. Performance comparison of 118 node RPDN results with other methods at 100% load (Scenario-II).
MethodOpen SwitchesTotal
Power Loss (kW)
% Loss ReductionVmin (p.u)
Base Topology119,120,121,122,123,124,125,126,127,128,129,130,131,132, 1331298.09-0.8688
PSO [12]9, 23, 35, 43, 52, 60, 71, 74, 82, 96, 99, 110, 120, 122, 131897.192-0.9294
GA [15]43,120,24,51,49,62,40,126,74,73,77,83,31,110,35885.5631.780.9321
RGA [15]43,27,23,52, 49,62,40,126,74,73,77,83,131,110,33883.1331.970.9321
ITS [15]43,27,24,52, 120,59,40,96,75,72,98,130,131,110,35865.8633.300.9323
HAS [15]43,27,23,53,123,62,125,126,75,72,129,130,131,132,33854.2134.190.9323
FWA [15]43,26,24,122, 51,59,40,96,72,75,98,130,131,110,35854.0634.210.9323
CSA [12]24, 26, 35, 40, 43, 51, 59, 72, 75, 96, 98, 110, 122, 130, 131855.0402-0.9298
CGA [12]24, 26, 35, 40, 43, 51, 59, 72, 75, 96, 98, 110, 122, 130, 131855.0402-0.9298
Proposed HSA–PABC23-26-34-39-42-50-58-71-74 -95-97-109-121-129-130853.4434.250.9323

4.1.3. Tuning parameters of Hybrid HSA—PABC

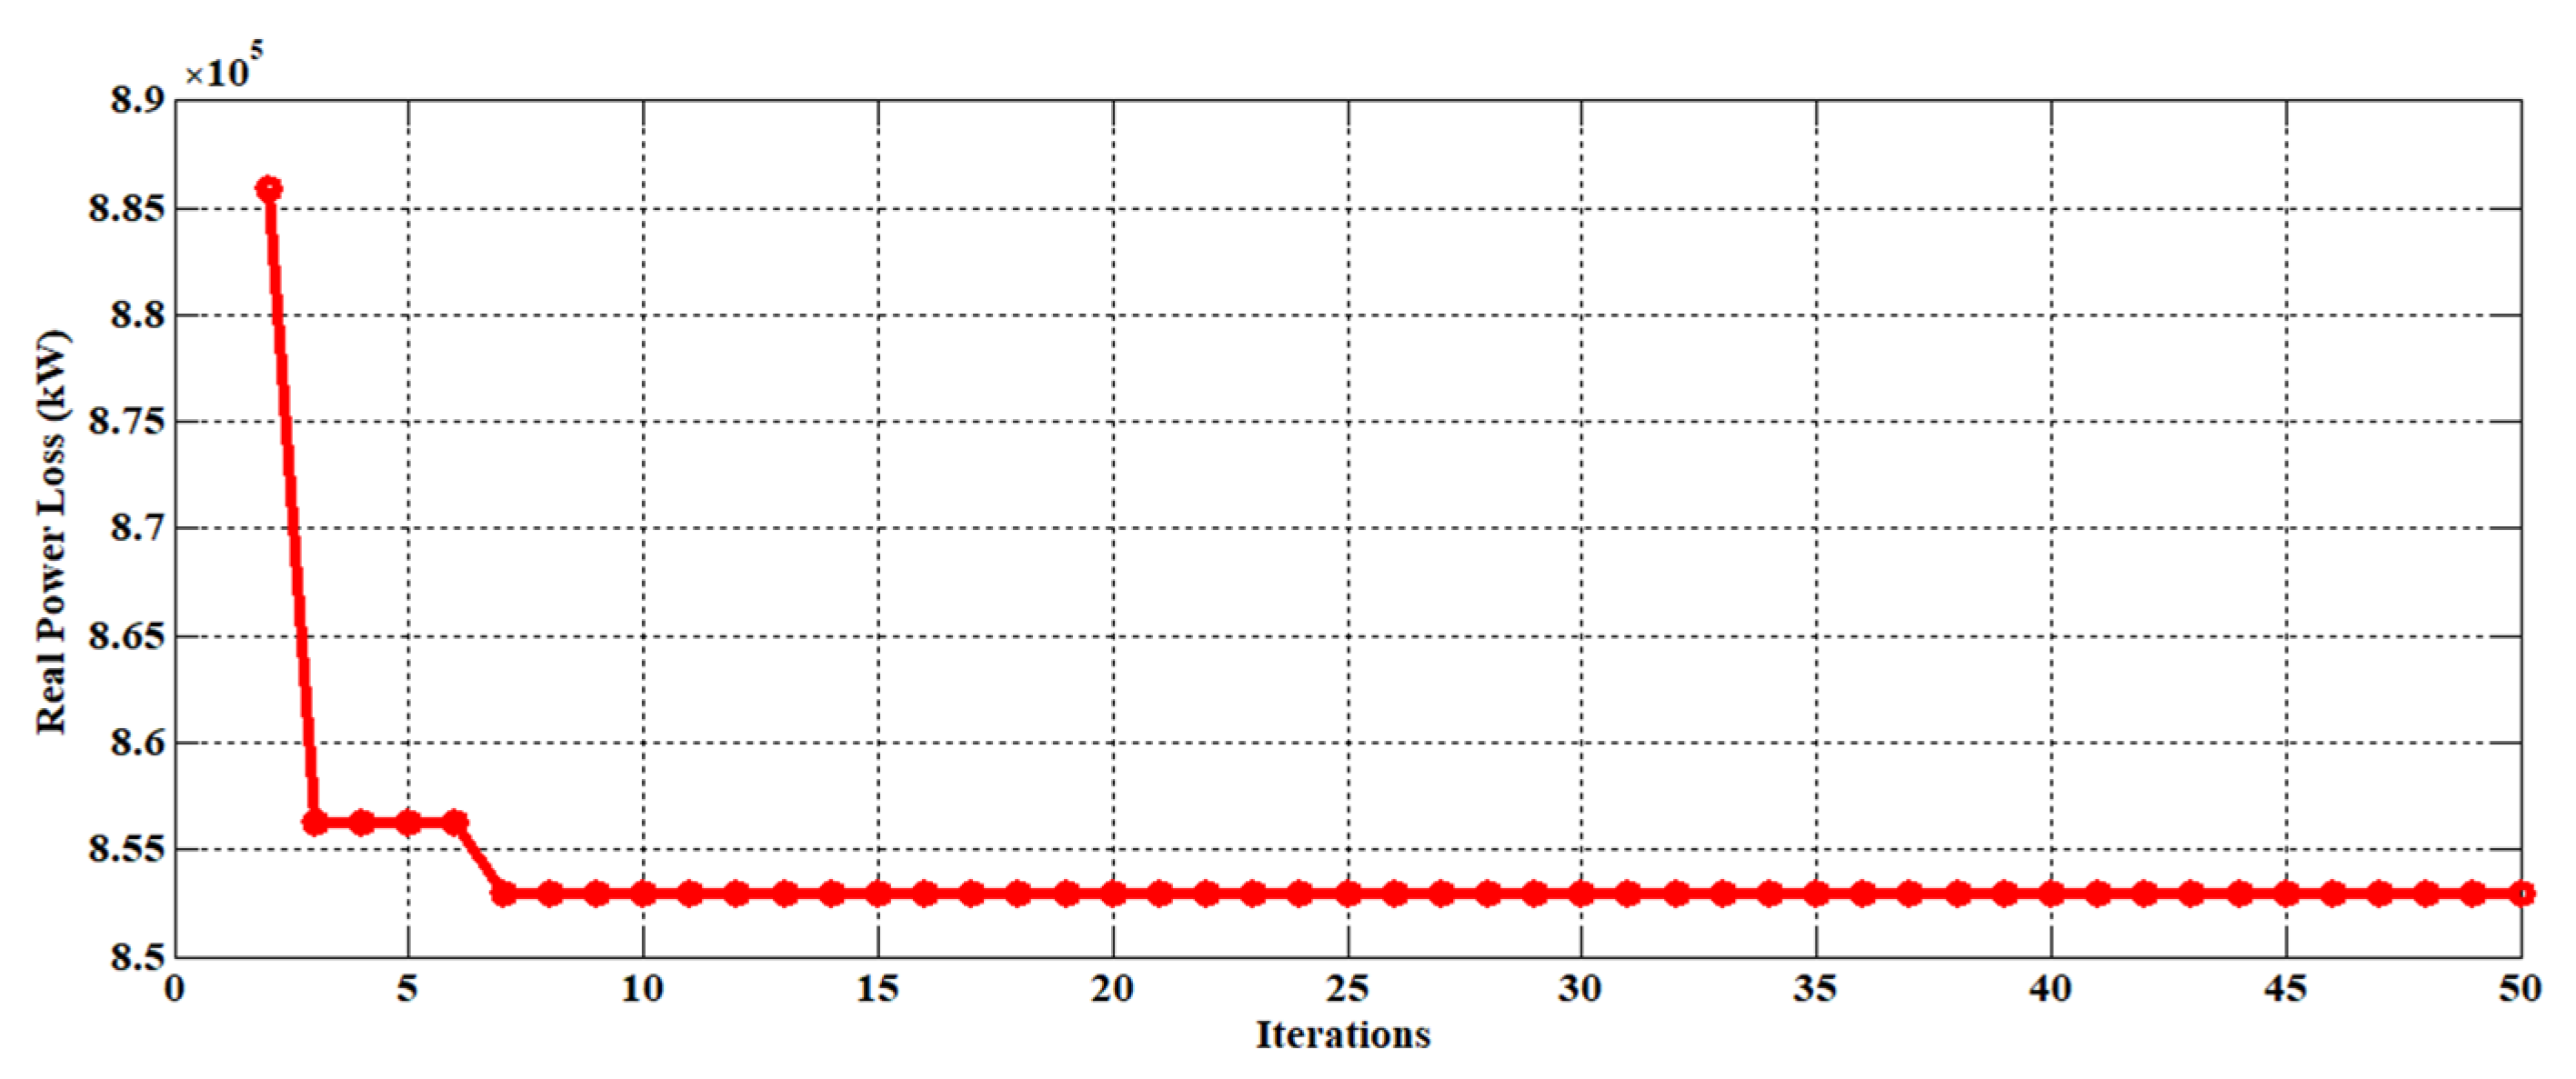
An empirical study was needed to select the tuning parameters of the proposed hybrid HSA–PABC algorithm, since the choice of algorithm parameters are problem dependent. The low value of HMCR makes the search random and has slow convergence. If the HMCR is higher value, then the exploration is poor, and the algorithm traps in local optima. The typical HMCR values are chosen from 0.3 to 0.95. The PAR parameter is used to generate the best solution around the existing solution. The typical PAR values may be selected from 0.4 to 0.9. The exploration ability is restricted if the PAR value is low. A higher PAR value makes the search random. In this work, the values of social weight constants C1, C2 are taken as 2.05 and the inertia weight is selected between 0.4 and 0.9 [42]. Based on the above-mentioned points, the tuning parameters of the HSA–PABC algorithm were decided for the 69 and 118 node RPDNs and summarized in Table 6. An intelligent search to explore the problem search space was suggested through the hybridization of HSA with the PABC algorithm, making the HSA-PABC competent in obtaining better solutions. Figure 14 and Figure 15 show the convergence characteristics of the HSA—PABC for the 69 and 118 node RDPNs at nominal loading level. The ability to reach the better result with smaller iterations by the proposed HSA–PABC algorithm reveals its dominance in solving the proposed optimal planning problem. The sturdiness and convergence ability of the proposed hybrid HSA–PABC algorithm was tested by 30 independent runs and the best results are reported. The statistical results of the hybrid HSA–PABC algorithm are depicted in Table 7 for both 69 and 118 node RPDNs (for Scenario-II). The smaller value of standard deviation reflects the capability of the hybrid HSA—PABC algorithm to arrive at the optimal solution.
Table 6. Selected parameter values of the hybrid HSA—PABC.
S. No.Parameters69 Node RPDN118 Node RPDN
1HMS3040
2PAR0.50.5
3HMCR0.90.9
4Minimum inertia weight (ωmin)0.40.4
5Acceleration coefficient (C1, C2)2.052.05
6Maximum inertia weight (ωmax)0.90.9
7SBL 1020
8MCNSpecified5050
Table 7. Statistical analysis for Scenario-II.
Test System69 Node RPDN118 Node RPDN
Max.Ploss (kW)105.2854.91
Min.Ploss (kW)98.63853.44
Standard deviation2.02650.55572
Avg. run time (s)5.379.76
Figure 14. Convergence plot of Ploss using HAS—PABC—69 node RPDN.
Sustainability 14 11480 g014
Figure 15. Convergence plot of Ploss using HAS—PABC—118 node RPDN.
Sustainability 14 11480 g015

4.2. Performance of the RPDN in the Presence of Solar PV-DG Units and SCs before and after Network Reconfiguration (Scenarios III–VIII)

The study spreads to assess the performance of RPDNs with the deployment and sizing of optimal SCs, PV-DG units, and the combination of DG units and SCs in the base case radial topology as well as in the optimal reconfiguration topology of the network (scenario III–VIII), simulations were performed on 69 and 118 node RPDNs with the above-mentioned eight test scenarios at three different load levels. The obtained results and their inferences are summarized below.
In this work, the HSA–PABC algorithm is used to trace optimal network topology, optimal location, and rating of DG units and SCs to realise considerable curtailment in real power loss with a better node voltage profile. The ON/OFF status of the switches in the network, kW output of the DG unit, and kVAR output of the SC are considered as the decision variable to be optimized.
In all the results presented, the suitable size of the shunt capacitor installed per node is written in the following pattern: [integer number for representing the number of SC banks to be installed at that node X rating of each SC bank]. In this work, the rating of each SC bank is taken as 50 kVAR. The switching state for each SC is a sequence number that indicates the number of SCs that are switched ON at each load level and mentioned in the following format: [50% load/100% load/160% load].
For example, in Table 8, let us say that a certain node (node number 16) has an SC bank with a value of 15 × 50 kVAR and a switching state is represented as [4/9/15]@16. This means that during 50% load level, 4 SC banks with 50 kVAR each are kept switched ON, there are 9 SC banks with 50 kVAR banks to be switched ON during 100% load level, and 15 SC banks are switched ON during 160% load level.

4.2.1. Performance investigation of 69 node RPDN with the Scenarios III, IV, and V (before Reconfiguration)

Table 8 presents the simulation results on SC placement before reconfiguring the network (Scenario-III). In this scenario, the RPDN is assumed to be operated with the base case radial topology of the network by keeping 69-70-71-72-73 switches in open condition. The candidate nodes for the placement of SCs identified by the proposed method are: 16, 22, and 62. The corresponding optimal size of the SC banks placed at light (50%), nominal (100%), and peak load (160%) levels are summarized in Table 8. In Table 8, the switching state information is mentioned in a square bracket next to the SC rating for each potential node. The power loss and percentage loss reduction after SC placement at 50%, 100%, and 160% load levels are: 38.02 kW, 26.30%; 162.79 kW, 27.64%; and 471.21 kW, 27.77%. After SC placement, the minimum voltage magnitude is improved to 0.9706 p.u; 0.9390 p.u; 0.9005 p.u at three load levels of the network and found within the permissible voltage limits.
The performance of 69 node RPDN at three different load levels by placing PV-DG units at node numbers 57, 63, and 22 are summarized in Table 9 (Scenario-IV). The power loss is reduced by 63.19%, 66.23%, and 69.57% once the PV-DG units are installed at candidate nodes. The minimum voltage magnitude enhancement after DG unit placement is 0.9874 p.u., 0.9741 p.u., and 0.9557 p.u., respectively.
Table 10 depicts the simulation results summary after the combined installation of PV-DGs and SCs in the base case topology of the network (Scenario-V). The proposed algorithm finds one number of PV-DG unit placed at node 63 with 652 kW, 1921 kW, and 2422 kW as optimal PV-DG rating at three different load levels. Along with the DG unit, two numbers of SCs are placed at 17 and 65. After the combined installation of the DG unit and SCs, approximately 75% loss reduction is achieved at three different load levels. The minimum voltage of the network after the combined installation of the PV-DG unit and SCs is 0.9904 p.u., 0.9821 p.u., and 0.9757 p.u., respectively. From the results reported in Table 8, Table 9 and Table 10, it can be noted that better reduction in power loss with an enhanced voltage profile is achieved with the combined deployment of PV-DGs and SCs in the network than the Scenario-III and Scenario-IV.
Table 9. Performance of 69 node RPDN for Scenario-IV with different load levels.
PV-DG Placement before Reconfiguration (Scenario-IV)
Item50% Load100% Load160% Load
Open switches69-70-71-72-73
DG rating in KW (Node)100 (57),100 (57),595 (57),
750 (63),1536 (63),2141 (63),
119 (22),403 (22)762 (22)
Total kW injection at each load level96920393498
Ploss (kW)18.9975.97198.55
% Loss reduction63.1966.2369.57
Vmin@(bus)0.9874 (65)0.9741 (65)0.9557 (65)
Table 10. Performance of 69 node RPDN for Scenario-V with different load levels.
PV-DG and Capacitor Placement before Reconfiguration (Scenario-V)
Item50% Load100% Load160% Load
Open switches69-70-71-72-73
DG rating in KW (Node)652 (63)1921 (63)2422 (63)
Multiple × Rating of SC [Switching state: 50%/100%/160%]@Node35 × 50 [8/12/35]@17
38 × 50 [12/30/38]@65
Total SC rating at each node (kVAR (Node))400 (17),600 (17),1750 (17),
600 (65)1500 (65)1900 (65)
Total kVAR injection at each load level100021003650
Total kW injection at each load level65219212422
Ploss (kW)12.7949.95157.34
% Loss reduction75.2177.7975.62
Vmin@(bus)0.9904 (27)0.9821 (27)0.9757 (27)

4.2.2. Performance Investigation of 69 Node RPDN with Scenarios VI, VII, and VIII (after Reconfiguration)

Table 11 shows the simulation results on SC placement in the optimally reconfigured network (Scenario-VI). The open switches of the optimal topology of the network identified by the proposed algorithm are 14-56-61-69-70. The optimally allocated SC size, locations, switching state of SC at different load levels, corresponding power loss, and minimum voltage magnitude of the network are depicted in Table 11. Installation of optimally sized SCs at node number 17, 61, and 63 yields around 68% reduction in power loss at all three loading conditions. After SC compensation, the minimum voltage magnitude of the network is 0.9874 p.u.; 0.9702 p.u.; 0.9543 p.u. at three different load levels of the network.
The simulation results of the 69 node RPDN at three different loading conditions after placing three numbers of PV-DG units in the optimally reconfigured RPDN are summarized in Table 12 (Scenario-VII). A reduction in power loss of 79.53%, 81.02%, and 82.25% is achieved at three different network loading scenarios after installing PV-DG units at candidate nodes. The minimum voltage magnitude improvement after installing three PV-DG units is 0.9876 p.u., 0.9741 p.u., and 0.9565 p.u., respectively.
Table 13 depicts the simulation results with the combined deployment of DGs and SCs in the reconfigured topology of the network (Scenario-VIII). After the installation of one PV-DG at 60th node and two numbers of SCs placed at the 61st and 19th node, around 83% power loss reduction is achieved at three different load levels. The minimum voltage of the RPDN after combined installation is 0.9916 p.u., 0.9836 p.u., and 0.9764 p.u., respectively.
Significant minimization in real power loss associated with feeder branches of the reconfigured topology of the RPDN (scenario-VIII) as compared with the base case radial topology of the RPDN (Scenario-I) is depicted in Figure 16. It can be noticed in Figure 16 and Figure 17 that the power loss and current flows in most of the feeder branches are reduced significantly after placing DG units along with SCs (Scenario-VIII) and injecting real and reactive power at suitable nodes of the reconfigured RPDN.
Similarly, from Figure 18, it can be concluded that PV-DG unit and shunt capacitor compensation in the optimally reconfigured radial topology of the network (Scenario-VIII) provides a more improved voltage profile than other scenarios (Scenarios I, II, and V). The optimal radial topology of the 69 node RPDN with solar PV-DG unit and SC (Scenario-VIII) is depicted in Figure 19.
From the results reported in Table 8, Table 9, Table 10, Table 11, Table 12 and Table 13, it can be concluded that the combined deployment of solar PV-DG units and SCs in an optimally reconfigured topology of the network (Scenario-VIII) provides better operating conditions for the network in terms of less power loss with an improved voltage profile instead of placing the DG units and SCs and their combined placement in the base case radial topology of the network.
Table 11. Performance of 69 node RPDN for Scenario-VI with different load levels.
Capacitor Placement after Reconfiguration (Scenario-VI)
Item50% Load100% Load160% Load
Open switches14-56-61-69-70
Multiple × Rating of SC [Switching state: 50%/100%/160%]@Node23 × 50 [3/12/23]@17
44 × 50 [10/25/44]@61
10 × 50[2/6/10]@63
Total SC rating at each node (kVAR (Node))150 (17)600 (17)1150 (17)
500 (61)1250 (61)2200 (61)
100 (63)300 (63)500 (63)
Total kVAR injection at each load level75021503850
Ploss (kW)16.2871.32198.14
% Loss reduction68.4468.3069.63
Vmin (Node)0.9834 (61)0.9702 (61)0.9543 (61)
Table 12. Performance of 69 node RPDN for Scenario-VII with different load levels.
PV-DG Placement after Reconfiguration (Scenario-VII)
Item50% Load100% Load160% Load
Open switches14-56-61-69-70
DG rating in KW (Node)570 (61),1097 (61),1701 (61),
100 (62),252 (62),386 (62)
50 (17)100 (17)101 (17)
Total kW injection at each load level72014492188
Ploss (kW)10.5642.70115.78
% Loss reduction79.5381.0282.25
Vmin (Node)0.9876 (61)0.9741 (61)0.9565 (61)
Table 13. Performance of 69 node RPDN for Scenario-VIII with different load levels.
PV-DG and Capacitor Placement after Reconfiguration (Scenario-VIII)
Item50% Load100% Load160% Load
Open switches14-56-61-69-70
DG rating in KW (Node)676 (60)1422 (60)2101 (60)
Multiple × Rating of SC [Switching state: 50%/100%/160%]@Node33 × 50 [10/18/33]@61
41 × 50 [11/23/41]@19
Total SC rating at each node (kVAR (Node)) 500 (61)900 (61)1650 (61)
550 (19)1150 (19)2050 (19)
Total kVAR injection at each load level105020503700
Total kW injection at each load level67614222101
Ploss (kW)9.0838.13109.00
% Loss reduction82.4083.0583.29
Vmin (Node)0.9916 (62)0.9836 (62)0.9764 (62)
Figure 16. Real power loss in feeder branch of 69 node RPDN with Scenario-I and Scenario-VIII at 100% load.
Sustainability 14 11480 g016
Figure 17. Feeder loading of the 69 node RPDN with Scenario-I and Scenario-VIII at 100% load.
Sustainability 14 11480 g017
Figure 18. Voltage profile of 69 node RPDN with the scenarios I, II, V, and VIII at 100% load.
Sustainability 14 11480 g018
Figure 19. 69 node reconfigured topology with solar PV-DG unit and SC compensation (Scenario-VIII).
Sustainability 14 11480 g019

4.2.3. Performance Investigation of 118 Node RPDN with Scenarios III, IV, and V (before Reconfiguration)

To show the suitability of the HSA–PABC algorithm in large-scale RPDN and to validate the effectiveness of the proposed loss reduction methods, they were further implemented on a 118 node RPDN at three different loading conditions and simulation results are presented below.
Table 14 shows the real power loss, percentage reduction in power loss, and optimal location and sizing of SCs placed in the candidate nodes of the network before reconfiguration (Scenario-III). It can be pointed out from the reported results, after placing SC banks, the power loss and percentage loss reduction of the network obtained with 50%, 100%, and 160% load levels are 215.65 kW, 27.43%; 990.62 kW, 23.68%; and 2880.24 kW, 24.19%, respectively.
For the installation of three PV-DG units at the 109th, 35th, and 72nd node in the base case topology of the network (Scenario-IV), the percentage loss reduction achieved at three different loading conditions is summarized in Table 15. After DG placement at the candidate nodes, 42.89%, 47.33%, and 50.98% loss reduction was achieved.
Table 16 summarizes the obtained results of the combined deployment of the DG and SCs at the potential nodes (Scenario-V). Placing a single PV-DG at node 70 and shunt capacitors at nodes numbered 33, 35, 74, 10, 52, 50, 96, 91, 67, and 110 in the base topology offers a loss reduction of 46.41%, 47.66%, and 51.41% respectively.
Table 14. 118 node RPDN for Scenario-III with different load levels.
Capacitor Placement before Reconfiguration (Scenario-III)
Item50% Load100% Load160% Load
Open switches 118-119-120-121-122-123-124-125-126-127-128-129-130-131-132
Multiple × Rating of SC [Switching state: 50%/100%/160%]@Node23 × 50 [6/8/23]@98
64 × 50 [20/19/64]@51
71 × 50 [16/33/71]@72
70 × 50 [17/36/70]@67
60 × 50 [19/32/60]@33
69 × 50 [20/44/69]@110
17 × 50 [8/17/14]@49
96 × 50 [5/46/96]@47
17 × 50 [6/9/17]@104
12 × 50 [4/12/11]@92
Total SC rating at each node (kVAR (Node))300 (98),400 (98),1150 (98),
1000 (51),1950 (51),3200 (51),
800 (72),1650 (72),3550 (72),
850 (67),1800 (67),3500 (67),
950 (33),1600 (33),3000 (33),
1000 (110),2200 (110),3450 (110),
400 (49),850 (49),700 (49),
250 (47),2300 (47),4800 (47),
300 (104),450 (104),850 (104),
200 (92)600 (92)550 (92)
Total kVAR at each load level60501380024750
Ploss (kW)215.65990.622880.24
% Loss reduction27.4323.6824.19
Vmin (Node)0.9580 (77)0.9129 (77)0.8697 (77)
Table 15. 118 node RPDN for Scenario-IV with different load levels.
PV-DG Placement before Reconfiguration (Scenario-IV)
Item50% Load100% Load160% Load
Open switches118-119-120-121-122-123-124-125-126-127-128-129-130-131-132
DG rating in KW (Node)1076(109),2862(109),4311 (109),
2015 (35),3951 (35),6747 (35),
1661 (72)2562 (72)4049 (72)
Total kW injection at each load level4752937515107
Ploss (kW)169.68683.711862.49
% Loss reduction42.8947.3350.98
Vmin (Node)0.9750 (54)0.9477 (54)0.9152 (77)
Table 16. 118 node RPDN for Scenario-V with different load levels.
PV-DG and Capacitor Placement before Reconfiguration (Scenario-V)
Item50% Load100% Load160% Load
Open switches118-119-120-121-122-123-124-125-126-127-128-129-130-131-132
DG rating in KW (Node)1475 (70)3132 (70)4859 (70)
Multiple × Rating of SC [Switching state: 50%/100%/160%]@Node40 × 50 [5/20/40]@33
6 × 50 [2/2/6]@35
40 × 50 [11/21/40]@74
60 × 50 [30/60/60]@104
10 × 50 [7/10/7]@52
54 × 50 [10/30/54]@50
20 × 50 [2/2/20]@96
11 × 50 [10/10/11]@91
30 × 50 [7/30/10]@67
102 × 50 [19/47/102]@110
Total SC rating at each load level (kVAR (Node))250 (33),1000 (33),2000 (33),
100 (35),100 (35),300 (35),
550 (74),1050 (74),2000 (74),
1500 (104),3000 (104),3000 (104),
350 (52),500 (52),350 (52),
500 (50),1500 (50),2700 (50),
100 (96),100 (96),1000 (96),
500 (91),500 (91),550 (91),
350 (67),1500 (67),500 (67),
950 (110)2350 (110)5100 (110)
Total kVAR injection at each load level51501160017500
Total kW injection at each load level147531324859
Ploss (kW)159.25679.371846.45
% Loss reduction46.4147.6651.41
Vmin (Node)0.9728 (111)0.9480 (111)0.9154 (111)

4.2.4. Performance Investigation of 118 Node RPDN with Scenarios VI, VII, and VIII (after Reconfiguration)

In Scenario-VI, the percentage loss reduction achieved with SC placement is 43.31%, 45.09%, and 51.76% at a different load level of the network (refer to Table 17). After placing PV-DG units (Scenario-VII), the loss reduction of the reconfigured network is 48.23%, 48.35%, and 55.18%, respectively (refer to Table 18).
Similarly, for Scenario-VIII, for combined placement, the optimal sizes of the PV-DG unit and the SCs at various loading conditions are presented in Table 19. The switching pattern of the shunt capacitors according to the prevailing loading conditions, real power loss, and percentage loss reduction at the various loading conditions are also presented.
The variations in real power loss in feeder branches and branch current flow through the feeder lines of the test network at 100% loading condition with Scenario-I and Scenario-VIII is depicted in Figure 20 and Figure 21. It can be inferred that the change in topological structure of the network, real and reactive power support offered by the installed DG unit and SCs make the variations in the branch currents and associated power loss of the distribution network.
The node voltage profile with different scenarios at nominal loading condition is depicted in Figure 22. From the results depicted, one can witness that simultaneously injecting required real power by the PV-DG and reactive power by the SCs at the right places in the reconfigured radial topology of the RPDN (Scenario-VIII) provides an improved voltage profile of the network as compared with other operating scenarios (Scenarios I, II, and V). The optimal reconfiguration topology of the 118 node RPDN with the installation of the solar PV-DG unit and SC (Scenario-VIII) is depicted in Figure 23.
Similar to the 69 node RPDN result findings, for the 118 node RPDN also, the DG unit and shunt capacitor compensation in the reconfigured topology of the network (Scenario-VIII) provides a higher percentage in loss reduction with a better voltage profile as compared with the other scenarios considered.
From the summarized results of both 69 and 118 node RPDNs, it can be concluded that the proposed hybrid HSA–PABC algorithm produces better results in terms of loss reduction and voltage profile enhancement by placing the PV-DG unit along with SCs in the optimally reconfigured topology of the RPDN (Scenario-VIII).
Table 17. 118 node RPDN for Scenario-VI with different load levels.
Capacitor Placement after Reconfiguration (Scenario-VI)
Item50% Load100% Load160% Load
Open switches23-26-34-39-42-50-58-71-74-95-97-109-121-129-130
Multiple × Rating of SC [Switching state: 50%/100%/160%]@Node27 × 50 [5/11/27]@105
11 × 50 [11/5/8]@18
15 × 50 [13/11/15]@5
23 × 50 [5/7/23]@32
18 × 50 [5/11/18]@97
24 × 50 [6/5/24]@112
19 × 50 [5/9/19]@20
19 × 50 [3/13/19]@25
17 × 50 [3/17/17]@90
19 × 50 [5/9/19]@50
Total SC rating at each load level (kVAR (Node)) 250 (105),550 (105),1350 (105),
550 (18),250 (18),400 (18),
650 (5),550 (5),750 (5),
250 (32),350 (32),1150 (32),
250 (97),550 (97),900 (97),
300 (112),250 (112),1200 (112),
250 (20),450 (20),950 (20),
150 (25),650 (25),950 (25),
150 (90),850 (90),850 (90),
250 (50)450 (50)950 (50)
Total kVAR injection at each load level305049009450
Ploss (kW)168.44712.671832.64
% Loss reduction43.3145.0951.76
Vmin (Node)0.9713 (71)0.9364 (111)0.9032 (71)
Table 18. 118 node RPDN for Scenario-VII with different load levels.
PV-DG Placement after Reconfiguration (Scenario-VII)
Item50% Load100% Load160% Load
Open switches23-26-34-39-42-50-58-71-74-95-97-109-121-129-130
DG rating in KW (Node)786 (110),908 (110),2893 (110),
1293 (89)3899 (89)4342 (89)
873 (58)2082 (58)3117 (58)
Total kW injection at each load level2952688910352
Ploss (kW)153.84670.371702.98
% Loss reduction48.2348.3555.18
Vmin (Node)0.9753 (71)0.9538 (71)0.9169 (71)
Table 19. 118 node RPDN for Scenario-VIII with different load levels.
PV-DG and Capacitor Placement after Reconfiguration (Scenario-VIII)
Item50% Load100% Load160% Load
Open switches23-26-34-39-42-50-58-71-74-95-97-109-121-129-130
DG size in KW@(Node)736 (80)3567 (80)3533 (80)
Multiple × Rating of SC [Switching state: 50%/100%/160%]@Node31 × 50 [7/13/31]@91
28 × 50 [21/23/28]@29
16 × 50 [6/5/16]@70
45 × 50 [7/18/45]@55
53 × 50 [19/23/53]@102
51 × 50 [17/23/51]@79
10 × 50 [3/6/10]@43
15 × 50 [4/3/15]@42
39 × 50 [16/9/39]@31
29 × 50 [13/19/29]@113
Total SC rating at each load level (kVAR (Node)) 350 (91),1000 (91),1900 (91),
1050 (29),2200 (29),2450 (29),
300 (70),550 (70),1100 (70),
350 (55),1250 (55),2600 (55),
950 (102),2100 (102),3600 (102),
850 (79),2000 (79),3400 (79),
150 (43),450 (43),650 (43),
200 (42)350 (42),750 (42),
800 (31),1250 (31),2750 (31),
650 (113)1600 (113)2100 (113)
Total kVAR injection at each load level56501275021300
Total kW injection at each load level73635673533
Ploss (kW)140.79573.921515.85
% Loss reduction52.6255.8460.10
Vmin (Node)0.9769 (111)0.9541 (50)0.9218 (111)
Figure 20. Real power loss in feeder branches of 118 node RPDN with Scenario-I and Scenario-VIII at 100% load.
Sustainability 14 11480 g020
Figure 21. Feeder loading of 118 node RPDN with Scenario-I and Scenario VIII at 100% load.
Sustainability 14 11480 g021
Figure 22. Voltage profile of 118 node RPDN for Scenarios I, II, V, and VIII at 100% load.
Sustainability 14 11480 g022
Figure 23. 118 node reconfigured topology with solar PV-DG unit and SC’s compensation (Scenario-VIII).
Sustainability 14 11480 g023

5. Discussion

Technical Perspectives

The results presented in this article are based on the best solution offered by the proposed HSA–PABC algorithm for the optimal operation of an RPDN. The simulation results obtained with the eight test scenarios considered in this work are impressive. Since DG unit and shunt capacitor deployment is a long-term planning issue while reconfiguring the network topology is associated with the short-term operational issue. From a power engineering perspective, incorporating short-term issues into long-term planning problems would arrive at good solutions in comparison with the consideration of short-term and long-term planning issues individually.
Moreover, PV-DGs and SCs are efficient for controlling the parameters of the distribution network which is imperative from their deployment, maintenance, and operational perspective. From the simulated Scenarios I to VIII, it can be concluded that (1) any grouping of the above-mentioned scenarios and the solutions arrived would lead to considerable enhancement from loss reduction and voltage profile enhancement perspectives, and (2) As can be seen from the results reported with the eight different operating scenarios, higher loss reduction and voltage profile enhancement are achieved with the deployment of PV-DG units along with shunt capacitors in the reconfigured network (Scenario-VIII).
In Scenario-VIII, all of the decision variables in the loss minimization point of view are considered, i.e., location of DG units and SCs, optimal operation points of DGs and SCs, and open/close status of the switches for reconfiguring the network topology. Hence, optimal decisions are reached by the proposed hybrid HSA–PABC algorithm. A remarkable reduction in power losses, especially when combining the deployment of PV-DG units and SCs in the reconfigured network structure in the presence of varying load conditions, could reflect a productive impact on feeder congestion management, extend the useful life of system components, and help utilities to stagger their future development plans.
In this work, the PV-DG unit is modelled as negative load. The effect of deployment of PV-DG on the reverse power flow is taken care of by voltage constraint considered. Moreover, the method proposed in this work applies to renewable-based distributed generation with the power output as a decision variable. The PV-DG deployment problem can be further extended by considering the uncertainty related to renewable sources using stochastic models. Investigation of other possible applications of the proposed hybrid HSA–PABC would be presented in our future works.
The node voltage improvement achieved using the proposed approach may lead to increased power consumption by voltage-dependent loads connected to the distribution networks. So, power losses associated with the feeder lines will be slightly higher than that presented in this analysis where all loads considered in this work are constant power loads. Similarly, due to the unbalanced operating condition of the distribution network and harmonics associated with the presence of nonlinear loads, the obtained results may slightly deviate. These issues are beyond the scope of this work but should be considered in our future studies.

6. Conclusions

In this work, a hybrid HSA-PABC-based approach has been proposed to study the performance enhancement of RPDNs with the deployment of solar PV-DG units, SCs, and the combination of both before and after reconfiguration of the RPDN. An efficient spanning tree approach was utilized to track the optimal topology of the RPDN. Eight test scenarios were simulated on 69 and 118 node RPDNs at different load levels, and results were presented. From the simulation results, it can be concluded that the installation of solar PV-DG units and SCs in suitable places in an optimally reconfigured radial topology of the network offers less power loss with an enhanced voltage profile as compared with the installation of compensating devices in the base case radial topology. The findings have been enumerated to form a motivating basis for implementing the combined loss reduction approaches to achieve effective planning problems of power distribution networks.

Author Contributions

Conceptualization, M.K. and R.T.; methodology, M.K. and R.T.; software, R.T.; validation, M.K., R.T. and W.-W.K.; formal analysis, T.A.; investigation, M.K. and T.A.; re-sources, R.T.; data curation, M.K. and J.J.; writing—original draft preparation, M.K. and R.T.; writing—review and editing, M.K., R.T., W.-W.K. and Z.W.G.; visualization, J.J.; supervision, R.T. and Z.W.G.; project administration, M.K. and Z.W.G.; funding acquisition, Z.W.G. All authors have read and agreed to the published version of the manuscript..

Funding

This research was supported by the Energy Cloud R&D Program through the National Research Foundation of Korea (NRF) funded by the Ministry of Science, ICT (2019M3F2A1073164).

Institutional Review Board Statement

Not applicable.

Informed Consent Statement

Not applicable.

Data Availability Statement

Not applicable.

Conflicts of Interest

The authors declare no conflict of interest.

References

  1. Baran, M.E.; Wu, F.F. Network reconfiguration in distribution systems for loss reduction and load balancing. IEEE Trans. Power Deliv. 1989, 4, 1401–1407. [Google Scholar] [CrossRef]
  2. Gohokar, V.; Khedkar, M.; Dhole, G. Formulation of distribution reconfiguration problem using network topology: A generalized approach. Electr. Power Syst. Res. 2004, 69, 304–310. [Google Scholar] [CrossRef]
  3. Sahoo, N.; Prasad, K. A fuzzy genetic approach for network reconfiguration to enhance voltage stability in radial distribution systems. Energy Convers. Manag. 2006, 47, 3288–3306. [Google Scholar] [CrossRef]
  4. Raju, G.K.V.; Bijwe, P.R. An Efficient Algorithm for Minimum Loss Reconfiguration of Distribution System Based on Sensitivity and Heuristics. IEEE Trans. Power Syst. 2008, 23, 1280–1287. [Google Scholar] [CrossRef]
  5. Georgilakis, P.S.; Hatziargyriou, N.D. A review of power distribution planning in the modern power systems era: Models, methods and future research. Electr. Power Syst. Res. 2015, 121, 89–100. [Google Scholar] [CrossRef]
  6. Naveen, S.; Kumar, K.S.; Rajalakshmi, K. Distribution system reconfiguration for loss minimization using modified bacterial foraging optimization algorithm. Int. J. Electr. Power Energy Syst. 2015, 69, 90–97. [Google Scholar] [CrossRef]
  7. Chu, C.-C.; Tsai, M.-S. Application of Novel Charged System Search with Real Number String for Distribution System Loss Minimization. IEEE Trans. Power Syst. 2013, 28, 3600–3609. [Google Scholar] [CrossRef]
  8. Zhang, J.; Yuan, X.; Yuan, Y. A novel genetic algorithm based on all spanning trees of undirected graph for distribution network reconfiguration. J. Mod. Power Syst. Clean Energy 2014, 2, 143–149. [Google Scholar] [CrossRef]
  9. Arulprakasam, S.; Muthusamy, S. Reconfiguration of distribution networks using rain-fall optimization with non-dominated sorting. Appl. Soft Comput. 2022, 115, 108200. [Google Scholar] [CrossRef]
  10. Mirhoseini, S.H.; Hosseini, S.M.; Ghanbari, M.; Ahmadi, M. A new improved adaptive imperialist competitive algorithm to solve the reconfiguration problem of distribution systems for loss reduction and voltage profile improvement. Int. J. Electr. Power Energy Syst. 2014, 55, 128–143. [Google Scholar] [CrossRef]
  11. Rani, D.S.; Subrahmanyam, N.; Sydulu, M. Multi-Objective Invasive Weed Optimization—An application to optimal network reconfiguration in radial distribution systems. Int. J. Electr. Power Energy Syst. 2015, 73, 932–942. [Google Scholar] [CrossRef]
  12. Nguyen, T.T.; Truong, A.V. Distribution network reconfiguration for power loss minimization and voltage profile improvement using cuckoo search algorithm. Int. J. Electr. Power Energy Syst. 2015, 68, 233–242. [Google Scholar] [CrossRef]
  13. de Oliveira, L.W.; de Oliveira, E.J.; Gomes, F.V.; Silva, I.C.; Marcato, A.L.; Resende, P.V. Artificial Immune Systems applied to the reconfiguration of electrical power distribution networks for energy loss minimization. Int. J. Electr. Power Energy Syst. 2014, 56, 64–67. [Google Scholar] [CrossRef]
  14. Kumar, K.S.; Jayabarathi, T. Power system reconfiguration and loss minimization for an distribution systems using bacterial foraging optimization algorithm. Int. J. Electr. Power Energy Syst. 2012, 36, 13–17. [Google Scholar] [CrossRef]
  15. Imran, A.M.; Kowsalya, M. A new power system reconfiguration scheme for power loss minimization and voltage profile enhancement using Fireworks Algorithm. Int. J. Electr. Power Energy Syst. 2014, 63, 312–322. [Google Scholar] [CrossRef]
  16. Rao, R.S.; Narasimham, S.V.L.; Raju, M.R.; Rao, A.S. Optimal network reconfiguration of large-scale distribution system using harmony search algorithm. IEEE Trans. Power Syst. 2011, 26, 1080–1088. [Google Scholar] [CrossRef]
  17. Teimourzadeh, S.; Zare, K. Application of binary group search optimization to distribution network reconfiguration. Int. J. Electr. Power Energy Syst. 2014, 62, 461–468. [Google Scholar] [CrossRef]
  18. Nguyen, T.T.; Nguyen, T.T.; Truong, A.V.; Nguyen, Q.T.; Phung, T.A. Multi-objective electric distribution network reconfiguration solution using runner-root algorithm. Appl. Soft Comput. 2017, 52, 93–108. [Google Scholar] [CrossRef]
  19. Lavorato, M.; Franco, J.F.; Rider, M.J.; Romero, R. Imposing radiality constraints in distribution optimization problems. IEEE Trans. Power Syst. 2012, 27, 172–180. [Google Scholar] [CrossRef]
  20. Iborra, F.L.; Santos, J.R.; Ramos, E.R. Mixed-integer linear programming model for solving reconfiguration Problems in large-scale distribution systems. Electr. Power Syst. Res. 2012, 88, 137–145. [Google Scholar] [CrossRef]
  21. Mithulananthan, N.; Oo, T.; Van Phu, L. Distributed generator placement in power distribution system using genetic algorithm to reduce losses. Thammasat Int. J. Sci. Technol. 2004, 9, 55–62. [Google Scholar]
  22. Walling, R.A.; Saint, R.; Dugan, R.C.; Burke, J.; Kojovic, L.A. Summary of Distributed Resources Impact on Power Delivery Systems. IEEE Trans. Power Deliv. 2008, 23, 1636–1644. [Google Scholar] [CrossRef]
  23. Ng, H.; Salama, M.; Chikhani, A. Classification of Capacitor Allocation Techniques. IEEE Trans. Power Deliv. 2000, 15, 387–392. [Google Scholar] [CrossRef]
  24. Das, D. Optimal placement of capacitors in radial distribution system using a Fuzzy—GA method. Int. J. Electr. Power Energy Syst. 2008, 30, 361–367. [Google Scholar] [CrossRef]
  25. Rao, R.S.; Narasimham, S.; Ramalingaraju, M. Optimal capacitor placement in a radial distribution system using Plant Growth Simulation Algorithm. Int. J. Electr. Power Energy Syst. 2011, 33, 1133–1139. [Google Scholar] [CrossRef]
  26. Tabatabaei, S.; Vahidi, B. Bacterial foraging solution-based fuzzy logic decision for optimal capacitor allocation in radial distribution system. Electr. Power Syst. Res. 2011, 81, 1045–1105. [Google Scholar] [CrossRef]
  27. El-Fergany, A.A.; Abdelaziz, A.Y. Abdelaziz. Efficient heuristic-based approach for multi-objective capacitor allocation in radial distribution networks. IET Gener. Transm. Distrib. 2014, 8, 70–80. [Google Scholar] [CrossRef]
  28. El-Fergany, A.; Abdelaziz, A. Artificial Bee Colony Algorithm to Allocate Fixed and Switched Static Shunt Capacitors in Radial Distribution Networks. Electr. Power Compon. Syst. 2014, 42, 427–438. [Google Scholar] [CrossRef]
  29. El-Khattam, W.; Salama, M. Distributed generation technologies, definitions and benefits. Electr. Power Syst. Res. 2004, 71, 119–128. [Google Scholar] [CrossRef]
  30. Ackermann, T.; Knyazkin, V. Interaction between distributed generation and the distribution network: Operation aspects. In Proceedings of the IEEE/PES Transmission and Distribution Conference and Exhibition, Yokohama, Japan, 06–10 October 2002; Volume 2, pp. 12–15. [Google Scholar] [CrossRef]
  31. Ackermann, T.; Andersson, G.; Söder, L. Distributed Generation: A Definition. Electr. Power Syst. Res. 2001, 57, 195–204. [Google Scholar] [CrossRef]
  32. Hung, D.Q.; Mithulananthan, N. Multiple Distributed Generator Placement in Primary Distribution Networks for Loss Reduction. IEEE Trans. Ind. Electron. 2013, 60, 1700–1708. [Google Scholar] [CrossRef]
  33. Hung, D.Q.; Mithulananthan, N.; Bansal, R.C. Analytical Expressions for DG Allocation in Primary Distribution Networks. IEEE Trans. Energy Convers. 2010, 25, 814–820. [Google Scholar] [CrossRef]
  34. AlRashidi, M.; AlHajri, M. Optimal planning of multiple distributed generation sources in distribution networks: A new approach. Energy Convers. Manag. 2011, 52, 3301–3308. [Google Scholar] [CrossRef]
  35. Chang, C.-F. Reconfiguration and Capacitor Placement for Loss Reduction of Distribution Systems by Ant Colony Search Algorithm. IEEE Trans. Power Syst. 2008, 23, 1747–1755. [Google Scholar] [CrossRef]
  36. Guimarães, M.; Castro, C.; Romero, R. Distribution systems operation optimisation through reconfiguration and capacitor allocation by a dedicated genetic algorithm. IET Gener. Transm. Distrib. 2010, 4, 1213–1222. [Google Scholar] [CrossRef]
  37. Farahani, V.; Vahidi, B.; Abyaneh, H.A. Reconfiguration and Capacitor Placement Simultaneously for Energy Loss Reduction Based on an Improved Reconfiguration Method. IEEE Trans. Power Syst. 2012, 27, 587–595. [Google Scholar] [CrossRef]
  38. Esmaeilian, H.R.; Fadaeinedjad, R. Distribution system efficiency improvement using network reconfiguration and capacitor allocation. Int. J. Electr. Power Energy Syst. 2015, 64, 457–468. [Google Scholar] [CrossRef]
  39. Sultana, S.; Roy, P.K. Oppositional krill herd algorithm for optimal location of capacitor with reconfiguration in radial distribution system. Int. J. Electr. Power Energy Syst. 2016, 74, 78–90. [Google Scholar] [CrossRef]
  40. Zidan, A.; Shaaban, M.; El-Saadany, E.F. Long-term multi-objective distribution network planning by DG allocation and feeders reconfiguration. Electr. Power Syst. Res. 2013, 105, 95–104. [Google Scholar] [CrossRef]
  41. Muthukumar, K.; Jayalalitha, S. Integrated Approach of Network Reconfiguration with Distributed Generation and Shunt Capacitors Placement for Power Loss Minimization in Radial Distribution Networks. Appl. Soft Comput. 2017, 52, 1262–1284. [Google Scholar] [CrossRef]
  42. Muthukumar, K.; Jayalalitha, S. Optimal Placement and Sizing of Distributed Generators and Shunt Capacitors for Power Loss Minimization in Radial Distribution Networks Using Hybrid Heuristic Search Optimization Technique. Int. J. Electr. Power Energy Syst. 2016, 78, 299–319. [Google Scholar] [CrossRef]
  43. Muthukumar, K.; Jayalalitha, S. Multiobjective Hybrid Evolutionary Approach for Optimal Planning of Shunt Capacitors in Radial Distribution Systems with Load Models. Ain Shams Eng. J. 2018, 9, 1975–1988. [Google Scholar] [CrossRef]
  44. Abu-Mouti, F.; El-Hawary, M. Heuristic curve-fitted technique for distributed generation optimisation in radial distribution feeder systems. IET Gener. Transm. Distrib. 2011, 5, 172–180. [Google Scholar] [CrossRef]
  45. Pepermans, G.; Driesen, J.; Haeseldonckx, D.; Belmans, R.; D’haeseleer, W. Distributed generation: Definition, benefits and issues. Energy Policy 2005, 33, 787–798. [Google Scholar] [CrossRef]
  46. Photovoltaics Dispersed Generation. IEEE Application Guide for IEEE Std. 1547, IEEE Standard for Interconnecting Distributed Resources with Electric Power Systems; IEEE: Piscataway, NJ, USA, 2009. [Google Scholar]
  47. Kersting, W.; Dugan, R. Recommended practices for distribution system analysis. In Proceedings of the IEEE PES Power Systems Conference and Exposition, Atlanta, GA, USA, 29 October–1 November 2006; pp. 499–504. [Google Scholar] [CrossRef]
  48. Barker, P.P.; De Mello, R.W. Determining the impact of distributed generation on power systems. I. Radial distribution systems. In Proceedings of the IEEE Conference on Power Engineering Society Summer Meeting, Seattle, WA, USA, 16–20 July 2000; pp. 1645–1656. [Google Scholar] [CrossRef]
  49. Teng, J.H. A Network-Topology-based Three-Phase Load Flow for Distribution Systems. Proceeding of National Science. Proc. Nat. Sci. Counc. Roc. 2000, 24, 259–264. [Google Scholar] [CrossRef]
  50. Geem, Z.W.; Kim, J.H.; Loganathan, G.V. A New Heuristic Optimization Algorithm: Harmony Search. J. Simul. 2001, 76, 60–68. [Google Scholar] [CrossRef]
  51. Lee, K.S.; Geem, Z.W.; Lee, S.-H.; Bae, K.-W. The harmony search heuristic algorithm for discrete structural optimization. J. Eng. Optim. 2005, 37, 663–684. [Google Scholar] [CrossRef]
  52. Savier, J.S.; Das, D. Impact of network reconfiguration on loss allocation of radial distribution systems. IEEE Trans. Power Deliv. 2007, 22, 2473–2480. [Google Scholar] [CrossRef]
  53. Srinivasa Rao, R.; Ravindra, K.; Satish, K.; Narasimham, S.V.L. Power loss minimization in distribution system using network reconfiguration in the presence of distributed generation. IEEE Trans. Power Syst. 2013, 28, 317–325. [Google Scholar] [CrossRef]
  54. Duan, D.L.; Ling, X.D.; Wu, X.Y.; Zhong, B. Reconfiguration of distribution network for loss reduction and reliability improvement based on an enhanced genetic algorithm. Int. J. Electr. Power Energy Syst. 2015, 64, 88–95. [Google Scholar] [CrossRef]
  55. Wang, C.; Gao, Y. Determination of power distribution network configuration using non-revisiting genetic algorithm. IEEE Trans. Power Syst. 2013, 28, 3638–3648. [Google Scholar] [CrossRef]
  56. Gupta, N.; Swarnkar, A.; Niazi, K.R.; Bansal, R.C. Multi-objective reconfiguration of distribution systems using adaptive genetic algorithm in fuzzy framework. IET Gener. Transm. Distrib. 2010, 4, 1288–1298. [Google Scholar] [CrossRef]
  57. Zhang, D.; Fu, Z.; Zhang, L. An improved TS algorithm for loss minimum reconfiguration in large-scale distribution systems. Electr. Power Syst. Res. 2007, 77, 685–694. [Google Scholar] [CrossRef]
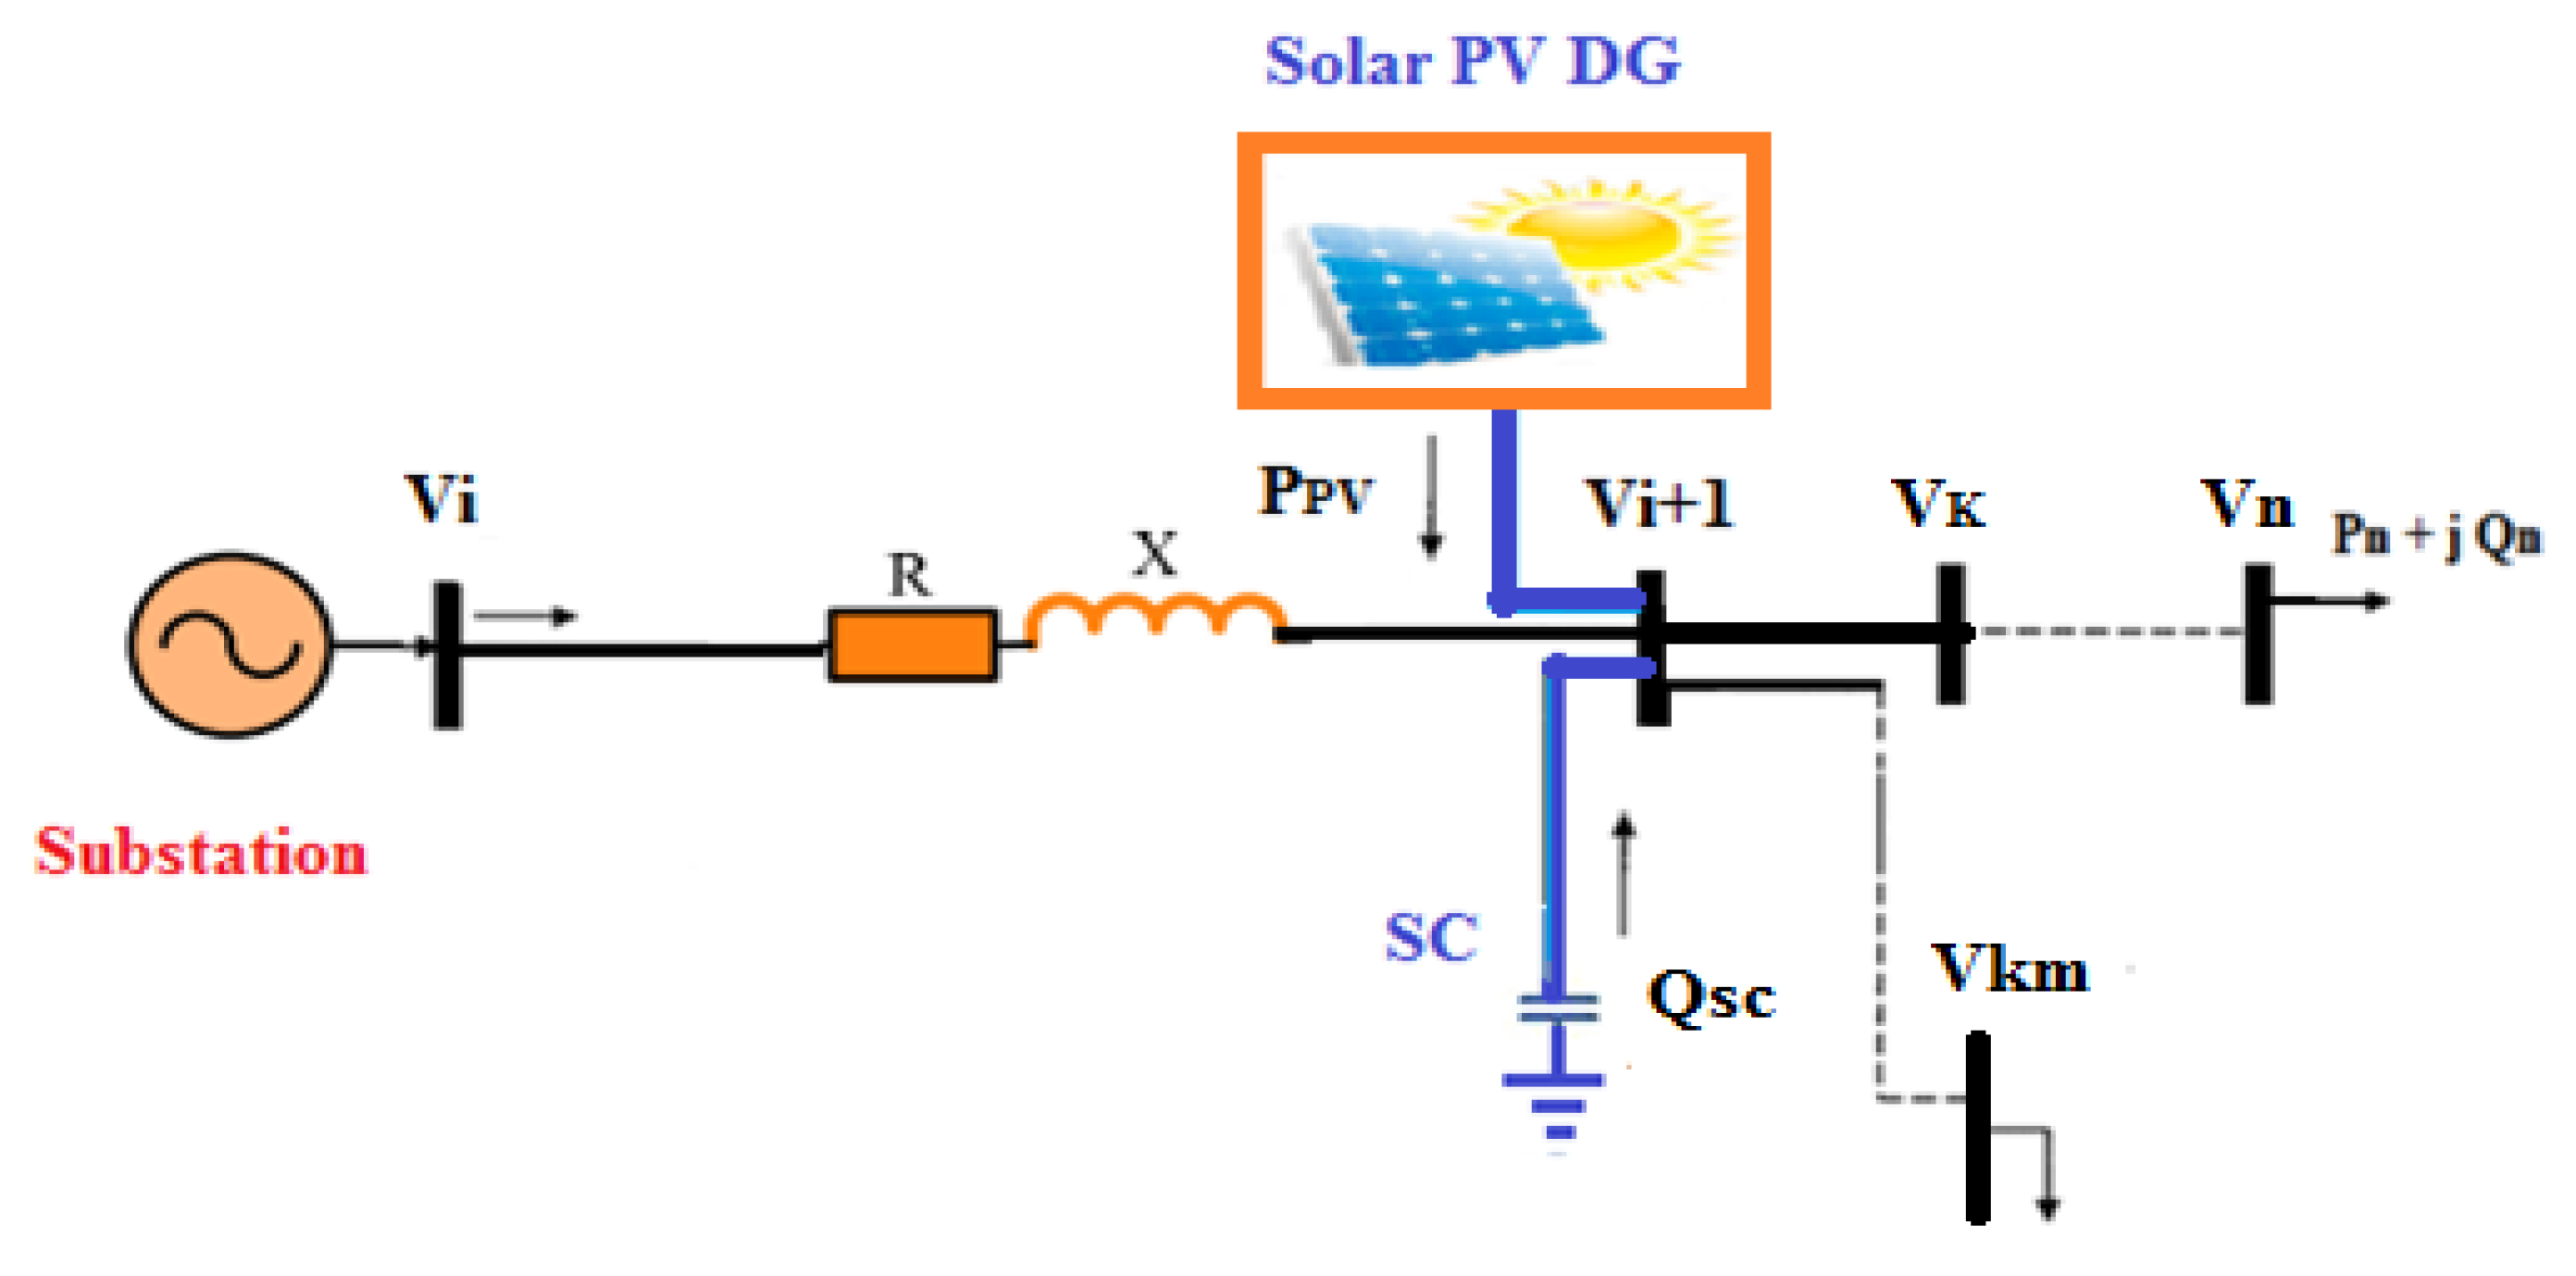
Figure 1. RPDN feeder with solar PV-DG unit and SC.
Sustainability 14 11480 g001
Figure 2. Flowchart for adjacency matrix generation.
Sustainability 14 11480 g002
Figure 3. Flowchart for calculating the in-degree of the vertices.
Sustainability 14 11480 g003
Table 1. Test network data at 100% loading condition.
Items69 Node RPDN118 Node RPDN
Nominal voltage (kV)12.6611
Active power demand (kW)3802.1022,709.7
Reactive power demand (kVAR)2694.517,041.1
Number of branches73132
Number of sectionalizing switches (closed)1–681–117
Open switches (Tie switches)(69-70-71-72-73)(118-119-120-121-122-123-124-125-126-127-128-129-130-131-132)
Table 8. Performance of 69 Node RPDN for scenario-III with different load levels.
Capacitor Placement before Reconfiguration (Scenario-III)
Item50% Load100% Load160% Load
Open switches 69-70-71-72-73
Multiple × Rating of SC [Switching state: 50%/100%/160%]@Node15 × 50 [4/9/15]@16
10 × 50 [3/6/10]@22
59 × 50 [17/34/59]@62
Total SC rating at each node (kVAR (Node))200 (16),450 (16),750 (16),
150 (22),300 (22),500 (22),
850 (62)1700 (62)2950 (62)
Total kVAR injection at each load level120024504200
Ploss38.02162.79471.21
% Loss reduction26.3027.6427.77
Vmin (Node)0.9706(65)0.9390 (65)0.9005(65)
Publisher’s Note: MDPI stays neutral with regard to jurisdictional claims in published maps and institutional affiliations.