Abstract
With the rapid development of tunnel construction, more and more long tunnels are being designed and built. In contrast to ordinary tunnels, long tunnels are characterized by large construction distances and difficult ventilation. In this study, gallery ventilation systems in the construction of long tunnels were studied. Combined with the CFD software FLUENT, a three-dimensional model of tunnel ventilation of a double tunnel was established, and a numerical simulation analysis of the ventilation flow field was carried out and optimized the flow field of gallery ventilation. We found that the main circulation air flow of gallery ventilation was formed by the jet fan, which was installed near the air flow-in tunnel. We also determined the main factors that affect the ventilation effect in gallery ventilation, including the wind wall formed by the high-speed airflow at the cross-aisle and found that the draft fan in front of the cross-aisle could eliminate the wind wall and improve the ventilation effect. The influence of the location and type of the draft fan on the elimination of air flow structure was studied, and the best fan layout scheme suitable for the site was determined. The ventilation scheme of the tunnel was optimized.
1. Introduction
Since the 1980s, China has witnessed rapid economic and social development, increasingly improved infrastructure, and unprecedented rapid development in tunnel construction. By the end of 2018, China had 17,738 road tunnels, with a total length of 17,263.1 km. There are 15,117 railway tunnels, with a total length of 16,331 km. China has become the country with the largest number of tunnel projects in the world, the largest construction scale, the longest total length and the fastest development speed [1,2,3]. China has a vast territory, with a large number of mountains and hills, and complex geological conditions. The area of hills and mountains accounts for about 2/3 of the land area, and tunnels are mostly built in the areas where these hills and mountains are located. Therefore, under the influence of topography, more and more long tunnels have been built, as shown in Figure 1. It can be observed that the mileage of long tunnels (1000~3000 m) and the extra long tunnels (>3000 m) is increasing. The complex geological conditions make ventilation more difficult, meaning that the ventilation efficiency is low, and the energy consumption is high. These all increase the difficulty of ventilation during tunnel construction, and have a negative impact on the ventilation system in the tunnel, which greatly increases the construction cost of the tunnel [4]; therefore, tunnel ventilation needs to be improved.
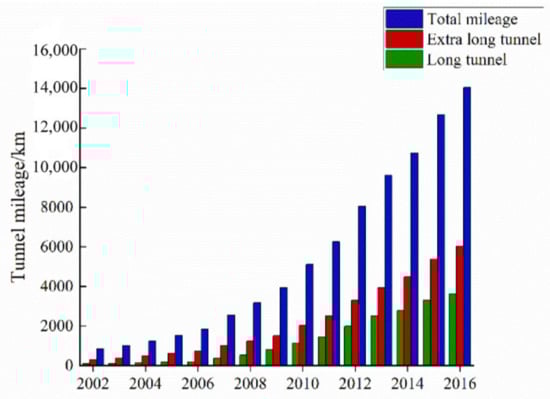
Figure 1.
Tunnel development trend in China.
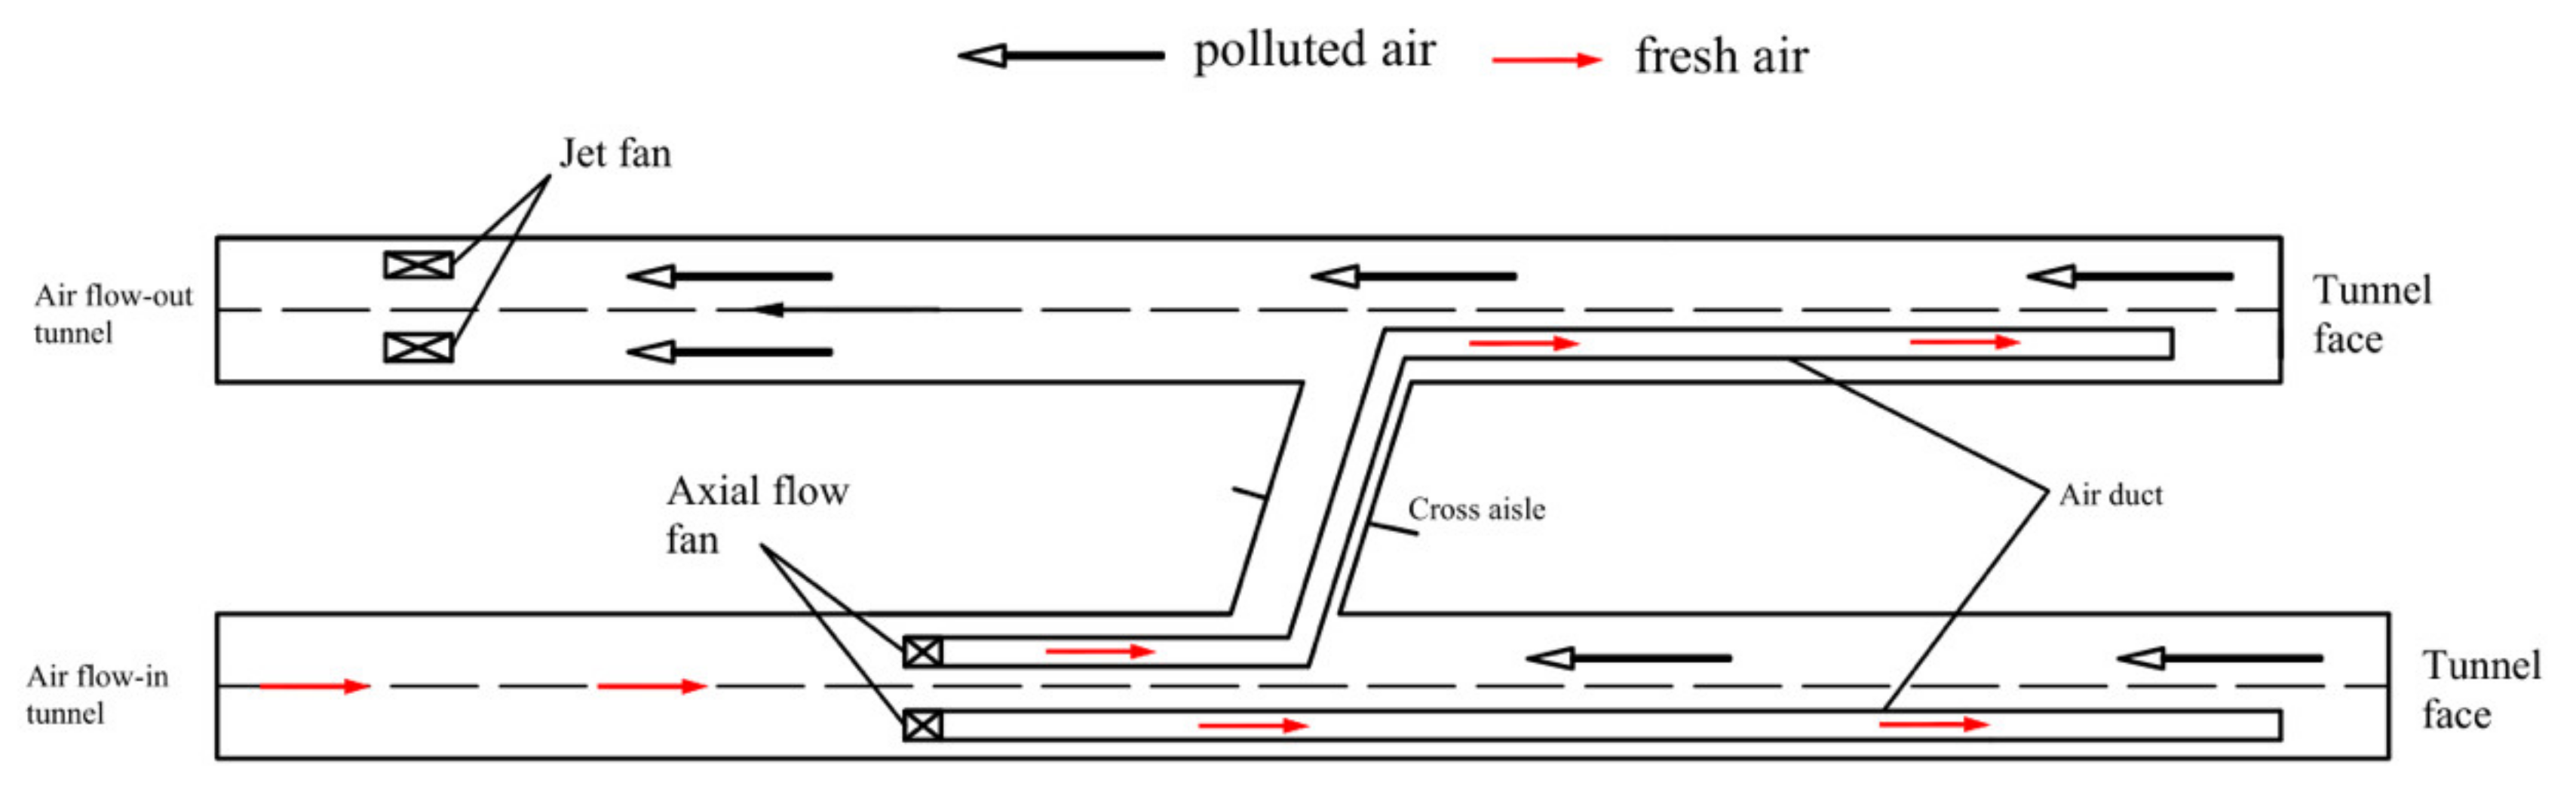
During tunnel construction, press-in ventilation and gallery ventilation are usually used in the construction of long twin tunnels, as they offer large amounts of fresh air in a cost-effective way. Therefore, when using press-in ventilation in long tunnels, the air duct needs to increase in length with the continuous excavation of the tunnel face, and the ventilation resistance will also increase; at the same time, there will be more or less air leakage at the joint of the air duct. With the continuous increase in the length, the air leakage rate will continue to increase, and the air volume that can reach the tunnel face will continue to decrease. Gallery ventilation is a ventilation method that takes the built tunnel as the ventilation path. The principle of this method is to use one of the tunnels constructed by double tunnels as the inlet wind tunnel and the other as the outlet wind tunnel. The jet fan is set in the outlet wind tunnel, and the air supply and exhaust circuits are formed between the inlet wind tunnel, the transverse tunnel and the outlet tunnel by its pressurization effect, and the two tunnels are connected to form an integral ventilation system. The fresh air is transmitted to the two tunnel faces through the axial flow fan and the wind tunnel arranged in the inlet wind tunnel. At the same time, the pollutants from the two tunnel faces are collected in the main air flow, and they are combined into the out wind tunnel through the main air flow and discharged out of the tunnel together. This method makes reasonable use of the characteristics of parallel double tunnels, and the whole tunnel ventilation system is connected in series to form a tunnel network through a cross-aisle, which can effectively reduce the ventilation resistance, reduce the energy consumption of the ventilation system, and improve the ventilation efficiency [1]. The air flow structure of gallery ventilation is shown in Figure 2.
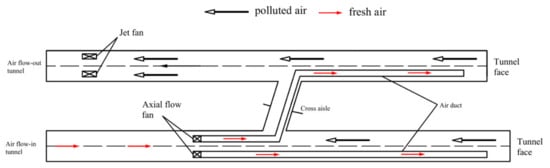
Figure 2.
Scheme of jet flow recirculation system.
Tunnel ventilation is a complex system, and the study of air flow field is usually carried out by experiments or numerical simulation. Due to the rapid development of computer technology, tunnel ventilation has been gradually separated from the limitations of experimental methods, and the numerical simulation method based on computational fluid dynamics (CFD) has gradually become popular in this field [1]. Many scholars began to apply CFD simulation technology to the study of tunnel ventilation [5,6,7,8,9]. For example, Xu et al. [5] used CFD to simulate tunnel fires under natural ventilation, and the CFD results were compared with reduced scale experiments and previous theories. Yin et al. [6] studied the air curtain dust removal effect by ventilation parameters during tunneling by the CFD software and obtained the optimal dustproof parameters of the driving area of the roadheader. Li et al. [7] used the numerical simulation method to analyze the resistance characteristics of a utility tunnel’s ventilation system and the experiment of a reduced scale model proved the reliability of the numerical simulation method. Xiu et al. [8] analyzed the influence of the flow rate on dust diffusion using a CFD method. Zhou et al. [9] employed CFD to simulate the temperature and airflow velocity distributions in different types of tilted city tunnels.
At present, the gallery ventilation system is mainly used in coal mines, and has made great achievements in coal mine ventilation. With the increasing complexity of underground engineering, gallery ventilation systems are gradually being applied to long tunnels and complex underground space engineering. Shokofe et al. [10] investigated the several ventilation scenarios to determine the optimum ventilation air characteristics of gallery ventilation systems. Zhang et al. [11], based on the construction ventilation of the Guantian tunnel, studied the optimization of fan arrangement near the cross passage and the bottom of the shaft. Looking at the research status of tunnel ventilation across the world, although numerical simulation is widely used in tunnel ventilation, it mainly simulates tunnel structure and fan air volume. The gallery ventilation system is also used in a small number of tunnels, but the study of using gallery ventilation systems in extra long tunnels is relatively rare.
The aim of this study is to reveal the flow field distribution of gallery ventilation in long tunnels under different jet fan parameters and the gallery ventilation optimization scheme of long tunnels. The calculation results of the three-dimensional numerical model are verified by the engineering measurements. In this study, we consider the ventilation problems of long tunnels in the actual construction process. The results can help engineers to better understand the flow pattern of a recirculation ventilation system, improve traditional tunnel ventilation technology, improve tunnel ventilation quality, reduce tunnel ventilation costs, and create a better tunnel construction environment.
2. Numerical Model
2.1. Model Description
Tunnel jet gallery construction ventilation is a complex problem and the flow pattern of the wind from the duct orifice, the energy exchange between the jet and the surrounding gas particles after being restricted by the tunnel wall, and the local resistance at the joint of the cross passage and the main tunnel are all related to the hydrodynamics problems. It is difficult to fully and accurately reflect the air flow distribution characteristics during tunnel construction by simply relying on experimental research and empirical formulae. In this study, the commercial computational fluid dynamics software FLUENT is selected as the research tool [12]. The numerical software has a rich physical model library in terms of fluids, covering various physical phenomena in real life, such as fluid flow, medium transfer, heat transfer, heat radiation, chemical reaction, etc., with high calculation accuracy, reliable simulation and efficient operation [13].
According to the relevant data and field tests, the tunnel radius is 5.5 m, the tunnel section area is 65.60 m2, the perimeter is 31.02 m, the air density is 1.225 kg/m3, the fluid kinematic viscosity coefficient is 1.8 × 10⁻⁵ PA/s and the flow rate is 0.5 m/s in the middle line of the tunnel. Against the background of this project, the Reynolds number of fluid is 5, which is far greater than the critical value of 4000. The fluid flow involved in this study is the turbulent state, so the turbulence model should be used for the calculations. For the simulation of turbulence problems, the direct simulation method (DNS), large eddy simulation method (LES), Reynolds average method (RANS) and statistical average method are usually used, among which the Reynolds average method (RANS) is the most widely used turbulence numerical simulation method [14]. Based on the comparison of the RANS turbulence model, provided by FLUENT with a large amount of data investigation and preliminary calculation, the standard k-ε two equation turbulence model is proposed [15].
Based on the above analysis, gallery ventilation can be described by the time-averaged governing equation of the turbulence mathematical model [16,17,18] and the tensor form is as follows [19]:
where k, ε, t, ui, xi, ν, p, fi and νt are expressed as turbulence kinetic energy (m2/s2), turbulent dissipation (m2/s3), time (s), velocity component (m/s), coordinate component, laminar flow force viscosity coefficient (pa·s), time-averaged pressure (pa), mass force (m/s2) and turbulent viscosity coefficient (pa·s).
According to the tunnel construction specifications, the wind speed at the tunnel construction face is no lower than 0.15 m/s [20]. Therefore, the safety factor of tunnel construction () was adopted, which can be defined as follows:
where is the simulated wind speed at the tunnel face; is the minimum wind speed specified for tunnel construction.
2.2. Geometric Model and Meshing
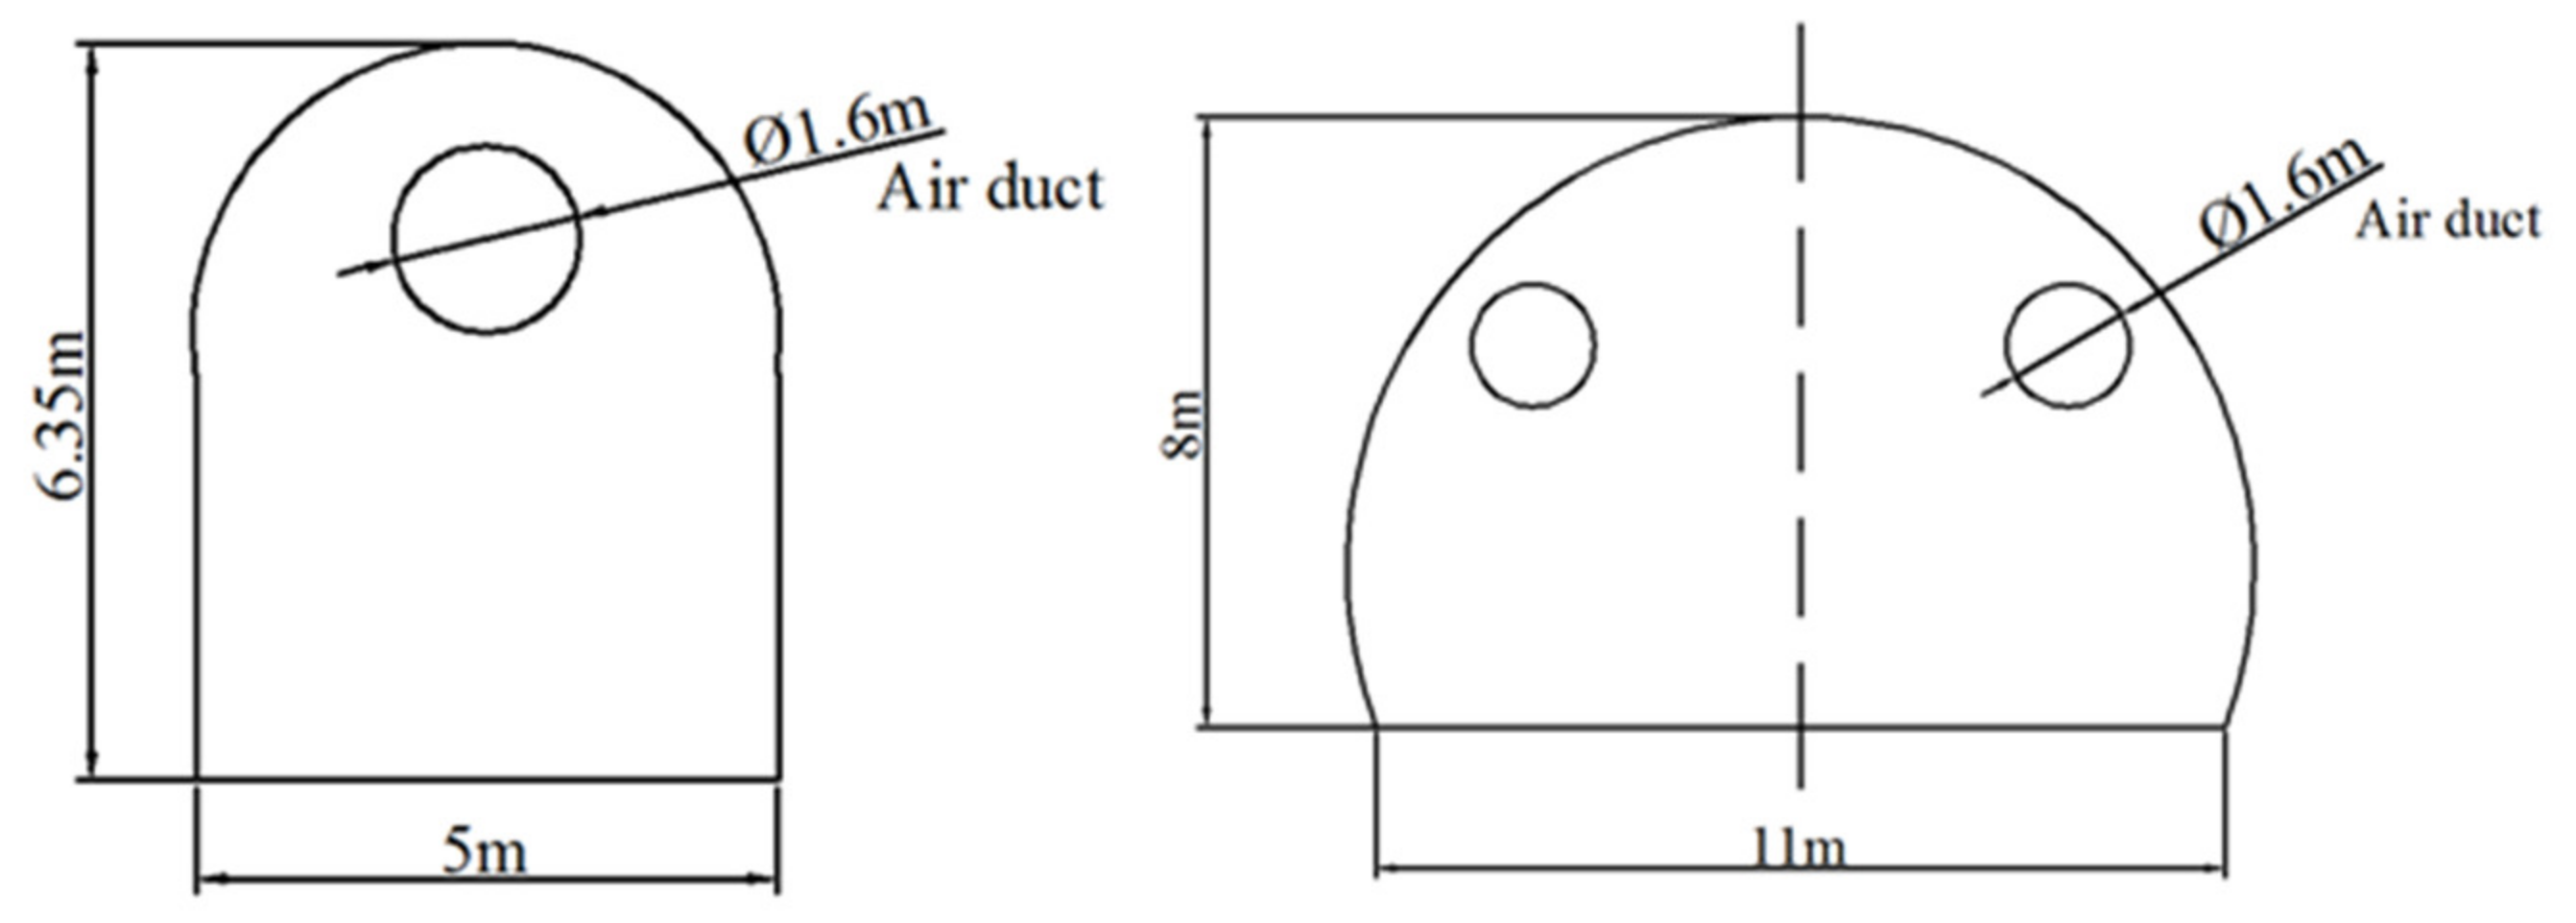
This study focuses on the flow field and exhaust effect under different drainage fan parameters, so the excavation in the heading face was ignored for the purpose of this study. The roadway recirculation systems to be modeled consist of twin parallel tunnels with the length of 3726 m, width 11 m and height 8 m, and a cross-aisle with the width of 5 m and height 6.35 m. The sketch of the model is shown in Figure 3.
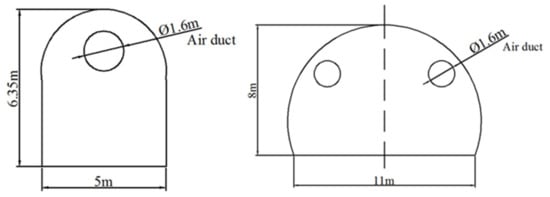
Figure 3.
Sketch of the model.
The distance between the central lines of the twin tunnels is 41 m. Under this distance, recirculation systems are adopted, in which the tunnel face is supplied by an axial flow fan arranged in the air intake tunnel by an air duct, and the air duct opening is 15 m away from the tunnel face, and the distance between the axial flow fan and the cross-aisle is 40 m.
Because the length of the tunnel is very long, it is difficult to build a complete 3D model. Therefore, this study uses a combination of a two-dimensional model and three-dimensional model. Firstly, a two-dimensional tunnel model with a length of 3762 m is established. Under this model, the formation of the main circulating air flow and the flow field in the tunnel under the influence of different types of jet fans are calculated. The main circulation airflow of tunnel ventilation is formed by the jet fan, which is installed at a distance of 100 m from the exit of the wind tunnel. Then, a 200 m three-dimensional model near the cross-aisle is established and the flow field and exhaust effect of the tunnel under different parameters of the draft fan are calculated.
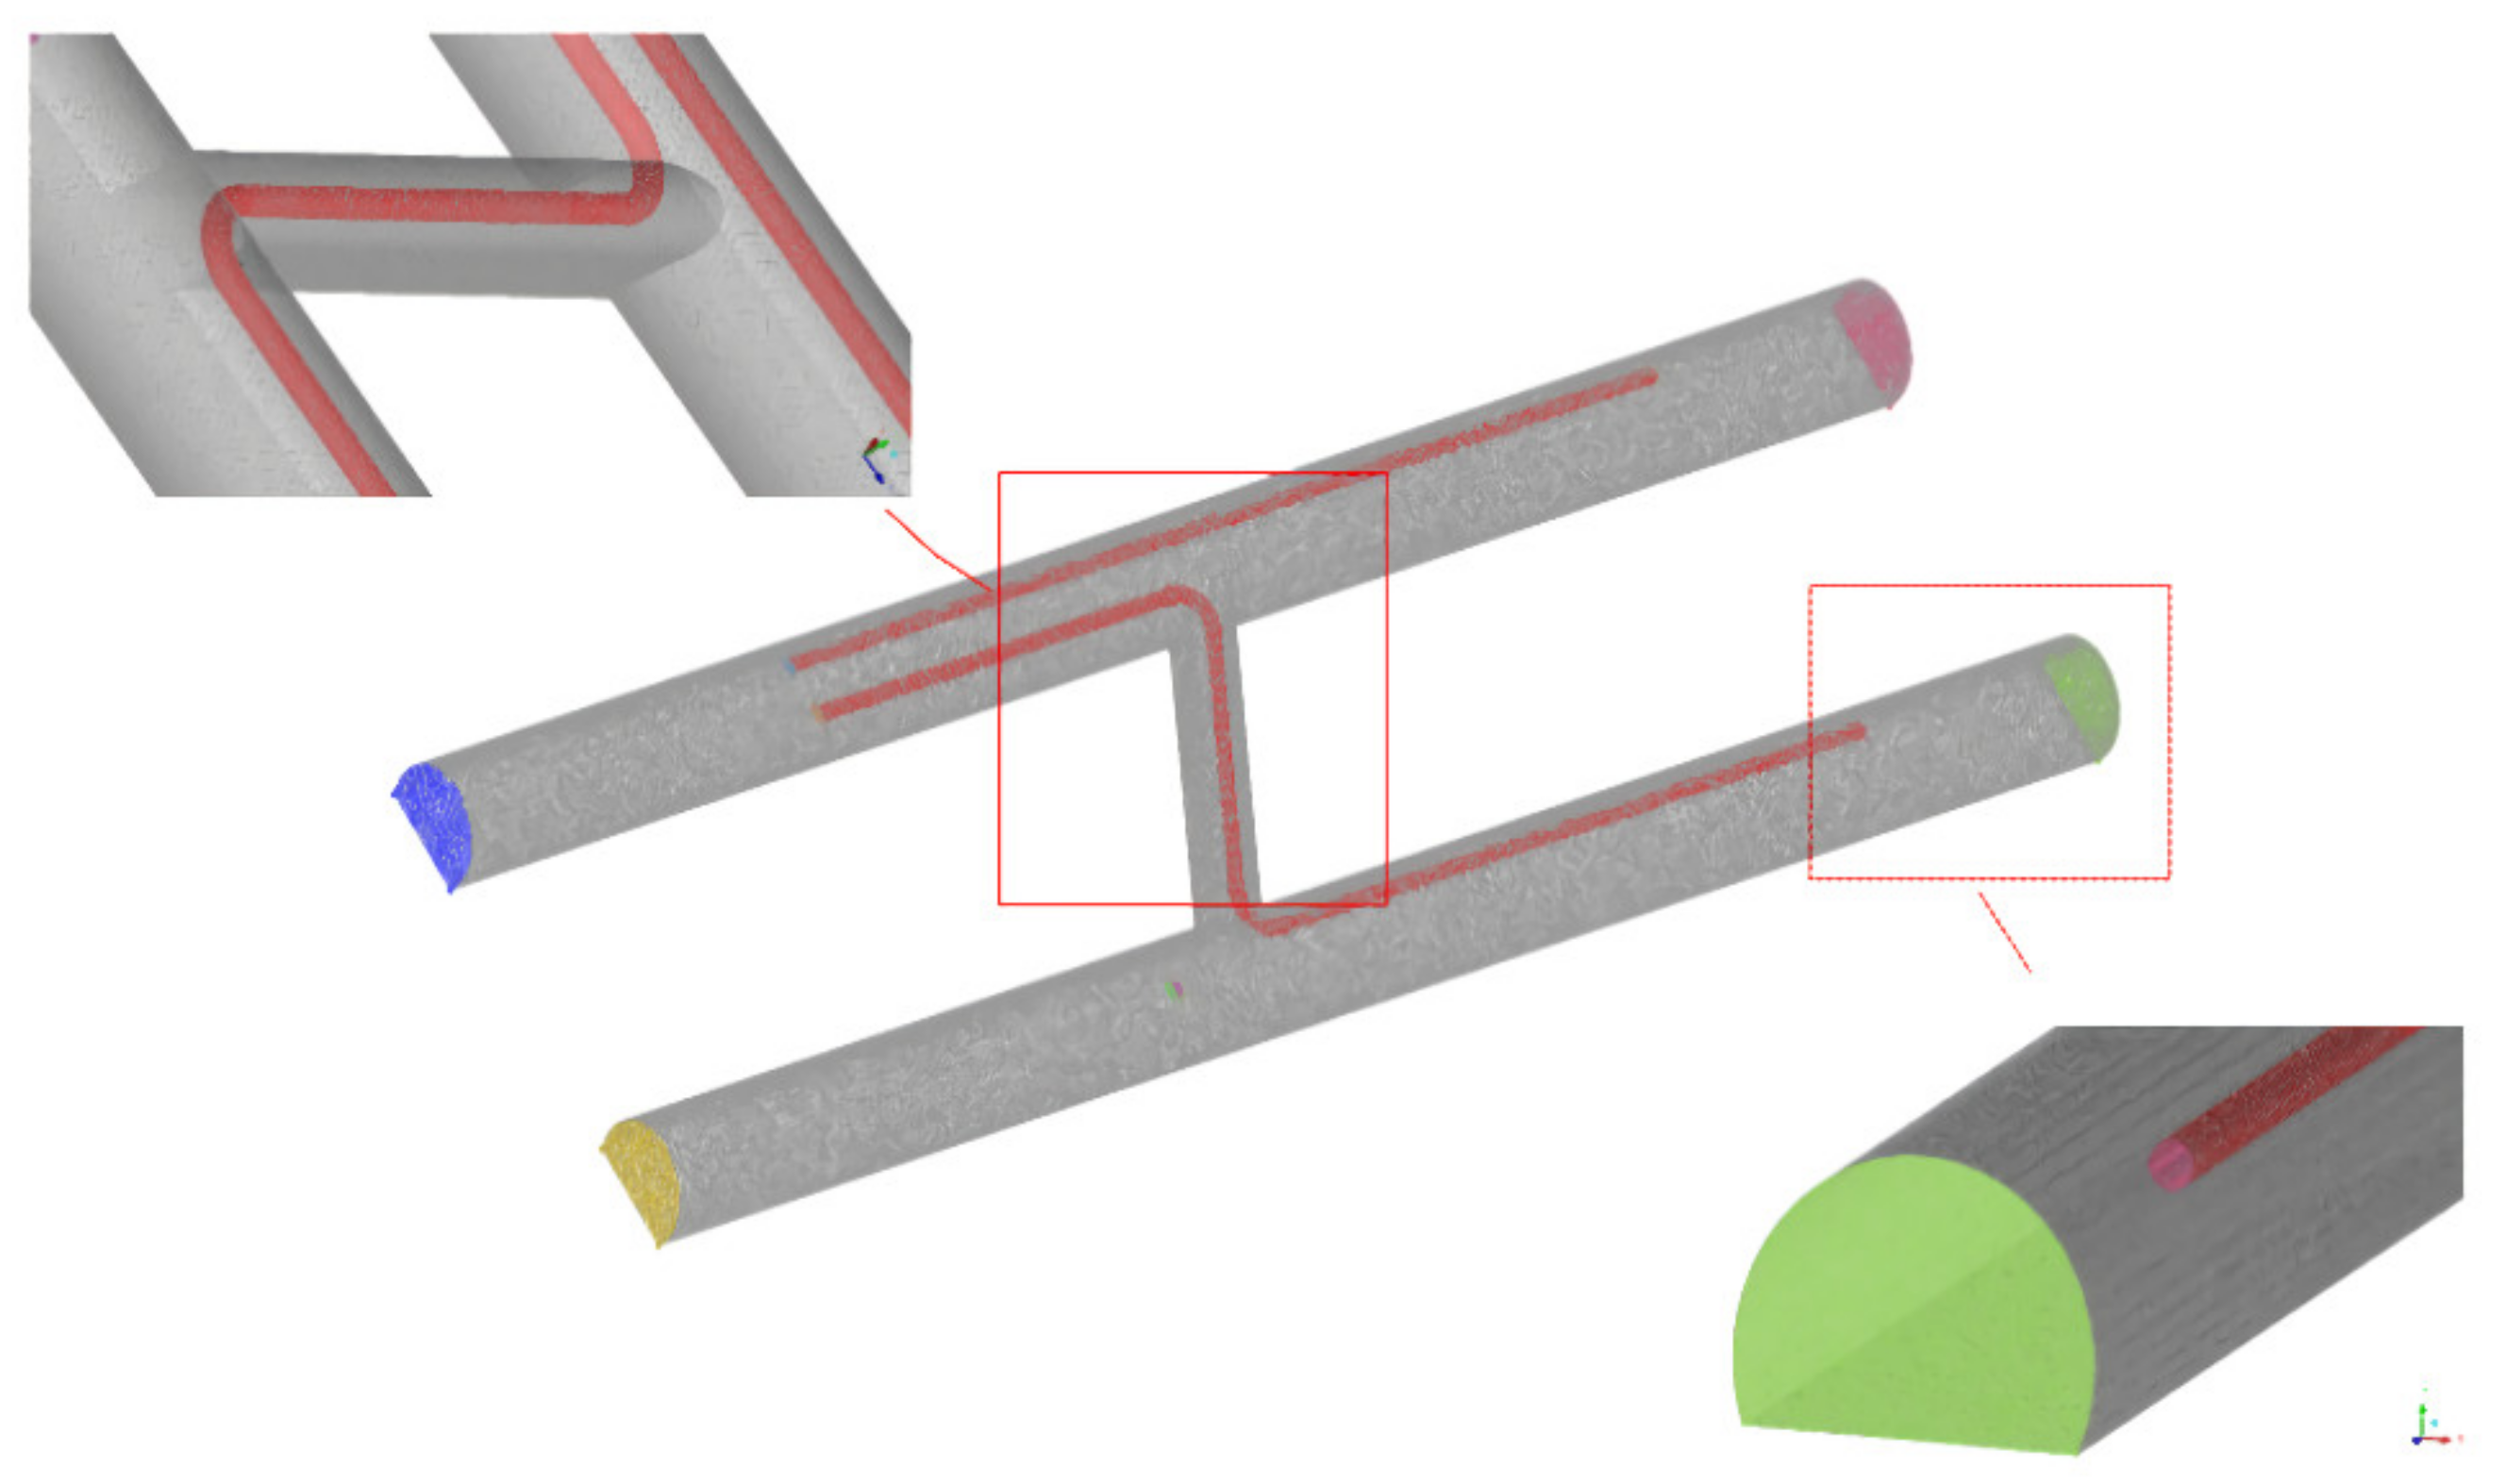
ANSYS ICEM CFD was used to divide the grid, taking into account the calculation accuracy and speed and the final grid division results are shown in Figure 4 and Figure 5.
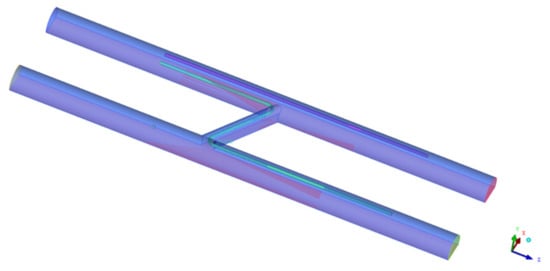
Figure 4.
Two-dimensional geometry and meshing of numerical models.
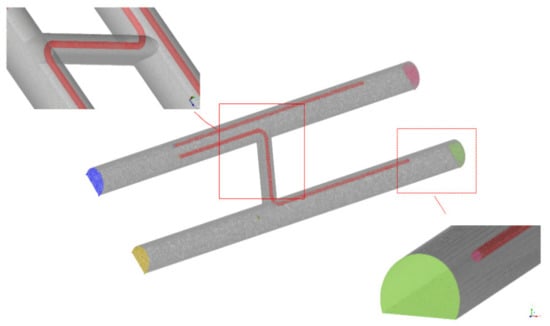
Figure 5.
Three-dimensional geometry and meshing of numerical models.
2.3. Boundary Conditions
According to the actual situation of construction ventilation, the boundary conditions in the numerical simulation are shown in Table 1.

Table 1.
The information on boundary conditions in numerical simulation.
Turbulence model selection for the standard k-ε two equation model is as follows. Speed and pressure coupling adopts the SIMPLE algorithm, the pressure difference standard format is adopted, and momentum, turbulent kinetic energy and turbulent dissipation terms all use the first order upwind format.
3. Results and Validation
3.1. Formation of Main Circulation Air Current
The flow of air is an important tool for evaluating ventilation methods. It directly affects the operating environment in the tunnel and divides the flow field analysis into the basis for studying construction ventilation. This study first verifies the formation of the main circulating airflow using recirculation systems in long and large tunnels. Therefore, in this study, three types of jet fans with different parameter combinations, 200 pa, 300 pa, and 400 pa, were considered and installed at a distance of 50 m from the air flow-out tunnel. The simulation results are shown in Figure 6.
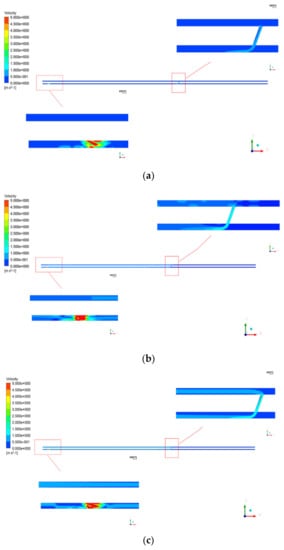
Figure 6.
Tunnel flow field under different types of jet fans. (a) Case 1: 200 Pa jet fan; (b) Case 2: 300 Pa jet fan; (c) Case 3: 400 Pa jet fan.
It can be observed from the calculation results that under the action of the jet fan, the main air flow that enters from the air flow-in tunnel enters the air flow-out tunnel after passing through the cross-aisle, and is discharged from the air flow-out tunnel. In the recirculation ventilation system, some of the fresh air in the air flow-in tunnel is forced to the heading faces by the axial fans, and the rest flows forward and passes through the cross-aisle, experiencing the confluence twice with the contaminated air at both ends of the aisle. So, the contaminated air will flow into the main wind and be discharged out of the tunnel.
In order to study the ventilation effect of different fans, the five sections in the tunnel were intercepted to study the distribution of wind speed. Section I is 50 m from the air flow-in, Section II is 500 m from the air flow-in, Section III is located 10 m in front of the cross-aisle of the air flow-in tunnel, Section IV is located 50 m in front of the cross tunnel of the air flow-out tunnel, and Section V is located in the middle of the cross-aisle. The average wind speed of the cross section is shown in Table 1. The technical specifications for the construction of railway and highway tunnels in China set the minimum average air velocity of return air flow as 0.5 m/s for a gas tunnel. However, it can be observed from Table 2 that the wind speed selected for 200 pa and 300 pa is less than the specified wind speed. This can lead to the accumulation of polluted air and accidents. Therefore, in order to achieve both the ventilation effect and the energy saving effect, a 400 pa jet fan can be selected to form the main airflow of jet tunnel ventilation. The content after this study is also based on the calculation results of a 400 Pa jet fan.
Table 2.
Average air velocities at different sections.
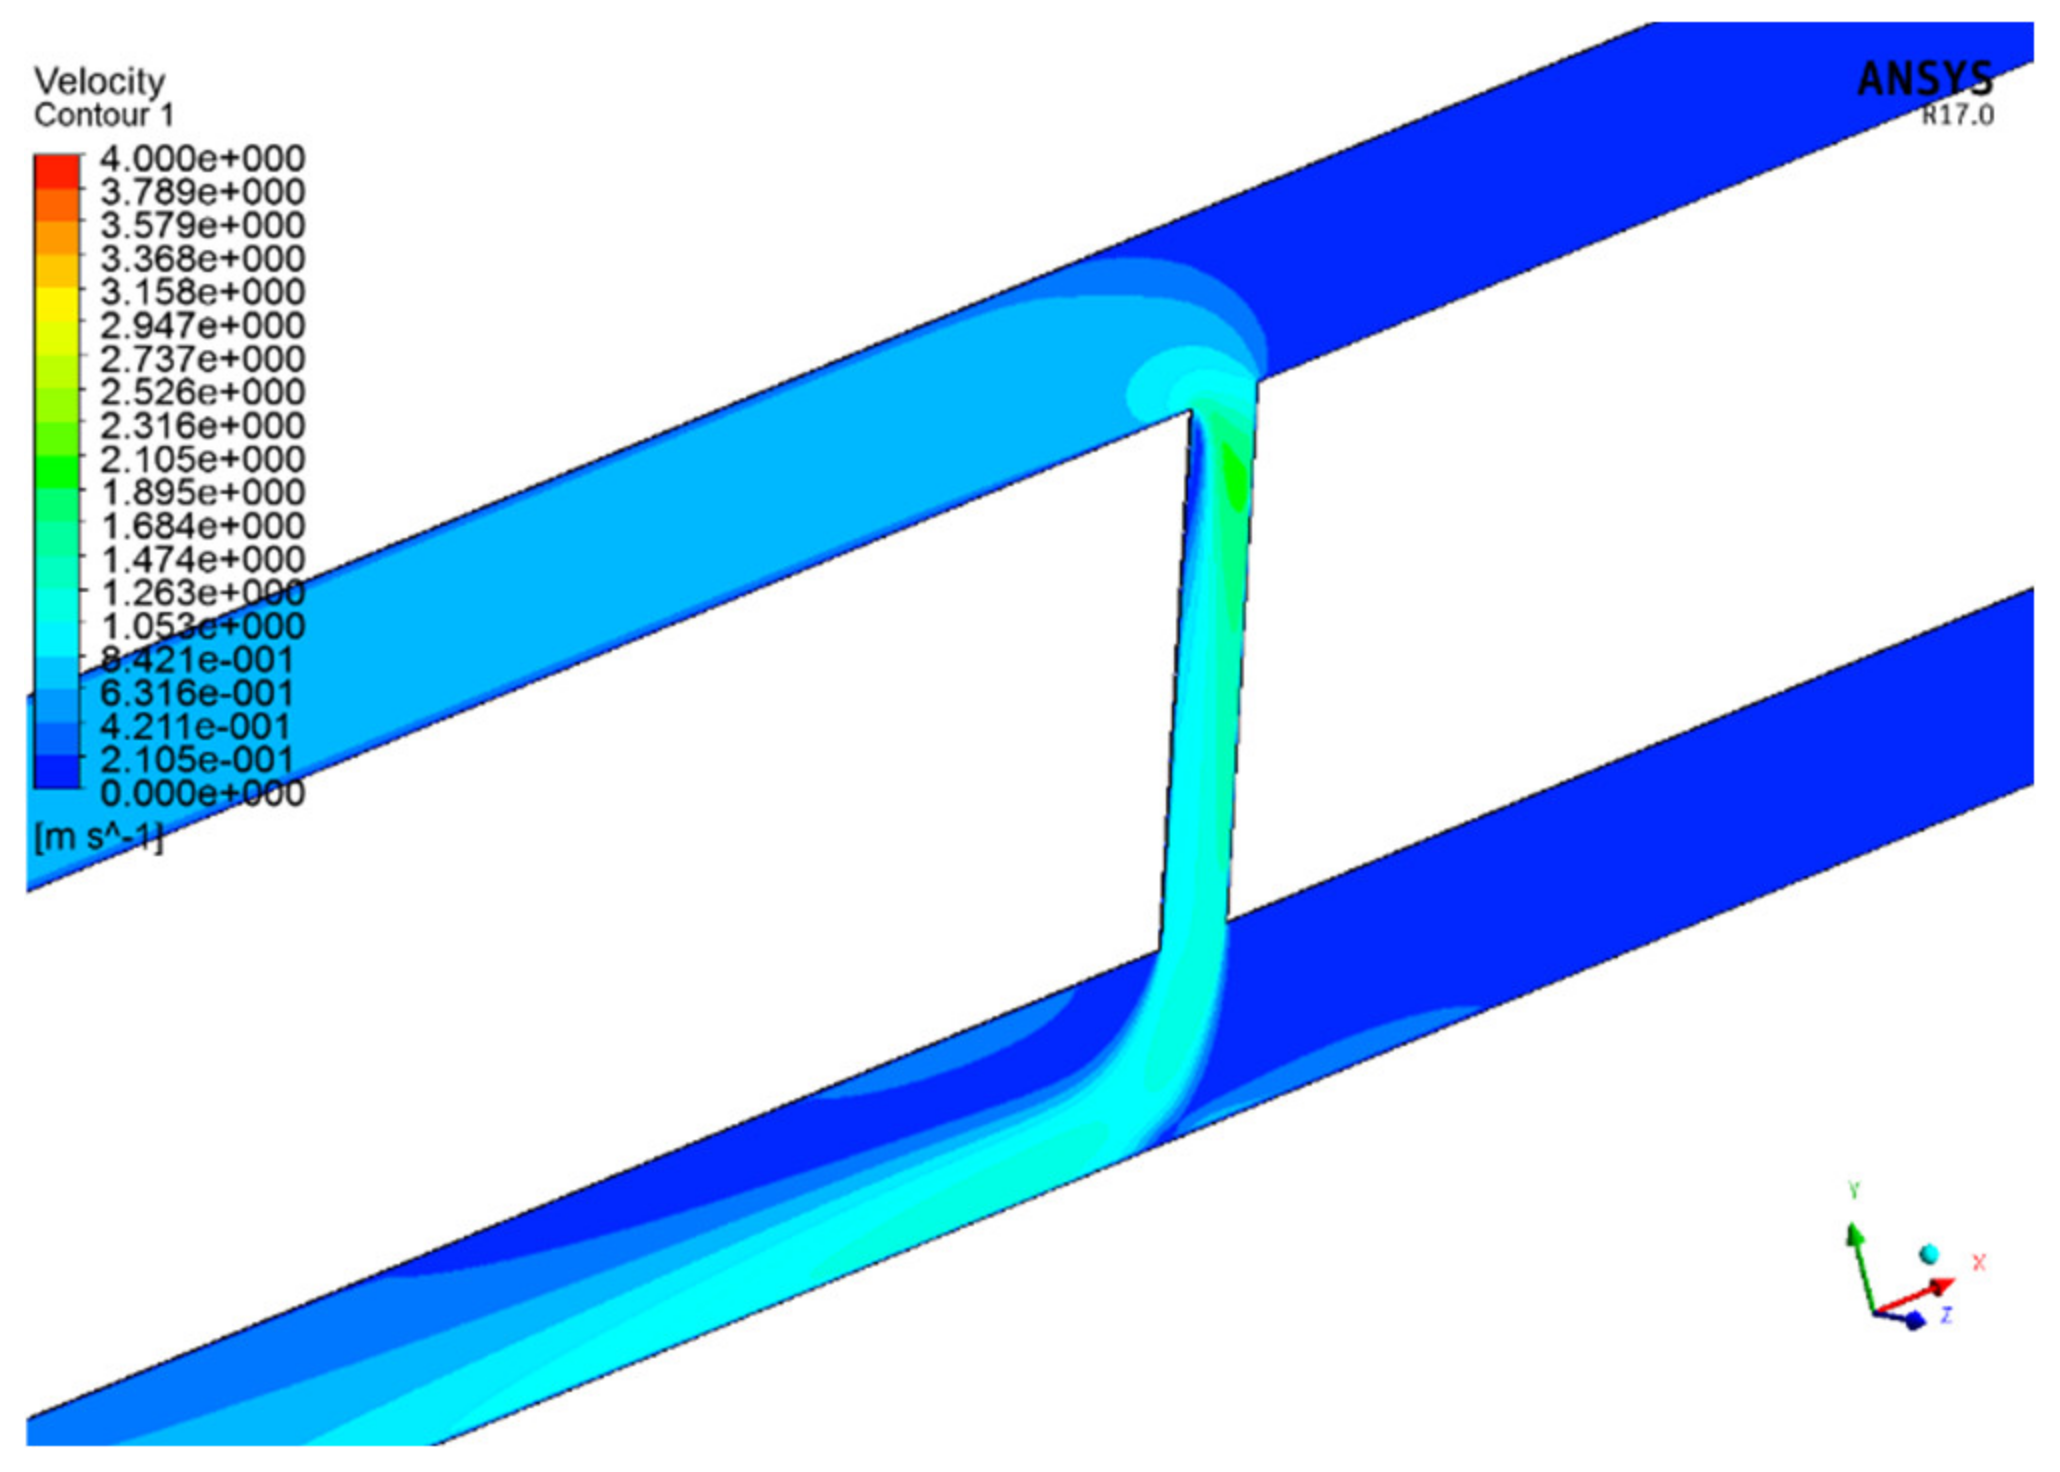
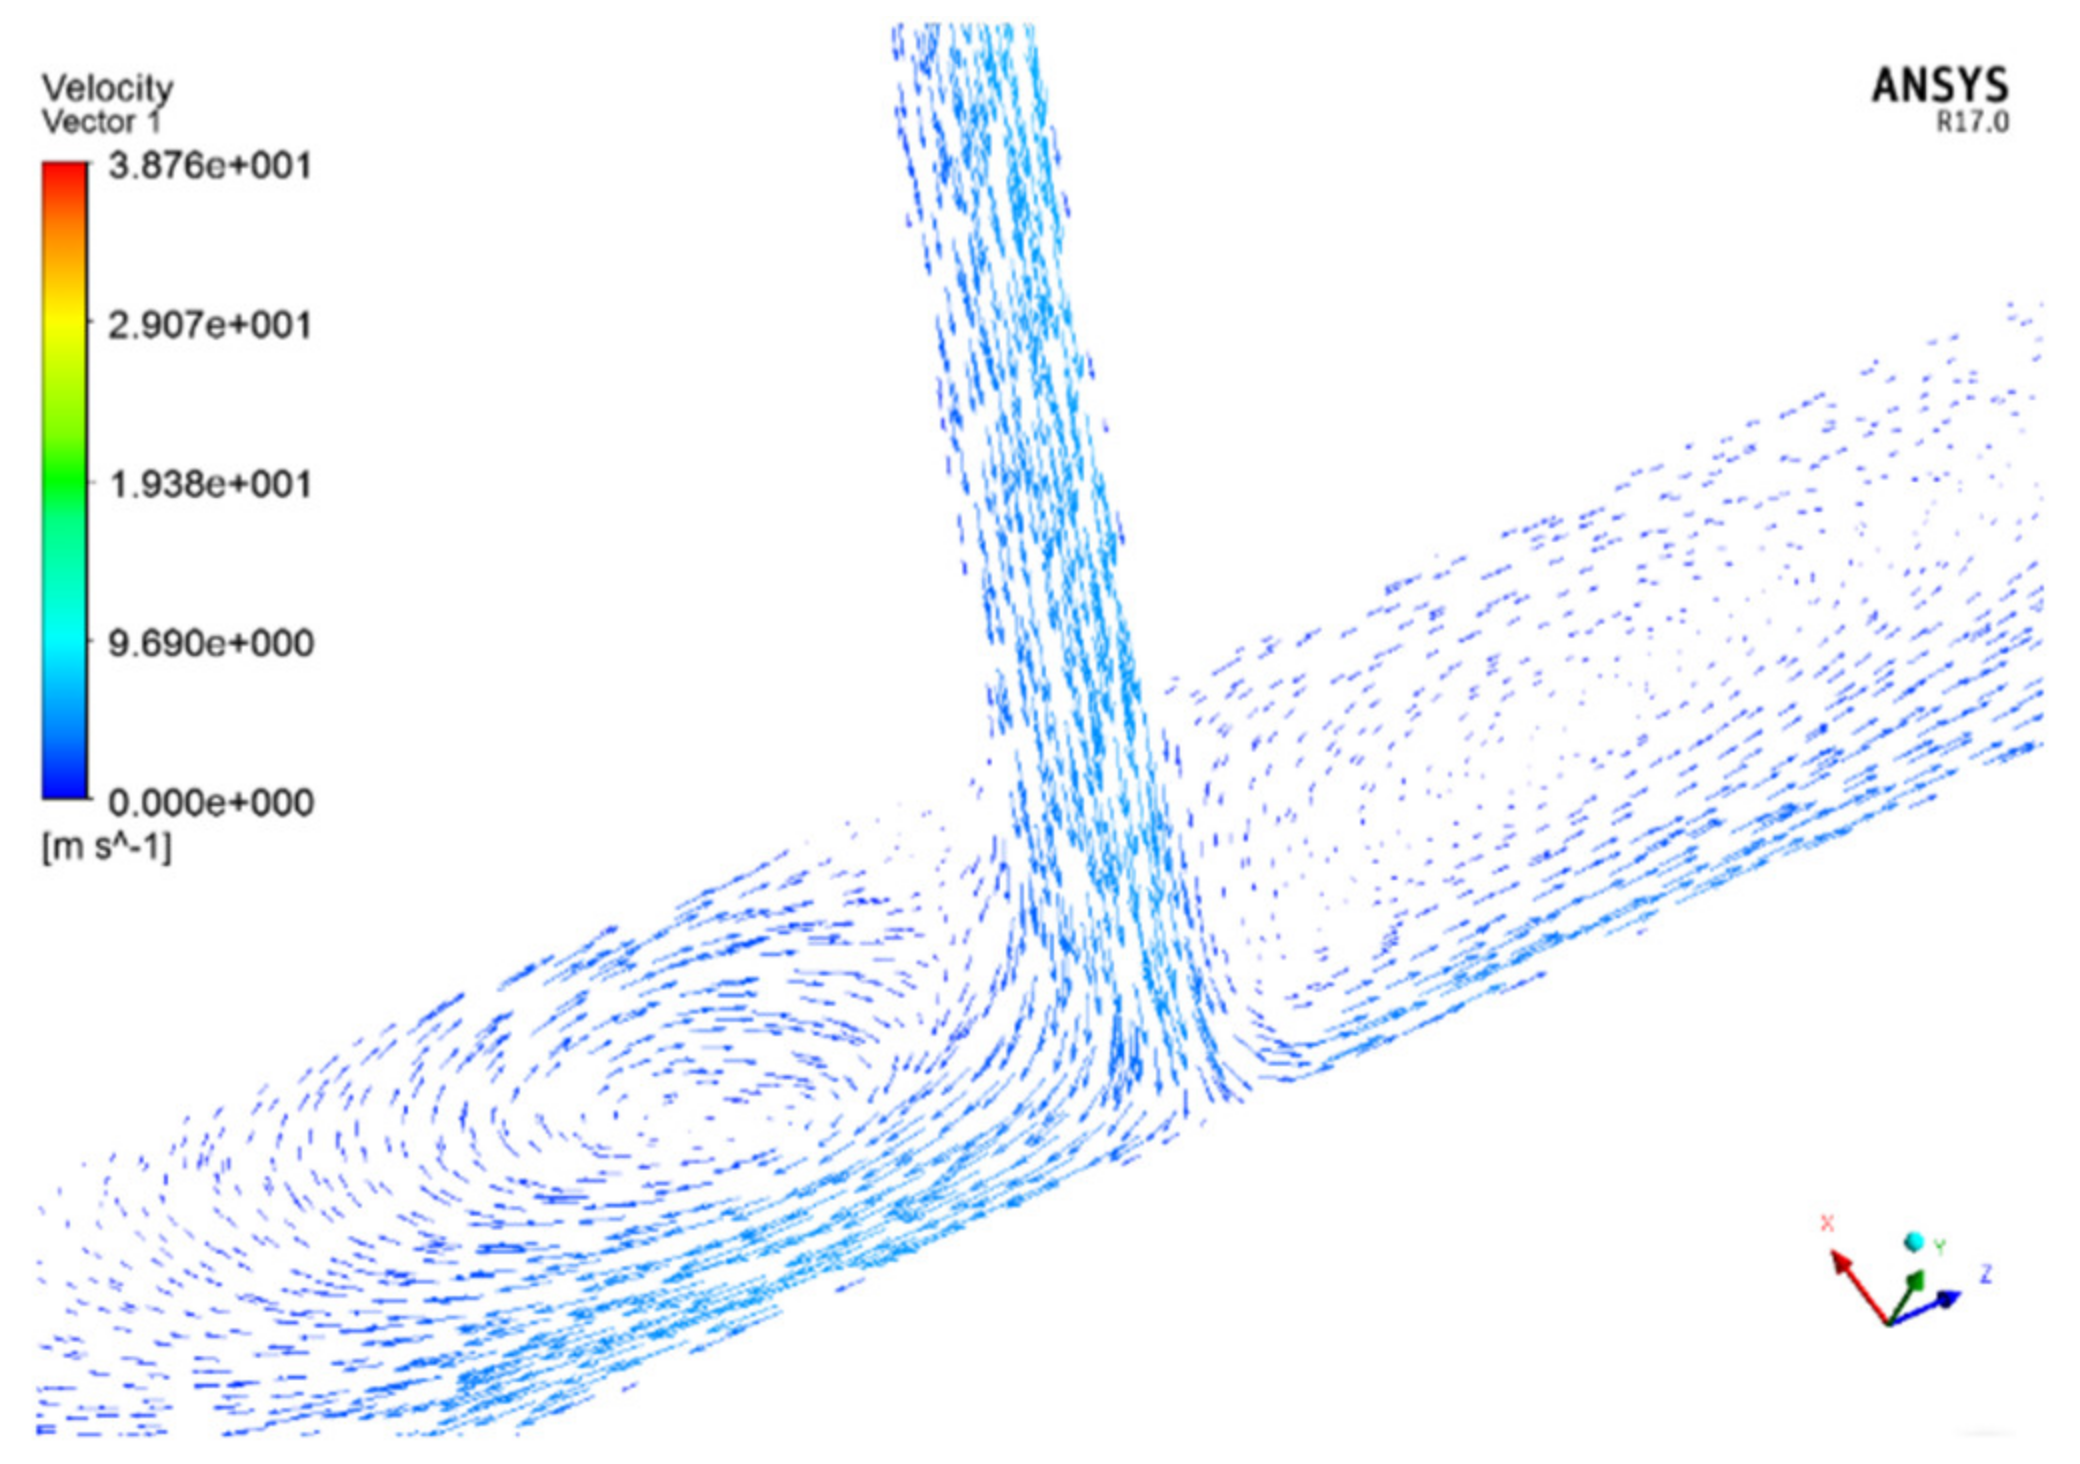
Figure 7 shows the velocity cloud diagram attached to the cross-aisle. It can be observed that the average air velocity of air flow increases significantly after the air flow passes through the cross-aisle, reaching about 5 m/s. Since the cross-sectional area of the cross-aisle is smaller than the area of the main tunnel, an air wall forms at the outlet of the cross channel, which hinders the exchange of polluted air and fresh air in the tunnel. Figure 8 shows the flow field at the cross-aisle in the 3D model. The results show that the air flow in the cross channel prevents the air flow in the tunnel face from entering the main channel, and there is a backflow area and a vortex area opposite to the air flow direction in the air channel. Therefore, a draft fan is installed in front of the wind wall to improve the wind flow pattern. The drainage wind will form a negative pressure zone at the tail, change the flow direction of the high-speed air flow, break the wind wall, increase the speed of main circulation air flow, and improve the discharge effect of the air flow-out tunnel.

Figure 7.
Speed cloud map at the cross-aisle.
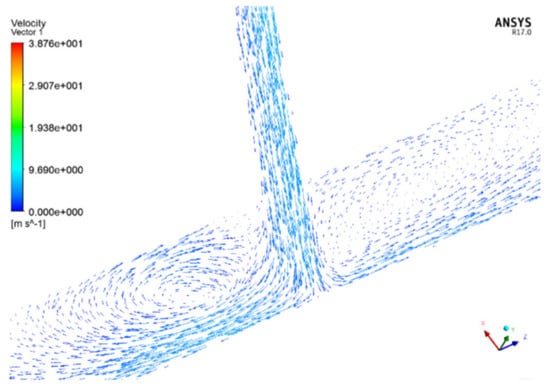
Figure 8.
Speed vector at the cross-aisle.
3.2. Study on the Elimination of the Wind Wall
In this study, nine parameter combinations of tunnel draft fans were considered, including the model of the draft fans in the tunnel and the distance between the draft fans and the exit of the cross-aisle, as shown in Table 3.
Table 3.
Combination of different fan parameters.
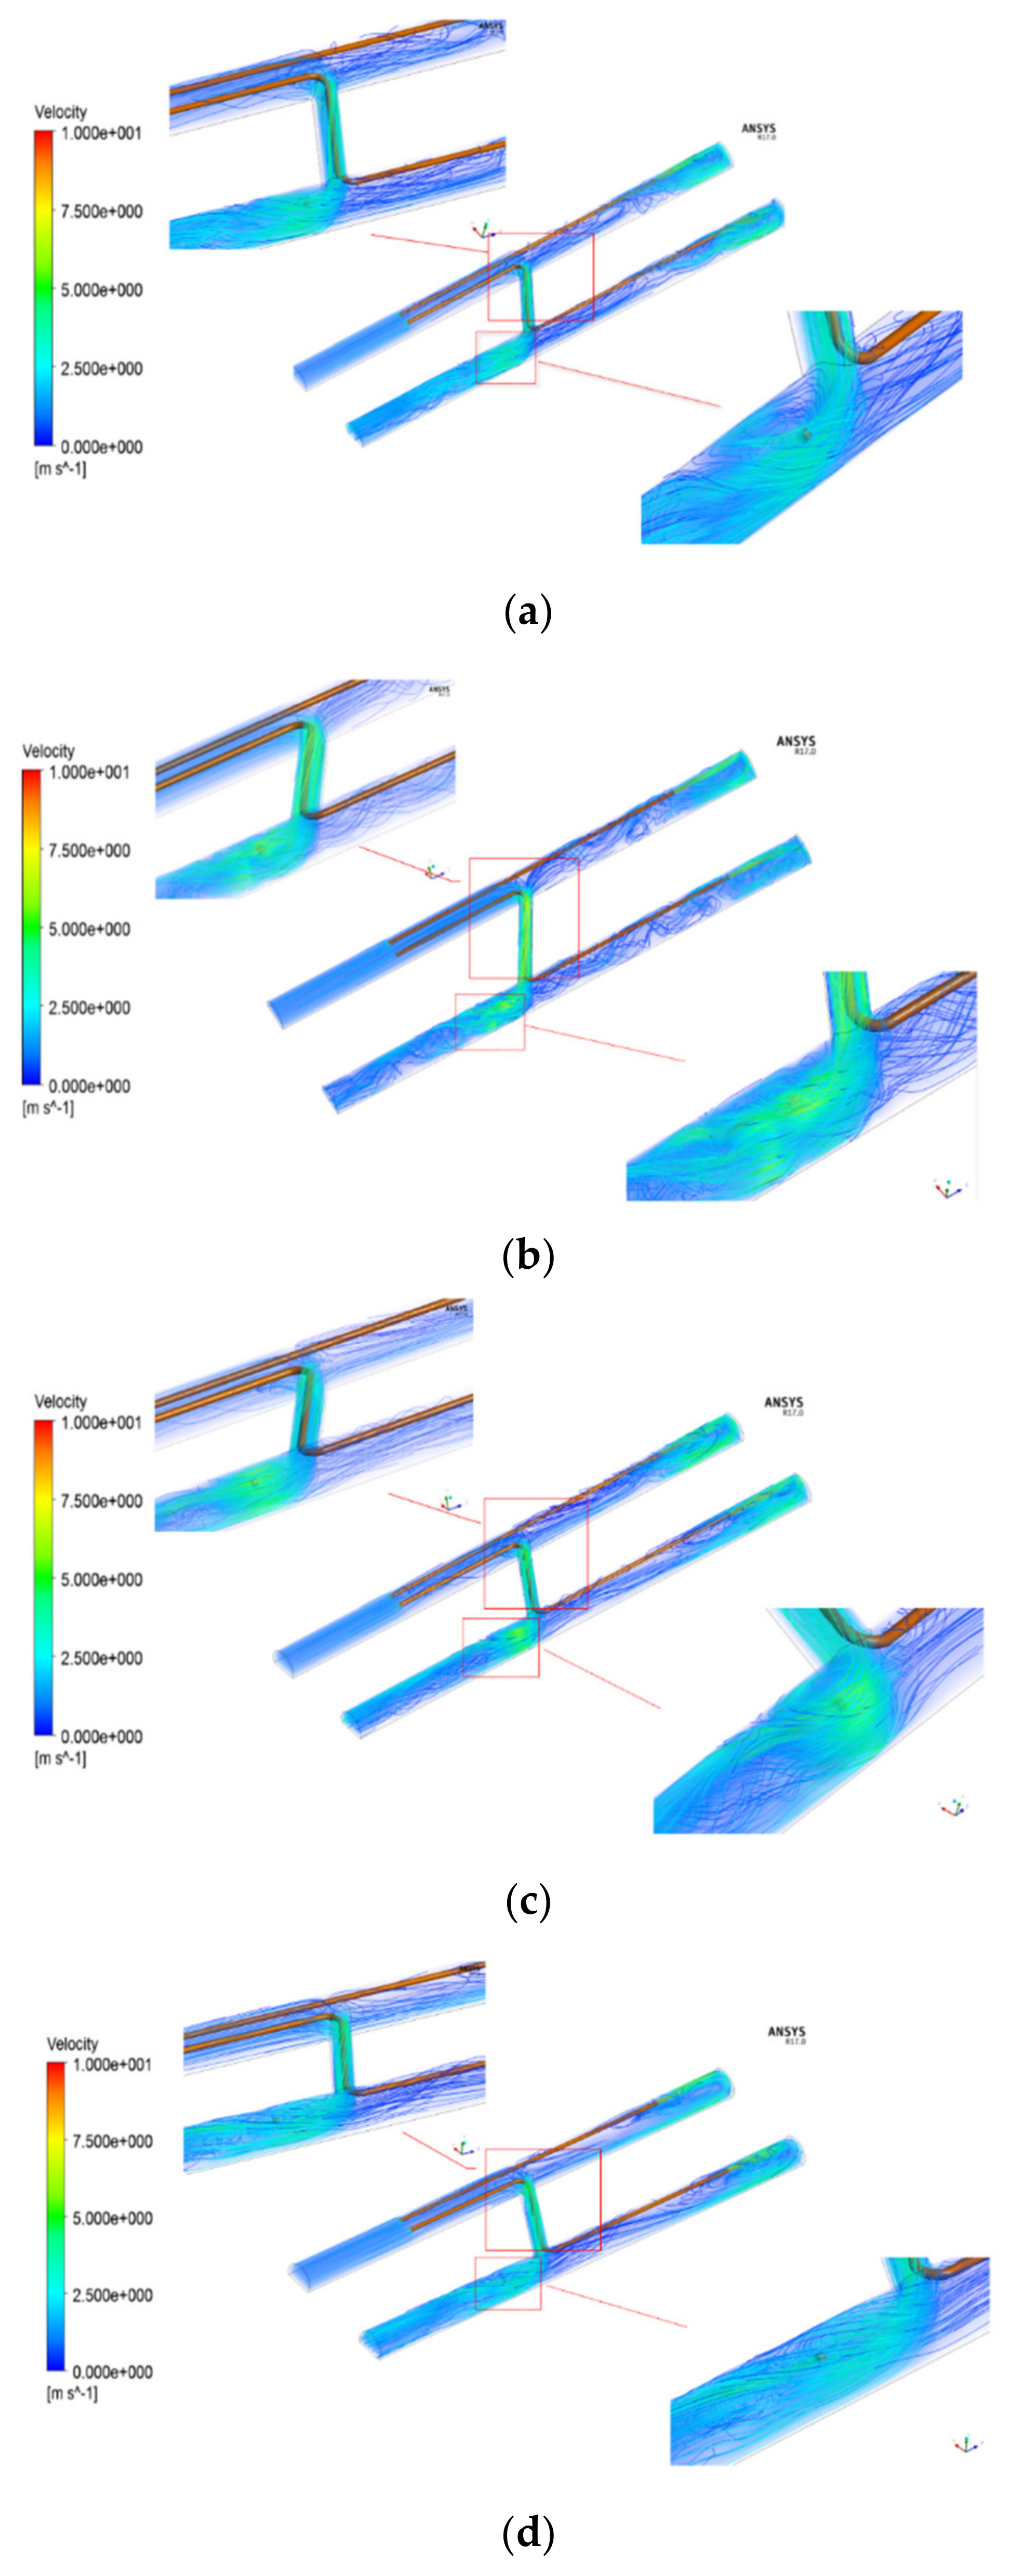
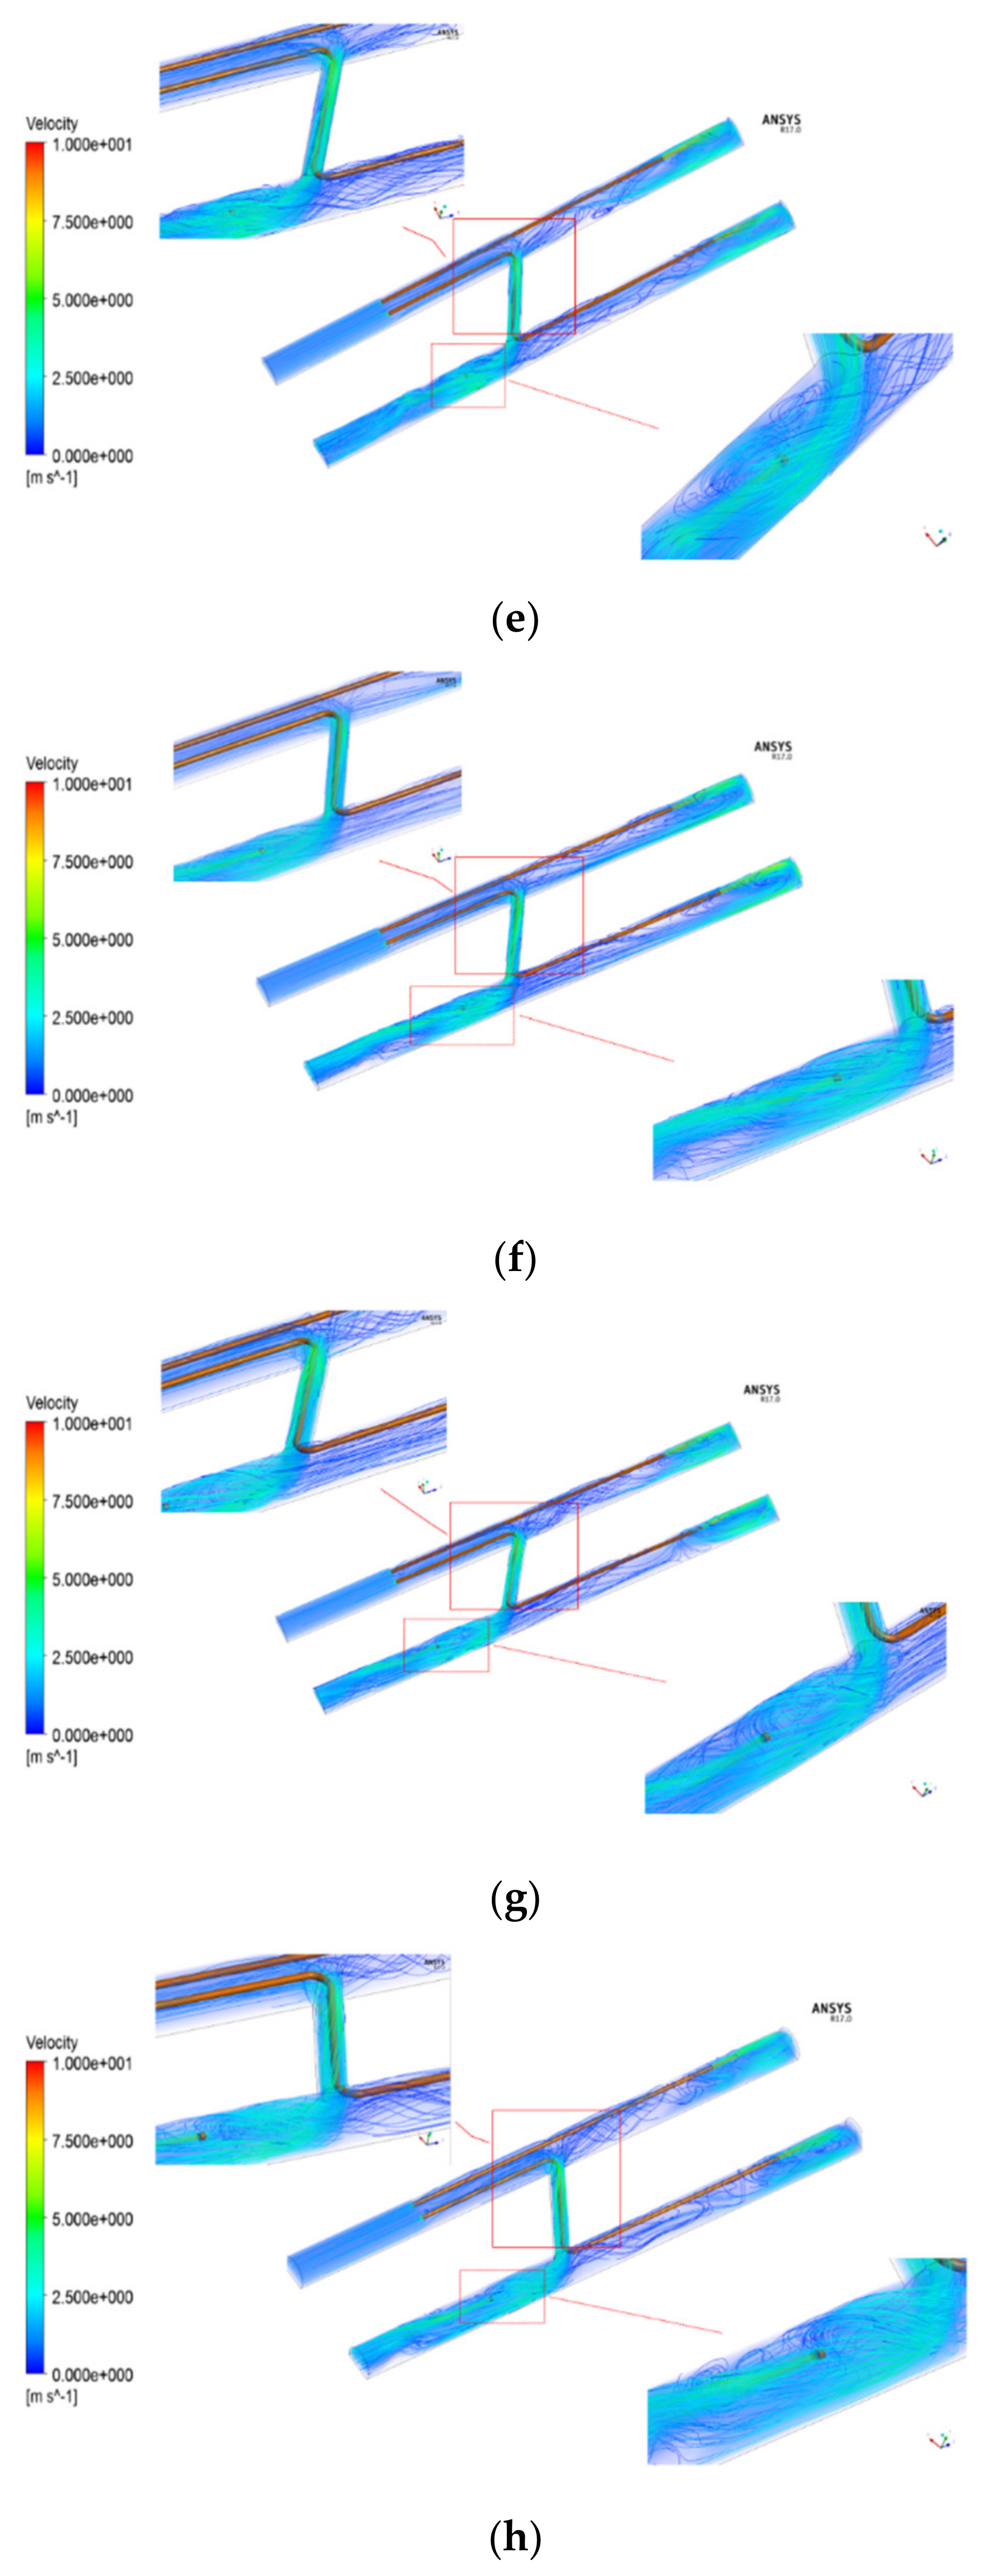
The specific parameters are shown in Table 3. We chose a horizontal plane with a height of 5 m for observation. The degree distribution is shown in Figure 9. The general flow direction of the air flow in the tunnel is as follows: fresh air is transported by the jet fan from the inlet of the air flow-in tunnel to the front of the cross-aisle, enters the axial flow fan and is transported to the tunnel face through the air duct, and the contaminated air generated by the air flow-in tunnel passes through the cross-aisle. The passage reaches the flow-out tunnel, merges with the contaminated air generated at the tunnel face of the outlet tunnel, and then passes through the air flow-out tunnel and is discharged by the draft fan and the jet fan.
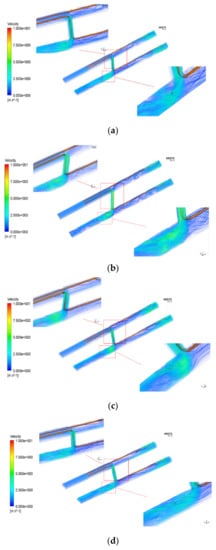
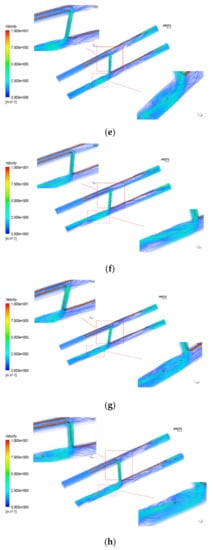
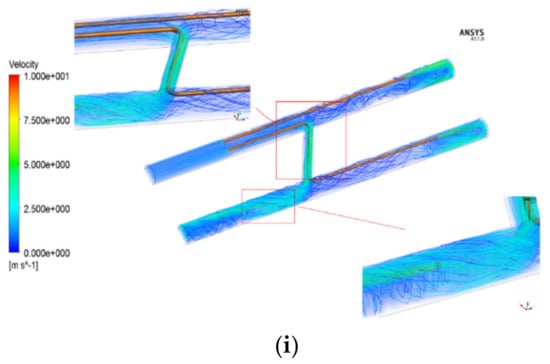
Figure 9.
Numerical simulation of airflow migration for different draft fan positions. (a) Case 1: C1; (b) Case 2: C2; (c) Case 3: C3; (d) Case 4: C4; (e) Case 5: C5; (f) Case 6: C6; (g) Case 7: C7; (h) Case 8: C8; (i) Case 9: C9.
It can be observed from the flow field diagram near the cross-aisle that installing the ventilator in front of the cross-aisle can effectively improve the airflow form and change the flow direction of high-speed airflow. As a result, the pollution wind at the tunnel face can gather more effectively in the main air flow of the tunnel, and the eddy current problem caused by the high-speed wind flow behind the cross-aisle has also been solved, effectively avoiding the accumulation of pollution gas. Figure 9 shows the flow field diagram when the draft fan is arranged 10 m away from the cross-aisle. It can be observed from the calculation results that although the draft fan eliminates the influence of the wind wall and makes the waste wind at the tunnel face converge into the main air flow of the tunnel, there is a reflux area opposite to the main air flow in the tunnel in front of the cross-aisle, that is, between the cross-aisle and the induced draft fan, which forms a vortex area that may cause the concentration of pollutants and affect the ventilation and sewage discharge of the tunnel effect. Comparing the results in Figure 9, we can find that when the draft fan is located far away from the cross-aisle, the eddy current between the cross passage and the induced draft fan can be eliminated. Therefore, the main reason for the formation of the vortex is the location of the induced draft fan and the distance between the fan and the cross-aisle, and increasing the distance between the fan and the cross-aisle can effectively solve the vortex problem in front of the cross-aisle. However, the farther the draft fan is from the cross-aisle, the more energy the fan needs to eliminate the wind wall. Therefore, the location and model of the draft fan should be reasonably selected on the basis of considering the ventilation effect and energy saving aspect.
According to the wind speed distribution of the tunnel face in Figure 1, Figure 2, Figure 3, Figure 4, Figure 5, Figure 6, Figure 7, Figure 8 and Figure 9, the safety factors of tunnel construction under nine working conditions can be obtained, as shown in Table 4.
Table 4.
Safety factor of 9 working conditions.
It can be observed that the safety factor of the nine working conditions was distributed in the range of 0.74~0.88; each working condition was within the safe range. The safety factor of the working condition C6 was the highest. It is recommended to adopt this scheme in tunnel construction.
3.3. Research on the Position of Draft Fan
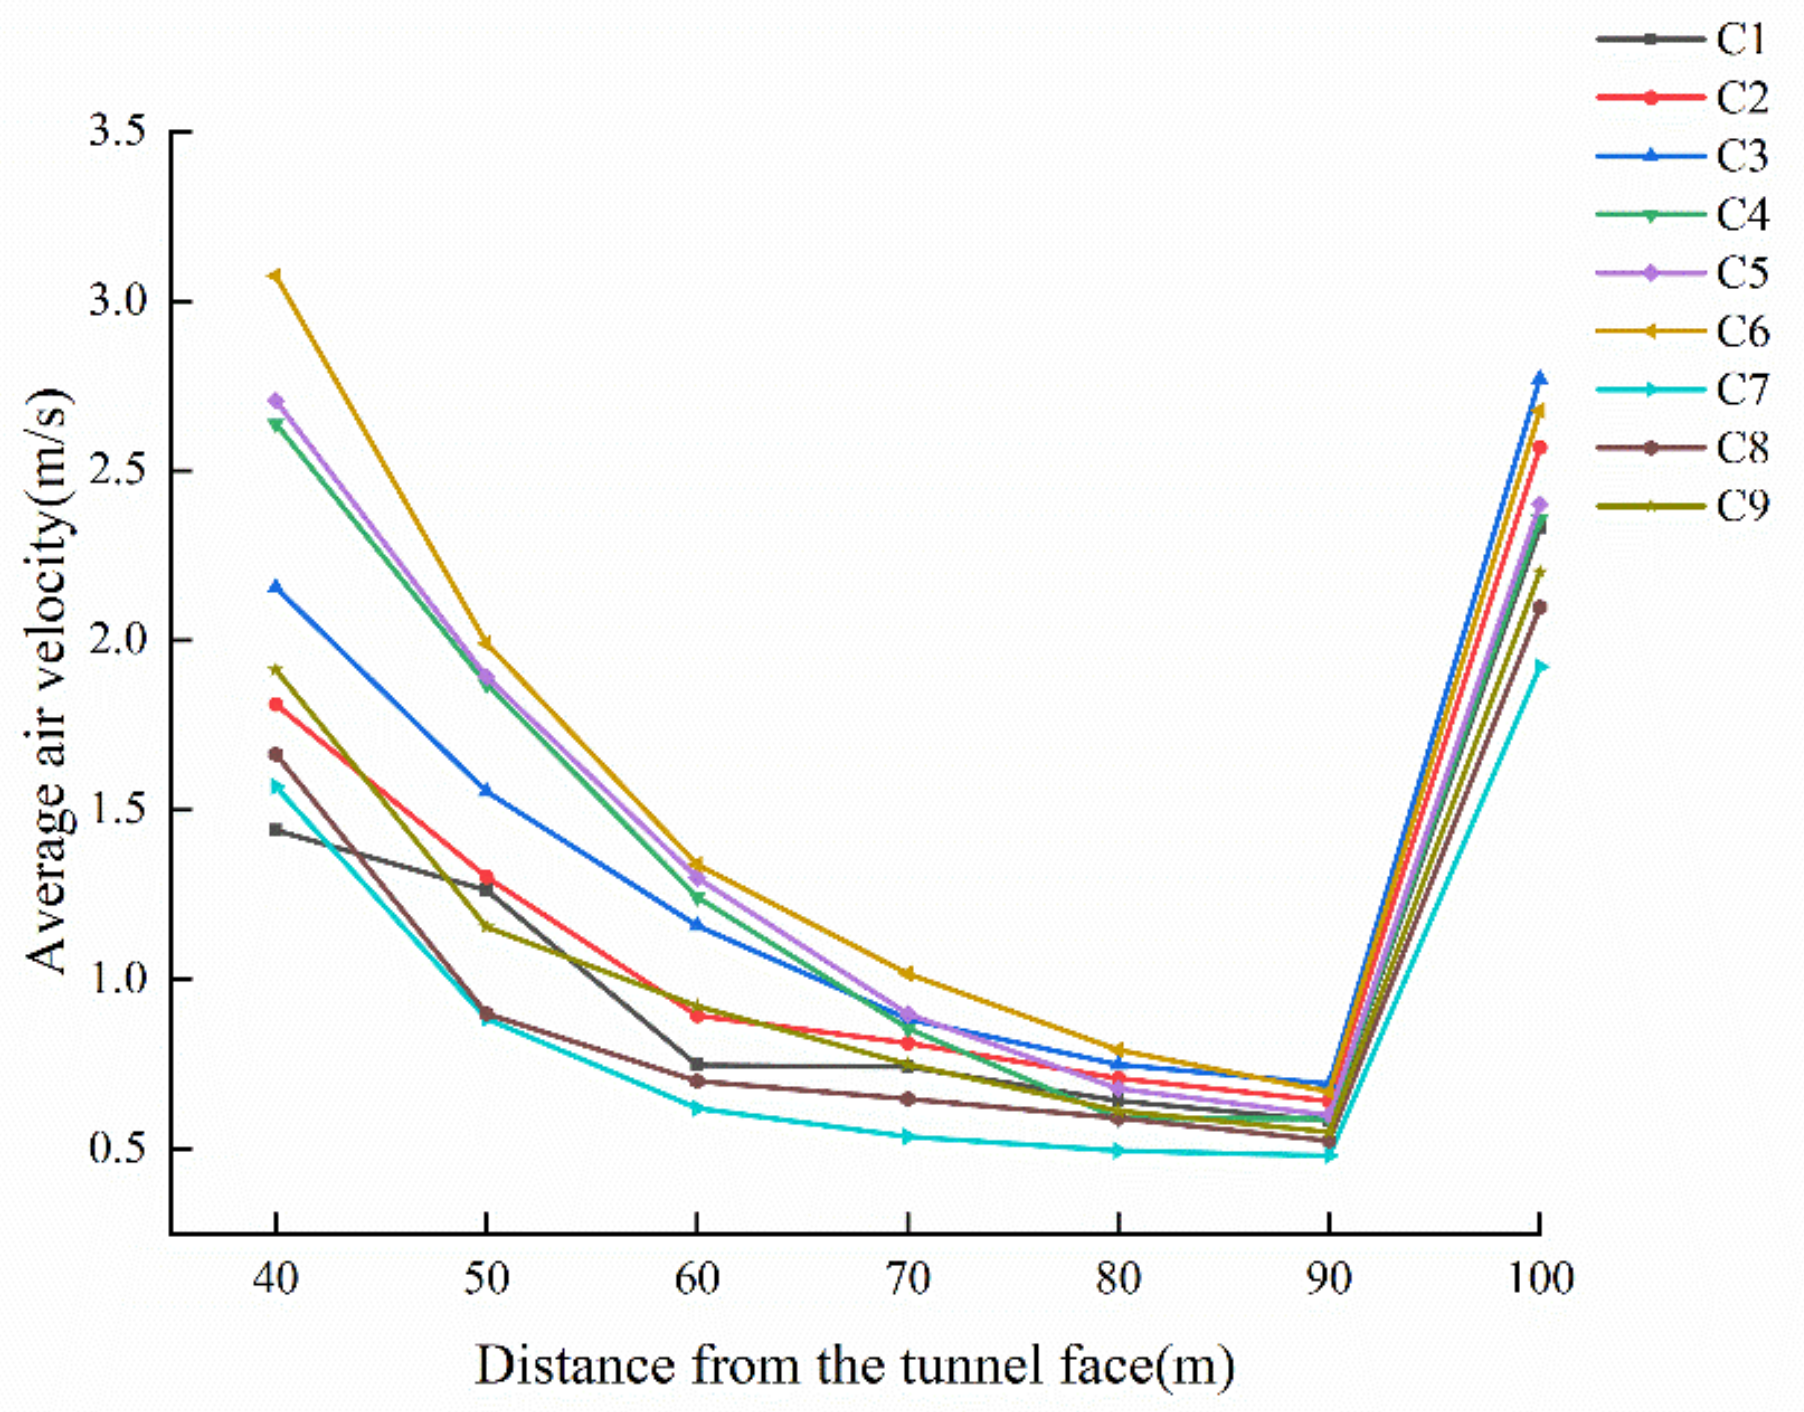
A section was taken every 10 m from the tunnel face 40 m to the cross-aisle, that is, a total of six sections in the tunnel were used to study the distribution of wind speed. The calculation results are shown in Figure 10. It can be observed from the figure that the flow rate of the air flow on the face of the tunnel gradually decreases when it flows out, and when it approaches the cross-aisle and merges into the main air flow of the tunnel, the speed suddenly increases. By comparing the air flow speeds under various working conditions, it can be found that when a 200 pa fan is used at a distance of 30 m from the cross-aisle, there are some areas in the tunnel where the air velocity is lower than 0.5 m/s, that is, there is a low wind area. In other working conditions, all cross-sectional wind speeds can reach 0.5 m/s, that is, low wind speed areas can be completely eliminated.
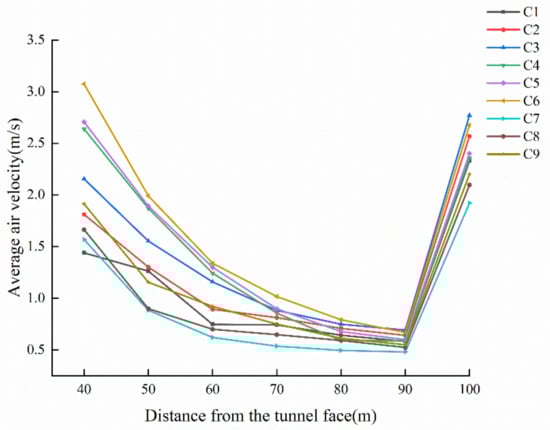
Figure 10.
Distribution curves of air velocities in tunnel tube.
Figure 10 shows the speed distribution of the fan of the same model arranged at different distances from the cross-aisle. The results in the figure show that when the induced draft fan is arranged at a distance of 20 m from the cross-aisle, the air velocity of each section is higher than when it is arranged at a distance of 10 m from the cross-aisle. Studies have shown that when the induced draft fan is close to the exit of the cross-aisle, it is easy to generate a vortex between the induced draft fan and the cross-aisle, which will affect the speed of the air flow out of the tunnel face. In addition, when the distance between the induced draft fan and the cross-aisle is 20 m, it can effectively improve the air flow pattern, so that the fresh air sent outside the tunnel can be fully utilized and waste can be reduced.
4. Optimization of Air Flow Structure in Gallery Ventilation
In the construction process of long and long tunnels, gallery ventilation is used and the whole tunnel is used as the air duct. The air flow section is large and the resistance is small, which can supply a large air volume and greatly reduce the energy consumption of the ventilation system. Through the analysis of the flow field, it can be observed that there is a low wind speed area between the tunnel face and the cross-aisle. The wind speed in this area is 0.5 m/s lower than the minimum allowable wind speed, which is not conducive to the discharge of pollutants in the tunnel. In order to improve the wind speed and reduce the possibility of harmful gas accumulation, it is necessary to optimize the construction ventilation. This problem can be solved by the draft fan in front of the cross passage.
The draft fan can improve the wind speed in the low wind speed area, and it is often used to disperse dust and harmful gas in construction. According to the distribution of wind speed in the tunnel, the drainage fan in front of the cross passage can eliminate the low wind area caused by the wind wall. According to the calculation results, the optimal location of the draft fan is 20 m away from the cross-aisle. However, with the increase in the fan air volume, the energy consumption and investment increase correspondingly. The economical aspects and energy consumption still need to be considered in site construction. It is necessary to select and adjust the factors of wind speed properly, instead of simply using a higher wind speed. Therefore, it is suggested that the layout of the fans to be used in the field is as follows: 20 m away from the cross-aisle and the fan power is 300 pa. Therefore, the best ventilation effect can be obtained.
5. Discussion
5.1. Site Ventilation Test
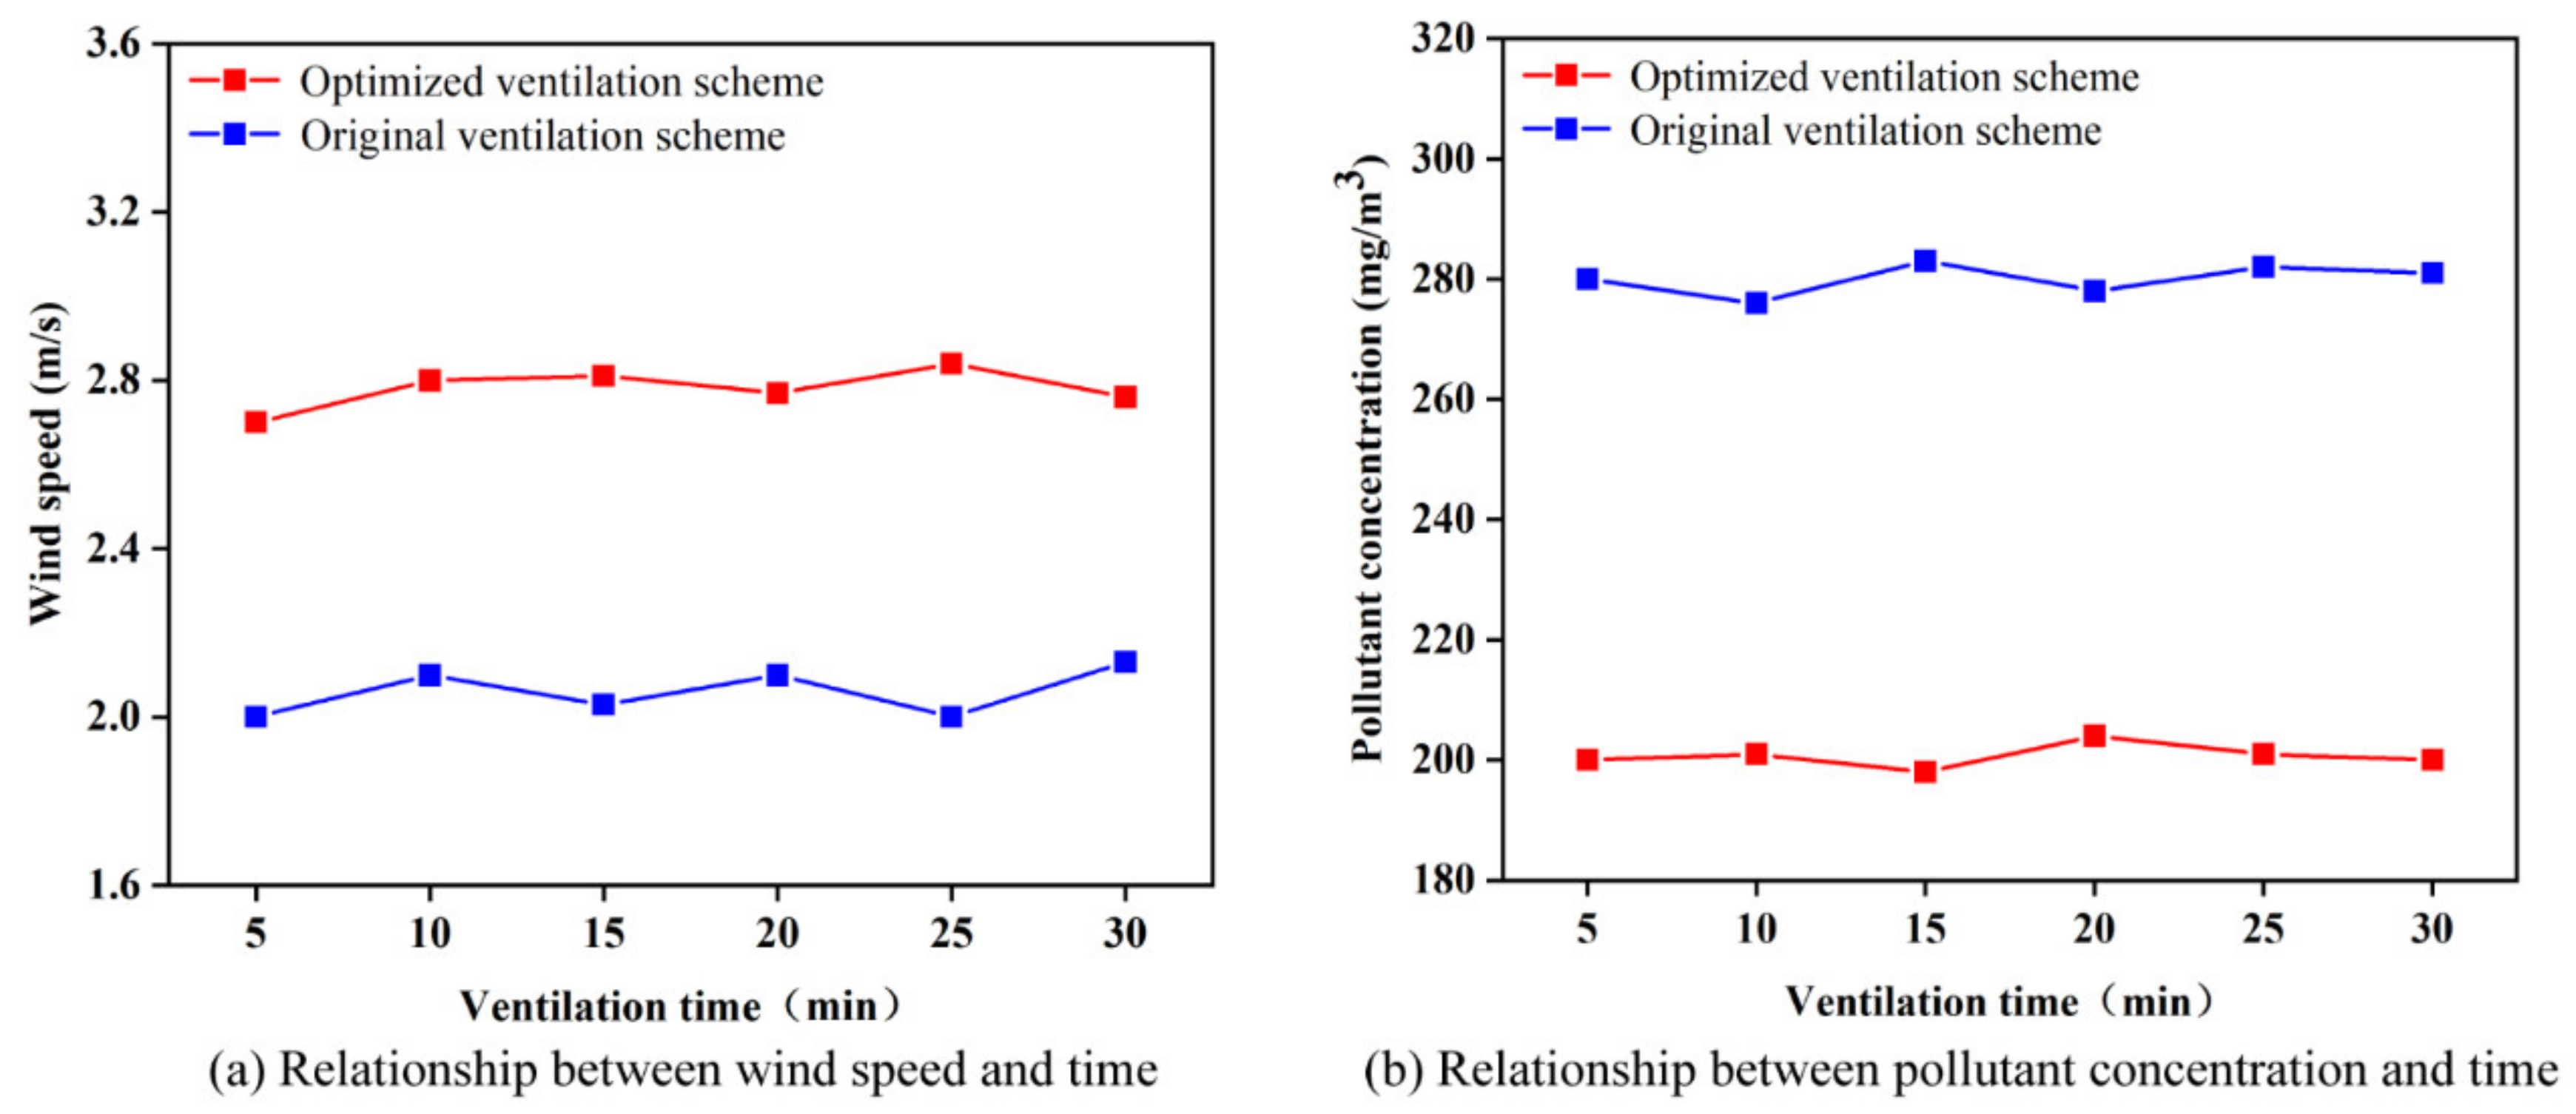
According to the optimization results of tunnel gallery ventilation in long tunnels, the optimized ventilation scheme (20 m away from the cross-aisle and the fan power is 300 pa) was applied to the Xinglong tunnel in Honghe Prefecture, Yunnan Province. The wind speed and pollutant concentration monitoring data of the tunnel face before and after optimization are shown in Figure 11.
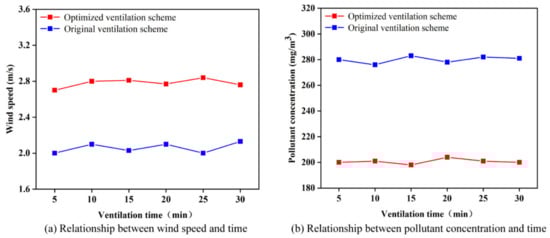
Figure 11.
Wind speed and pollutant concentration of tunnel face before and after optimization.
It can be observed that the original ventilation scheme of the Xinglong tunnel included pressure ventilation. The average wind speed of the tunnel face was 2.1 m/s, and the pollutant concentration of the tunnel face was 280 mg/m3. After the tunnel gallery ventilation system was adopted, the average wind speed of the tunnel face was 2.8 m/s, and the pollutant concentration of the tunnel face was 200 mg/m3. It can be concluded that the ventilation effect of the optimized ventilation scheme was significant, which increased the wind speed of the tunnel face and reduced the concentration of pollutants.
5.2. Enlightenment and Limitation of Current Research Work
In this study, gallery ventilation systems in the construction of long tunnels were studied. The influence of the location and type of the draft fan on the elimination of air flow structure was studied, and the ventilation scheme of the tunnel was optimized. Three types of jet fans with different parameter combinations, 200 pa, 300 pa, and 400 pa, were considered and installed at a distance of 50 m from the air flow-out tunnel. However, the influencing factors of construction ventilation of long tunnels include fan position, air volume, air duct size, tunnel section, geological environment, etc. In future studies, more factors that influence the construction ventilation of long tunnels should be considered. In addition, the physical model of gallery ventilation systems needs to be established to verify the effectiveness of numerical simulation.
6. Conclusions
In this study, some technical issues of using recirculation systems for the construction of long twin tunnels were discussed. The CFD model was used to establish two-dimensional and three-dimensional numerical models to study the flow behavior of fluids in recirculation systems and to optimize the flow field in the tunnels using fans. The main conclusions from the results of this work are summarized as follows.
- (1)
- In the tunnel recirculation systems of long twin tunnels, the main air flow of tunnel recirculation systems can be formed by using jet fans arranged at the air flow-in tunnel. The main air flow direction is from the air flow-in tunnel, as the air enters the air flow-out tunnel after passing through the cross-aisle, and is discharged from the air flow-out tunnel is formed. By reasonably selecting the model parameters of the fan, it can be ensured that the speed of the main circulating air flow in the tunnel reaches the minimum wind speed of 0.5 m/s, as required by the specification.
- (2)
- The cross-aisle is where the air flow meets, and the flow field is more complicated. In addition, because the cross-sectional area of the cross-aisle is smaller than the area of the main tunnel, the average air velocity of air flow will increase significantly after the air flow passes through the cross-aisle, resulting in a high-speed wind wall at the exit of the transverse tunnel. Furthermore, there is a whirlpool area at the intersection with the air flow-out tunnel.
- (3)
- Elimination of the obstruction of the wind wall to the air flow out of the tunnel face can be solved by adding a draft fan in front of the cross-aisle. After a draft fan is installed in front of the cross-aisle, it can effectively improve the air flow pattern and change the flow direction of the high-speed air flow. Therefore, the contaminated air at the tunnel face can better converge into the main wind flow of the tunnel and the vortex problem caused by the high-speed air flow behind the cross-aisle is solved, effectively avoiding the accumulation of polluted gas.
- (4)
- When the induced draft fan is close to the exit of the cross-aisle, it is easy to generate a vortex between the induced draft fan and the cross-aisle, which will affect the speed of the air flow out of the tunnel face. Studies have shown that when the distance between the induced draft fan and the cross-aisle is 20 m, it can effectively improve the air flow pattern, so that the wind speed in the tunnel can reach about 1.5 m/s, which can meet the requirements of ventilation and dust prevention and reduce harmful gas accumulation.
Author Contributions
P.Z.: writing—original draft preparation; S.Y.: formal analysis; Z.A.: reviewing and editing; C.Z. and R.L.: reviewing and editing; S.D. and X.O.: Supervision. All authors have read and agreed to the published version of the manuscript.
Funding
This work was financially supported by the National Natural Science Foundation of China (No. 52074048).
Institutional Review Board Statement
Not applicable.
Informed Consent Statement
Not applicable.
Data Availability Statement
The data used to support the findings of this study are included within the article.
Conflicts of Interest
The authors declare no conflict of interest.
References
- Liu, R.; He, Y.; Zhao, Y.; Jiang, X.; Ren, S. Tunnel construction ventilation frequency-control based on radial basis function neural network. Autom. Constr. 2020, 118, 103293. [Google Scholar] [CrossRef]
- Liu, R.; Ren, S.; Fan, J.Y.; Wu, F.; William, N.T. The air flow structure and gas dispersion behavior in gas tunnel construction through bench cut method. Therm. Sci. 2019, 23, 1417–1424. [Google Scholar] [CrossRef]
- Ye, F.; Qin, N.; Liang, X.; Ouyang, A.; Qin, Z.; Su, E. Analyses of the defects in highway tunnels in China. Tunn. Undergr. Space Technol. 2021, 107, 103658. [Google Scholar] [CrossRef]
- Chen, Q.; Zhang, H.; Zhu, Y.; Chen, S.; Ran, G. Study on distributions of airflow velocity and convective heat transfer coefficient characterizing duct ventilation in a construction tunnel. Build. Environ. 2020, 118, 107464. [Google Scholar] [CrossRef]
- Xu, T.; Zhao, D.; Tao, H.; Lei, P. Extended CFD models for numerical simulation of tunnel fire under natural ventilation: Comparative analysis and experimental verification. Case Stud. Therm. Eng. 2022, 31, 101815. [Google Scholar] [CrossRef]
- Yin, S.; Nie, W.; Guo, L.; Liu, Q.; Hua, Y.; Cai, X.; Cheng, L.; Yang, B.; Zhou, W. CFD simulations of air curtain dust removal effect by ventilation parameters during tunneling. Adv. Powder Technol. 2020, 31, 2456–2468. [Google Scholar] [CrossRef]
- Li, S.; Liu, X.; Wang, J.; Fang, G.; Chen, W.; Deng, S. Reduced Scale Experimental Study and CFD Analysis on the Resistance Characteristic of Utility Tunnel’s Ventilation System. Energy Procedia 2019, 158, 2756–2761. [Google Scholar] [CrossRef]
- Nakayama, S.; Uchino, K.; Inoue, M. Analysis of Ventilation Air Flow at Heading Face by Computational Fluid Dynamics. Shigen Sozai 2011, 21, 55–64. [Google Scholar]
- Parra, M.T.; Villafruela, J.M.; Castro, F.; Mendez, C. Numerical and experimental analysis of different ventilation systems in deep mines. Build. Environ. 2006, 41, 87–93. [Google Scholar] [CrossRef]
- Wang, X.L.; Zhang, Z.Q.; Zhou, Z.Y.; Chen, H.C. Numerical simulation of TBM construction ventilation in a long diversion tunnel. Tunn. Undergr. Space Technol. 2011, 26, 560–572. [Google Scholar] [CrossRef]
- Xiu, Z.H.; Nie, W.; Yan, J.Y.; Chen, D.W. Numerical simulation study on dust pollution characteristics and optimal dust control air flow rates during coal mine production. J. Clean. Prod. 2020, 248, 119197. [Google Scholar] [CrossRef]
- Zhou, Y.; Yang, Y.; Mao, Z.L.; Bu, R.W.; Gong, J.H.; Wang, Y.X.; Yi, L. Analytical and numerical study on natural ventilation performance in single- and gable-slope city tunnels. Sustain. Cities Soc. 2019, 45, 258–270. [Google Scholar] [CrossRef]
- Shokofe, R.; Majid, A.; Hasan, M. Investigating impact of gas emission uncertainty on airflow distribution in an auxiliary ventilation system using CFD and Monte-Carlo simulation. Build. Environ. 2021, 204, 108165. [Google Scholar]
- Zhang, H.; Sun, J.; Lin, F.; Wang, L. Optimization on energy saving ventilation of gallery-type combined construction shaft exhaust in extra long tunnel. Procedia Eng. 2017, 205, 1777–1784. [Google Scholar] [CrossRef]
- Fang, Y.; Fan, J.; Kenneally, B. Air flow behavior and gas dispersion in the recirculation ventilation system of a twin-tunnel construction. Tunn. Undergr. Space Technol. 2016, 58, 30–39. [Google Scholar] [CrossRef]
- Özakin, A.N.; Kaya, F. Effect on the exergy of the PVT system of fins added to an air-cooled channel: A study on temperature and air velocity with ANSYS Fluent. Sol. Energy 2019, 184, 561–569. [Google Scholar] [CrossRef]
- Hao, Z.; Gorlé, C. Quantifying turbulence model uncertainty in Reynolds-averaged Navier–Stokes simulations of a pin-fin array. Comput. Fluids 2022, 209, 104641. [Google Scholar] [CrossRef]
- Shen, Y.M.; Ng, C.O.; Zheng, Y.H. Simulation of wave propagation over a submerged bar using the VOF method with a two-equation k–ε turbulence modeling. Ocean Eng. 2004, 31, 87–95. [Google Scholar] [CrossRef]
- Malikov, Z. Mathematical model of turbulence based on the dynamics of two fluids. Appl. Math. Model. 2020, 82, 409–436. [Google Scholar] [CrossRef]
- JTG-2005; Technical Specifications for Construction of Highway Tunnel. CCCC First Highway Group Co., Ltd.: Beijing, China, 2005.


Publisher’s Note: MDPI stays neutral with regard to jurisdictional claims in published maps and institutional affiliations. |
© 2022 by the authors. Licensee MDPI, Basel, Switzerland. This article is an open access article distributed under the terms and conditions of the Creative Commons Attribution (CC BY) license (https://creativecommons.org/licenses/by/4.0/).