Article

Evaluation of Terrestrial Water Storage Changes over China Based on GRACE Solutions and Water Balance Method

1
Beijing Water Science and Technology Institute, Beijing 100048, China
2
Engineering Research Center of Groundwater Pollution Control and Remediation of Ministry of Education of China, College of Water Sciences, Beijing Normal University, Beijing 100875, China
3
State Key Laboratory of Resources and Environment Information System, Institute of Geographic Sciences and Natural Resources Research, Chinese Academy of Sciences, Beijing 100101, China
4
Center for Satellite Application on Ecology and Environment, Ministry of Ecology and Environment (MEE), Beijing 100094, China
5
Hebei Institute of Water Science, Shijiazhuang 050051, China
6
Key Laboratory of Regional Sustainable Development Modeling, Institute of Geographic Sciences and Natural Resources Research, Chinese Academy of Sciences, Beijing 100101, China
*
Author to whom correspondence should be addressed.
Sustainability 2022, 14(18), 11658; https://doi.org/10.3390/su141811658
Submission received: 19 July 2022 / Revised: 9 September 2022 / Accepted: 13 September 2022 / Published: 16 September 2022
(This article belongs to the Special Issue Sustainable Assessment and Management of Groundwater Resources)

Abstract

:
Accurate estimation of terrestrial water storage anomalies (TWSA) is crucial for the sustainable management of water resources and human living. In this study, long-term TWSA estimates are reconstructed by integration of multiple meteorological products and the water balance (WB) method at 0.5° × 0.5° resolution, generating a total of 12 combinations of different meteorological data. This scheme is applied to 10 river basins (RBs) within China and validated against GRACE observations and GLDAS simulations from 2003 to 2020. Results indicate that similar seasonal characteristics can be observed between different precipitation and evapotranspiration products with the average correlation coefficient and Nash–Sutcliffe efficiency coefficient metrics larger than 0.96 and 0.90, respectively. Three GRACE solutions indicate similar seasonal variations and long-term trends of TWSA over 10 RBs, with the correlation above 0.90. Similar performance can also be observed concerning the root mean square error and mean absolute error metrics. Nevertheless, WB-based TWSA estimates represent larger discrepancies compared to GRACE observations and GLDAS simulations. Specifically, the variation amplitude and long-term trend of WB-based results are much larger than that of the GRACE observations, which is mainly caused by the inaccuracy of remote sensing products and the neglect of anthropogenic activities. Comparable TWSA estimates independently computed from the WB method can only be achieved in 4 out of 10 RBs. This study can provide insightful suggestions for an enhanced understanding of TWSA estimates and improving the performance of the water balance method.

1. Introduction

As a critical component of the global hydrological cycle, terrestrial water storage (TWS) changes play an important role in the Earth’s climate system that controls water, energy, and biogeochemical fluxes [1,2]. Terrestrial water storage anomalies (TWSA) reflect an integrated variations of different water storage components vertically, including snow water equivalent storage, surface water reservoir storage, soil moisture storage, and groundwater storage. Referring to previous studies [3], the groundwater component is the dominant component of the corresponding TWSA, and the dynamical patterns of TWSA are closely related to that of the groundwater storage. Therefore, understanding the spatiotemporal characteristics of TWSA estimates is crucial for the sustainable management of groundwater resources and human living.
Despite the importance of understanding reliable TWSA estimates, knowledge of its spatiotemporal characteristics is generally deficient due to the disparity of in situ monitoring networks, particularly on a large scale [4]. For the past few decades, the quantification of TWSA estimates has been mainly accessible from hydrological modeling. It is noteworthy that hydrological models can be divided into global land surface models (LSMs) and global hydrological and water resource models (GHWRMs), respectively [5]. The major difference between the two kinds of models is that the groundwater component and human activities are only considered in GHWRAMs, e.g., the PCR-GLOBWB model [6] and WGHM model [7]. Particularly, the Global Land Data Assimilation System (GLDAS) can provide various reasonable estimates of land surface states and fluxes over long periods. Hence, it has become the most widely used hydrological product owing to these above-mentioned advantages, extensively used for some research associated with TWSA estimates [8], runoff [9], and precipitation [10]. However, large amounts of ground-based observations are required for the development and calibration of hydrological models. Unfortunately, the establishment and maintenance of groundwater wells are time- and money-consuming processes, and the spatial distribution of stations is usually uneven [11,12].
Similarly, TWS changes represent the variations of accumulated precipitation, actual evapotranspiration (ET), and runoff within a specific duration based on the water balance (WB) theory within a watershed. Thus, the WB method provides an alternative measure to reconstruct and downscale TWSA estimates. Specifically, Yin et al. [13] reconstructed the monthly, seasonal, and interannual TWS variations during the period from 1980 to 2015 based on the water balance method over the Beishan area. Results revealed that WB-based TWS variations revealed a similar downtrend relative to GRACE observations with a slope of −0.94 mm/year. Nie et al. [14] reconstructed monthly and annual TWSA series during the past 65 years over the Amazon Basin by integrating GRACE data, GLDAS products, and the water balance equation. With regards to the downscaling research, Wang et al. [15] proposed a statistical empirical regression method to downscale GRACE-derived TWSA from 1° to 0.25° based on GRACE solutions and the water balance equation. Yin et al. [16] proposed a statistical downscaling approach to improve the resolution of GRACE estimates from 110 km to 2 km based on the strong relationship between GRACE-based GWSA and ET. Additionally, recent studies improved the understanding of ET estimates by integration of water balance method and GRACE solutions. For example, Pan et al. [17] investigated human-induced ET change based on GRACE-derived TWSA and water budget calculations over the Haihe River Basin. Liu et al. [18] applied the water balance method to estimate the ET for 35 global river basins over the period 1983–2006. Generally speaking, the WB method provides an alternative measure to detect the spatiotemporal characteristics of TWSA estimates over large areas.
The variations of water mass will alter the gravity fields within a region, and the signals can also be detected by the Gravity Recovery and Climate Experiment (GRACE). Launched in March 2002, the GRACE mission provides an unprecedented measure to detect the variations of TWS at the regional to global scales [19,20]. GRACE satellites can overcome the drawbacks of traditional ground-based measurements, generating spatiotemporal continuous global water storage estimates with a higher accuracy relative to physical models and other remote sensing technologies [21,22]. Specifically, monthly gravity field estimates of GRACE showed a geoid height accuracy of 2 to 3 mm at a spatial resolution as small as 400 km [23,24]. Many studies [25,26,27] have highlighted that the changes in water storage can be inferred from GRACE observations with an unprecedented accuracy; thus, they can be utilized as the reference to evaluate the performance of hydrological models. Specifically, Swenson and Wahr [28,29] evaluated the reliability of hydrological model outputs by comparison with GRACE-derived TWSA at the continental scale worldwide. Scanlon et al. [5] assessed the model reliability based on a comprehensive comparison of decadal trends (2002–2014) in land water storage from seven global models to trends from three GRACE satellite solutions in 186 river basins. Wang et al. [30] assessed the performance of different hydrological models in characterizing the decadal trends (2003–2014) in the Haihe RB based on GRACE solutions. Yin et al. [11] investigated the performance of W3-based simulation based on GRACE solutions over 10 river basins (RBs) within China. To the best of our knowledge, few studies [31,32] have been conducted to comprehensively evaluate the performance of WB-based TWSA estimates based on GRACE observations and GLDAS simulations.
The purpose of this study is to reconstruct long-term TWSA estimates by integration of multiple remote sensing products and the WB method over 10 RBs, and the accuracy of WB-based results is validated against GRACE observations and GLDAS outputs. The study is organized into the following sections: (1) assessment of the discrepancies of four precipitation products and three ET products, (2) calculation of TWS variations from three GRACE solutions, and (3) evaluation of WB-based TWSA estimates based on GRACE solutions and GLDAS simulations over 10 RBs concerning the correlation coefficient and long-term trend metrics.

2. Materials and Methods

2.1. Study Area

China is located between 73°33′–135°05′ E longitude and 3°51′–53°33′ N latitude, as shown in Figure 1. Its climate condition is complicated and diverse due to its vast territory and complicated terrain. The spatiotemporal distribution of annual precipitation is significantly uneven, generally decreasing from southeast China to northwest China. Thus, the climate condition can be divided into humid, semi-humid, semi-arid, and arid zones [33]. Meanwhile, the characteristics of precipitation and climate conditions affect the distributions of water storage in different regions and seasons, so drought and flood events frequently occur, particularly in recent years [34]. According to the classification of the watershed system in China, we consider 10 major river basins, including the Songhua River Basin (SRB), Liaohe River Basin (LRB), Haihe River Basin (HRB), Yellow River Basin (YRB), Huaihe River Basin (HHRB), Southeast River Basin (SERB), Yangtze River Basin (YZRB), Pearl River Basin (PRB), Southwest River Basin (SWRB), and Northwest River Basin (NWRB), respectively.

2.2. Datasets

2.2.1. GRACE Solutions

Monthly mascon RL06 solutions are utilized in this study, which are provided by the Center for Space Research (CSR), Jet Propulsion Laboratory (JPL), and Goddard Space Flight Center (GSFC), respectively. The spatial resolution of CSR products is 0.25° × 0.25°, while it is 0.5° × 0.5° for the other two solutions. It should be emphasized that the JPL solutions are required to be corrected by the official scale factors, while extra processing is not necessary for CSR and GSFC products [35,36]. The GRACE mission ended its operation in October 2017 after more than 15 years in orbit, and its successor the GRACE Follow-on (GRACE-FO) mission was launched in May 2018. In this study, the missing months of GRACE/GRACE-FO solutions are interpolated by using the cubic method, while the 12-month gaps maintain between these two missions. These products represent the anomalies of terrestrial water storage relative to the time baseline from January 2004 to December 2009, and the long-term mean is separated to account for the static gravity field.

2.2.2. GLDAS Simulations

The goal of the GLDAS is to ingest satellite- and ground-based observational data products, using advanced land surface modeling and data assimilation techniques, to generate optimal fields of land surface states and fluxes [37,38]. The GLDAS models drive four land surface models (LSMs), namely Noah, Catchment (CLSM), the Community Land Model (CLM), and the Variable Infiltration Capacity (VIC), respectively. It is capable of providing multiple water storage components coving the period from 2000 to the present. It is noteworthy that the temporal resolution of modelled products includes monthly scales and 3 hourly scales, and the monthly products are generated by temporal averaging of the 3 hourly products [39,40]. In this study, the GLDAS Noahv2.1 model is utilized to calculate TWSA estimates, including soil moisture, snow water equivalent, and plant canopy water at a 0.25° resolution. Additionally, the WB components are also provided by the Noahv2.1 model to calculate TWS changes, namely precipitation, ET, and runoff. More details about evaluations/applications of GLDAS products can also be found in the literature [13,14].

2.2.3. Meteorological Data

(1) Precipitation Products
Monthly gridded (0.5° × 0.5°) precipitation data are provided by the China Meteorological Administration (CMA). Based on the precipitation (Precp) data from 2472 rain gauge stations, the thin plate spline interpolation method is applied to generate the gridded products across China [41]. It has been well validated with rain gauge records and reasonable performances are given in previous studies [19,42]. Global Precipitation Measurement (GPM) builds on the notable successes of the Tropical Rainfall Measuring Mission (TRMM), which was a joint mission between the Japanese Aerospace Exploration Agency (JAXA) and NASA activity. The TRMM project was discontinued in April 2015, and it was succeeded by the GPM mission [43]. This product has a spatial resolution of 0.1° × 0.1° and coverage of 60° N−60° S.
(2) GLEAM Products
The Global Land Evaporation Amsterdam Model (GLEAM) is a set of algorithms that separately estimate the different components of land evapotranspiration, as well as surface and root-zone moisture, potential evaporation, and evaporative stress conditions [44]. Two kinds of GLEAM datasets are provided with 10 variables, namely GLEAM v3.6a and GLEAM v3.6b, and the differences only emerge in their forcing and temporal coverage. Specifically, GLEAMv3.6a spans 42 years from 1980 to 2021 at a 0.25° spatial resolution based on satellite and reanalysis data, and the coverage spans 19 years for GLEAM v3.6b from 2003 to 2021 based on satellite data. In this study, the ET products provided by GLEAM v3.6a are employed to calculate TWSA estimates, and detailed information about GLEAM data can refer to the previous study by Miralles et al. [45].
(3) ERA5 Products
The ERA5 reanalysis data belong to the fifth-generation reanalysis data, which use the ensemble four-dimensional variational assimilation method of 10 ensemble members relative to the earlier version products [46]. ERA5 data are employed in this study to supply monthly precipitation and ET products at a 0.25° spatial resolution. To facilitate the calculation and analysis of spatial characteristics of TWSC, this study resamples each product to the same resolution as GRACE in the process of meteorological data processing. The details of these above data are shown in Table 1. It should be noted that the target resolution is 0.5° for this study, so some variables with higher resolution (e.g., GLDAS and GPM) are resampled to 0.5° for consistency.

2.3. Methods for Estimating TWSA

2.3.1. Estimation of TWSA Based on the Water Balance Algorithm

The water balance algorithm can be used to calculate the quantitative transformation relationship between the recharge and discharge of water resources in a certain period (usually one year). According to the water balance theory, the terrestrial water storage changes (TWSC) represent the difference between recharge and discharge over the river basin [47], and TWSA stand for TWS anomalies relative to the January 2004 to December 2008 mean baseline. Normally, the recharge stems from precipitation, and the discharge includes runoff and ET, as shown in Equation (1). Based on the backwards difference method in Equation (2), we can develop the relationship between WB-based TWSC and TWSA estimates [48]. So, TWSA estimates independently computed from the WB method can be obtained based on Equation (3):
TWSC = P R ET
TWSC = TWSA ( t ) TWSA ( t 1 ) Δ t
TWSA ( t ) = TWSC Δ t + TWSA ( t 1 )
where P denotes the monthly-scale precipitation (mm/month); R represents the runoff (mm/month); ET denotes the evapotranspiration (mm/month); and Δ t  represents the time interval, and the time interval is usually one month.

2.3.2. Mann–Kendall Trend Test Algorithm

The Mann–Kendall test was proposed by H.B. Mann and M.G. Kendall and is a nonparametric statistical test [49,50]. This algorithm does not require the data to obey a normal distribution and is not disturbed by a few outliers. It has been widely used to detect trends in hydro-meteorological sequences [51,52].
The null hypothesis H0 assumes that the sample data are random, independent, and with no linear trend. Thus, the statistics of the test can be shown as:
S = i = 1 n 1 j = + 1 n sgn ( x j x i )
where n represents the total number of samples; x i and x j represent the ith and jth values in the sequence (j > i), respectively. The symbolic function sgn ( x j x i ) can be defined as:
sgn ( x j x i ) = { + 1 , i f ( x j x i ) > 0 0 , i f ( x j x i ) = 0 1 , i f ( x j x i ) < 0
If n is greater than 10, the statistic S can be directly tested for bilateral trend; if n is less than 10, the statistic obeys the standard normal distribution. The test statistic can be constructed as:
Z = { S 1 V a r ( S ) , S > 0 0 , S = 0 S + 1 V a r ( S ) , S < 0
where V a r ( S ) represents the variance of S. The value of S is correlated with the presence or absence of replicates in the sample.
V a r ( S ) = { n ( n 1 ) ( 2 n + 5 ) 18 , p = 0 [ n ( n 1 ) ( 2 n + 5 ) p = 1 g t p ( t p 1 ) ( 2 t p + 5 ) ] 18 , p 0
where p represents the number of repetitions; g denotes the number of unique numbers; tp represents the number of repetitions of each repetition. Given a significance level of α, if the Z is greater than | Z 1 α 2 | , the original hypothesis H0 is rejected. It indicates that there is a significant trend in the sequence; meanwhile, this study uses the significance level of α equal to 0.01 and 0.05, respectively. If the | Z | > 1.96 , it indicates that the significance is at the level of 0.05. If the | Z | > 2.576 , it indicates that the significance is at the level of 0.01.

2.3.3. Evaluation Index

Four metrics are employed in this study to assess the performance of WB-based TWSA estimates, including correlation coefficient (CC), Nash–Sutcliffe efficiency coefficient (NSE), root mean square error (RMSE), and mean absolute error (MAE). Specifically, the higher CC and NSE, the better the WB-based results. Correspondingly, the smaller the RMSE and MAE, the closer the WB results are to the reference datasets and the higher the accuracy of the WB method. It should be noted that the CC can only reflect the correlation between two datasets, while the NSE also takes into account the differences of specific values. The MAE and RMSE metrics are used to quantify the discrepancies between simulated and observed values, and the abnormal values can also be detected based on the RMSE [53]. Detailed calculation processes are shown as follows:
C C = i = 1 n ( X i X ¯ ) ( Y i Y ¯ ) i = 1 n ( X i X ¯ ) 2 i = 1 n ( Y i Y ¯ ) 2
N S E = 1 i = 1 n ( Y i X i ) 2 i = 1 n ( X i X ¯ ) 2
R M S E = 1 n i = 1 n ( Y i X i ) 2
M A E = 1 n i = 1 n | Y i X i |
where Y stands for the GRACE observations and GLDAS simulations, and X denotes the WB-based results. Y ¯ and X ¯ represent the mean values of Y and X, respectively, and n is the length of time.

2.3.4. Research Framework

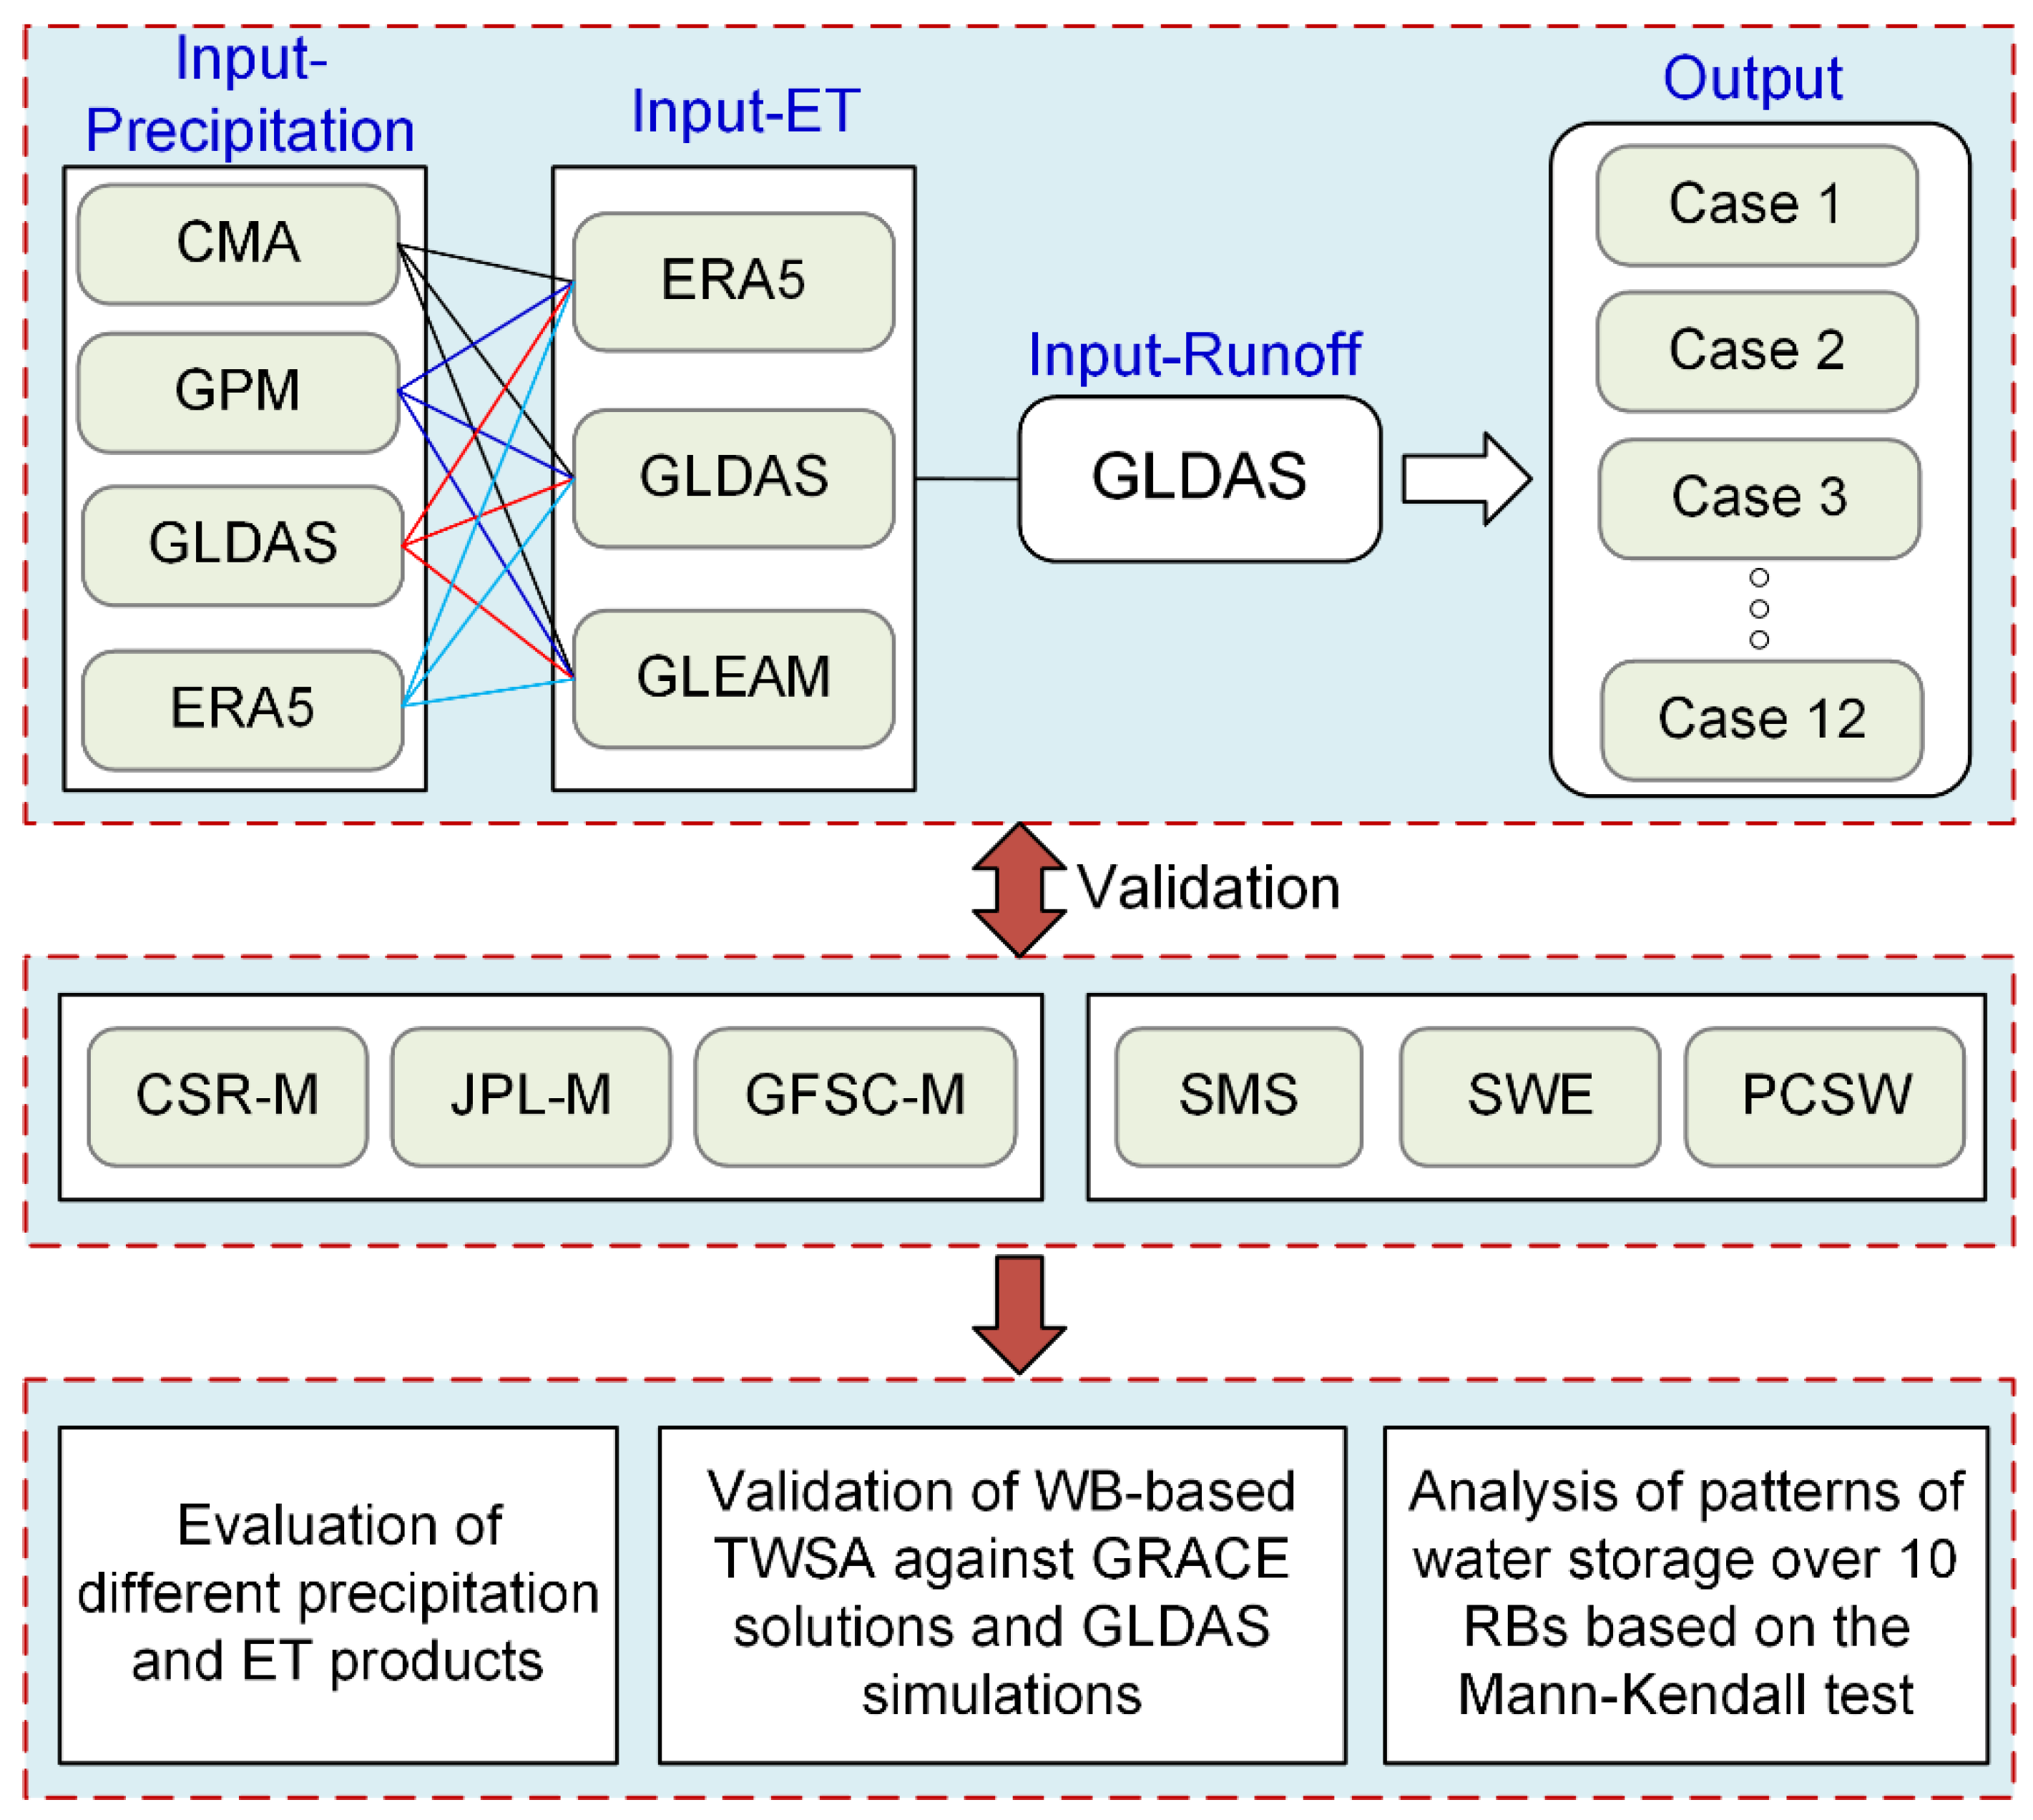
Firstly, four kinds of precipitation products (namely CMA, GPM, GLDAS, and ERA5) and three kinds of ET products (namely GLDAS, ERA5, and GLEAM) are collected to quantify the discrepancies over 10 RBs during the period from 2003 to 2020. These meteorological products are freely combined according to the water balance method; thus, a total of 12 cases can be generated in this study to calculate TWSA estimates, as shown in Table 2.
Secondly, three GRACE mason solutions are used to calculate the TWSA over 10 RBs within China, including CSR, JPL, and GSFC solutions. Similarly, TWSA estimates are also calculated based on GLDAS Noahv2.1 simulation, which are the sum of soil moisture (SMS), snow water equivalent (SWE), and plant canopy surface water (PCSW). Comparisons between different GRACE solutions and GLDAS simulations are comprehensively evaluated from the perspective of four statistical metrics.
Thirdly, the performance of WB-based TWSA is validated against GRACE observations and GLDAS simulations in terms of correlation coefficient and long-term trends. So, the optimal meteorological combinations can be obtained over 10 RBs, thus providing insightful suggestions for understanding the spatiotemporal characteristics of TWSA estimates. The overall flowchart of this study is shown in Figure 2.

3. Results

3.1. Evaluation of Different Meteorological Products

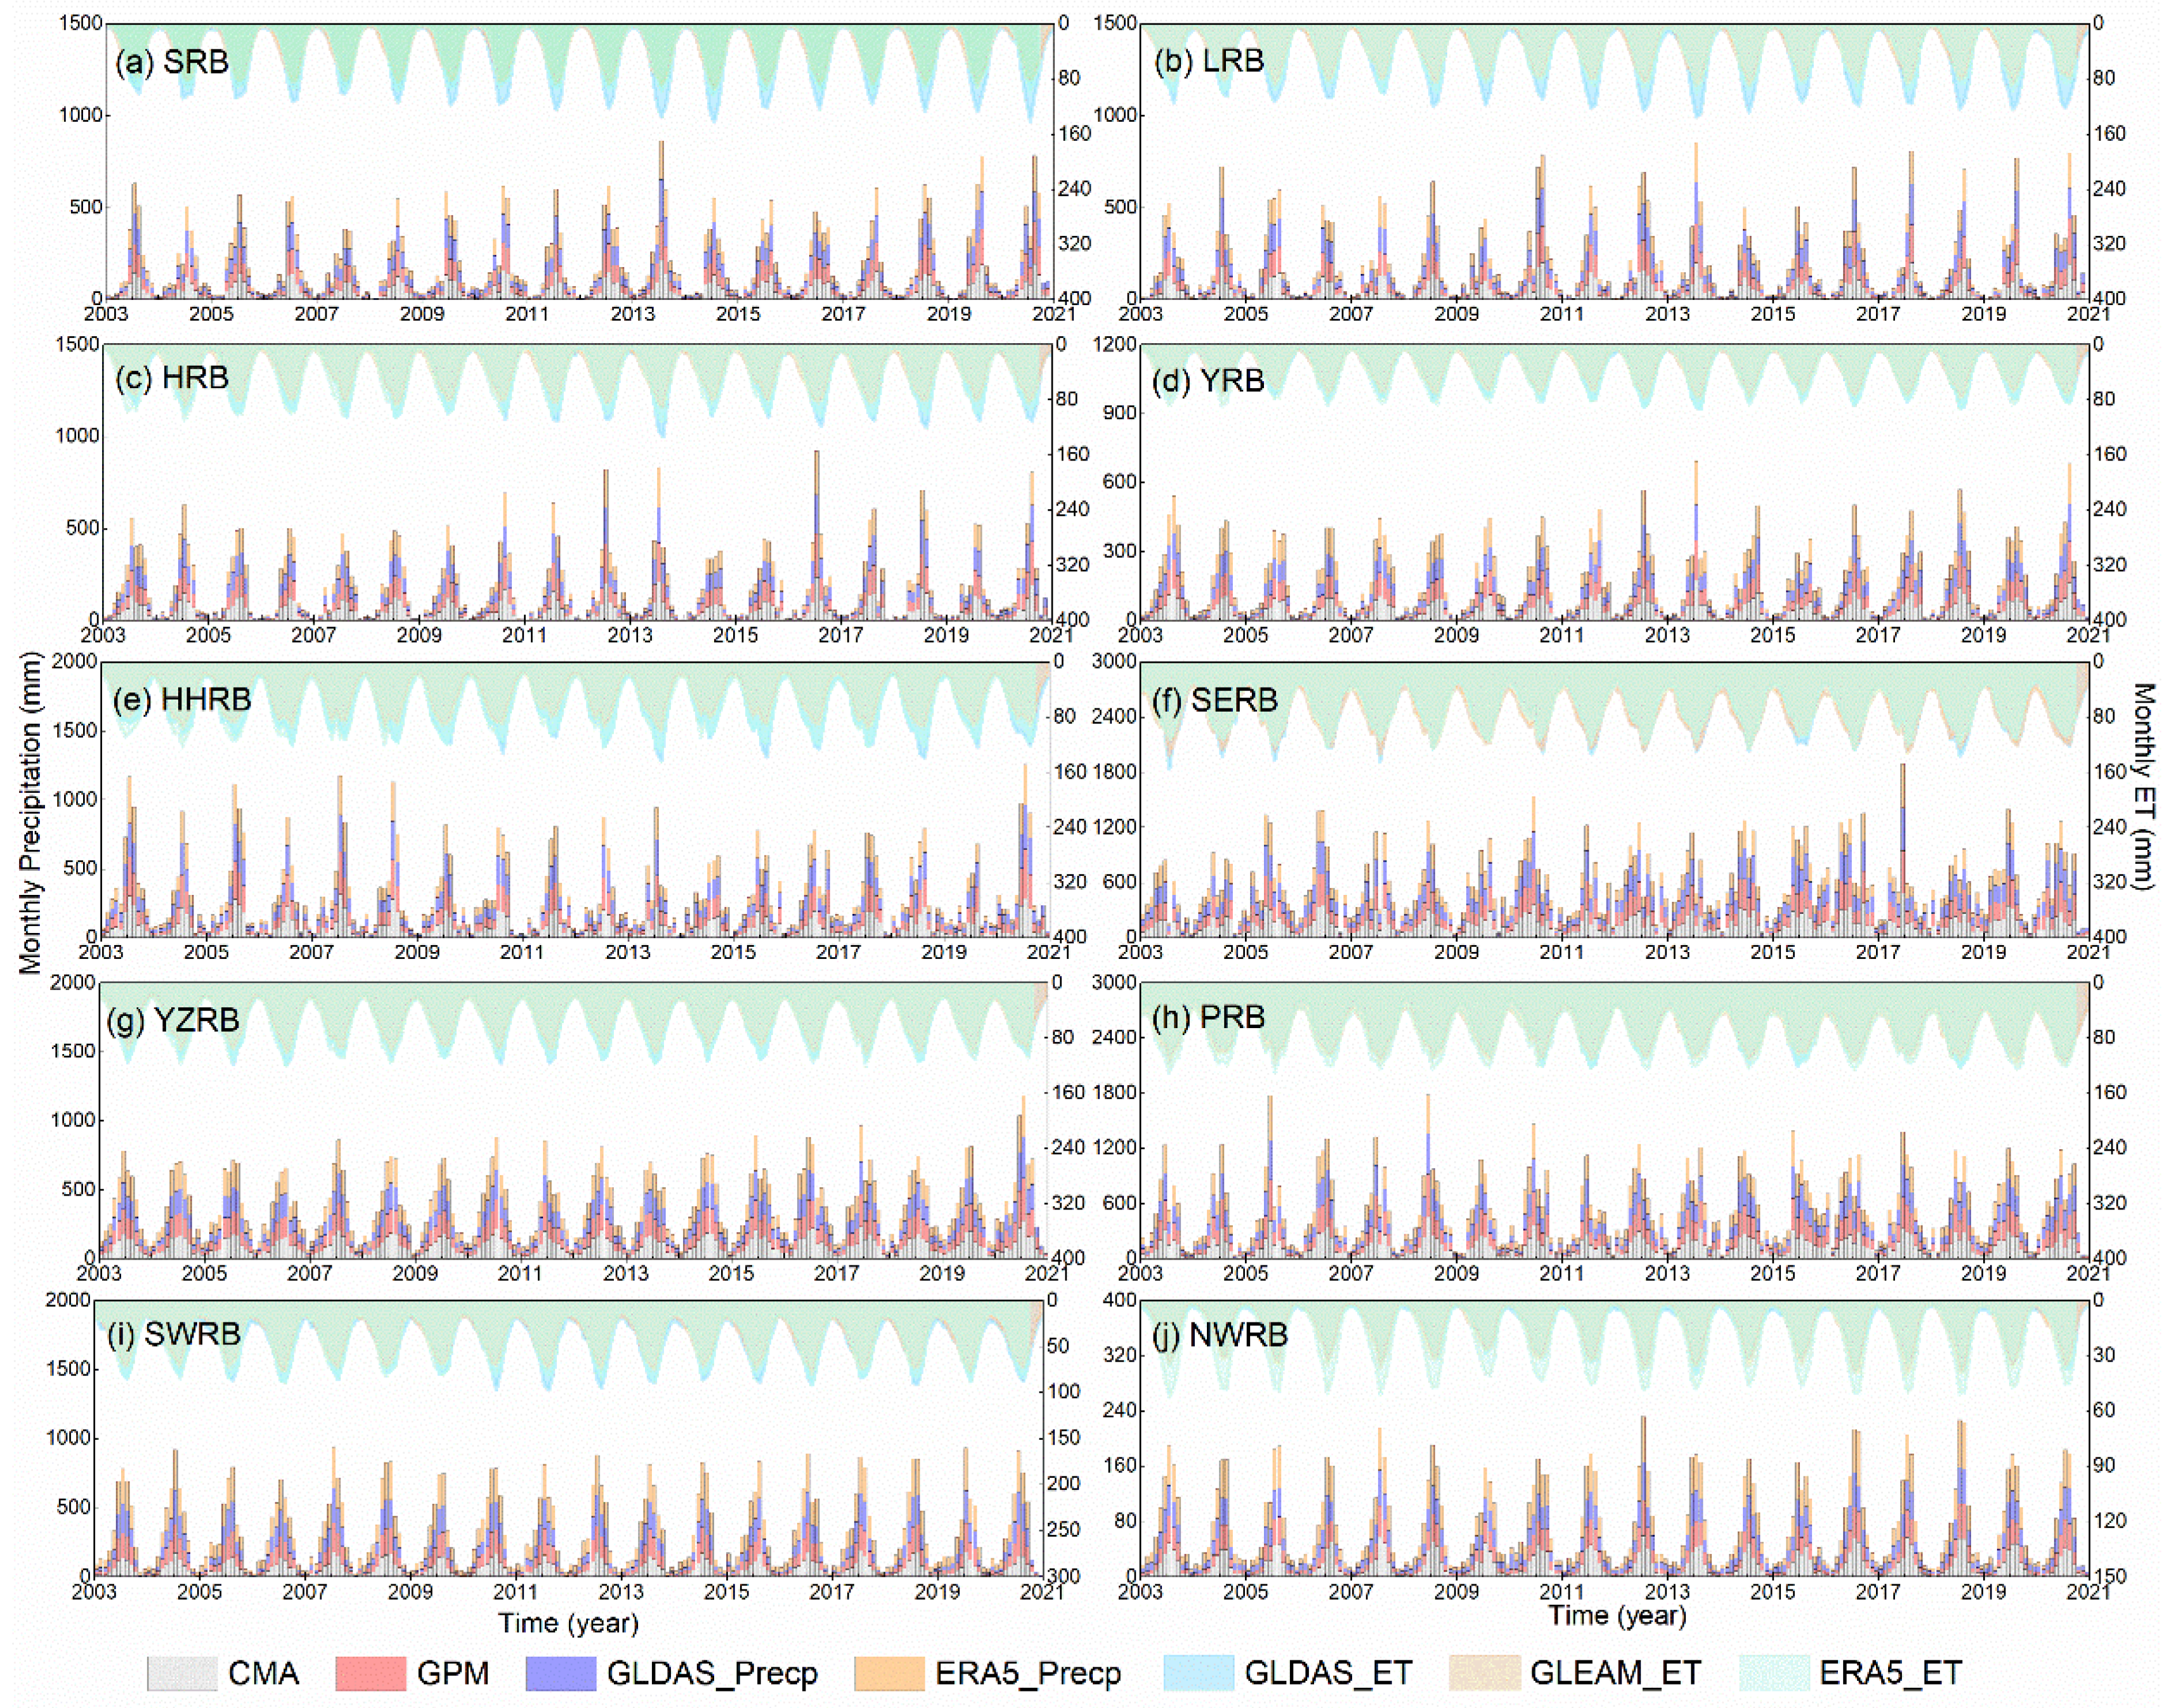
Figure 3 shows the comparisons between four precipitation products (CMA, GPM, GLDAS, and ERA5) and three ET (GLEAM, GLDAS, and ERA5) products over 10 RBs during the period from 2003 to 2020. It can be seen that the seasonal characteristics are basically consistent among four precipitation data. Normally, a larger amplitude emerges between May and August, while the lowest value occurs from November to February of the following year. Similar performance can also be observed with regard to ET products. However, it should be noticeable that it is difficult to accurately monitor ET data; thus, there are inevitably larger uncertainties among different ET products relative to precipitation products. With respect to 10 RBs, the largest precipitation and ET emerge in the SERB with an annual average of 144.42 mm and 73.78 mm, followed by the PRB (134.12 mm and 73.55 mm) and YZRB (97.55 and 58.07 mm). Correspondingly, the NWRB receives the lowest precipitation and ET simultaneously with an annual average of 18.16 mm and 16.80 mm, respectively.
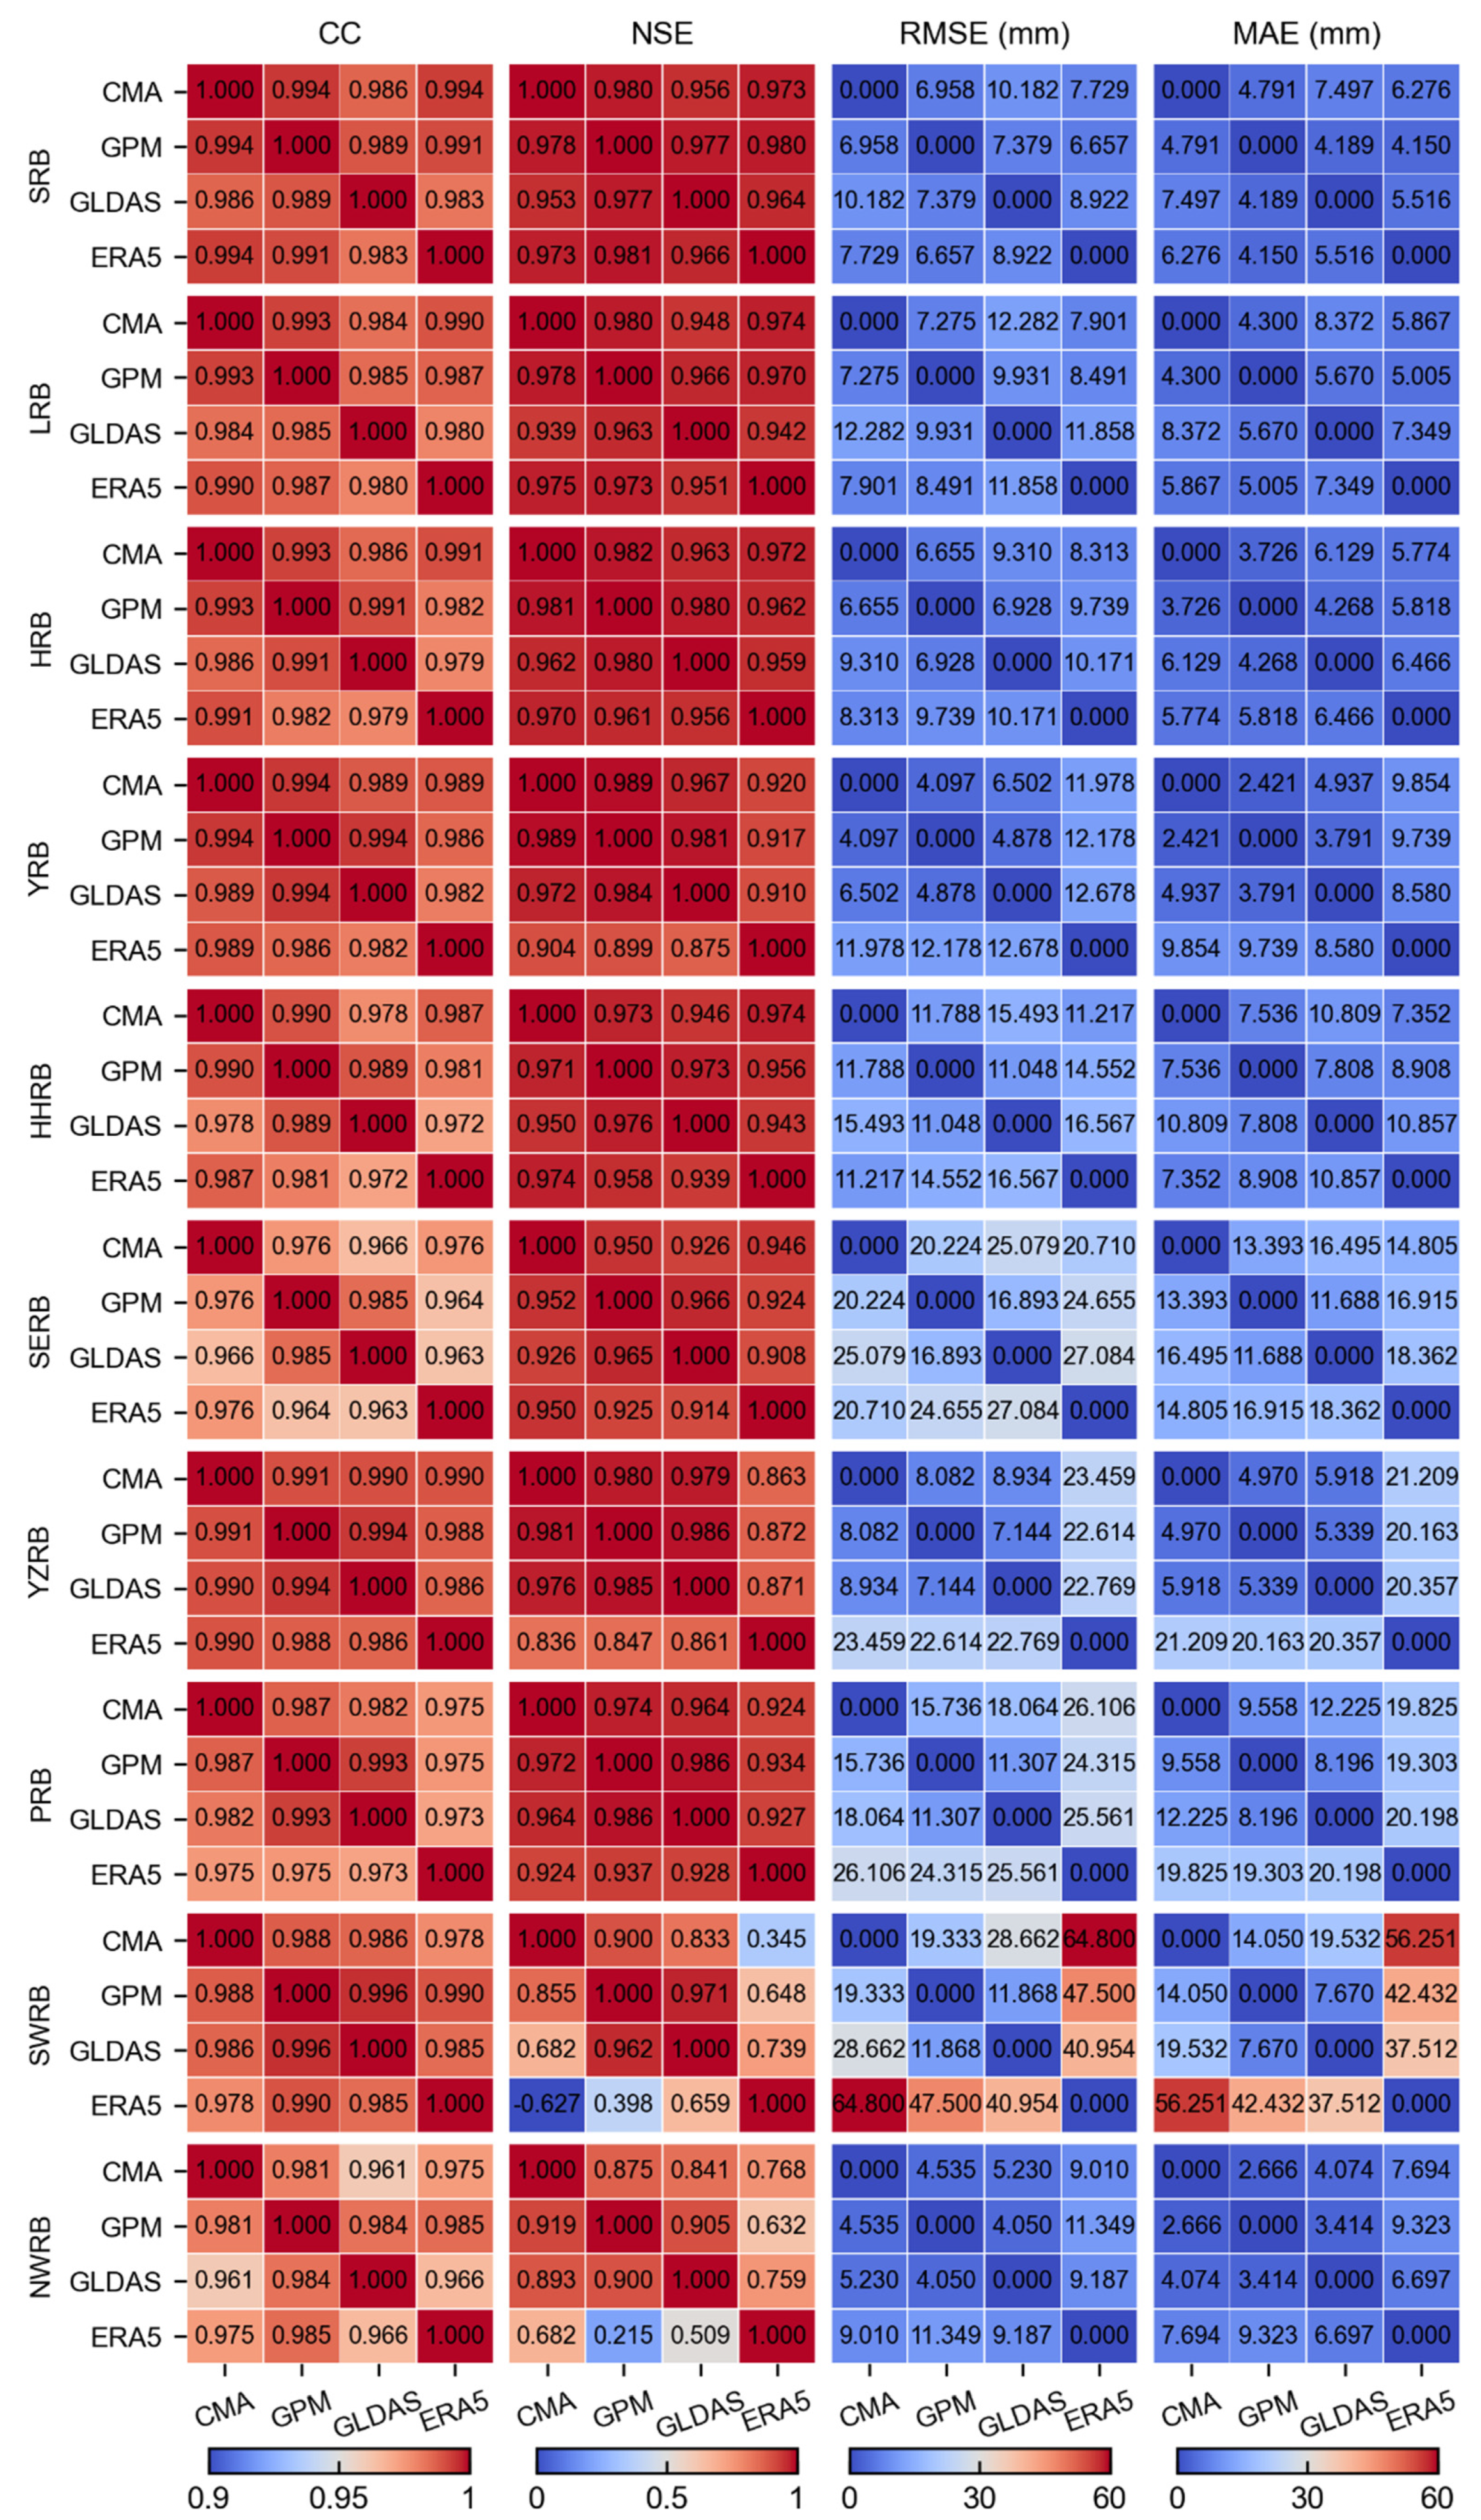
Figure 4 and Figure 5 show the heatmap of the evaluation metrics between different precipitation and ET products over 10 RBs, respectively. It can be seen from Figure 4 that the CCs of 10 RBs are all above 0.96, indicating that four precipitation products are consistent in terms of seasonal variations. Similarly, the NSEs metrics are almost above 0.90 except in the SWRB and NWRB. The smallest NSE index is −0.627 and 0.215 for the SWRB and NWRB, which are mainly caused by the poor performance of ERA5 products. It suggests that there are some discrepancies between ERA5 and the other three precipitation products in the variation amplitude, although better seasonal signals are observed. The largest differences can be found between ERA5 and CMA products in the SWRB with the RMSE and MAE of 64.800 mm and 56.251 mm, respectively.
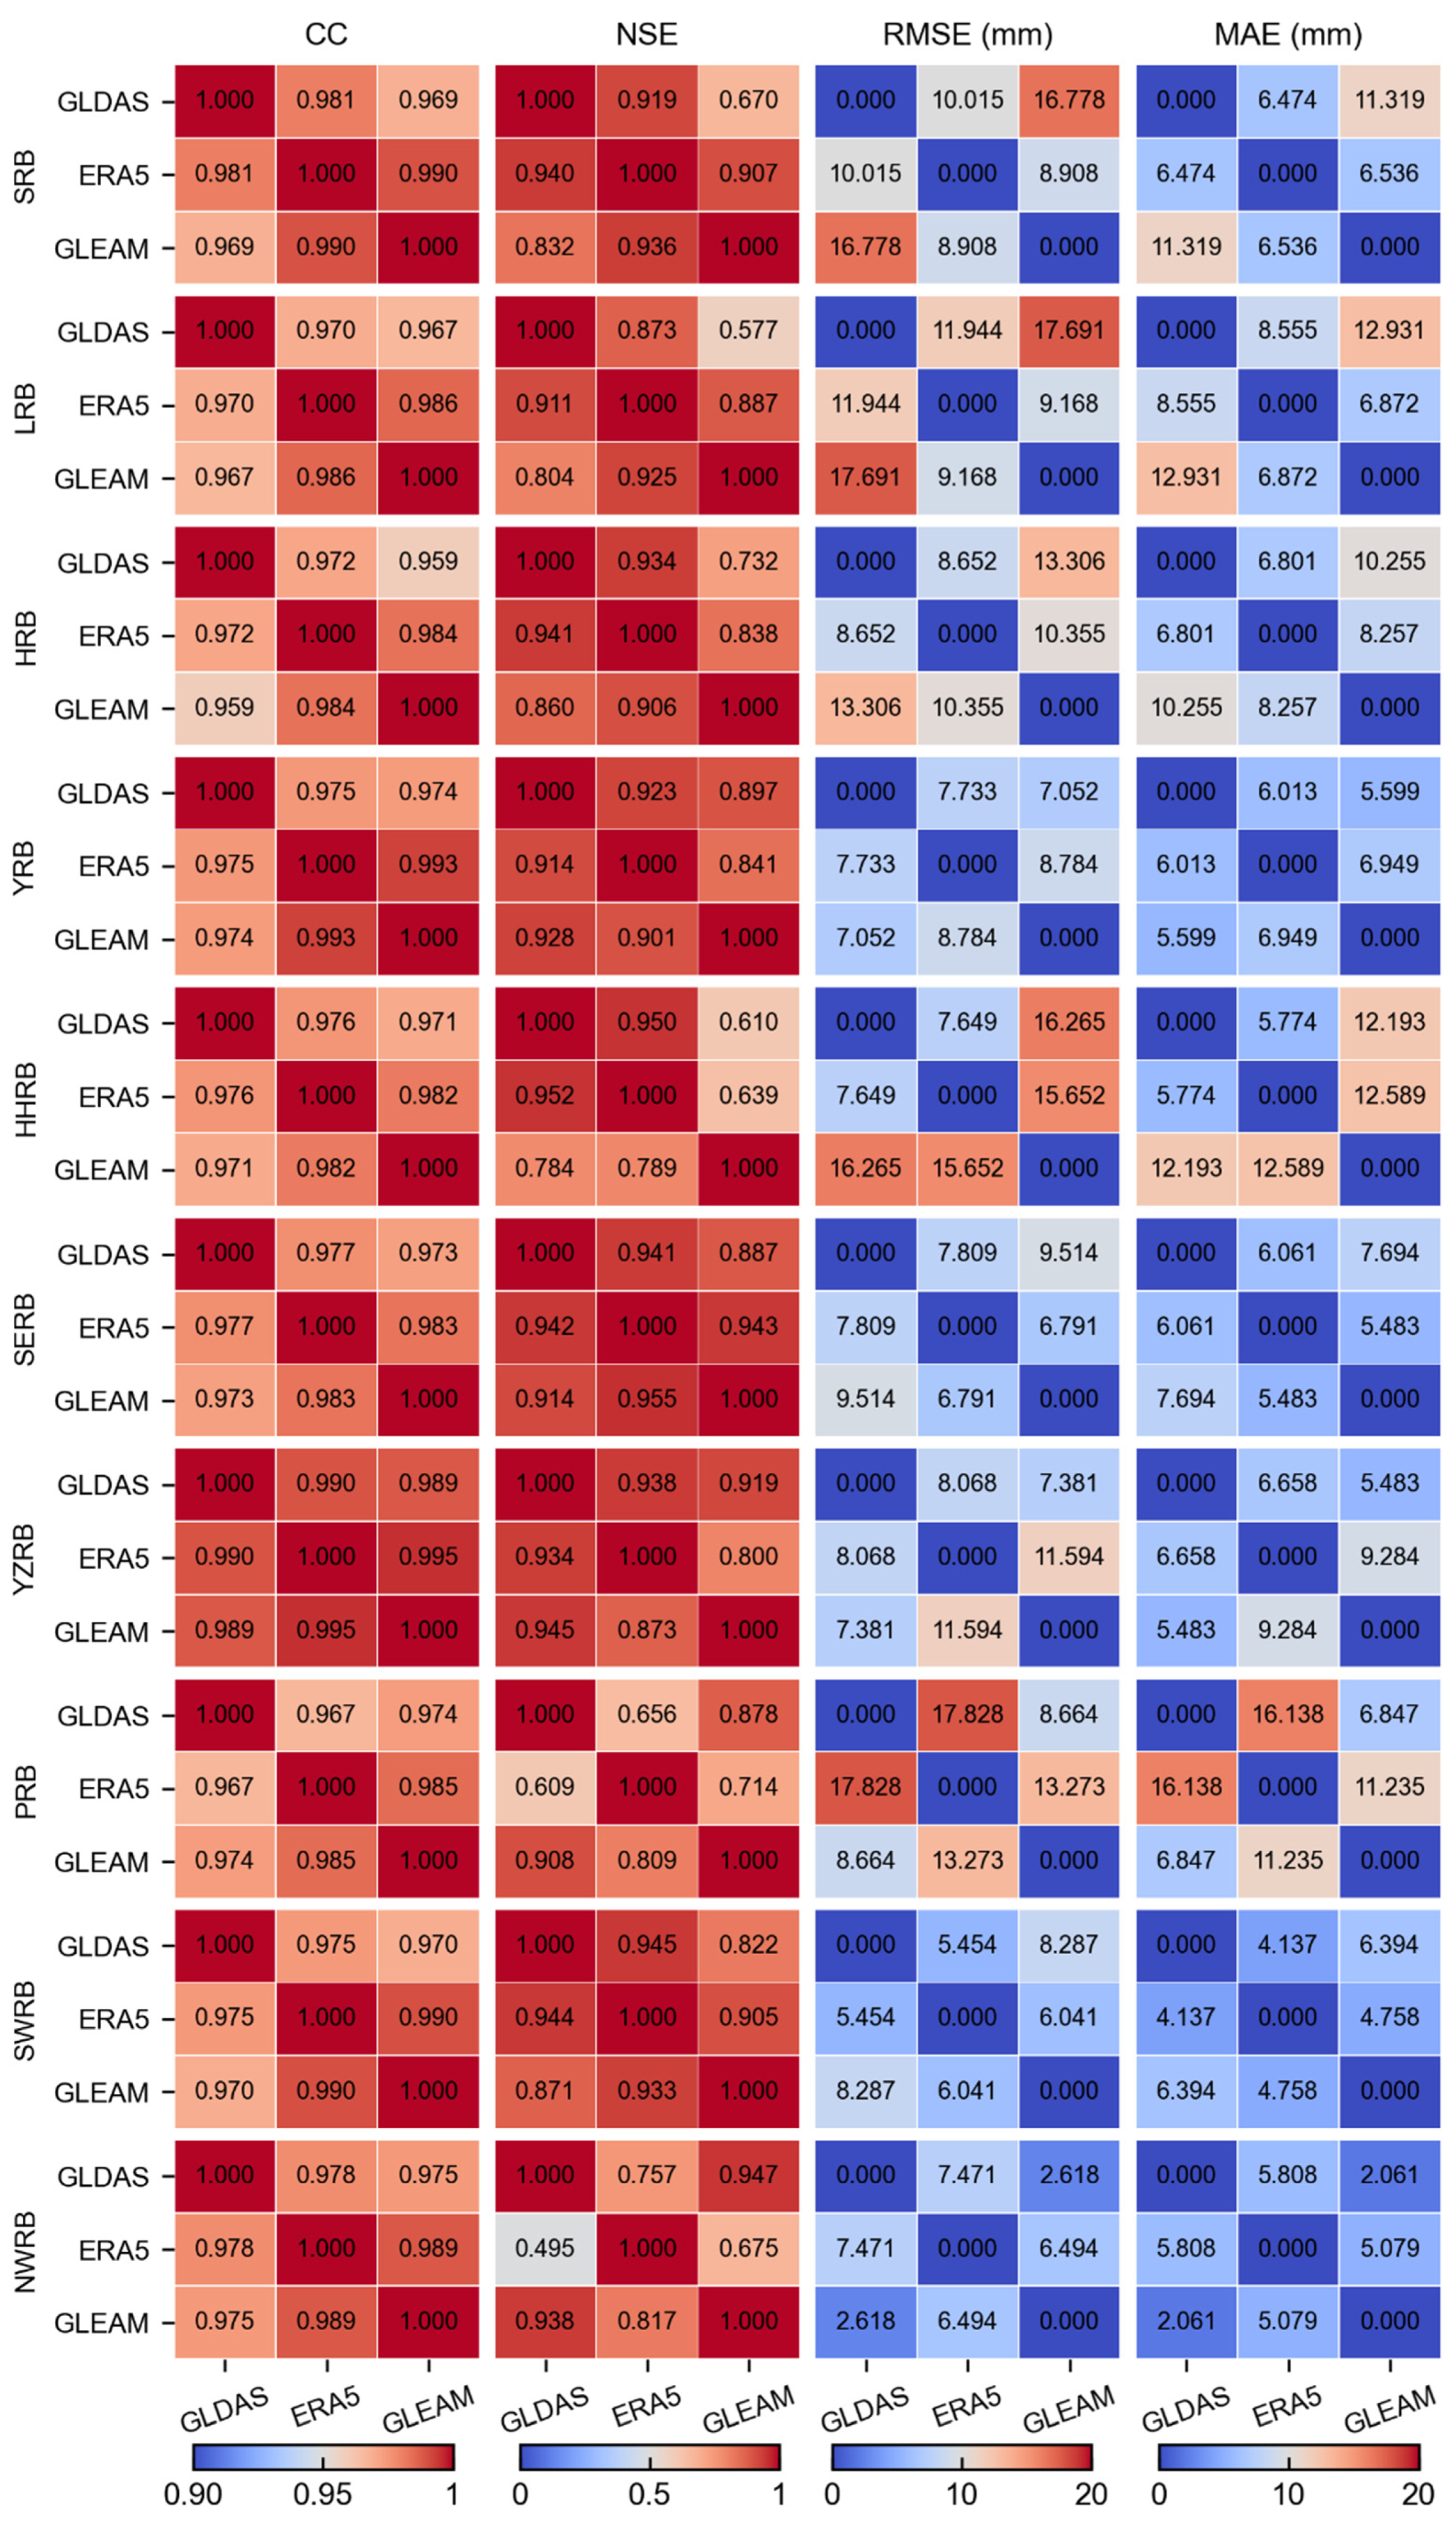
Concerning different ET products, better CCs metrics can be observed within 10 RBs varying from 0.959 to 0.993 (Figure 5). Similarly, larger NSEs metrics can also be found in most RBs, e.g., YRB, SERB, and YZRB. However, poor performances emerge in the LRB (0.577) and HHRB (0.610). Specifically, the worst performance is observed between ERA5 and GLDAS with the NSE index of 0.495, suggesting that larger discrepancies exist in the variation amplitude between these two products. Compared to precipitation products, it can be noticed that significant discrepancies exist among three ET products with larger RMSE and MAE metrics. Specifically, larger metrics can be found in the LRB, HHRB, and PRB with the RMSE and MAE values of (17.691 mm, 12.931 mm), (16.265 mm, 12.589 mm), and (17.828 mm, 16.138 mm), respectively. Hence, it can be concluded that ET products are difficult to measure compared to precipitation products; thus, larger uncertainties exist in ET products.

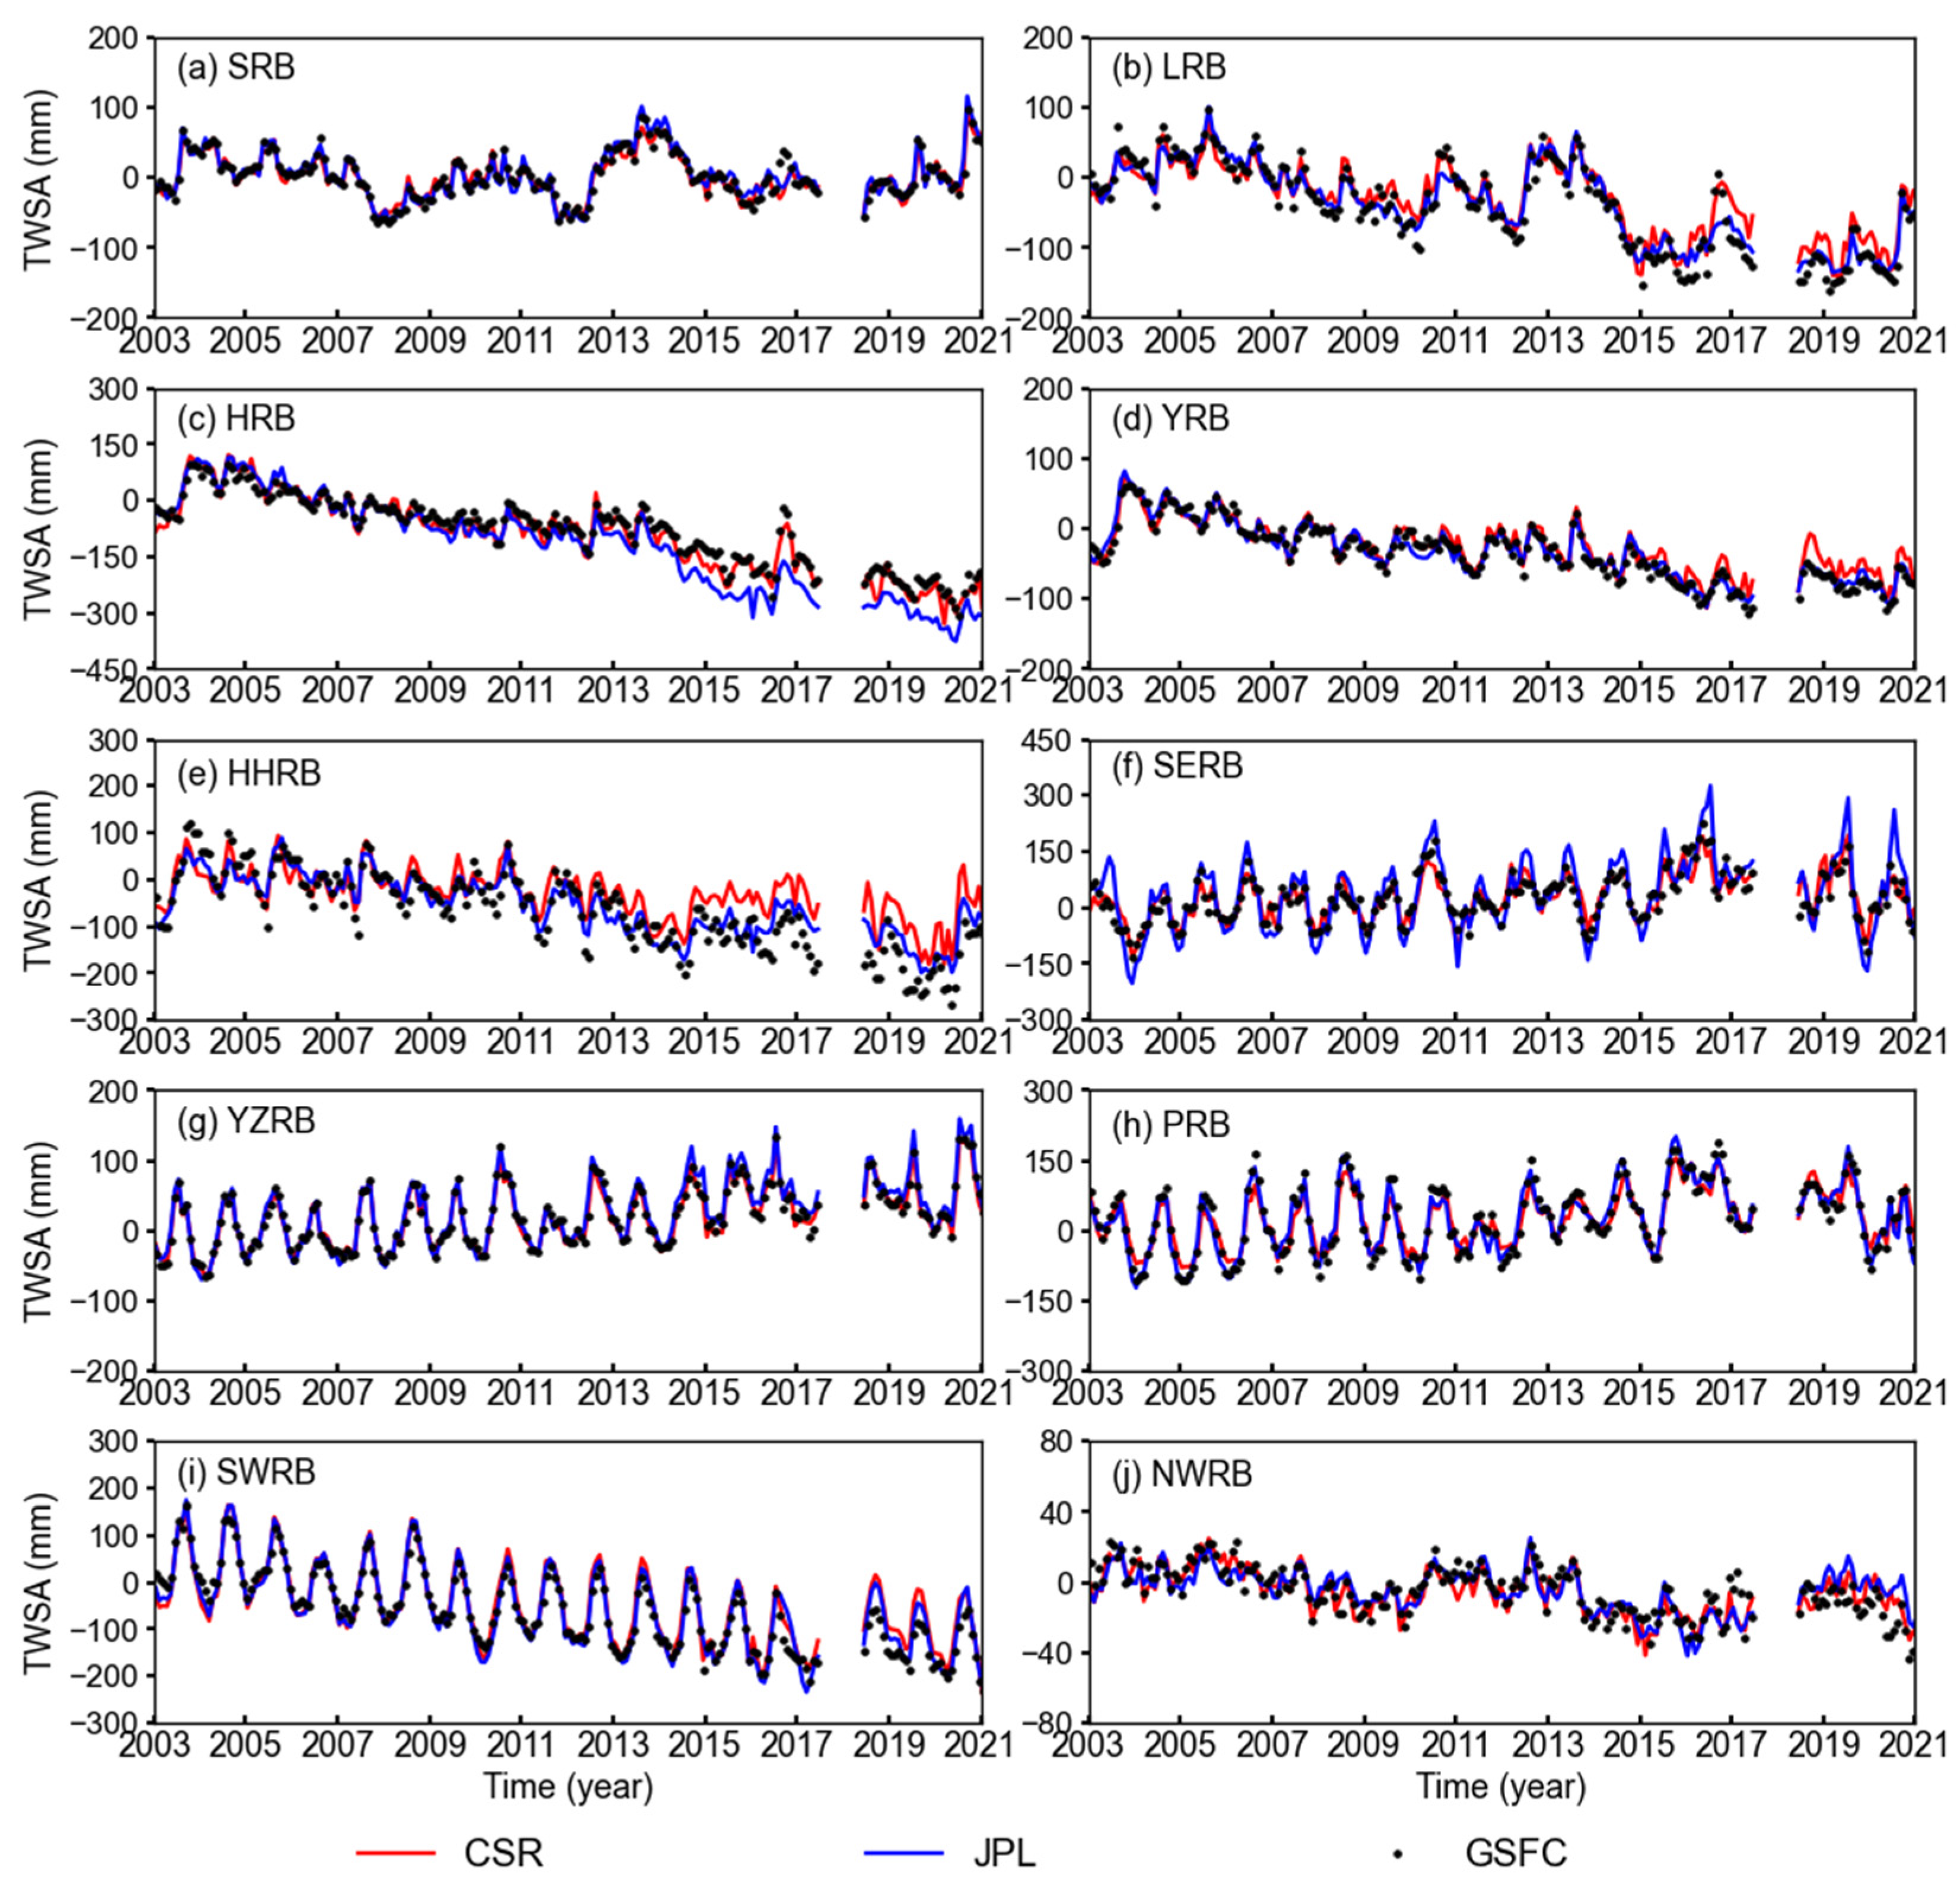
3.2. Comparison of TWSA Based on GRACE Solutions

Figure 6 shows the comparisons of different GRACE solutions over 10 RBs during 2003–2020. Generally speaking, TWSA estimates provided by CSR, JPL, and GSFC show good consistency in most RBs. For the long-term trends, TWSA estimates experience significant decreasing trends in 6 out of 10 RBs during the study period, including the LRB (−7.83 mm/year), HRB (−18.91 mm/year), YRB (−5.95 mm/year), HHRB (−9.51 mm/year), SWRB (−10.26 mm/year), and NWRB (−1.32 mm/year), respectively. It reflects that the TWSA shows a continuous loss and measures must be taken to protect water resources in these RBs. Additionally, we also notice that the decreasing trends show larger differences in some RBs with intensified anthropogenic activities. For example, the JPL-based TWSA trends are larger than that of CSR and GSFC solutions in the HRB, with a slope of −22.99 mm/year, −17.67 mm/year, and −16.06, respectively. However, GSFC overestimates the decreasing trends with respect to CSR and JPL solutions. Correspondingly, TWSA show slightly increasing trends for the SERB (4.80 mm/year), YZRB (4.52 mm/year), and PRB (4.72 mm/year). The long-term trend is −0.14 mm/year in the SRB with the | Z |  value of 0.81, indicating that the trend is not significant at the 0.01 significance level. In order to reduce the uncertainties of different products, the arithmetic average value of three GRACE solutions is chosen as the representative TWSA estimates.
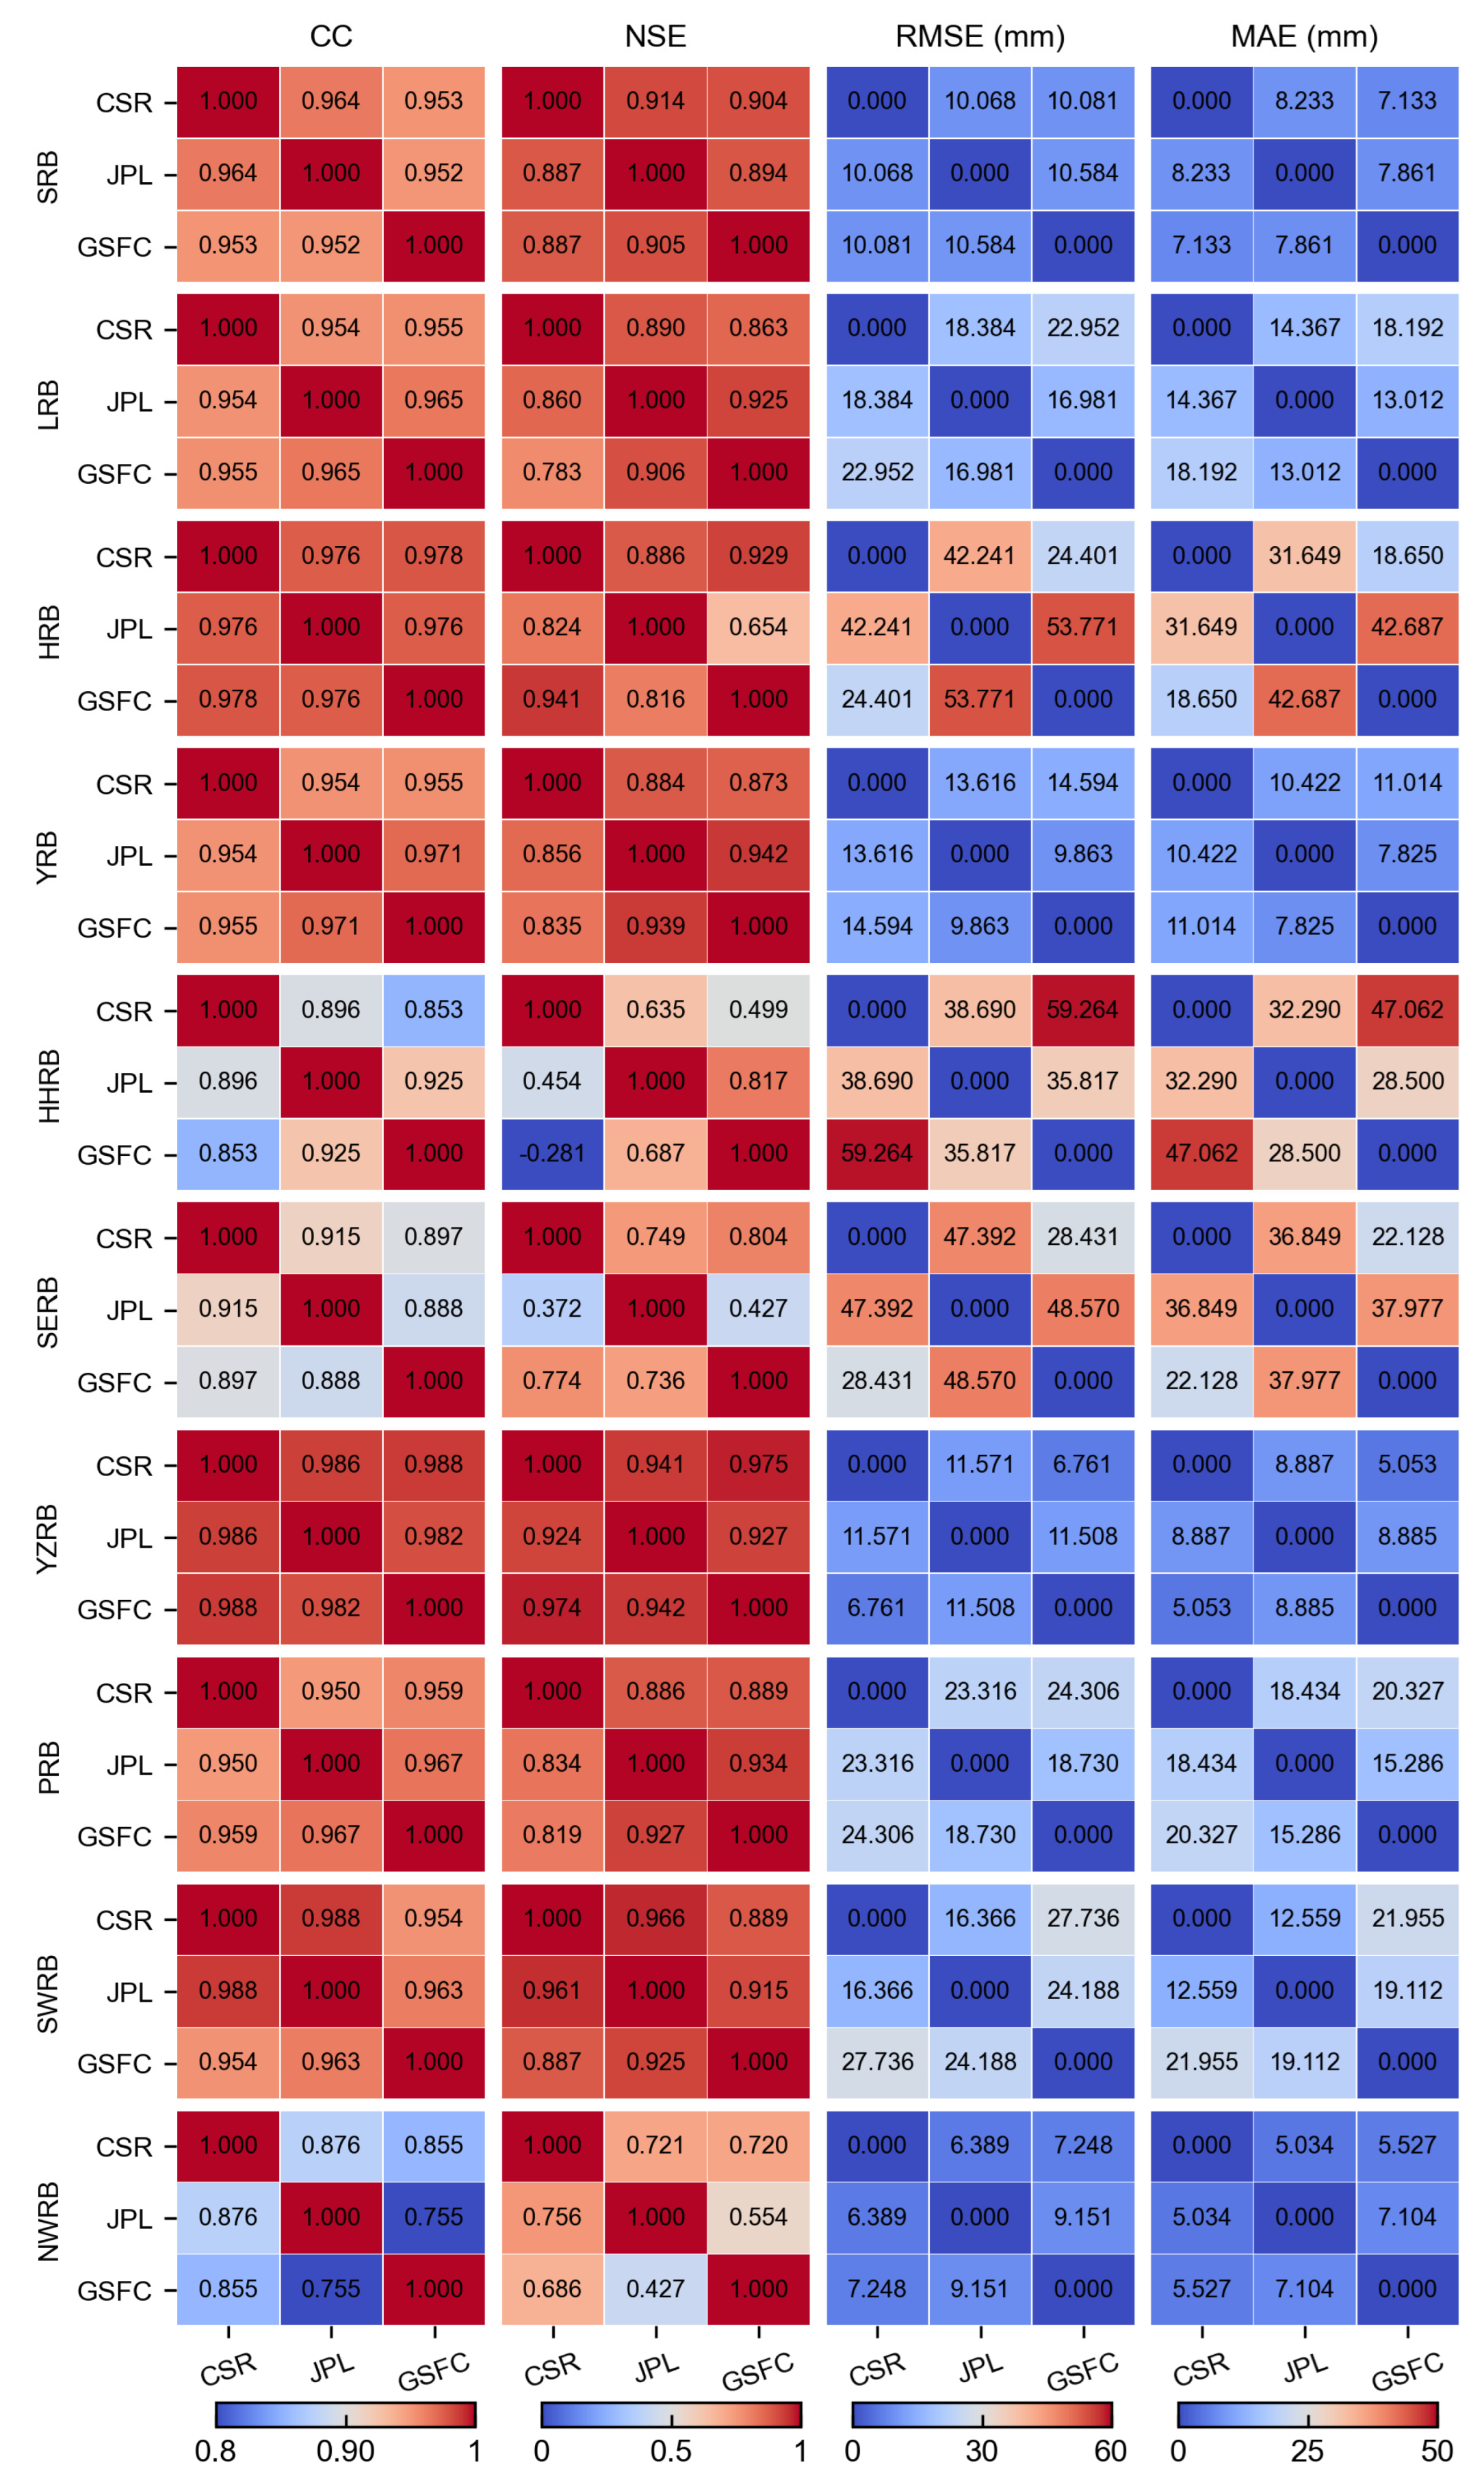
Figure 7 shows the heatmap of CSR, JPL, and GSFC solutions over 10 RBs during 2003–2020. It can be seen that the CCs and NSEs metrics are almost above 0.90 and 0.80, suggesting that these three solutions have good consistency in terms of seasonal signals. However, these two metrics are relatively lower in the HHRB, SERB, and NWRB, and the worst performance is observed between GSFC and JPL solutions in the NWRB with CC and NSE values of 0.755 and 0.427, respectively. In terms of RMSE and MAR, large discrepancies mainly occur in RBs located on the eastern coast, e.g., HRB (53.77 mm, 42.69 mm), HHRB (59.26 mm, 47.06 mm), and SERB (47.39 mm, 36.85 mm). It can be observed that GSFC solution shows larger differences compared to JPL and CSR solutions. Specifically, the largest RMSE value is detected in HHRB between CSR and GSFC solutions with the value of 59.26 mm. The lowest NSE are also observed in HHRB between GSFC and CSR with the value of −0.28. Moreover, the fitting relationship between different products becomes higher with the increasing of the river basins.

3.3. Evaluation of TWSA Estimates over 10 RBs

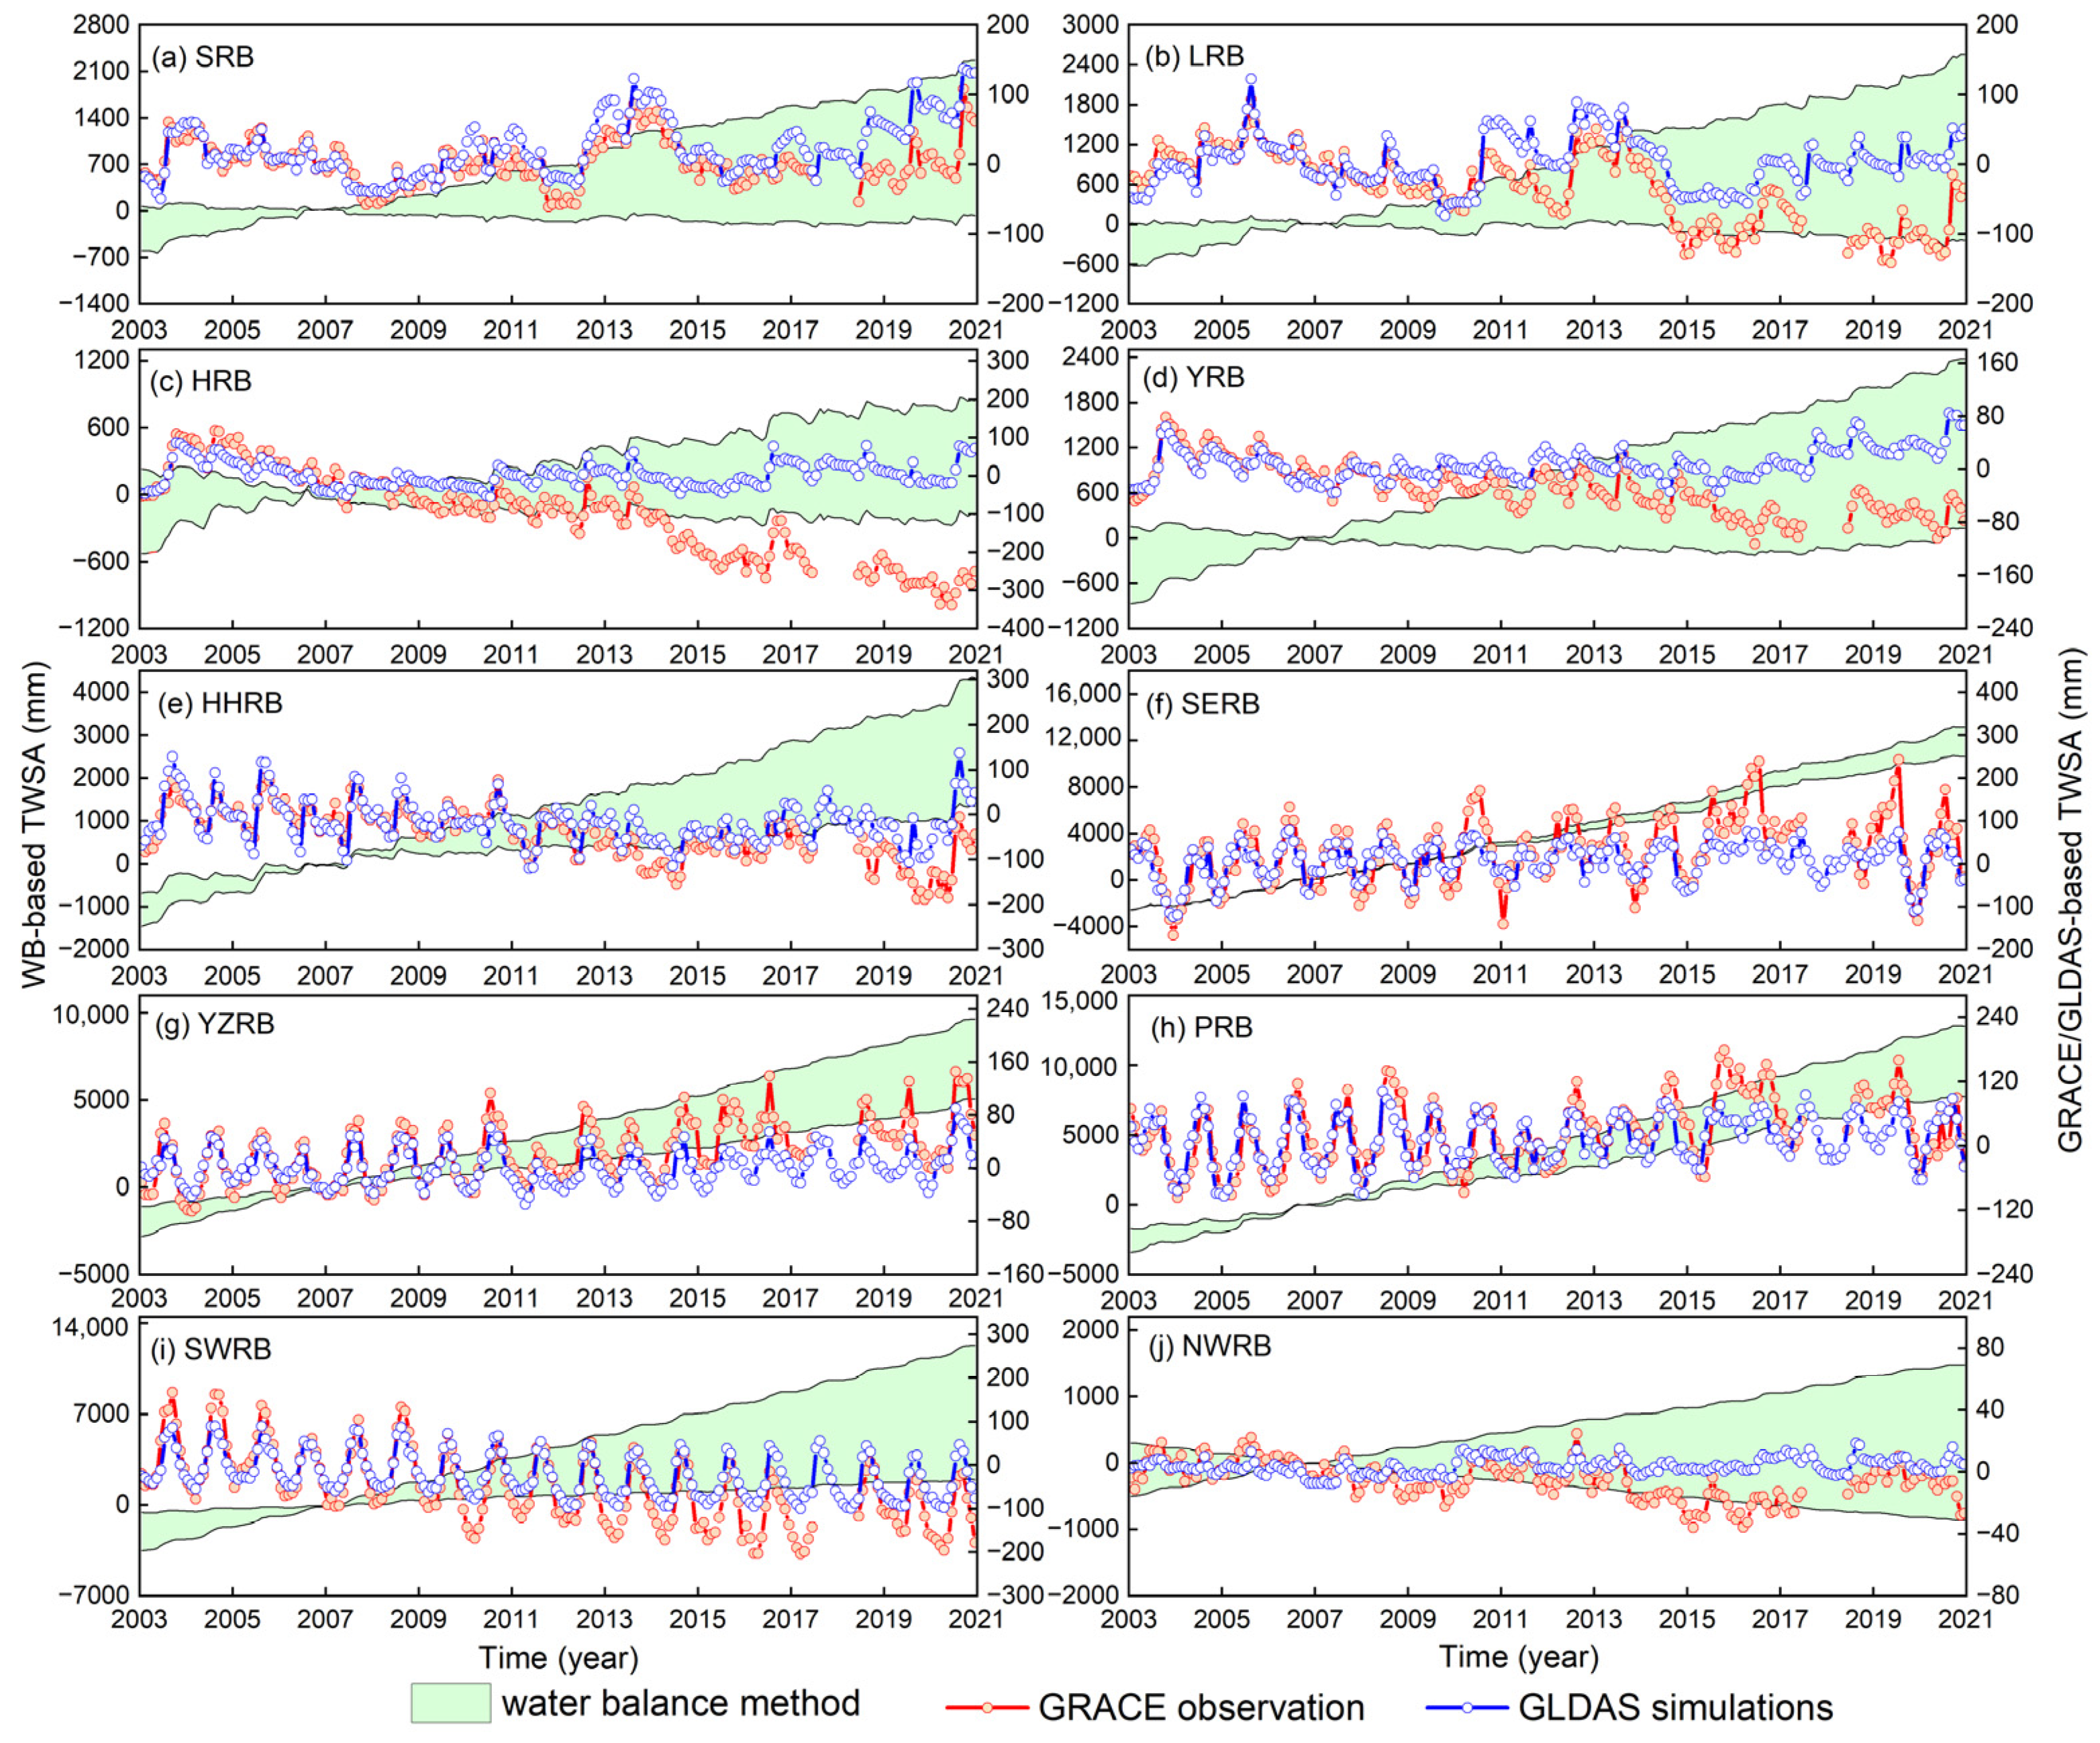
The WB-based TWSA estimates are validated against GRACE solutions and GLDAS simulation over 10 RBs during the period from 2003 to 2020, as shown in Figure 8. Generally speaking, GLDAS simulations match well with GRACE solutions in most RBs, and the CC varies from the YRB (0.13) to SWRB (0.91) with the index value of 0.59 on average. Nevertheless, GRACE-based TWSA experience obvious detrends in some RBs, while the opposite trends are observed with respect to GLDAS products. For example, TWSA trends of GRACE and GLDAS are −5.95 mm/year and 1.82 mm/year in the YRB, respectively. A similar performance can also be observed in the LRB (−7.83 mm/year, 0.21 mm/year) and NWRB (−1.33 mm/year, 0.28 mm/year), which is caused by the deficiencies of the GLDAS structure as well as the lack of groundwater component and human activities.
Concerning the water balance method, the shadow areas represent the range of WB-based TWSA estimates under 12 cases. The variation amplitude of WB-based results is much larger than that of GRACE observations and GLDAS simulations. For example, WB-based TWSA range from −2000 mm to 4000 mm in the HHRB, while the range of GRACE and GLDAS is from −200 mm to 200 mm. Similar performance can also be observed in other RBs. Additionally, the WB-based TWSA trends are positive values in most RBs, and the slopes are very sharp, which is inconsistent with that of GRACE observations. It suggests that the performance of meteorological data plays an important role in the WB-based results. We also notice that the year 2007 is a special year, the differences among 12 cases gradually decrease to zero before 2007, and then the differences continue to increase as time goes on.

4. Discussion

4.1. Comparisons of TWSA Calculated by GRACE and WB Method

Table 3 shows the statistical metrics of the water balance method, GRAE observations, and GLDAS simulations over the period from 2003 to 2020. The GRACE trends with an asterisk denote that the trends are statistically significant at the significance level of 0.01. It can be seen that large differences emerge among the 12 cases in terms of CC and long-term trends. The best performance between WB-based TWSA and GRACE observations can be observed in the LRB, HRB, YRB, and NWRB with the CC index of 0.90, 0.83, 0.70, and 0.68, respectively. Although reasonable CC metrics can be seen in the YZRB with the average CC of 0.54, significant discrepancies can be observed in terms of long-term trends, with the average slope of 446.14 mm/year and 4.52 mm/year for WB-based results and GRACE solutions. Importantly, the optimal WB-based TWSA are obtained based on different meteorological combinations. For example, the optimal TWSA are detected in Case 2, Case 1, Case 4, and Case 5 for the LRB, HRB, YRB, and NWRB, respectively. It can be noticeable some cases yield good estimations while some cases not. This phenomenon is mainly caused by the following reasons: Firstly, it is difficult to accurately monitor ET data in practice, so there will inevitably be some differences among different remote sensing products. Secondly, the gridded runoff data are produced by the GLDAS Noahv2.1 model, which is developed on the global resolution. Thus, the suitability of the model is required to be evaluated when applied to different RBs. Unfortunately, the performance of simulated runoff has not been assessed against in situ measurements because the observed data are not publicly available. Lastly, the anthropogenic activities are not considered in the water balance method, especially in RBs with intense agricultural water use and water transfer project.

4.2. Limitations and Insights of This Research

Based on these above discussions, we can conclude that the performance of WB-based TWSA is greatly affected by the meteorological data. Even the smaller differences in meteorological products may lead to large discrepancies in WB-based results due to the process of integration. There are some limitations in the current research, which reduces the accuracy of the results in some RBs. Specifically, the diversion project and human activities are required to be taken into account in the water balance method, especially in some RBs with intense anthropogenic activities (e.g., the HRB). Additionally, the meteorological and runoff data are provided by remote sensing products and hydrological simulations; thus, some uncertainties are inevitable relative to in-situ measurements. Compared to previous studies [12,13,14], this study quantifies the spatiotemporal characteristics of TWSA estimates over the whole China for the first time. Just because of this, it is impossible for us to collect enough in situ measurements to optimize the WB-based model for each RB. In order to improve the performance of this study, some natural and human factors are required to be considered in the water balance method, including agricultural water use, water diversion projects, and glacier melting. The accuracy of WB-based results can be enhanced to some extent, and it is also the focus of our future research.

5. Conclusions

This study aims to estimate the spatiotemporal characteristics of TWSA by integration of multiple remote sensing products and the water balance method. This scheme is applied to 10 RBs within China during 2003–2020 and validated against GRACE observations and GLDAS simulations. The major conclusions drawn throughout this study can be summarized as follows:
Similar seasonal characteristics can be observed with respect to different precipitation and ET products with the peak values emerging during May–August, while the lowest values occur between November and February. Additionally, larger discrepancies exist among ET products in comparison to precipitation products with larger RMSE and MAE metrics. Three kinds of GRACE solutions indicate similar long-term trends and seasonal signals over 10 RBs, although some discrepancies may exist in terms of slope magnitude. Especially, the differences are a bit larger in several RBs located on the eastern coast, e.g., HRB (53.77 mm, 42.687 mm), HHRB (59.26 mm, 47.06 mm), and SERB (47.39 mm, 36.85 mm). This study can provide valuable suggestions for researchers to improve the TWSA estimates based on the water balance method.

Author Contributions

Conceptualization, M.Z. and Y.J.; methodology, M.Z. and Y.J.; formal analysis, M.Z. and W.Y.; investigation, Y.J. and X.W.; data curation, M.Z., Y.J., and W.Y.; writing—original draft preparation, M.Z. and W.Y.; writing—review and editing, M.Z., X.W., and Y.T.; visualization, Y.T.; supervision, X.W. and Y.T.; Project Administration, M.Z., D.Z., and J.L.; Funding Acquisition, Y.T. All authors have read and agreed to the published version of the manuscript.

Funding

This research was funded by the Second Tibetan Plateau Scientific Expedition and Research Program (2019QZKK0406); the Key R&D Program of Hebei Province (21374201D); the National Natural Science Foundation of China (Grant No. 42001306); Jiangxi Provincial Key Laboratory of Water Resources and Environment of Poyang Lake, Jiangxi Academy of Water Science and Engineering, Nanchang 330,029, China (Grant No. 2020GPSYS02); and State Key Laboratory of Geodesy and Earth’s Dynamics, Innovation Academy for Precision Measurement Science and Technology, CAS, Wuhan 430077, China (Grant No. SKLGED2021−1−3).

Institutional Review Board Statement

The research content of our paper is about the earth sciences, and it is a review and not a research paper, so it does not involve humans or animals, and therefore does not address this issue.

Informed Consent Statement

Informed consent was obtained from all subjects involved in the study.

Data Availability Statement

Not applicable.

Acknowledgments

We thank Shengkun Nie and Gangqiang Zhang for help editing the format of this manuscript.

Conflicts of Interest

The authors declare that they have no known competing financial interests or personal relationships that could have appeared to influence the work reported in this paper.

Abbreviations

Abbreviations of different variables used in this study.
Full NamesAbbreviations
Gravity Recovery and Climate ExperimentGRACE
GRACE Follow-onGRAE-FO
Global Land Data Assimilation SystemGLDAS
Center for Space ResearchCSR
Jet Propulsion LaboratoryJPL
GeoForschungsZentrum PotsdamGFZ
Goddard Space Flight CenterGSFC
Mass Concentration BlocksMascons
Terrestrial Water StorageTWS
Terrestrial Water Storage AnomaliesTWSA
Terrestrial Water Storage ChangesTWSC
Snow Water Equivalent SWE
Soil MoistureSMS
Plant Canopy Surface WaterPCSW
Correlation CoefficientCC
Nash-Sutcliffe Efficiency CoefficientNSE
Root Mean Square ErrorRMSE
Mean Absolute ErrorMAE
River BasinRB
Water BalanceWB
Land Surface ModelsLSMs
Global Hydrological and Water Resource ModelsGHWRMs
EvapotranspirationET
PrecipitationPrecp
China Meteorological AdministrationCMA
Global Precipitation MeasurementGPM
Tropical Rainfall Measuring MissionTRMM
Global Land Evaporation Amsterdam ModelGLEAM
The European Centre for Medium-Range Weather Forecasts Reanalysis 5ERA5

References

  1. Famiglietti, J.S.; Rodell, M. Water in the Balance. Science 2013, 340, 1300–1301. [Google Scholar] [CrossRef] [PubMed]
  2. Long, D.; Yang, W.; Scanlon, B.R.; Zhao, J.; Liu, D.; Burek, P.; Pan, Y.; You, L.; Wada, Y. South-to-North Water Diversion stabilizing Beijing’s groundwater levels. Nat. Commun. 2020, 11, 3665. [Google Scholar] [CrossRef] [PubMed]
  3. Feng, W.; Shum, C.K.; Zhong, M.; Pan, Y. Groundwater Storage Changes in China from Satellite Gravity: An Overview. Remote Sens. 2018, 10, 674. [Google Scholar] [CrossRef]
  4. Tangdamrongsub, N.; Han, S.-C.; Tian, S.; Müller Schmied, H.; Sutanudjaja, E.H.; Ran, J.; Feng, W. Evaluation of groundwater storage variations estimated from GRACE assimilation and State-of-the-Art Land Surface Models in Australia and the North China Plain. Remote Sens. 2018, 10, 483. [Google Scholar] [CrossRef]
  5. Scanlon, B.R.; Zhang, Z.; Save, H.; Sun, A.Y.; Müller Schmied, H.; van Beek, L.P.H.; Wiese, D.N.; Wada, Y.; Long, D.; Reedy, R.C.; et al. Global models underestimate large decadal declining and rising water storage trends relative to GRACE satellite data. Proc. Natl. Acad. Sci. USA 2018, 115, 201704665. [Google Scholar] [CrossRef]
  6. Sutanudjaja, E.; Beek, R.; Wanders, N.; Wada, Y.; Bosmans, J.; Drost, N.; Ent, R.; de Graaf, I.; Hoch, J.; de Jong, K.; et al. PCR-GLOBWB 2: A 5 arcmin global hydrological and water resources model. Geosci. Model Dev. 2018, 11, 2429–2453. [Google Scholar] [CrossRef]
  7. Müller Schmied, H.; Cáceres, D.; Eisner, S.; Flörke, M.; Herbert, C.; Niemann, C.; Peiris, T.A.; Popat, E.; Portmann, F.T.; Reinecke, R.; et al. The global water resources and use model WaterGAP v2.2d: Model description and evaluation. Geosci. Model Dev. 2021, 14, 1037–1079. [Google Scholar] [CrossRef]
  8. Yang, X.; Tian, S.; Feng, W.; Ran, J.; You, W.; Zhongshan, J.; Gong, X. Spatio-Temporal Evaluation of Water Storage Trends from Hydrological Models over Australia Using GRACE Mascon Solutions. Remote Sens. 2020, 12, 3578. [Google Scholar] [CrossRef]
  9. Peng, B.; Liu, X.; Yang, T.; Liang, K.; Liu, C. Evaluation of streamflow simulation results of land surface models in GLDAS on the Tibetan Plateau: GLDAS runoff simulations on the TP. J. Geophys. Res.-Atmos. 2016, 121, 180–197. [Google Scholar]
  10. Chen, Z.; Zeng, Y.; Shen, G.; Xiao, C.; Xu, L.; Chen, N. Spatiotemporal characteristics and estimates of extreme precipitation in the Yangtze River Basin using GLDAS data. Int. J. Climatol. 2020, 41, E1812–E1830. [Google Scholar] [CrossRef]
  11. Yin, W.; Yang, S.; Hu, L.; Tian, S.; Wang, X.; Zhao, R.; Li, P. Improving understanding of spatiotemporal water storage changes over China based on multiple datasets. J. Hydrol. 2022, 612, 128098. [Google Scholar] [CrossRef]
  12. Sun, K.; Hu, L.; Liu, X.; Yin, W. Reconstructing Terrestrial Water Storage Anomalies Using Satellite Data to Evaluate Water Resource Shortages from 1980 to 2016 in the Inland Yongding River Basin, China. Geofluids 2021, 2021, 7275242. [Google Scholar] [CrossRef]
  13. Yin, W.; Hu, L.; Han, S.C.; Zhang, M.; Teng, Y. Reconstructing terrestrial water Storage Variations from 1980 to 2015 in the Beishan area of China. Geofluids 2019, 2019, 3874742. [Google Scholar] [CrossRef]
  14. Nie, N.; Zhang, W.; Zhang, Z.; Guo, H.; Ishwaran, N. Reconstructed Terrestrial Water Storage Change (ΔTWS) from 1948 to 2012 over the Amazon Basin with the Latest GRACE and GLDAS Products. Water Resour. Manag. 2016, 30, 279–294. [Google Scholar] [CrossRef]
  15. Wang, J.; Zhang, J.; Ning, S.; Wang, H. Downscaling analysis of GRACE terrestrial water storage changes in Yunnan province. Water Resour. Power. 2018, 336, 1–5. [Google Scholar]
  16. Yin, W.; Hu, L.; Zhang, M.; Wang, J.; Han, S.C. Statistical downscaling of GRACE-derived groundwater storage using ET data in the North China Plain. J. Geophys. Res.-Atmos. 2018, 123, 5973–5987. [Google Scholar] [CrossRef]
  17. Pan, Y.; Zhang, C.; Gong, H.; Yeh, P.; Shen, Y.; Guo, Y.; Zhiyong, H.; Li, X. Detection of Human-induced Evapotranspiration using GRACE Satellite Observations in the Haihe River Basin of China: Detecting Human-induced ET using GRACE. Geophys. Res. Lett. 2016, 44, 190–199. [Google Scholar] [CrossRef]
  18. Liu, W.; Wang, L.; Zhou, J.; Li, Y.; Sun, F.; Fu, G.; Li, X.; Sang, Y. A worldwide evaluation of basin-scale evapotranspiration estimates against the water balance method. J. Hydrol. 2016, 538, 82–95. [Google Scholar] [CrossRef]
  19. Rodell, M.; Famiglietti, J.S. An analysis of terrestrial water storage variations in Illinois with implications for the Gravity Recovery and Climate Experiment (GRACE). Water Resour. Res. 2001, 37, 1327–1339. [Google Scholar] [CrossRef]
  20. Rodell, M.; Velicogna, I.; Famiglietti, J.S. Satellite-based estimates of groundwater depletion in India. Nature 2009, 460, 999–1002. [Google Scholar] [CrossRef]
  21. Yeh, J.F.; Swenson, S.C.; Famiglietti, J.S.; Rodell, M. Remote sensing of groundwater storage changes in Illinois using the Gravity Recovery and Climate Experiment (GRACE). Water Resour. Res. 2006, 42, W12203. [Google Scholar] [CrossRef]
  22. Xiong, J.; Yin, J.; Guo, S.; Slater, L. Continuity of terrestrial water storage variability and trends across mainland China monitored by the GRACE and GRACE-Follow on satellites. J. Hydrol. 2021, 599, 126308. [Google Scholar] [CrossRef]
  23. Long, D.; Longuevergne, L.; Scanlon, B.R. Global analysis of approaches for deriving total water storage changes from GRACE satellites. Water Resour. Res. 2015, 51, 2574–2594. [Google Scholar] [CrossRef]
  24. Tapley, B.D.; Bettadpur, S.; Ries, J.C.; Thompson, P.F.; Watkins, M.M. GRACE measurements of mass variability in the Earth system. Science 2004, 305, 503–505. [Google Scholar] [CrossRef]
  25. Feng, W.; Zhong, M.; Lemoine, J.-M.; Biancale, R.; Hsu, H.-T.; Xia, J. Evaluation of groundwater depletion in North China using the Gravity Recovery and Climate Experiment (GRACE) data and ground-based measurements. Water Resour. Res. 2013, 49, 2110–2118. [Google Scholar] [CrossRef]
  26. Yin, Z.; Dr, Y.; Zhu, X.; Zhao, J.; Yang, Y.; Li, J. Variations of groundwater storage in different basins of China over recent decades. J. Hydrol. 2021, 598, 126282. [Google Scholar] [CrossRef]
  27. Long, D.; Pan, Y.; Zhou, J.; Chen, Y.; Hou, X.; Hong, Y.; Scanlon, B.R.; Longuevergne, L. Global analysis of spatiotemporal variability in merged total water storage changes using multiple GRACE products and global hydrological models. Remote Sens. Environ. 2017, 192, 198–216. [Google Scholar] [CrossRef]
  28. Swenson, S.; Wahr, J. Methods for inferring regional surfacemass anomalies from Gravity Recovery and Climate Experiment (GRACE) measurements of time-variable gravity. J. Geophys. Res. 2002, 107, 2193. [Google Scholar]
  29. Swenson, S.; Wahr, J. Post-processing removal of correlated errors in GRACE data. Geophys. Res. Lett. 2006, 33, L08402. [Google Scholar] [CrossRef]
  30. Wang, Q.; Zheng, W.; Yin, W.; Kang, G.; Zhang, D. Improving the accuracy of water storage anomaly trends based on a new statistical correction hydrological model weighting method. Remote Sens. 2021, 13, 3583. [Google Scholar] [CrossRef]
  31. Hu, B.; Wang, L.; Li, X.; Zhou, J.; Pan, Y. Divergent Changes in Terrestrial Water Storage Across Global Arid and Humid Basins. Geophys. Res. Lett. 2021, 48, e2020GL091069. [Google Scholar] [CrossRef]
  32. Yeh, P.J.F. Terrestrial water storage variation inferred from GRACE satellite and water balance. In Proceedings of the 32nd Asian Conference on Remote Sensing 2011, ACRS, Tapei, Taiwan, 3–7 October 2011; Volume 4, pp. 2850–2855. [Google Scholar]
  33. Liu, X.; Feng, X.; Ciais, P.; Fu, B.; Hu, B.; Sun, Z. GRACE satellite-based drought index indicating increased impact of drought over major basins in China during 2002–2017. Agric. Forest Meteorol. 2020, 291, 108057. [Google Scholar] [CrossRef]
  34. Zhai, J.; Liu, B.; Hartmann, H.; Buda, S.; Tong, J.; Fraedrich, K. Dryness/wetness variations in China during the first 50 years of the 21st century. Quatern. Int. 2010, 226, 101–111. [Google Scholar] [CrossRef]
  35. Wiese, D.; Landerer, F.; Watkins, M. Quantifying and reducing leakage errors in the JPL RL05M GRACE mascon solution. Water Resour. Res. 2016, 52, 7490–7502. [Google Scholar] [CrossRef]
  36. Zheng, L.; Pan, Y.; Gong, H.; Zhiyong, H.; Zhang, C. Comparing Groundwater Storage Changes in Two Main Grain Producing Areas in China: Implications for Sustainable Agricultural Water Resources Management. Remote Sens. 2020, 12, 21. [Google Scholar] [CrossRef]
  37. Rodell, M.; Houser, P.R.; Jambor, U.; Gottschalck, J.; Mitchell, K.; Meng, C.J.; Arsenault, K.; Cosgrove, B.; Radakovich, J.; Bosilovich, M.; et al. The Global Land Data Assimilation System. B Am. Meteorol. Soc. 2004, 85, 381–394. [Google Scholar] [CrossRef]
  38. Zhong, Y.; Zhong, M.; Mao, Y.; Ji, B. Evaluation of evapotranspiration for exorheic catchments of China during the GRACE era: From a water balance perspective. Remote Sens. 2020, 12, 511. [Google Scholar] [CrossRef]
  39. Rui, H. Readme Document for Global Land Data Assimilation System Version 1 (GLDAS-1). 2014. Available online: https://disc.gsfc.nasa.gov/ (accessed on 1 May 2022).
  40. Rui, H. Readme Document for Global Land Data Assimilation System Version 2 (GLDAS-2). 2018. Available online: https://disc.gsfc.nasa.gov/ (accessed on 1 May 2022).
  41. Gong, H.; Pan, Y.; Zheng, L.; Li, X.; Zhu, L.; Zhang, C.; Zhiyong, H.; Li, Z.; Wang, H.; Zhou, C. Long-term groundwater storage changes and land subsidence development in the North China Plain (1971–2015). Hydrogeol. J. 2018, 26, 1417–1427. [Google Scholar] [CrossRef]
  42. Wang, F.; Wang, Z.; Yang, H.; Di, D.; Zhao, Y.; Liao, Q. A new copula-based standardized precipitation evapotranspiration streamflow index for drought monitoring. J. Hydrol. 2020, 585, 124793. [Google Scholar] [CrossRef]
  43. Zhang, C.; Shao, H.; Chen, S.; Liu, T.; Chen, C.; Ding, Q.; Du, H. Evaluation and Intercomparison of High-Resolution Satellite Precipitation Estimates—GPM, TRMM, and CMORPH in the Tianshan Mountain Area. Remote Sens. 2018, 10, 1543. [Google Scholar] [CrossRef]
  44. Martens, B.; Miralles, D.G.; Lievens, H.; van der Schalie, R.; de Jeu, R.A.M.; Férnandez-Prieto, D.; Beck, H.E.; Dorigo, W.A.; Verhoest, N.E.C. GLEAM v3: Satellite-based land evaporation and root-zone soil moisture. Geosci. Model Dev. 2017, 10, 1903–1925. [Google Scholar] [CrossRef]
  45. Miralles, D.G.; Holmes, T.R.H.; Jeu, R.A.M.D.; Gash, J.H. Global land-surface evaporation estimated from satellite-based observations. Hydrol. Earth Syst. Sci. 2011, 15, 453–469. [Google Scholar] [CrossRef]
  46. Olauson, J. ERA5: The new champion of wind power modelling? Renew. Energ. 2018, 126, 322–331. [Google Scholar] [CrossRef] [Green Version]
  47. Sun, W.; Jin, Y.; Jingshan, Y.; Wang, G.; Xue, B.L.; Zhao, Y.; Fu, Y.; Shrestha, S. Integrating satellite observations and human water use data to estimate changes in key components of terrestrial water storage in a semi-arid region of North China. Sci. Total Environ. 2020, 698, 134171. [Google Scholar] [CrossRef] [PubMed]
  48. Long, D.; Shen, Y.; Sun, A.; Hong, Y.; Longuevergne, L.; Yang, Y.; Li, B.; Chen, L. Drought and Flood Monitoring for a Large Karst Plateau in Southwest China Using Extended GRACE Data. Remote Sens. Environ. 2014, 155, 145–160. [Google Scholar] [CrossRef]
  49. Mann, H. Non-parametric tests against trend. Econometrica 1945, 13, 245–259. [Google Scholar] [CrossRef]
  50. Kendall, M. Rank Correlation Methods; Charles Griffin: London, UK, 1975. [Google Scholar]
  51. Sang, Y.; Wang, Z.; Liu, C. Comparison of the MK Test and EMD Method for Trend Identification in Hydrological Time Series. J. Hydrol. 2014, 510, 293–298. [Google Scholar] [CrossRef]
  52. Hırca, T.; Türkkan, G.; Niazkar, M. Applications of innovative polygonal trend analyses to precipitation series of Eastern Black Sea Basin, Turkey. Theor. Appl. Climatol. 2022, 147, 651–667. [Google Scholar] [CrossRef]
  53. Niazkar, M.; Hajizadeh Mishi, F.; Türkkan, G. Assessment of Artificial Intelligence Models for Estimating Lengths of Gradually Varied Flow Profiles. Complexity 2021, 2021, 5547889. [Google Scholar] [CrossRef]
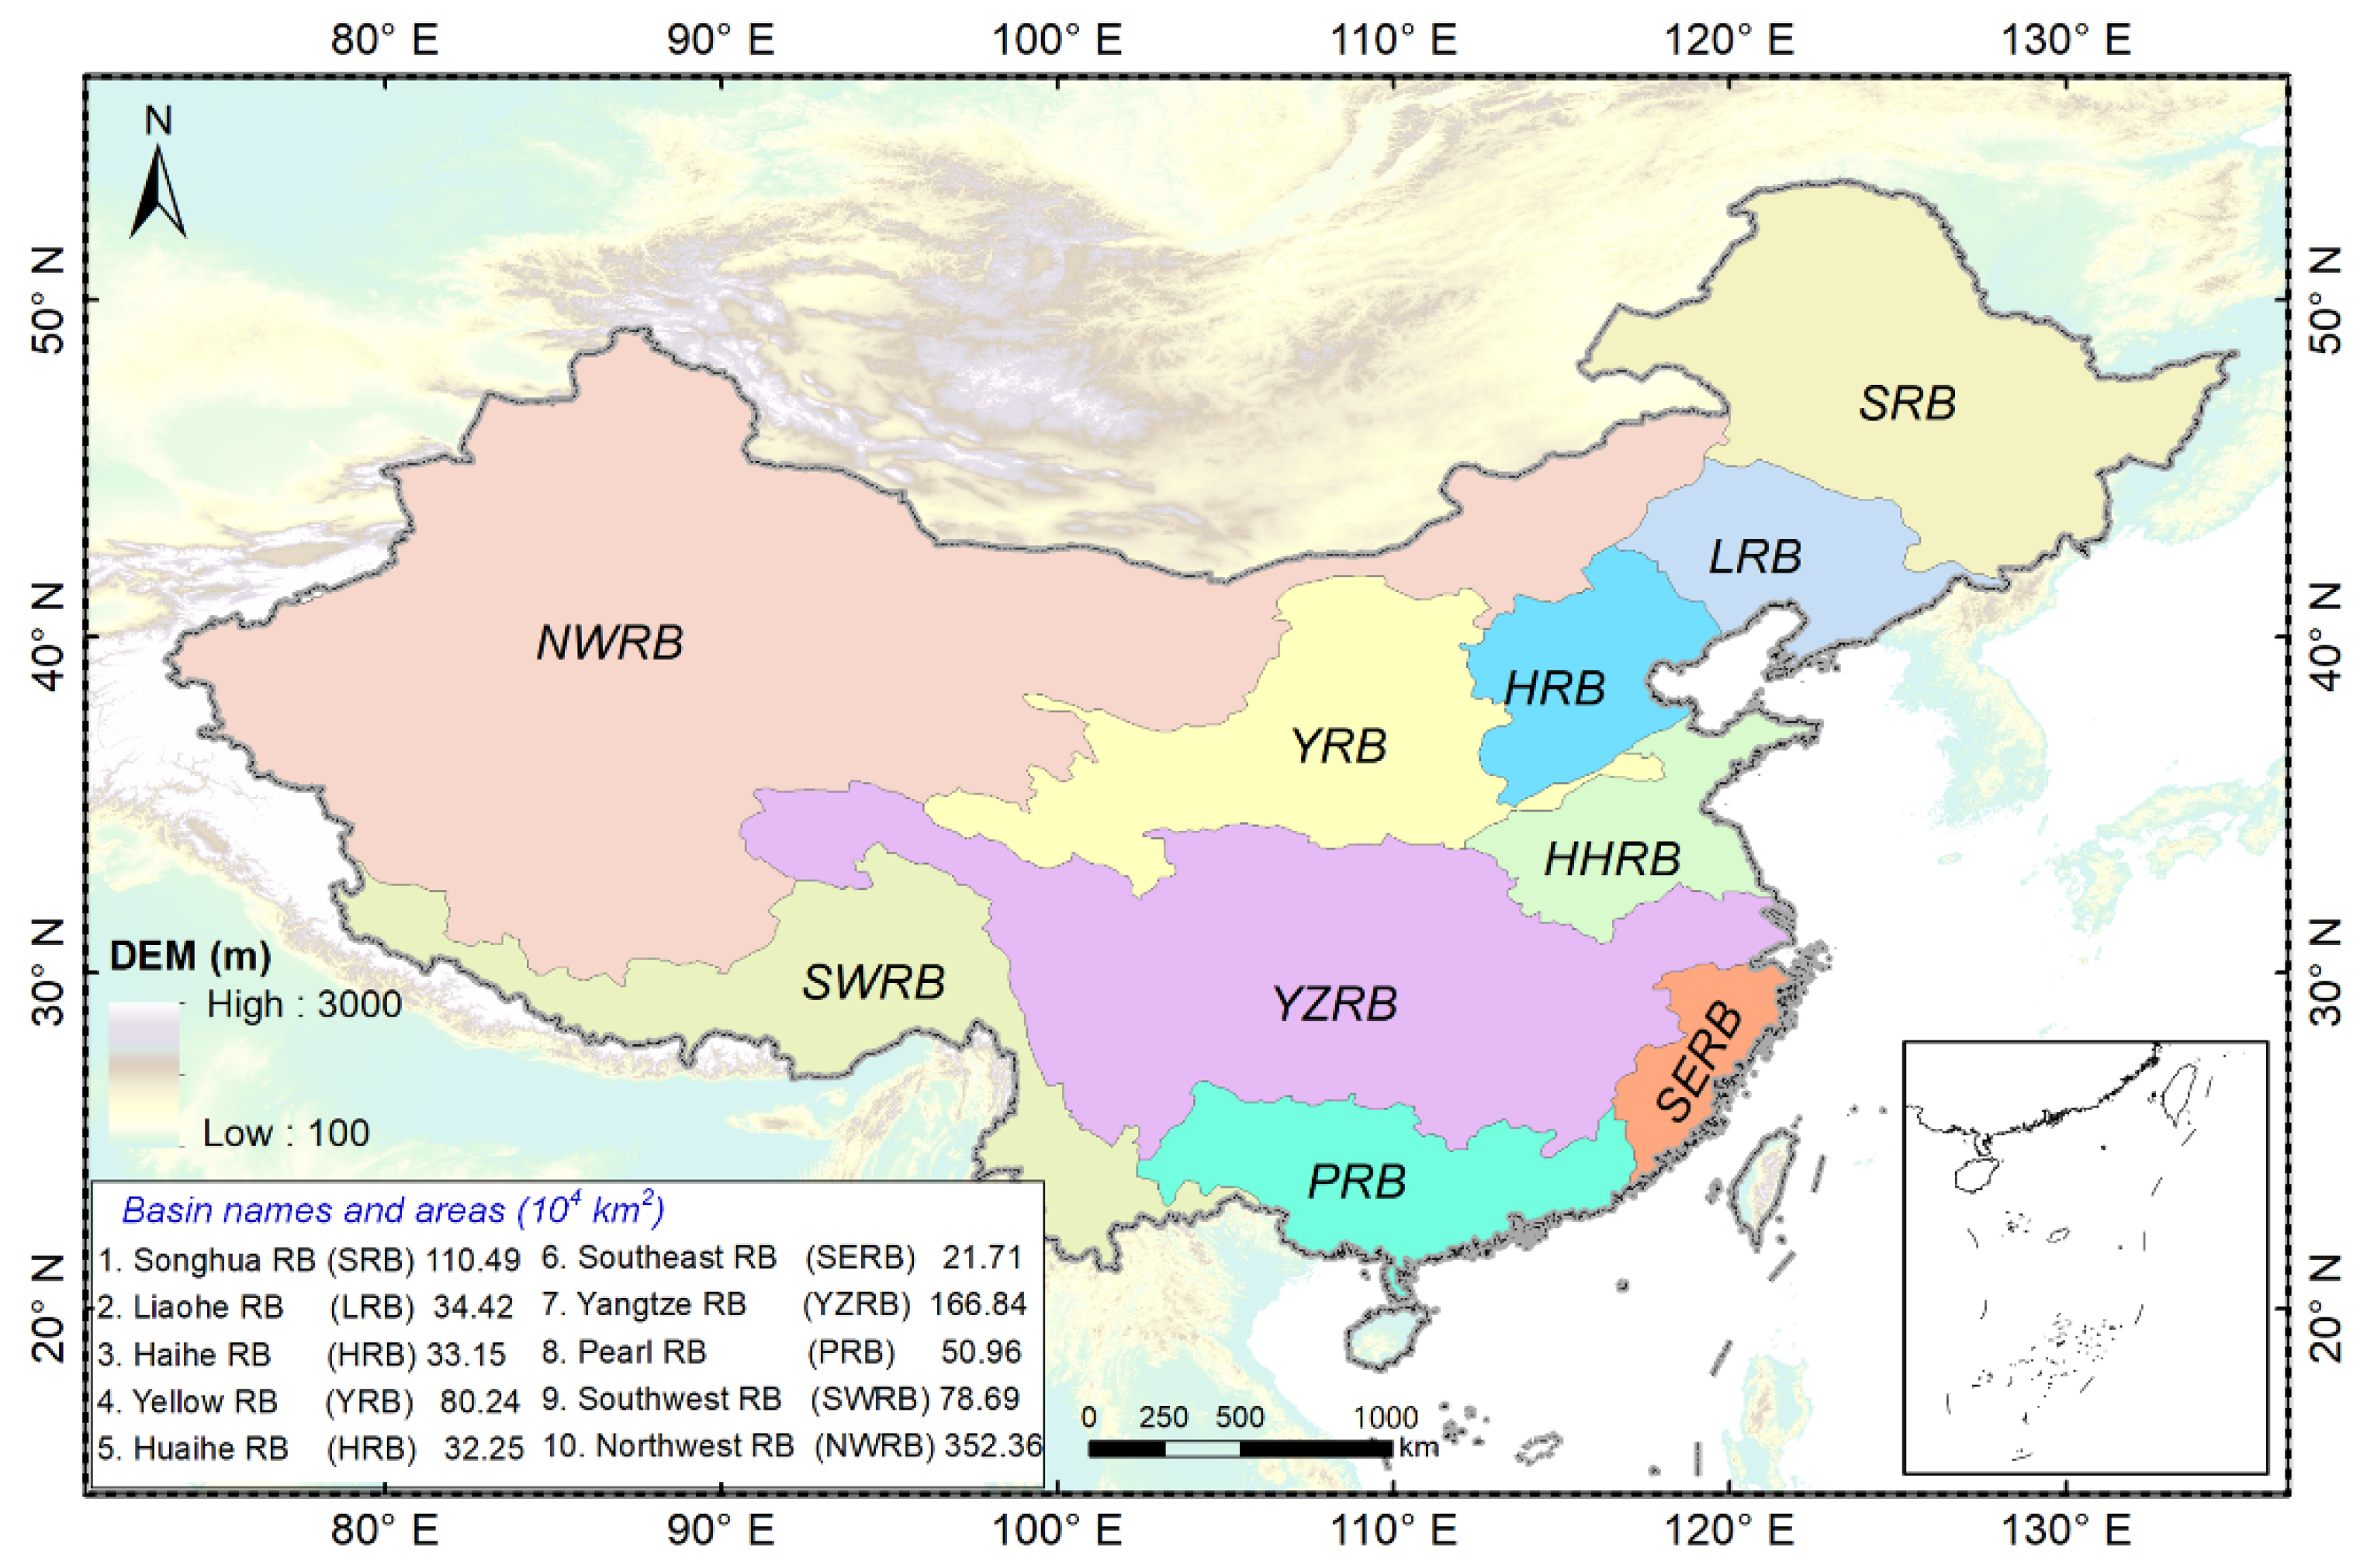
Figure 1. Map of 10 river basins in China.
Sustainability 14 11658 g001
Figure 2. Flowchart of this research.
Sustainability 14 11658 g002
Figure 3. Comparison of different precipitation and ET products over 10 RBs from 2003 to 2020.
Sustainability 14 11658 g003
Figure 4. Heatmap of different precipitation products over 10 RBs during 2003–2020.
Sustainability 14 11658 g004
Figure 5. Heatmap of different ET products over 10 RBs during 2003–2020.
Sustainability 14 11658 g005
Figure 6. Comparison of different GRACE solutions over 10 RBs during 2003–2020.
Sustainability 14 11658 g006
Figure 7. Heatmap of different GRACE solutions over 10 RBs during 2003–2020.
Sustainability 14 11658 g007
Figure 8. Comparison of TWSA estimates provided by the GRACE, GLDAS, and WB methods over 10 RBs during the period from 2003 to 2020.
Sustainability 14 11658 g008
Table 1. Detailed information of different meteorological products in this study.
DatasetPlatformSpatial ResolutionTime SpanWebsite
TWSACSR0.25° × 0.25°2003–2021http://www2.csr.utexas.edu/ (accessed on 3 February 2022)
JPL0.50° × 0.50°2003–2021https://podaac-opendap.jpl.nasa.gov/ (accessed on 3 February 2022)
GSFC0.50° × 0.50°2003–2021https://earth.gsfc.nasa.gov/geo/data/grace-mascons (accessed on 3 February 2022)
PrecipitationCMA0.50° × 0.50°1962–2020http://data.cma.cn/ (accessed on 1 March 2021)
GPM0.10° × 0.10°2000–2021https://gpm.nasa.gov/data/directory (accessed on 1 June 2022)
GLDAS0.25° × 0.25°2000–2021https://disc.gsfc.nasa.gov/ (accessed on 1 May 2022)
ERA50.25° × 0.25°1979–2021https://www.ecmwf.int/en/forecasts/datasets/reanalysis-datasets/era5 (accessed on 1 May 2022)
ETGLEAM0.25° × 0.25°1980–2020https://www.gleam.eu (accessed on 1 June 2022)
GLDAS0.25° × 0.25°2000–2021https://disc.gsfc.nasa.gov/ (accessed on 1 May 2022)
ERA50.25° × 0.25°1979–2021https://www.ecmwf.int/en/forecasts/datasets/reanalysis-datasets/era5 (accessed on 1 May 2022)
RunoffGLDAS0.25° × 0.25°2000–2021https://disc.gsfc.nasa.gov/ (accessed on 1 May 2022)
Table 2. Definition of 12 cases based on different meteorological combinations.
NamePrecpETRunoffNamePrecpETRunoff
Case 1CMAERA5GLDASCase 7GLDASERA5GLDAS
Case 2CMAGLDASGLDASCase 8GLDASGLDASGLDAS
Case 3CMAGLEAMGLDASCase 9GLDASGLEAMGLDAS
Case 4GPMERA5GLDASCase 10ERA5ERA5GLDAS
Case 5GPMGLDASGLDASCase 11ERA5GLDASGLDAS
Case 6GPMGLEAMGLDASCase 12ERA5GLEAMGLDAS
Table 3. Statistics of correlation coefficient and long-term trends during the period of 2003 and 2020. Cases 1–12 stand for the combinations of different meteorological products based on the water balance method. The * symbol indicate that the long-term trends are significant at the level of 0.01.
CasesSRBLRBHRBYRBHHRBSERBYZRBPRBSWRBNWRB
CCCase 10.20−0.560.830.68−0.550.380.550.44−0.510.49
Case 20.400.900.55−0.68−0.530.380.540.43−0.50−0.41
Case 30.03−0.65−0.65−0.68−0.640.380.540.43−0.52−0.47
Case 40.06−0.65−0.030.70−0.610.380.550.43−0.530.49
Case 50.15−0.40−0.80−0.66−0.600.380.540.43−0.530.68
Case 60.00−0.68−0.84−0.66−0.650.380.540.43−0.530.43
Case 70.03−0.69−0.66−0.02−0.630.380.550.44−0.530.47
Case 80.06−0.65−0.87−0.71−0.620.380.540.43−0.52−0.46
Case 9−0.01−0.70−0.87−0.70−0.660.380.540.43−0.53−0.50
Case 100.01−0.64−0.79−0.73−0.570.380.540.43−0.54−0.44
Case 110.03−0.42−0.83−0.75−0.550.380.540.43−0.54−0.46
Case 12−0.02−0.67−0.86−0.74−0.640.380.540.43−0.54−0.47
Long-term
trends
(mm/year)
Case 128.8139.74−22.71−8.3083.74845.56321.65547.52160.37−41.79
Case 2−14.92−15.67−2.3045.1290.25896.83398.47737.70140.7219.56
Case 385.8189.3316.3059.11229.43832.75434.01683.51206.5716.49
Case 475.9476.113.28−12.09143.92830.89323.71569.31322.23−64.17
Case 532.2020.6923.6941.34150.43882.16400.52759.49302.58−2.82
Case 6132.93125.6942.3055.33289.61818.08436.07705.29368.43−5.90
Case 7103.03124.1821.886.48141.72898.78320.86565.44374.33−24.59
Case 859.3068.7642.2959.90148.23950.05397.67755.62354.6836.76
Case 9160.02173.7660.8973.89287.41885.97433.22701.43420.5333.68
Case 1096.2585.2427.86102.59102.18782.40566.12725.83831.2147.22
Case 1152.5229.8348.27156.01108.68833.67642.93916.01811.56108.57
Case 12153.25134.8366.87170.00247.87769.59678.48861.82877.40105.50
GRACE−0.14−7.84 *−18.91 *−5.96 *−7.51 *4.80 *4.52 *4.72 *−10.26 *−1.326 *
Publisher’s Note: MDPI stays neutral with regard to jurisdictional claims in published maps and institutional affiliations.