Article

Predicting the Potential Distribution Area of the Platanus orientalis L. in Turkey Today and in the Future

by
Özgür Kamer Aksoy
Department of Landscape Architecture, Faculty of Agriculture, Aydın Adnan Menderes University, Aydın 09100, Turkey
Sustainability 2022, 14(18), 11706; https://doi.org/10.3390/su141811706
Submission received: 16 July 2022 / Revised: 30 August 2022 / Accepted: 12 September 2022 / Published: 18 September 2022

Abstract

:
Climate conditions throughout the world clearly affect every aspect of the lives of plants, animals, and humans. Platanus orientalis L. (Oriental plane) is an important tree species for the economy, culture, and forest ecosystems. Recent studies indicate that the climatic conditions significantly affect the distribution areas of Platanus orientalis L. This study aims to model the potential geographical distribution of Platanus orientalis L., which has a natural distribution in Turkey, today and in the future. The geographical distribution of Platanus orientalis L. is under pressure from human activities such as intensive agricultural production, changes in riverbanks, and increased urban development and road construction, and its population is in serious decline. The study produced prediction models using presence data belonging to the species, bio-climatic variables and altitude, and the distributions of the species were determined according to two separate global climate change scenarios. The potential distribution areas of Platanus orientalis L. for the periods 2041–2060 and 2081–2100 under the SSP5 4.5 and SSP5 8.5 scenarios were modelled using MaxEnt 3.4.1. The distribution area of the species in Turkey will be negatively affected by climatic changes due to relatively medium and high increases in the temperature. Platanus orientalis L., which is also found in the Mediterranean basin, the region subject to the most intensive climate changes, will face the risk of extinction unless it is able to adapt to these changes. Results on the current and future potential distributions of Platanus orientalis L. in Turkey provide crucial insights into species’ response to climate change, particularly to increases in temperature. Extent and locations of predicted suitable and unchanged areas for the distribution of Platanus orientalis L. can be used for developing strategies in conservation, management, monitoring, and cultivation of Platanus orientalis L. in the face of climate change.

1. Introduction

Global climate change constitutes one of the most topical issues in the protection of nature, ecology, and the economy. Regardless of its source, climate change is known to have many negative effects on the natural environment and biodiversity. The most prominent changes due to climate change include more frequent extreme global temperatures (on land and in the oceans), increased sea levels, the loss of ice layers and snow cover, and more frequent heavy precipitation and drought [1]. When compared with changes in natural systems and other changes and risks caused by human activity, such as changes in land use and habitat fragmentation, the direct impacts of global climate change on the natural environment and biodiversity occur over a more extended period and are more difficult to observe [2,3]. In addition, climate change is expected to escalate current pressures on the natural environment and biodiversity. From the point of view of the natural environment and biodiversity, forests are one of the ecosystems that are expected to be most affected by the process of climate change and to sustain the most harm in terms of the benefits and services they provide to humans and other species [4,5]. The main negative effects of climate change on forests include the endangerment/extinction of plant and animal species, a decline in their carbon storage potential, interruptions in the other benefits obtained from forests, and the disruption of the balance in the distribution of forest plant species and spatial shifts [6,7,8,9,10].
One of the most significant problems experienced in forest ecosystems due to climate change throughout the world is the changes in the geographical distributions of plant species [11,12,13]. These effects extend over time and are difficult to estimate. For this reason, modelling how climate change will affect the distributions of plant species is one of the most significant tools available for determining the potential risks to species and identifying the measures that can be taken against these risks [14,15,16]. In recent years, researchers from many countries have carried out studies on the potential future distributions of plant species that constitute the building blocks of the forest ecosystem in the face of climate change [17,18,19,20,21]. In this way, the researchers have managed to determine, from the ecological behaviour patterns that species may develop against climate change, whether or not they start seeking new habitats, adapt to new conditions, and/or face extinction [22,23,24,25].
Geographical species distribution models, also known as ecological niche modelling, are based on a knowledge of suitable environmental conditions (e.g., climate, altitude and land use/land cover) and the geographical coordinates of presence data or presence-absence data for the species [26,27,28,29]. Although models requiring presence-absence data for a species possess a high degree of accuracy, presence-absence data cannot always be found for all species. The underlying principle of Maxent is based on a statistical mechanics and information theory. Maxent explores the relative suitability of one place over another using the maximum entropy principle. In other words, Maxent aims to find the most spread out and close-to-uniform probability distribution, which is subject to known constraints and is the best approximation for an unknown distribution. Also, as a presence-only model, Maxent produces and picks background ‘pseudo-absence’ points to characterize unoccupied distribution areas for the species of concern. Machine-learning algorithm of the Maxent model, on the other hand, helps to obtain more accurate results in calculating maximum entropy and approximate distributions (please see [30,31,32,33,34,35]). The maximum entropy (MaxEnt) technique has long been established in ecology, conservation planning, and management to model current and future geographical species distribution for different animal and plant species. One of the most important limitations of the Maxent model is the assumption that systematic or random sampling is done for the selected type over the entire study area [36]. The Maxent has been criticized for underestimating the probability of species’ occurrence within the areas of observed presence, overestimating the probability of species’ occurrence beyond the species’ known extent of occurrence, and producing over-complex or over-simplistic models based on sampling bias [37,38,39,40]. Despite its limitations, the MaxEnt technique makes it possible to carry out modelling using only presence data for the species in question together with the necessary environmental/spatial data. One of the important strengths of MaxEnt model is the ease and simplicity of its implementation [37]. Also, the Maxent model can consider interactions between different environmental variables, can be run with continuous and categorical data types, and can model optimal distribution estimates of the species by associating different variables [41]. Accordingly, an effective use has been made of this technique, particularly over large areas where there is less need for absence data [42,43].
Unfortunately, in Turkey, there is only limited information on the current distributions of forest species that are important for ecosystem services, on the extent of the effects of climate change on these species, and on the environmental factors that affect their geographical distribution the most. Nevertheless, as in the rest of the world, species action plans and management and development plans, as well as biological diversity monitoring and inventory activities, have been gathering momentum. While forests constitute 27% of Turkey’s land area, the Platanus orientalis L. forms mixed forest stands with other species on almost all the forest land in Thrace and the Western and Central Black Sea regions, where it is generally seen in creeks and beside rivers. Platanus orientalis L. is an important element of riparian ecosystems, supporting the conservation of soil and water and maintaining biodiversity and ecological integrity [44,45]. With its resistance to diseases and tolerance to air pollution and different mechanical disturbances, it is an integral part of cultural life, too. Moreover, Platanus orientalis L. is one of the most prevalent monumental trees in Turkey [46,47,48]. Hence, the decrease in the distribution area of Platanus orientalis L. would result in the degradation of many ecosystem services (i.e., flood and erosion control, carbon sequestration, aesthetic, and cultural values). Accordingly, Platanus orientalis L. is a species of great importance for the provision of socio-ecological and various ecosystem services in Europe and Turkey. This study therefore used species distribution modelling (SDM) based on the Maximum Entropy principle to describe the current distribution of Platanus orientalis L. and investigate the potential impacts of climate change on its future distributions for the periods 2041–2060 and 2081–2100 in Turkey under the SSP2 4.5 and SSP5 8.5 scenarios using MaxEnt 3.4.1 (Phillips, New York, NY, USA).

2. Materials

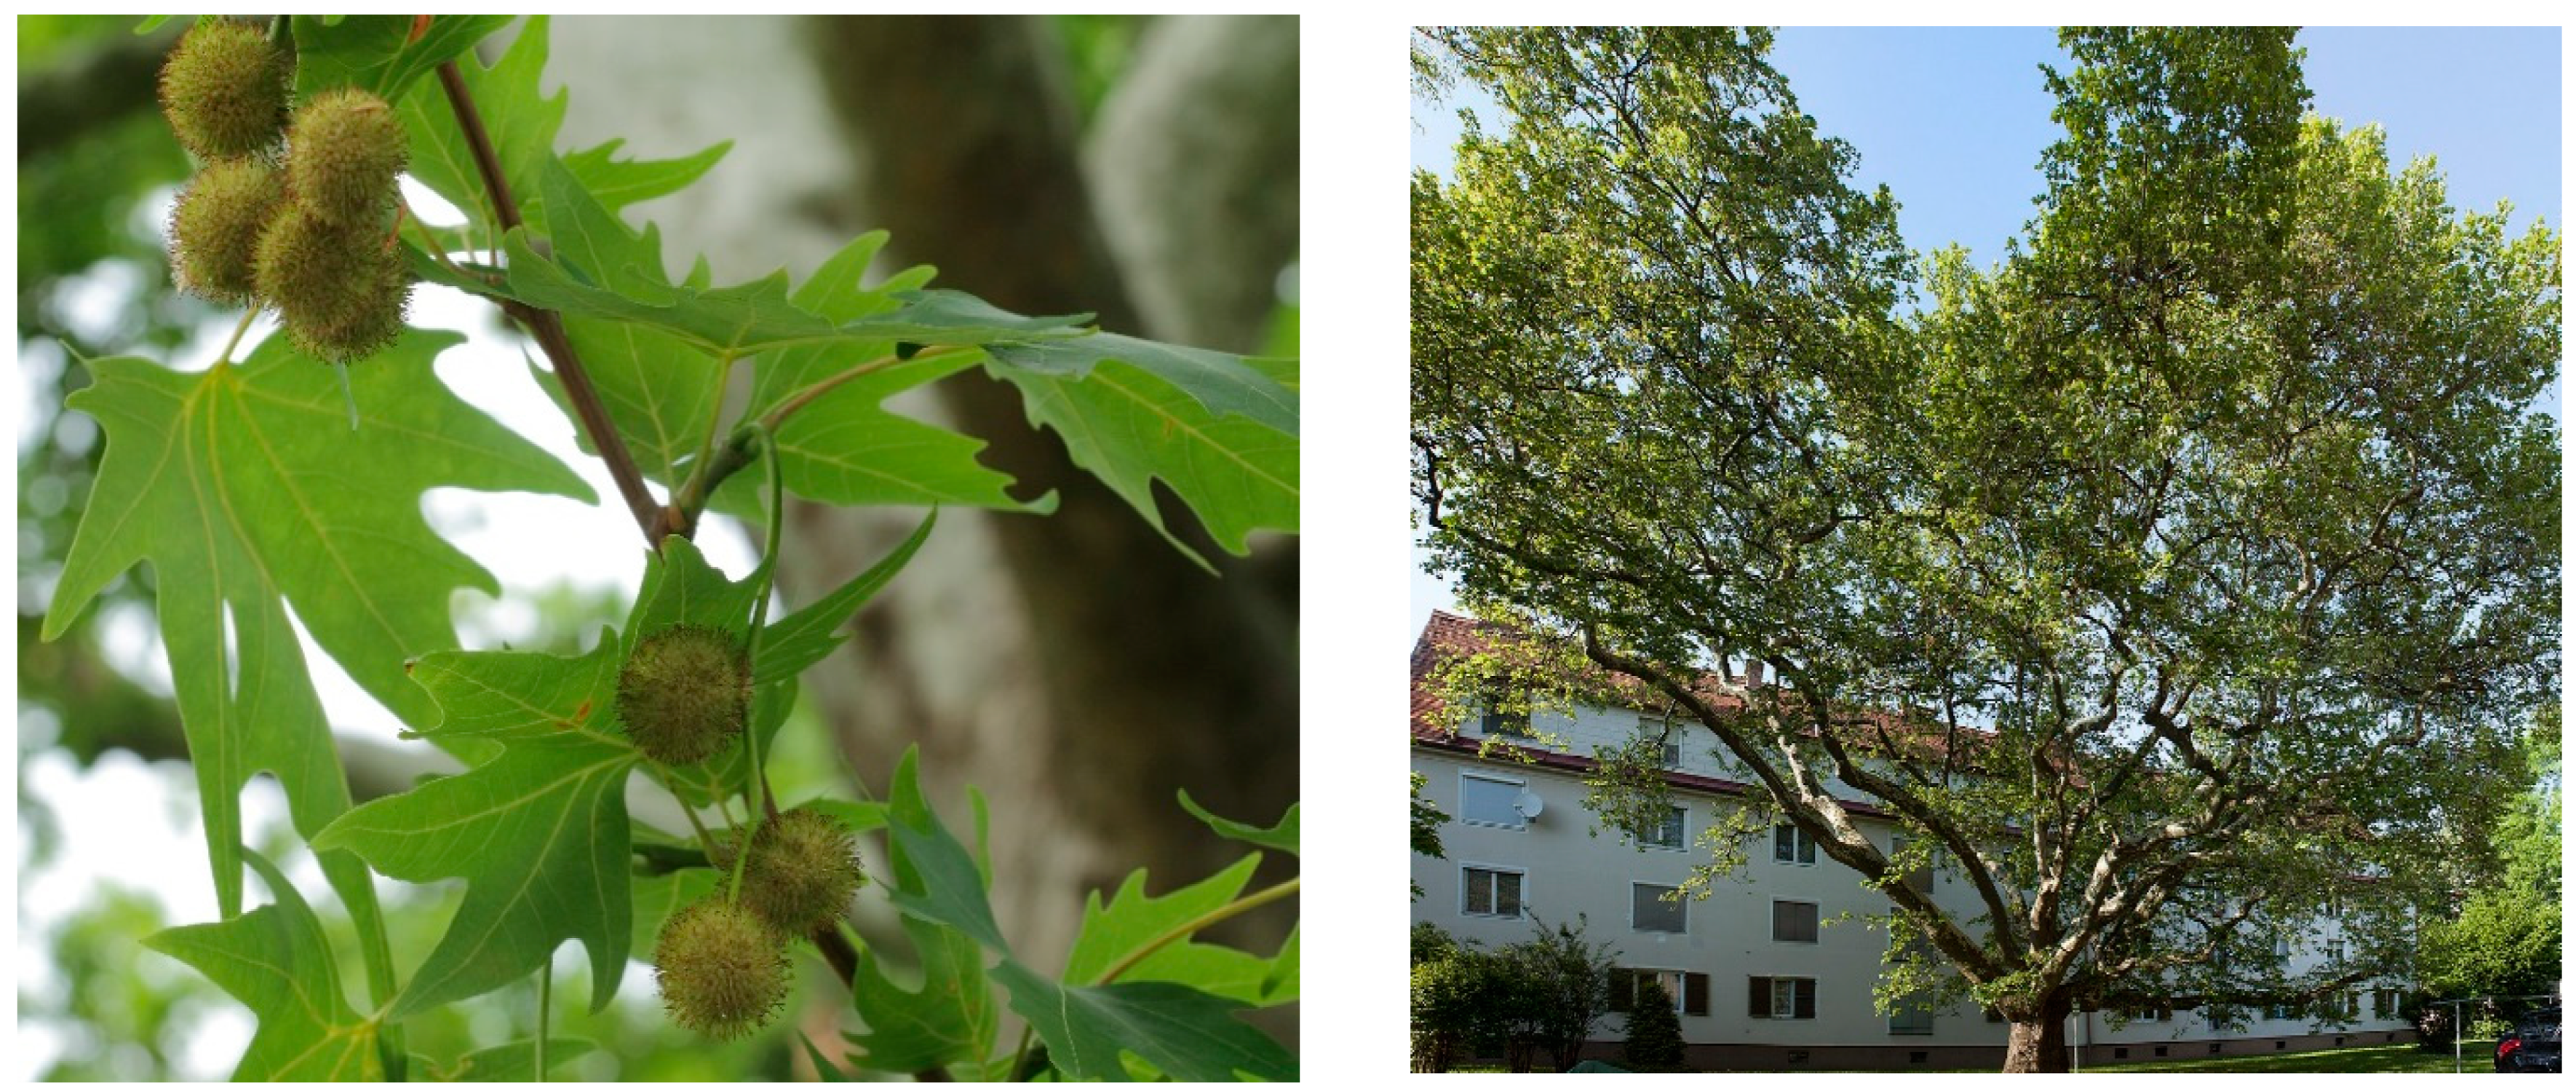
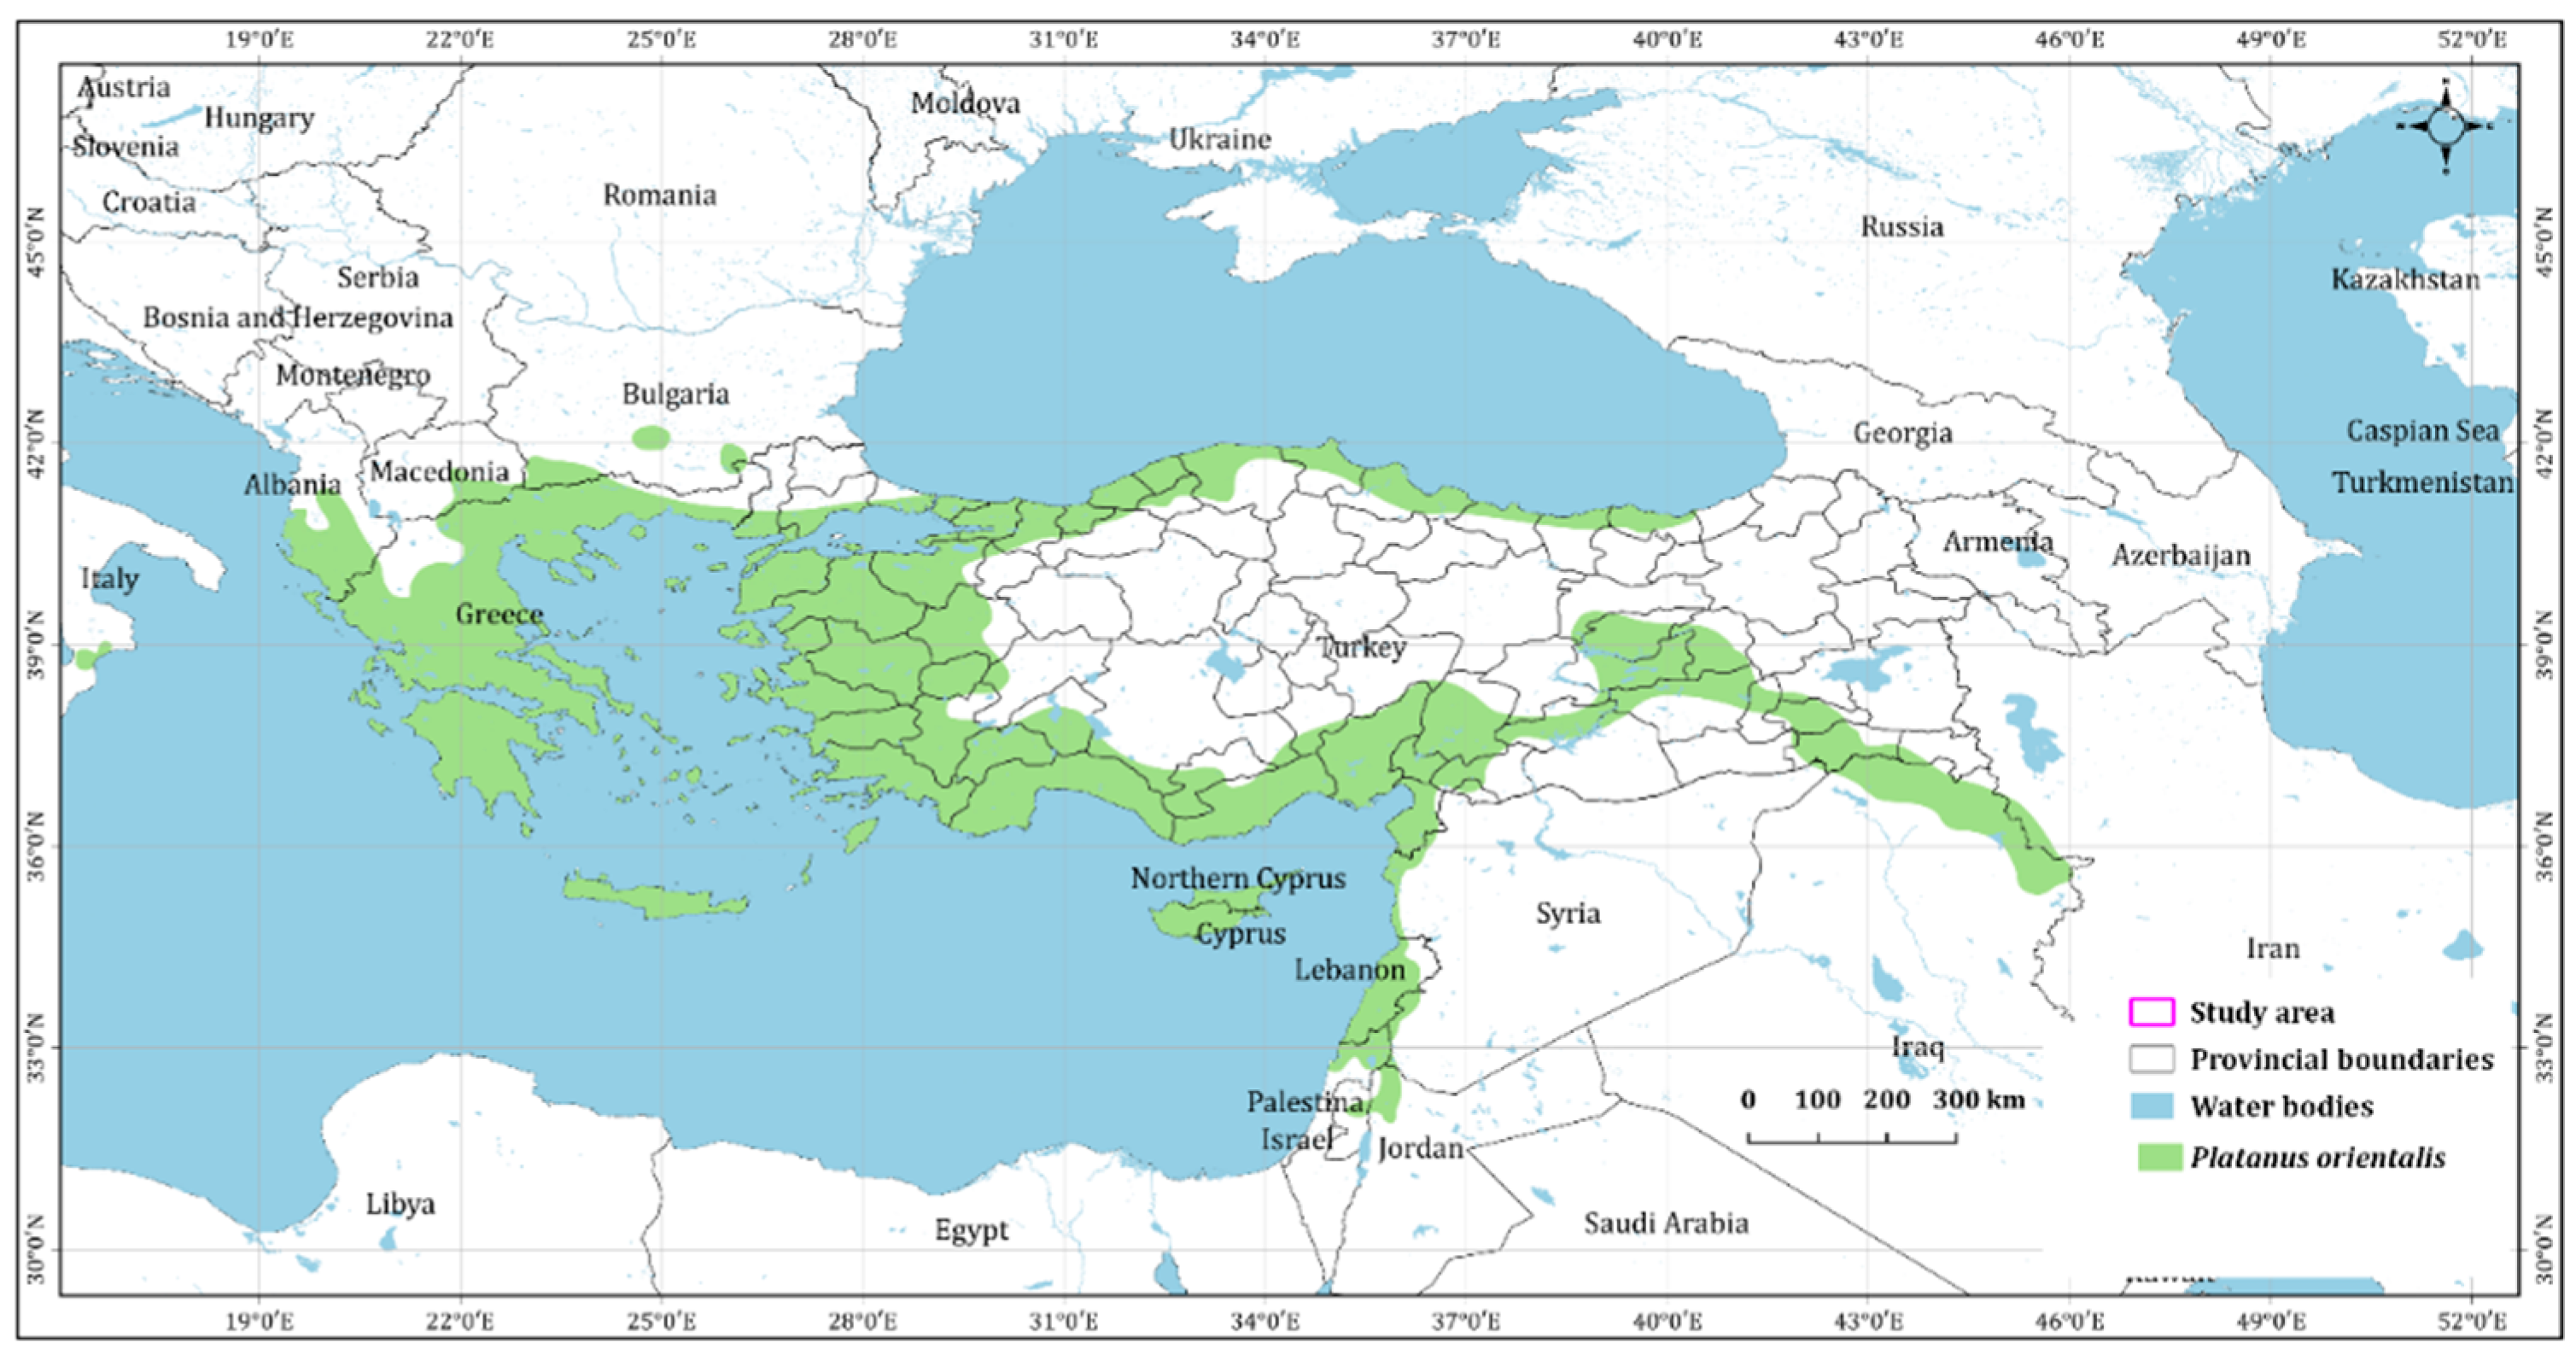
2.1. Platanus orientalis L. and Occurrence Data

Platanus orientalis L. is a member of the Platanaceae family and constitutes one of the commonest types of plane trees in the world (Figure 1). It is a deciduous tree that can grow in mixed forests and is well known for its longevity and rapid growth. In suitable ecological conditions, it can live for up to 500–600 years and grow to a height of 30 m or more, while its trunk can reach 5–6 m in diameter [49]. Platanus orientalis L. can be observed in all forest areas in the northern, western and southern regions of Turkey, inside creeks, by rivers, and in urban areas [49,50] (Figure 2). It is also one of the most frequently reported monumental trees in Turkey and thus has an important place in Turkish culture [51]. The habitat of Platanus orientalis L. has undergone fragmentation as a result of the spread of agricultural activities, the re-routing of waterways, the development of flood control systems by riverbanks, coastal cleansing activities, urban development, and road construction. All this has restricted the living spaces of the species and put pressure on its geographical distribution [52].
For this study, the coordinates of 117 points representing the geographical distribution areas of Platanus orientalis were identified using information from the literature, online databases [53], Flora of Turkey [54], and the BIYOD data of the Ministry of Agriculture and Forestry [55]. These were then plotted on a Google Satellite Hybrid high spatial resolution (5 m) map obtained using the QMS file extension (NextGIS, Tallin, Estonia) in QGIS 3.22.7 (QGIS.org, Grüt (Gossau ZH), Switzerland) (Figure 3).

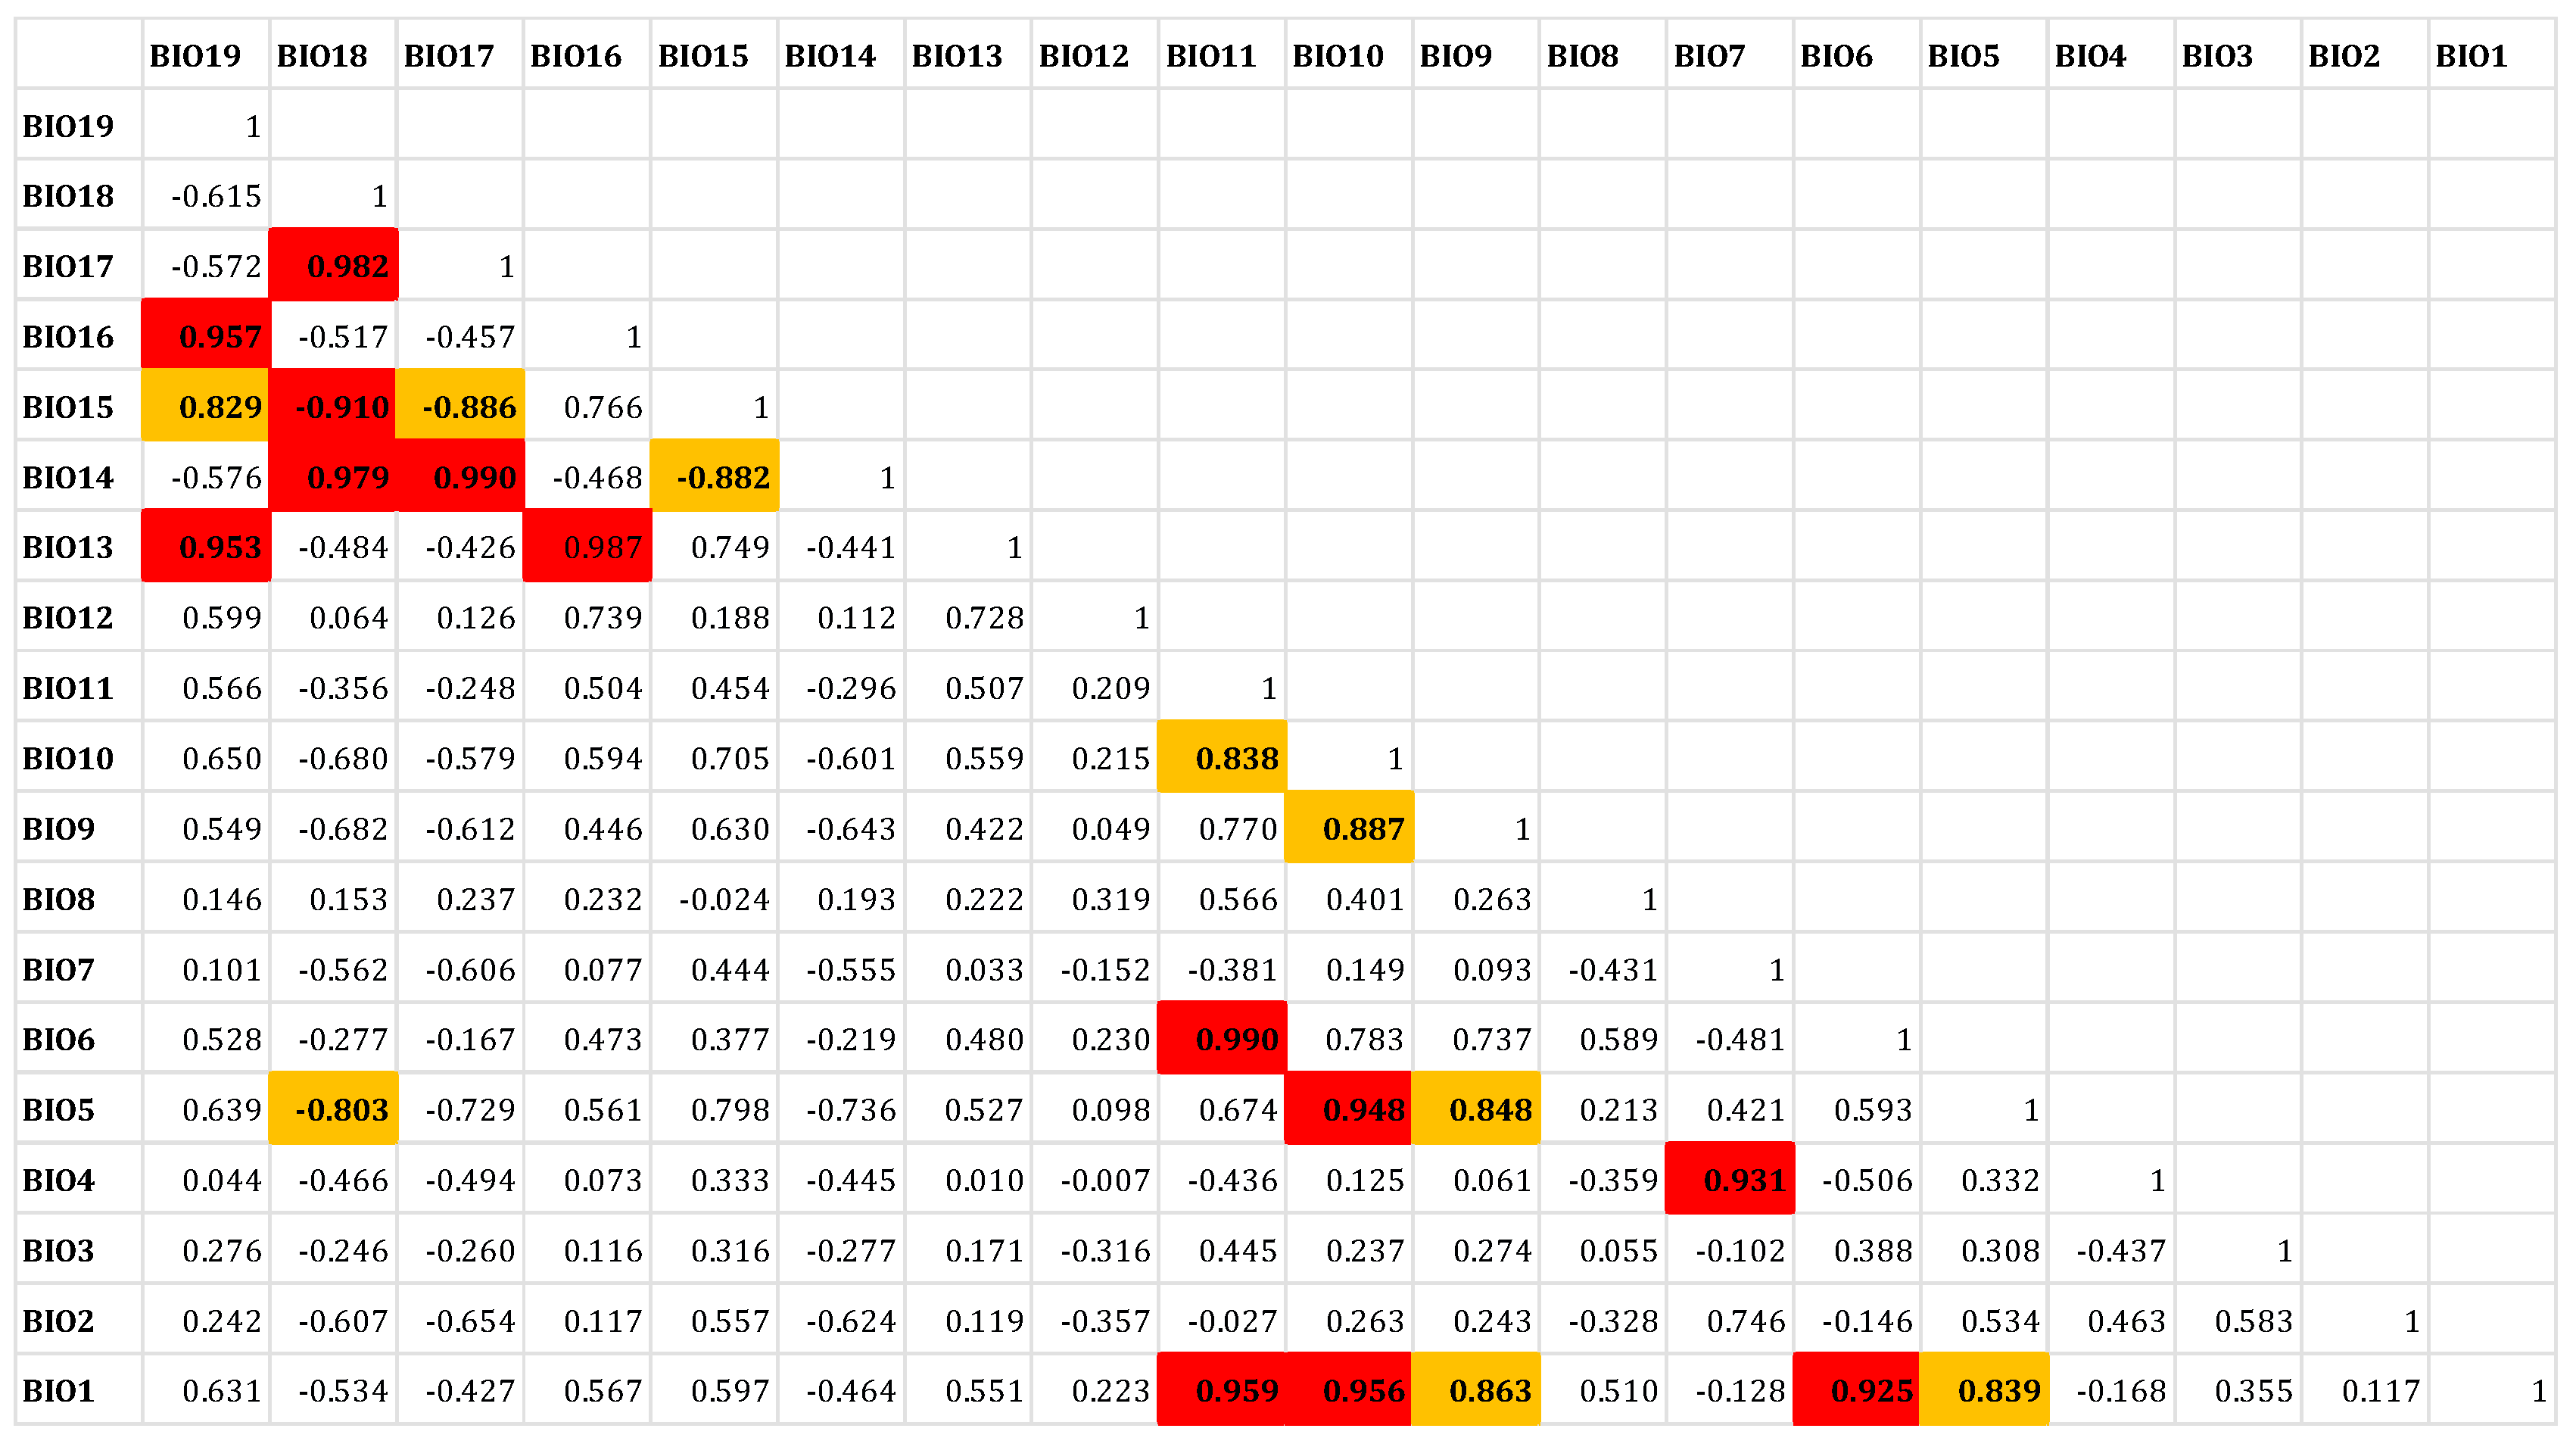
2.2. Environmental Variables

The focus of this paper is the prediction of suitable distribution areas of Platanus orientalis L. under different climate change scenarios. Also, it is well known that the formation of the plant distribution patterns is closely associated with the precipitation and temperature. So, for now, including the other influencing factors, such as human interference factors, it is out of the scope this study. The study made use of the WorldClim database for the prediction of the current and future potential distribution areas of Platanus orientalis. WorldClim 2.1, which was made available in January 2020, provides monthly climate data for minimum, average and maximum temperature, precipitation, solar radiation, wind speed, total precipitation, and water vapour pressure between 1970 and 2000 [56]. The bioclimatic variables used to determine the current distribution area were derived from the data observed in WorldClim 2.1 with a spatial resolution of 2.5 min and are shown in Table 1.

3. Method

The study made use of the CNRM-ESM2-1 climate model developed by the CNRM/CERFACS modelling group to predict the distribution area of the species in the future. As for the scenarios for the study, a series of new scenarios were developed for CMIP6 in the Sixth Evaluation Report (IPCC6) of the Intergovernmental Panel on Climate Change in order to provide a broader future estimate. These scenarios are known as Shared Socioeconomic Pathways (SSPs) and referred to as SSP1-2.6, SSP2-4.5, SSP4-6.0 and SSP5-8.5. The study used the SSP2 4.5 and SSP5 8.5 scenarios for the periods 2041–2060 and 2081–2100.

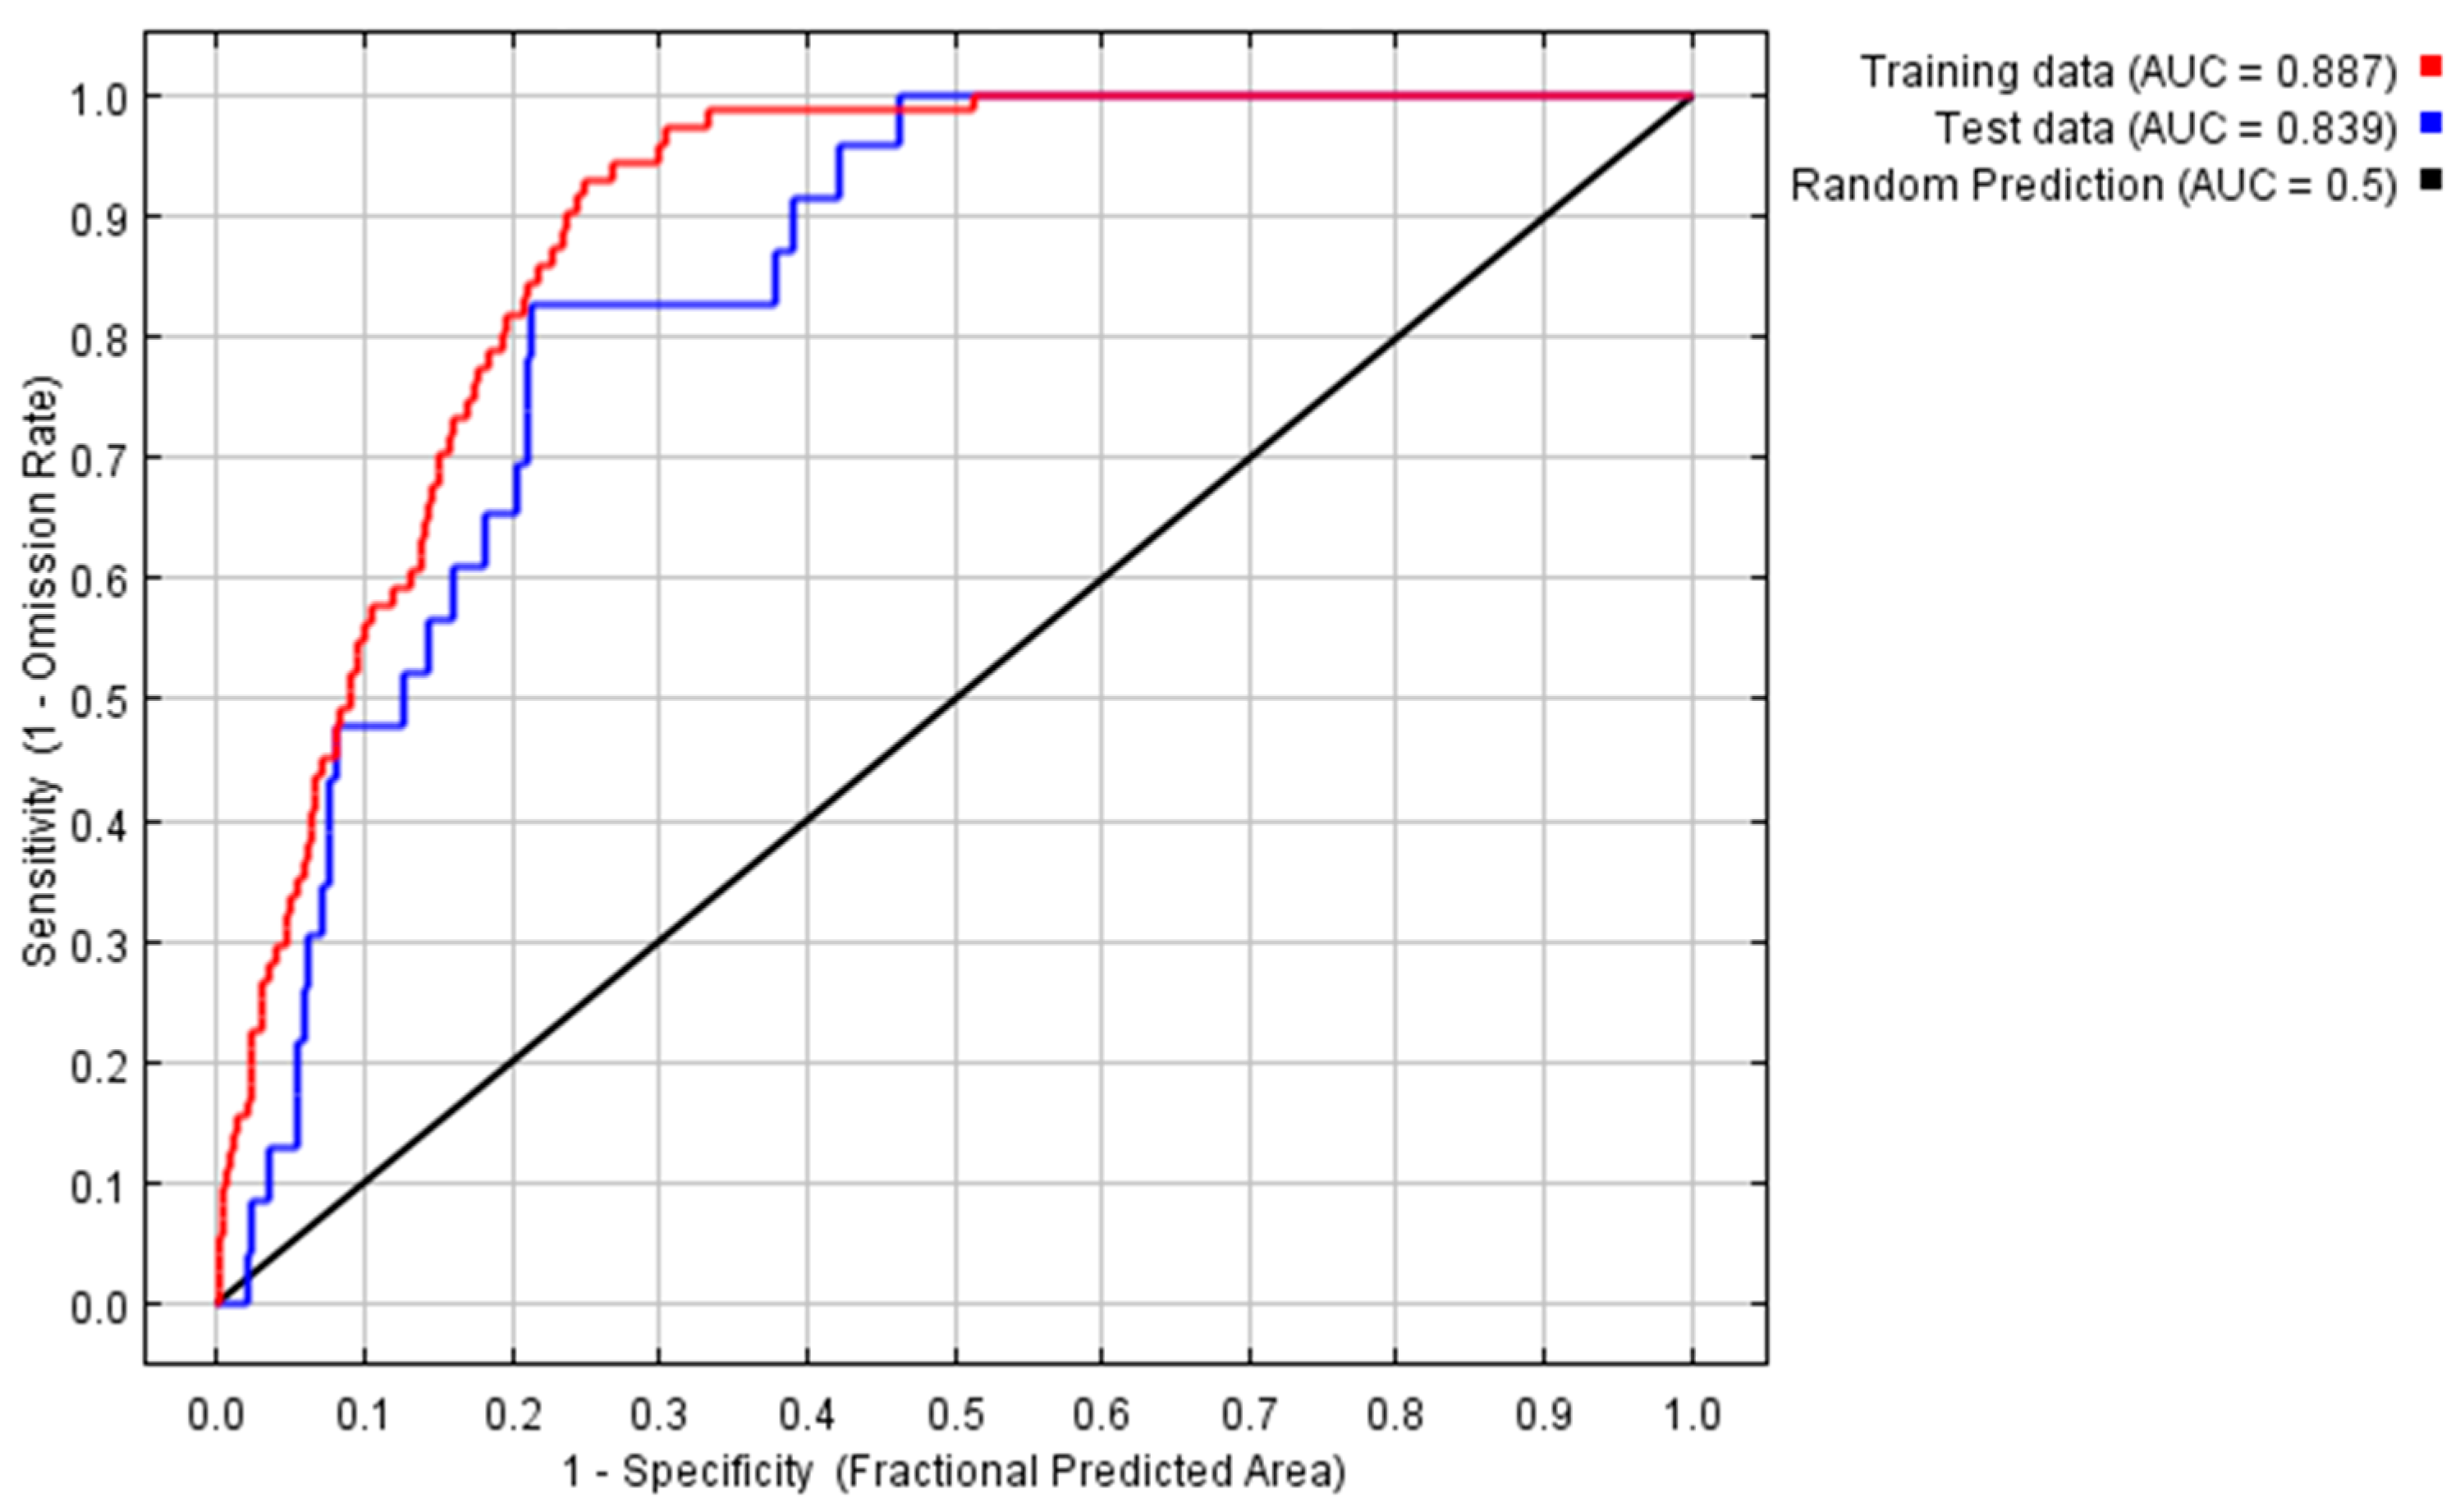
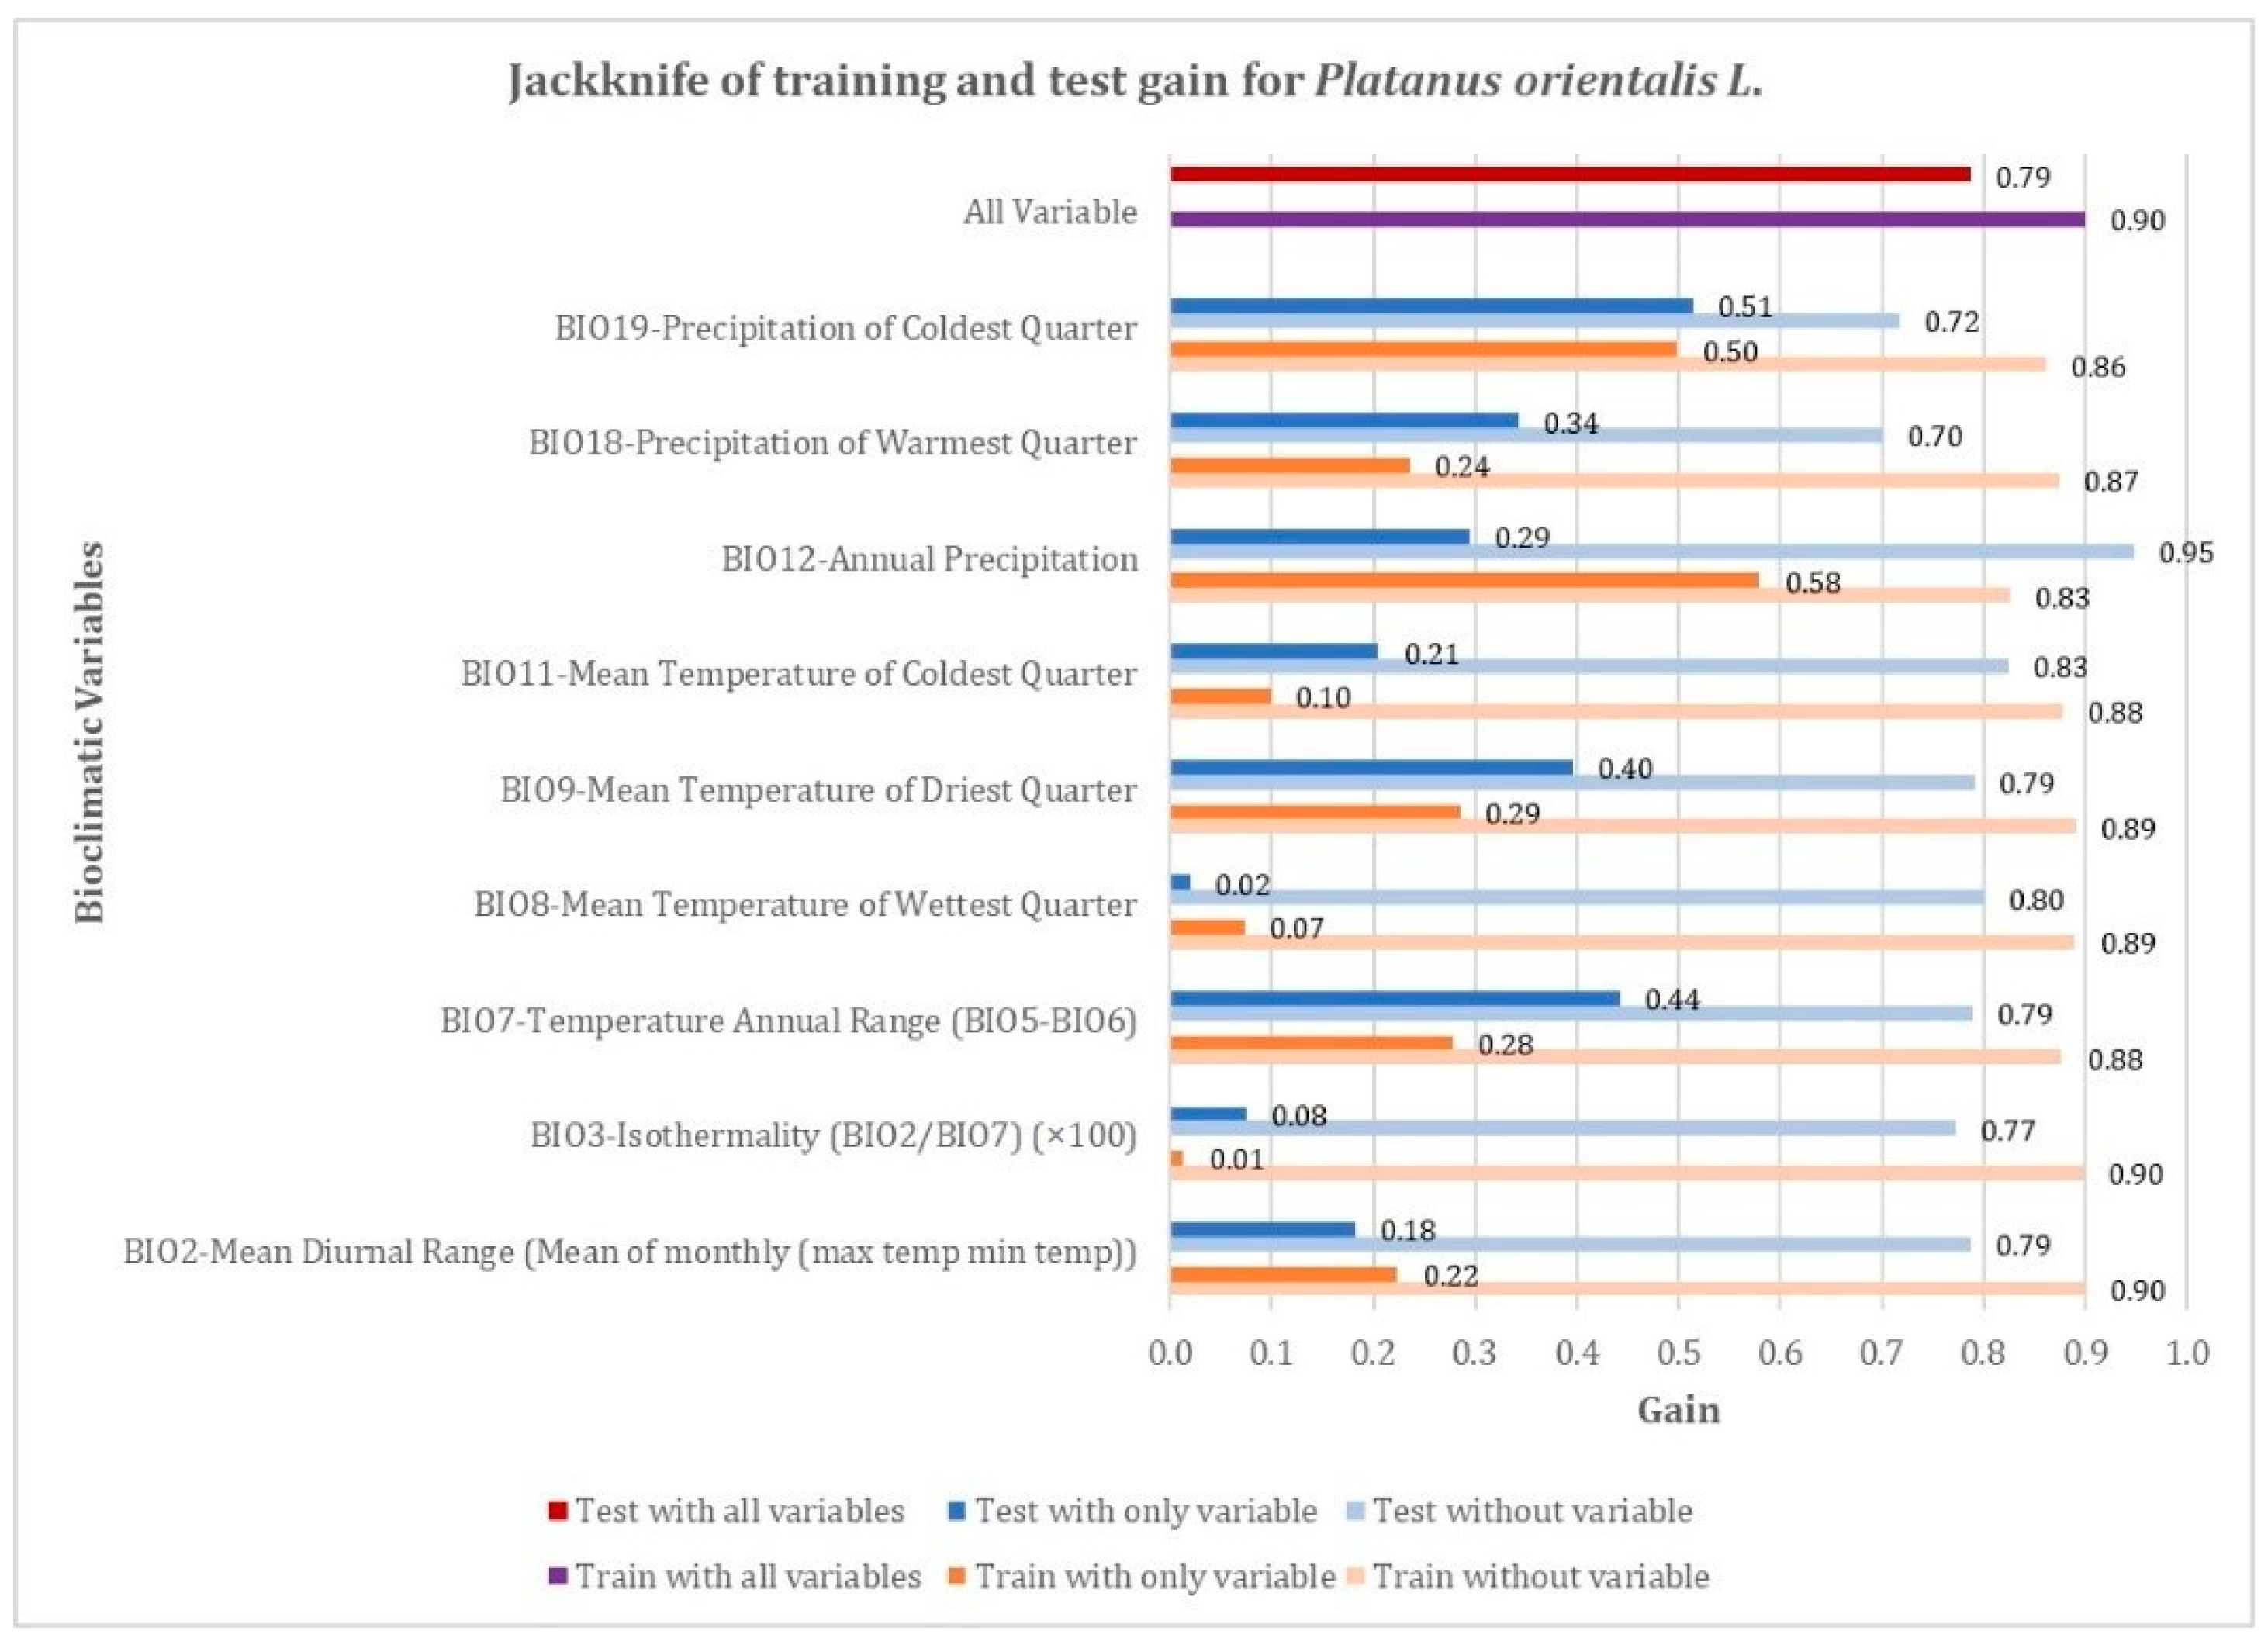
Statistical Analysis and Modelling Method

In order to solve the problem of multicollinearity [57], which reduces the predictive power of the model, the Pearson correlation test in SPSS Statistics 25.0 Fix Pack (IBM, New York, NY, USA) was applied to the 19 bioclimatic variables for the presence data used in the model [58]. In this study, Kolmogorov–Smirnov and Shapiro–Wilk Normality tests were conducted to decide which correlation should be used for this study. Then, because our data is normally distributed, the Pearson correlation test was used. As a result of the test, an effort was made to eliminate the problem of multicollinearity by removing one of the variables with a Pearson correlation coefficient (r) of ±0.8 and above [59,60]. The MaxEnt 3.41 software, a correlative machine learning model based on the maximum entropy algorithm, was used in the study because of its high performance with small sample sizes. The MaxEnt algorithm uses the principle of maximum entropy. It means that the probability distribution representing the best current state of knowledge has the one with largest entropy, in the context of precisely stated prior data. As the modelling procedure in MaxEnt 3.4.1, 25% of the presence data belonging to the species (117 points) was set aside as test data, and the program was run after selecting the Linear, Threshold, Quadratic, and Hinge features since the number of background points was 10,000 and the number of points was 80 or above. Use was made of the Area Under the ROC Curve (AUC) value obtained from analysis of the Receiver Operating Characteristic (ROC) to determine the performance of the model. The AUC value obtained can be interpreted as the estimated probability of the presence of a randomly chosen grid cell in an accurately designed model. The AUC defines the success of the model at all possible thresholds. If the AUC value is AUC > 0.5, this means that the model performs better than a random guess [61]. The nearer the AUC test value is to 1, the greater the distinction and the more sensitive and definitive the model [62]. To interpret the AUC value, threshold values were set as follows: AUC ≥ 0.9 = very good, 0.9 > AUC ≥ 0.8 = good, and AUC < 0.8 = weak [63,64]. Finally, the jackknife test option in the MaxEnt modelling program was used to determine the contributions of the environmental variables [65,66]. This option makes it possible to identify the degrees of significance of each of the independent variables in establishing the model.
MaxEnt produces a continuous raster with values ranging from 0 to 1, representing relative habitat suitability. There is no set rule to establish thresholds; model performance instead depends on the data used or the mapping objective, and therefore varies among species. From our MaxEnt analysis, we obtained threshold values based on a variety of statistical measures; these values were saved in a file called “maxentResults.csv”. Some of the most used thresholds are a minimum training presence logistic threshold, 10th percentile training presence logistic threshold, and equal training sensitivity and specificity logistic threshold [62]. In this study, 10th percentile training presence logistic thresholds were applied. The results of the model were converted into distribution maps with the QGIS 3.22.7 program using the raster/vector conversion function. In the MaxEnt model, the presence of a species in an area is stated using a value of between 0 and 1. As the value approaches 1, the potential presence of the species in the area increases. On the potential distribution maps created for today and the future, the degrees of suitability of the areas for the spread of the species were categorized as follows: 0 = not suitable, 0–0.25 = slightly suitable, 0.25–0.50 = somewhat suitable, 0.50–0.75 = suitable, and 0.75–1 = very suitable. This classification for relative suitability degrees was determined on the basis of previous successful cases in the literature [67,68,69]. Such an equal interval classification allowed the comparison of potential distributions of Platanus orientalis L. created for today and the future, highlighting changes in the extreme values in our maps. The predicted distribution areas for today and in the future were then calculated in square kilometers according to this classification [67,70]. Finally, a change analysis was conducted for the comparison of the predicted distribution areas of Platanus orientalis L. for the periods of 2041–2060 and 2081–2100 in the SSP2 4.5 and SSP5 8.5 scenarios with the current potential distribution areas. In order to detect the change, the suitability categories were coded 0 = 0, 0–0.25 = 1, 0.25–0.50 = 2 0.50–0.75 = 3, and 0.75–1 = 4, and then the potential distribution maps were intersected. Areas with the suitability values 0–0 were treated as “unsuitable” areas, areas that remained in the same category as “stable” areas, areas that moved up to a higher category as “gains”, and areas that moved down to a lower category as “losses”. The total extent of each of these areas was calculated in square meters and change maps were drawn to display the direction and size of the change.

4. Results

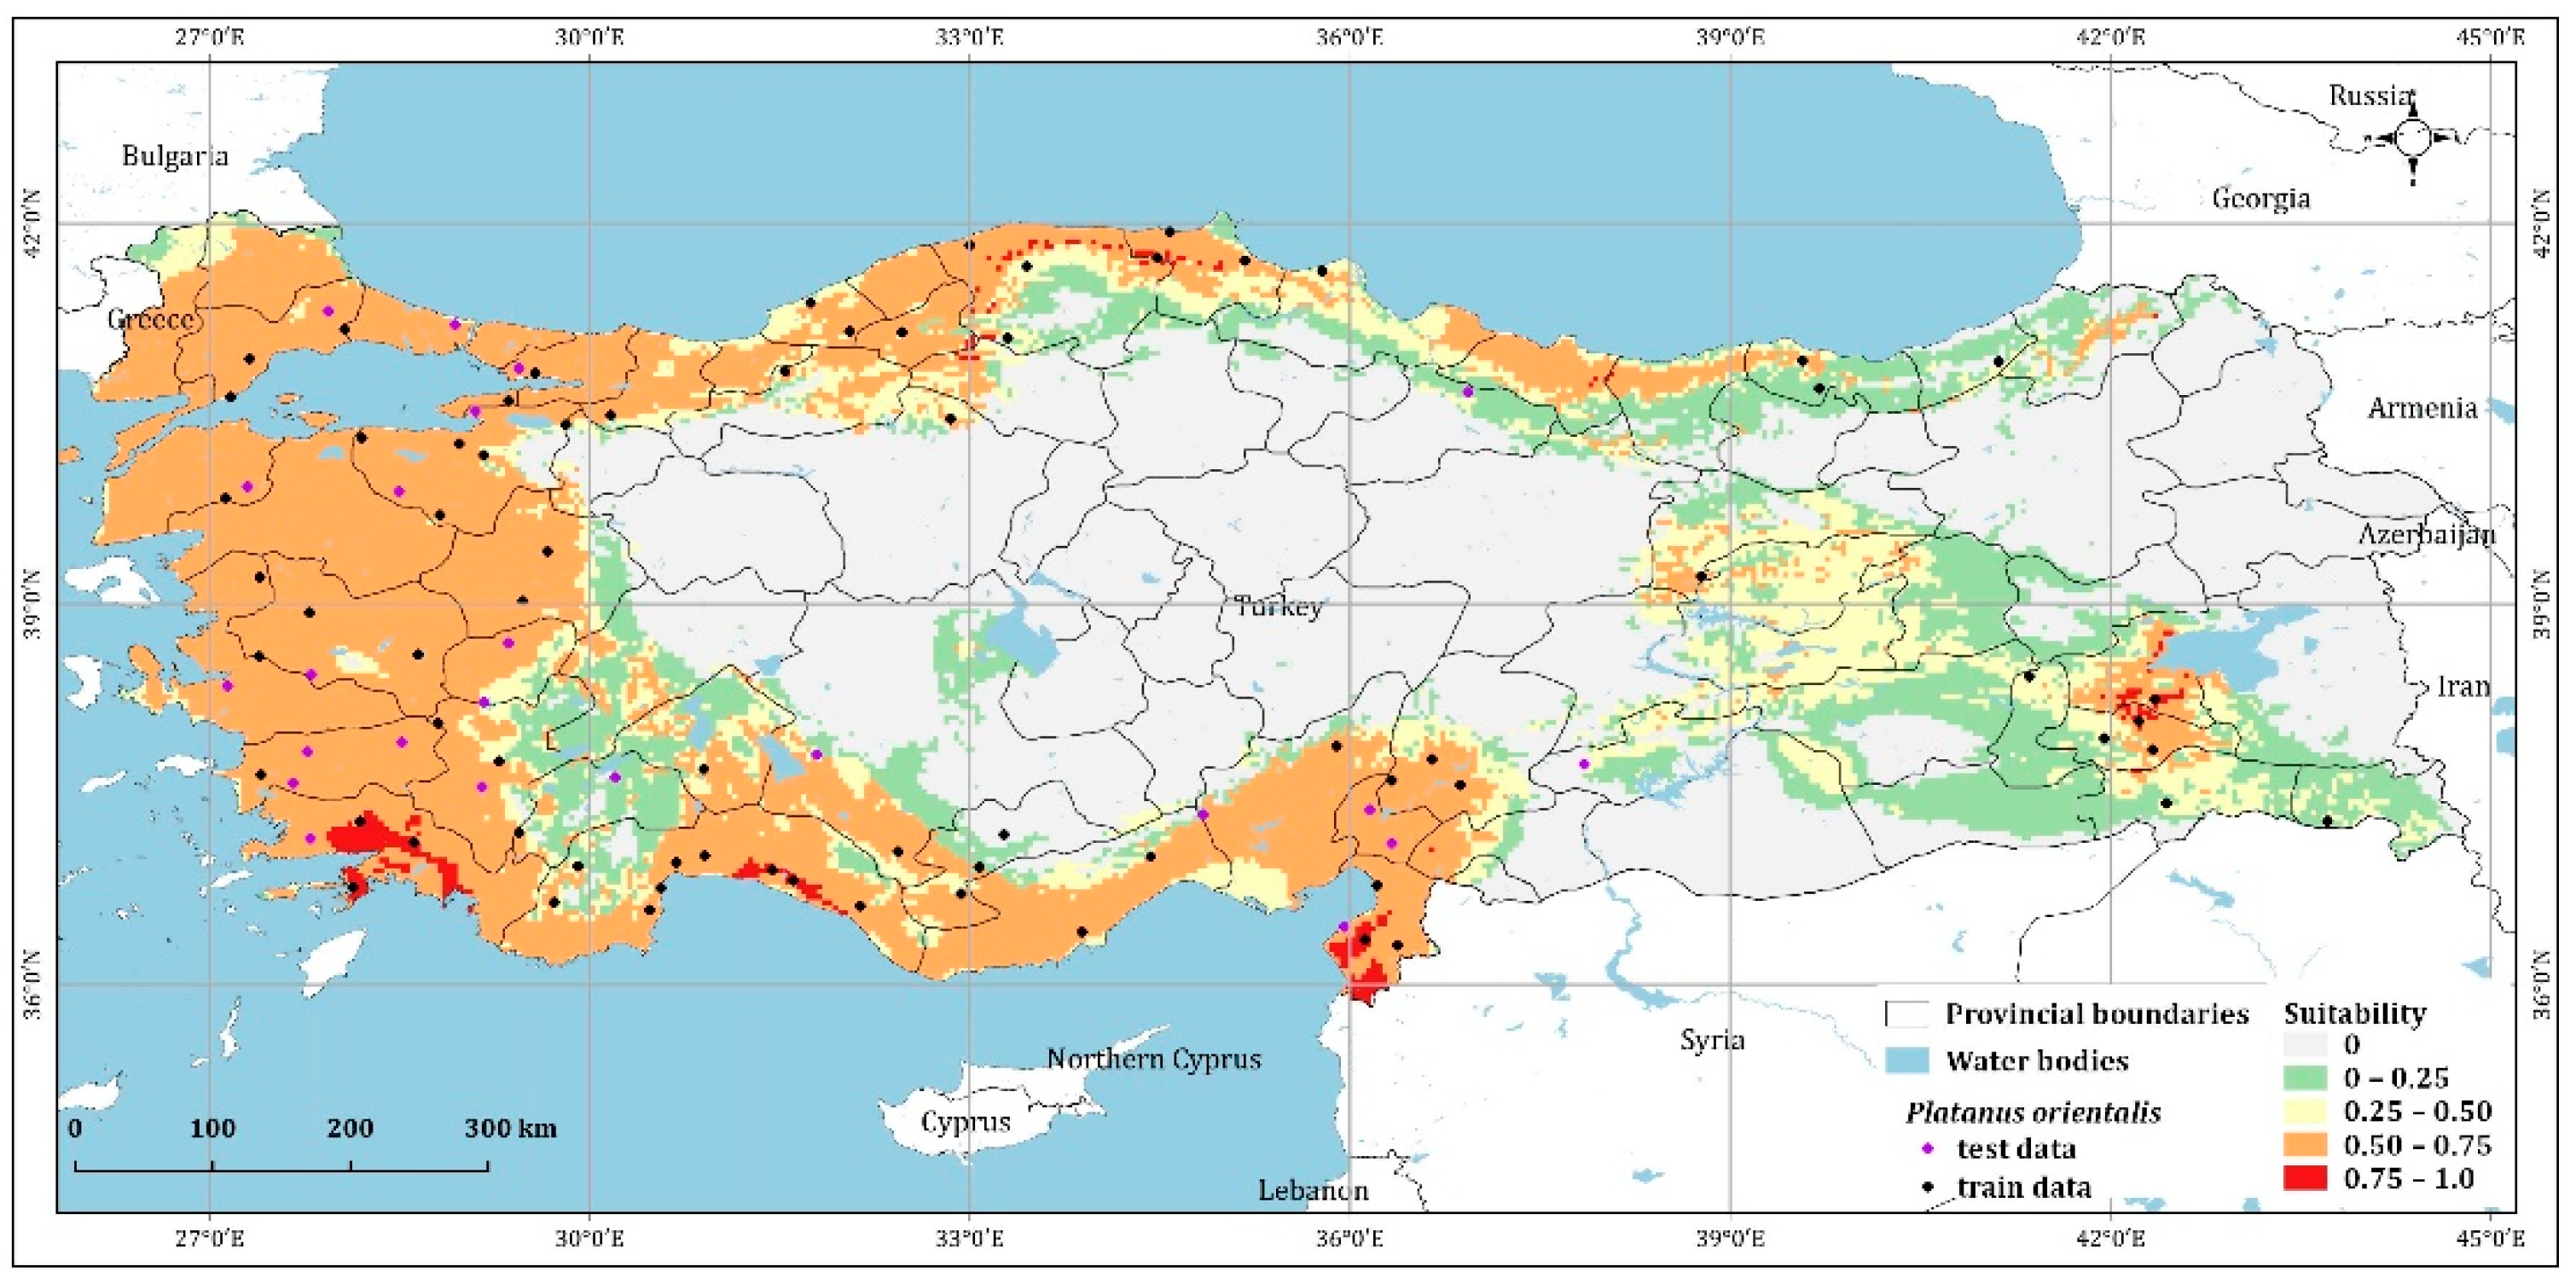
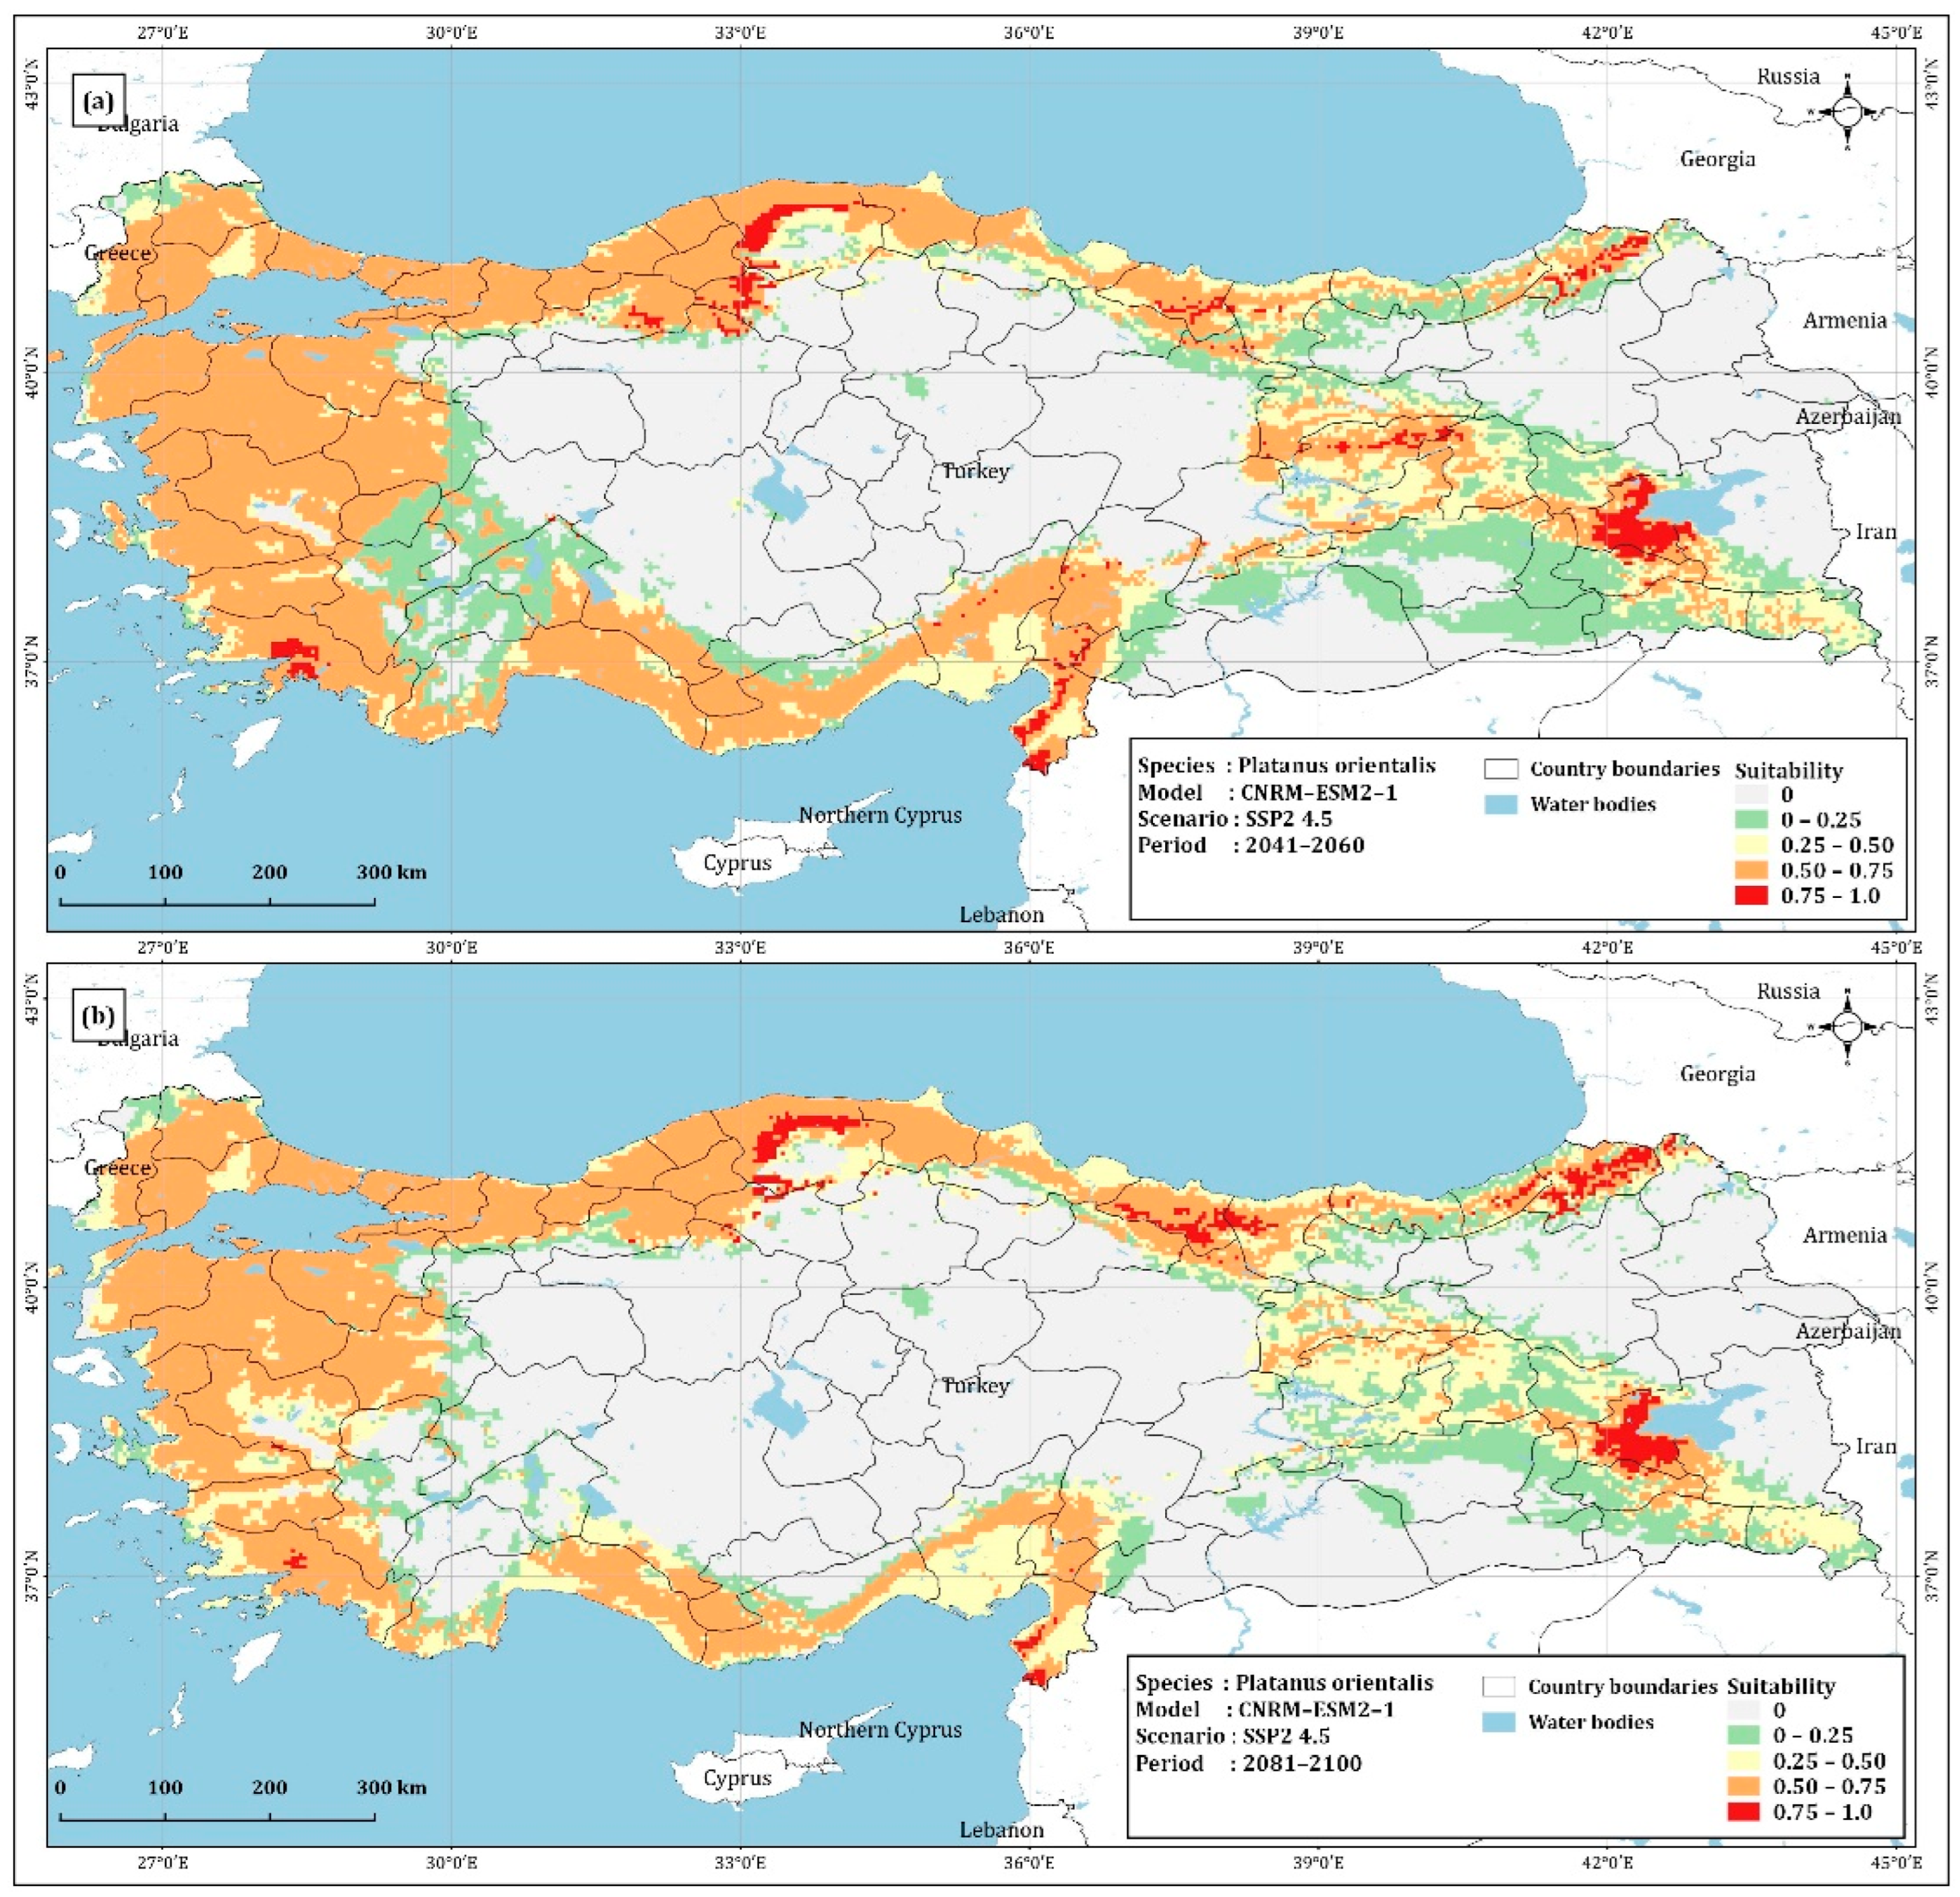
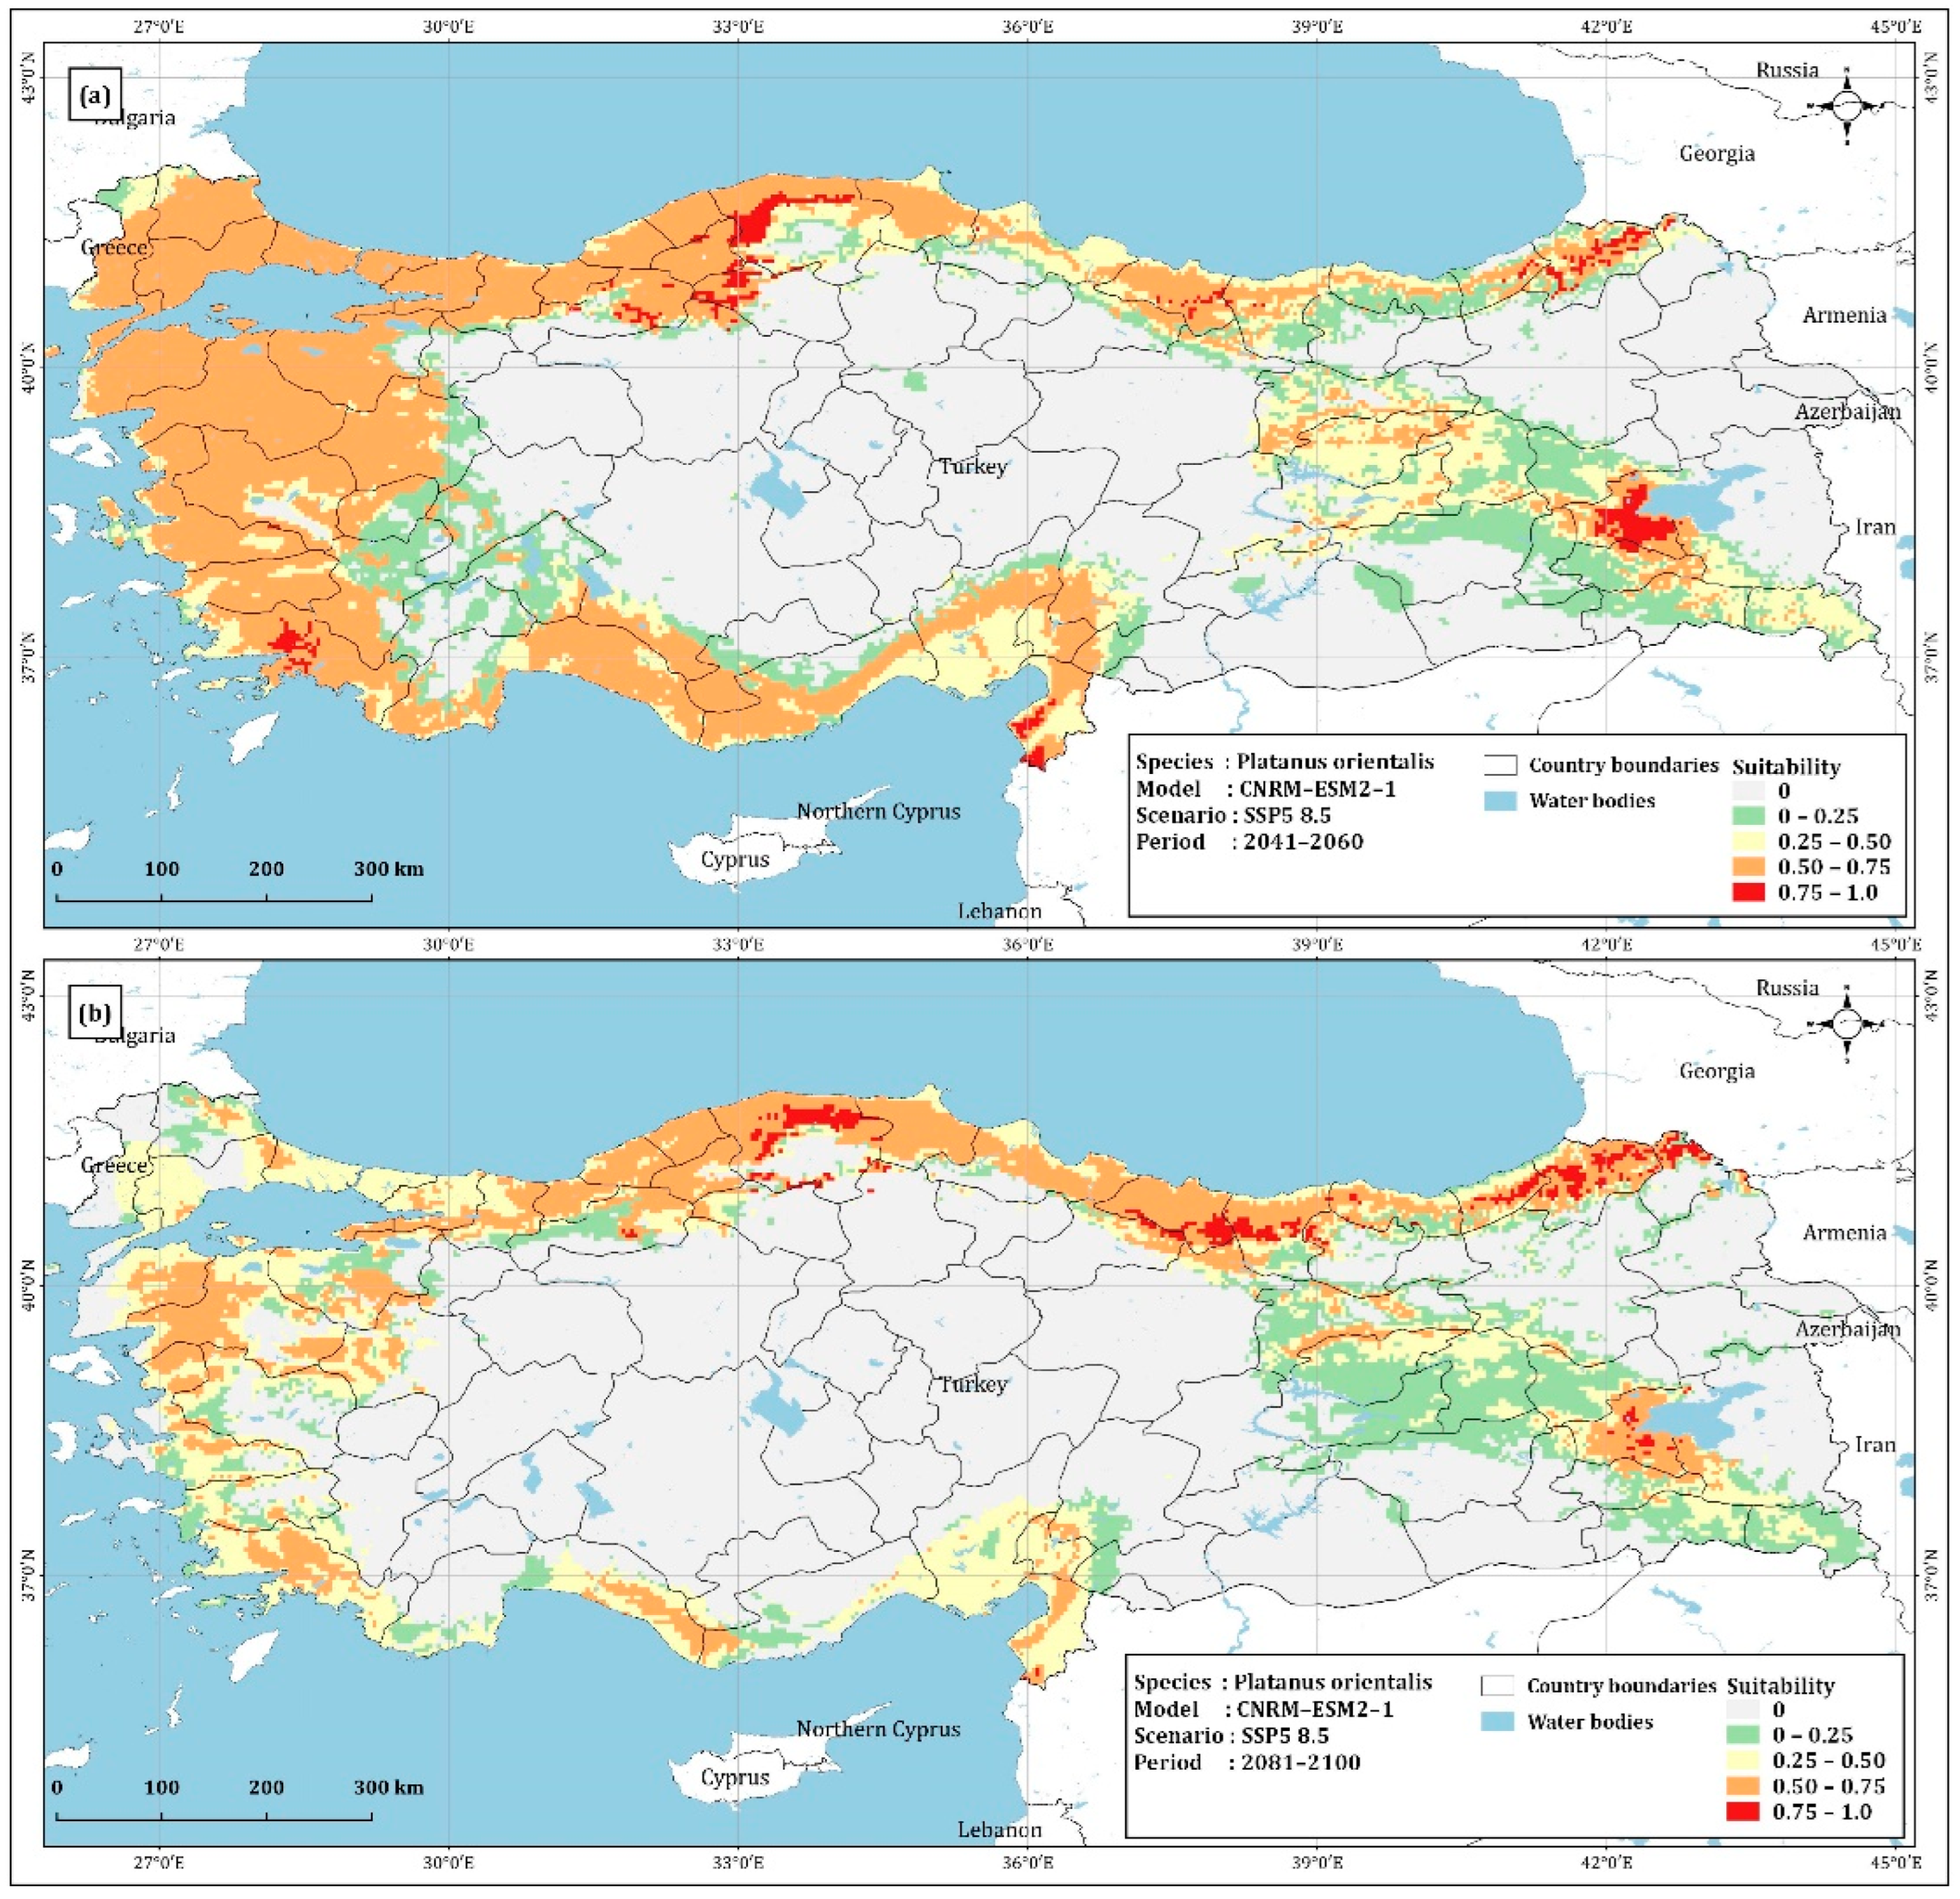
4.1. Prediction of Platanus Orientalis Recent and Future Spatial Distribution

The results of the Pearson correlation test, carried out as specified in the Section 2 to solve the problem of multicollinearity, are shown in Figure 4. Variables greater than r > ±8 and which weaken the predictive strength of the model were removed and the variables BIO2, BIO3, BIO7 (r > ±8—BIO4), BIO8, BIO9 (r > ±8—BIO10, BIO5), BIO11 (r > ±8—BIO6, BIO1), BIO12, BIO18 (r > ±8—BIO17, BIO15, BIO14), and BIO19 (r > ±8—BIO16, BIO13) were used in the model.
The AUC value worked out at 0.887 with a standard deviation of 0.005 (Figure 5). The closer the AUC test value is to 1, the better the discrimination, the more precise and descriptive the model [62]. Since it is between 0.8 and 0.9, the predictive ability of the model is defined as strong and is considered to be much more accurate than random predictions [63,64]. According to the results of the jackknife test, the variable producing the greatest gain when used on its own was the annual precipitation (BIO12). This was thus accepted as the variable providing the most useful information when used alone. The bioclimatic variable that most reduces the gain when ignored was, once again, the annual precipitation. The BIO12 variable is thus considered to be the variable that encompasses the most information not provided by other variables (Figure 6).
The prediction models for the potential geographical distributions of Platanus orientalis L. today and in the future are shown in Figure 7, Figure 8 and Figure 9. The maps make it possible to observe the spatial distribution of Platanus orientalis L. today and in the future. When the current distribution map obtained from model outputs is examined, it can be seen to display a high level of similarity with the natural distribution areas of Platanus orientalis L.
While the total coverage of the suitable and very suitable areas where the species is distributed today is approximately 230,000 km2, an examination of the future geographical distributions under climate change scenarios predicted in the model maps produced for the periods 2041–2060 (Figure 8) and 2081–2100 (Figure 9) shows that this area is predicted to increase to 243,783 km2 in 2041–2060 and then decline to 198,351 km2 in 2081–2100 under the SSP2 4.5 scenario. According to the SSP5 8.5 scenario, which is more pessimistic than SSP2 4.5, the areas categorized as suitable and very suitable are predicted to cover 213,820 km2 in the 2041–2060 period and 100,056 km2 in 2081–2100 (Table 2).

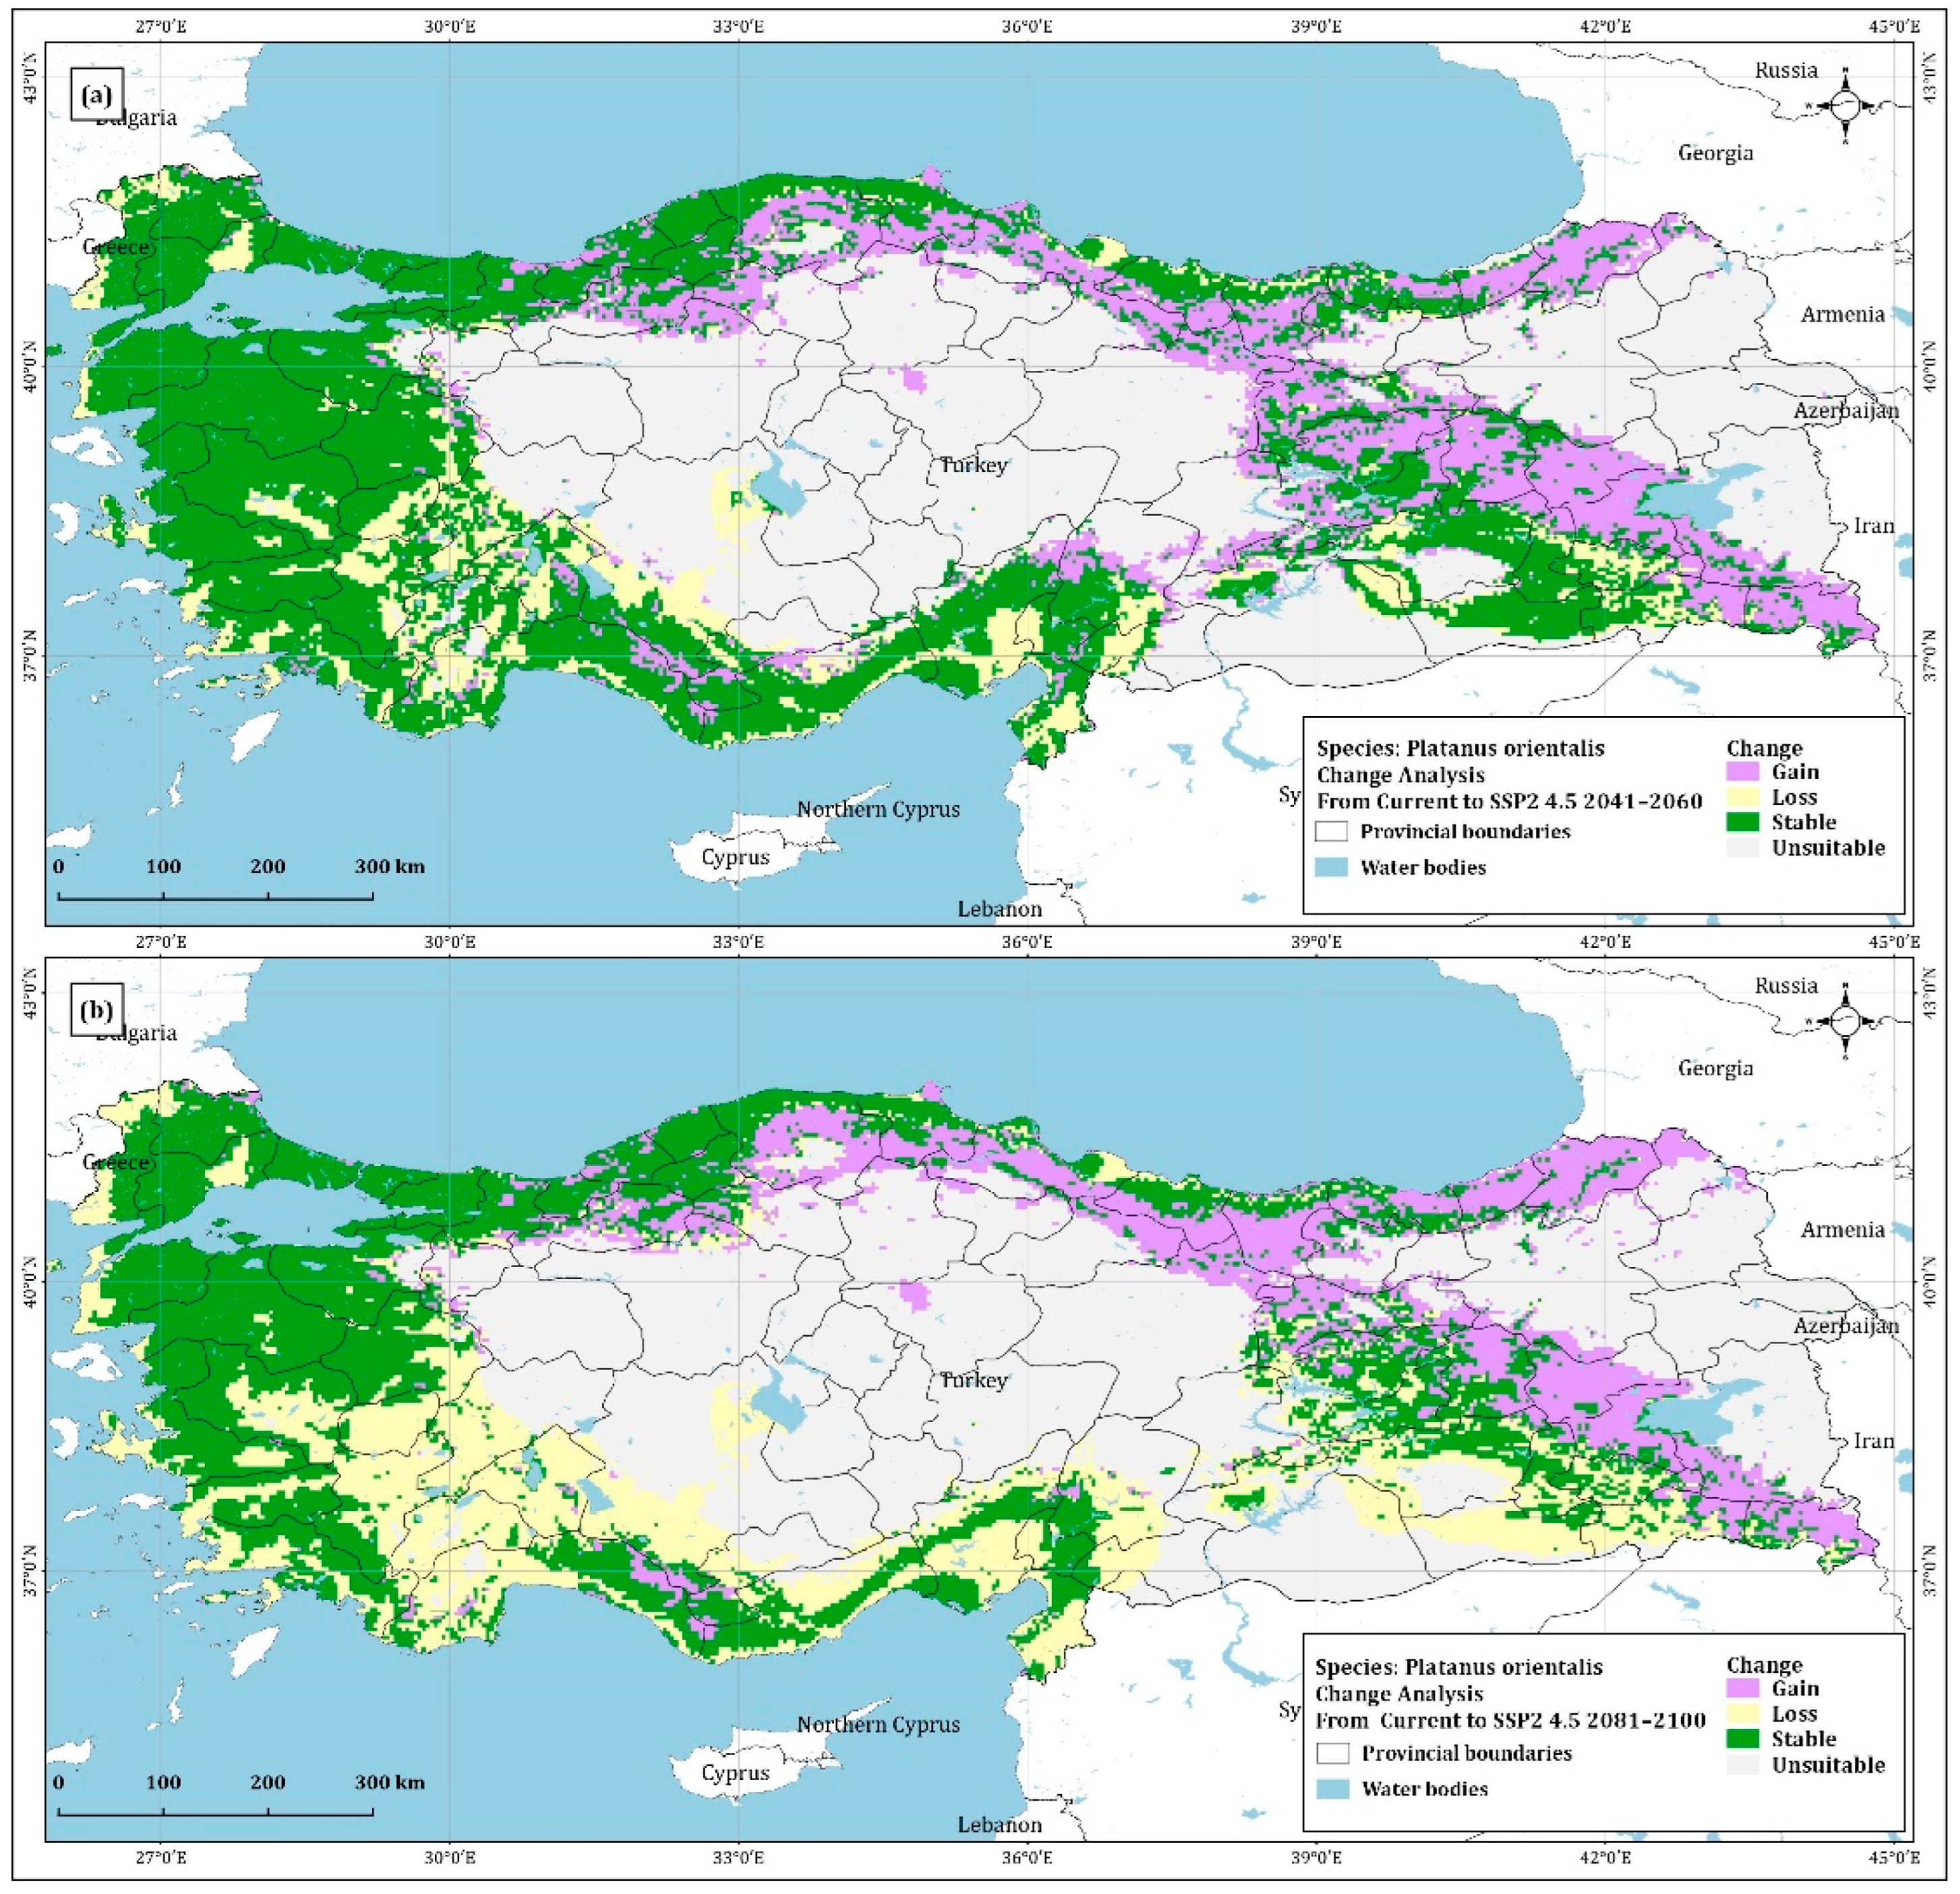
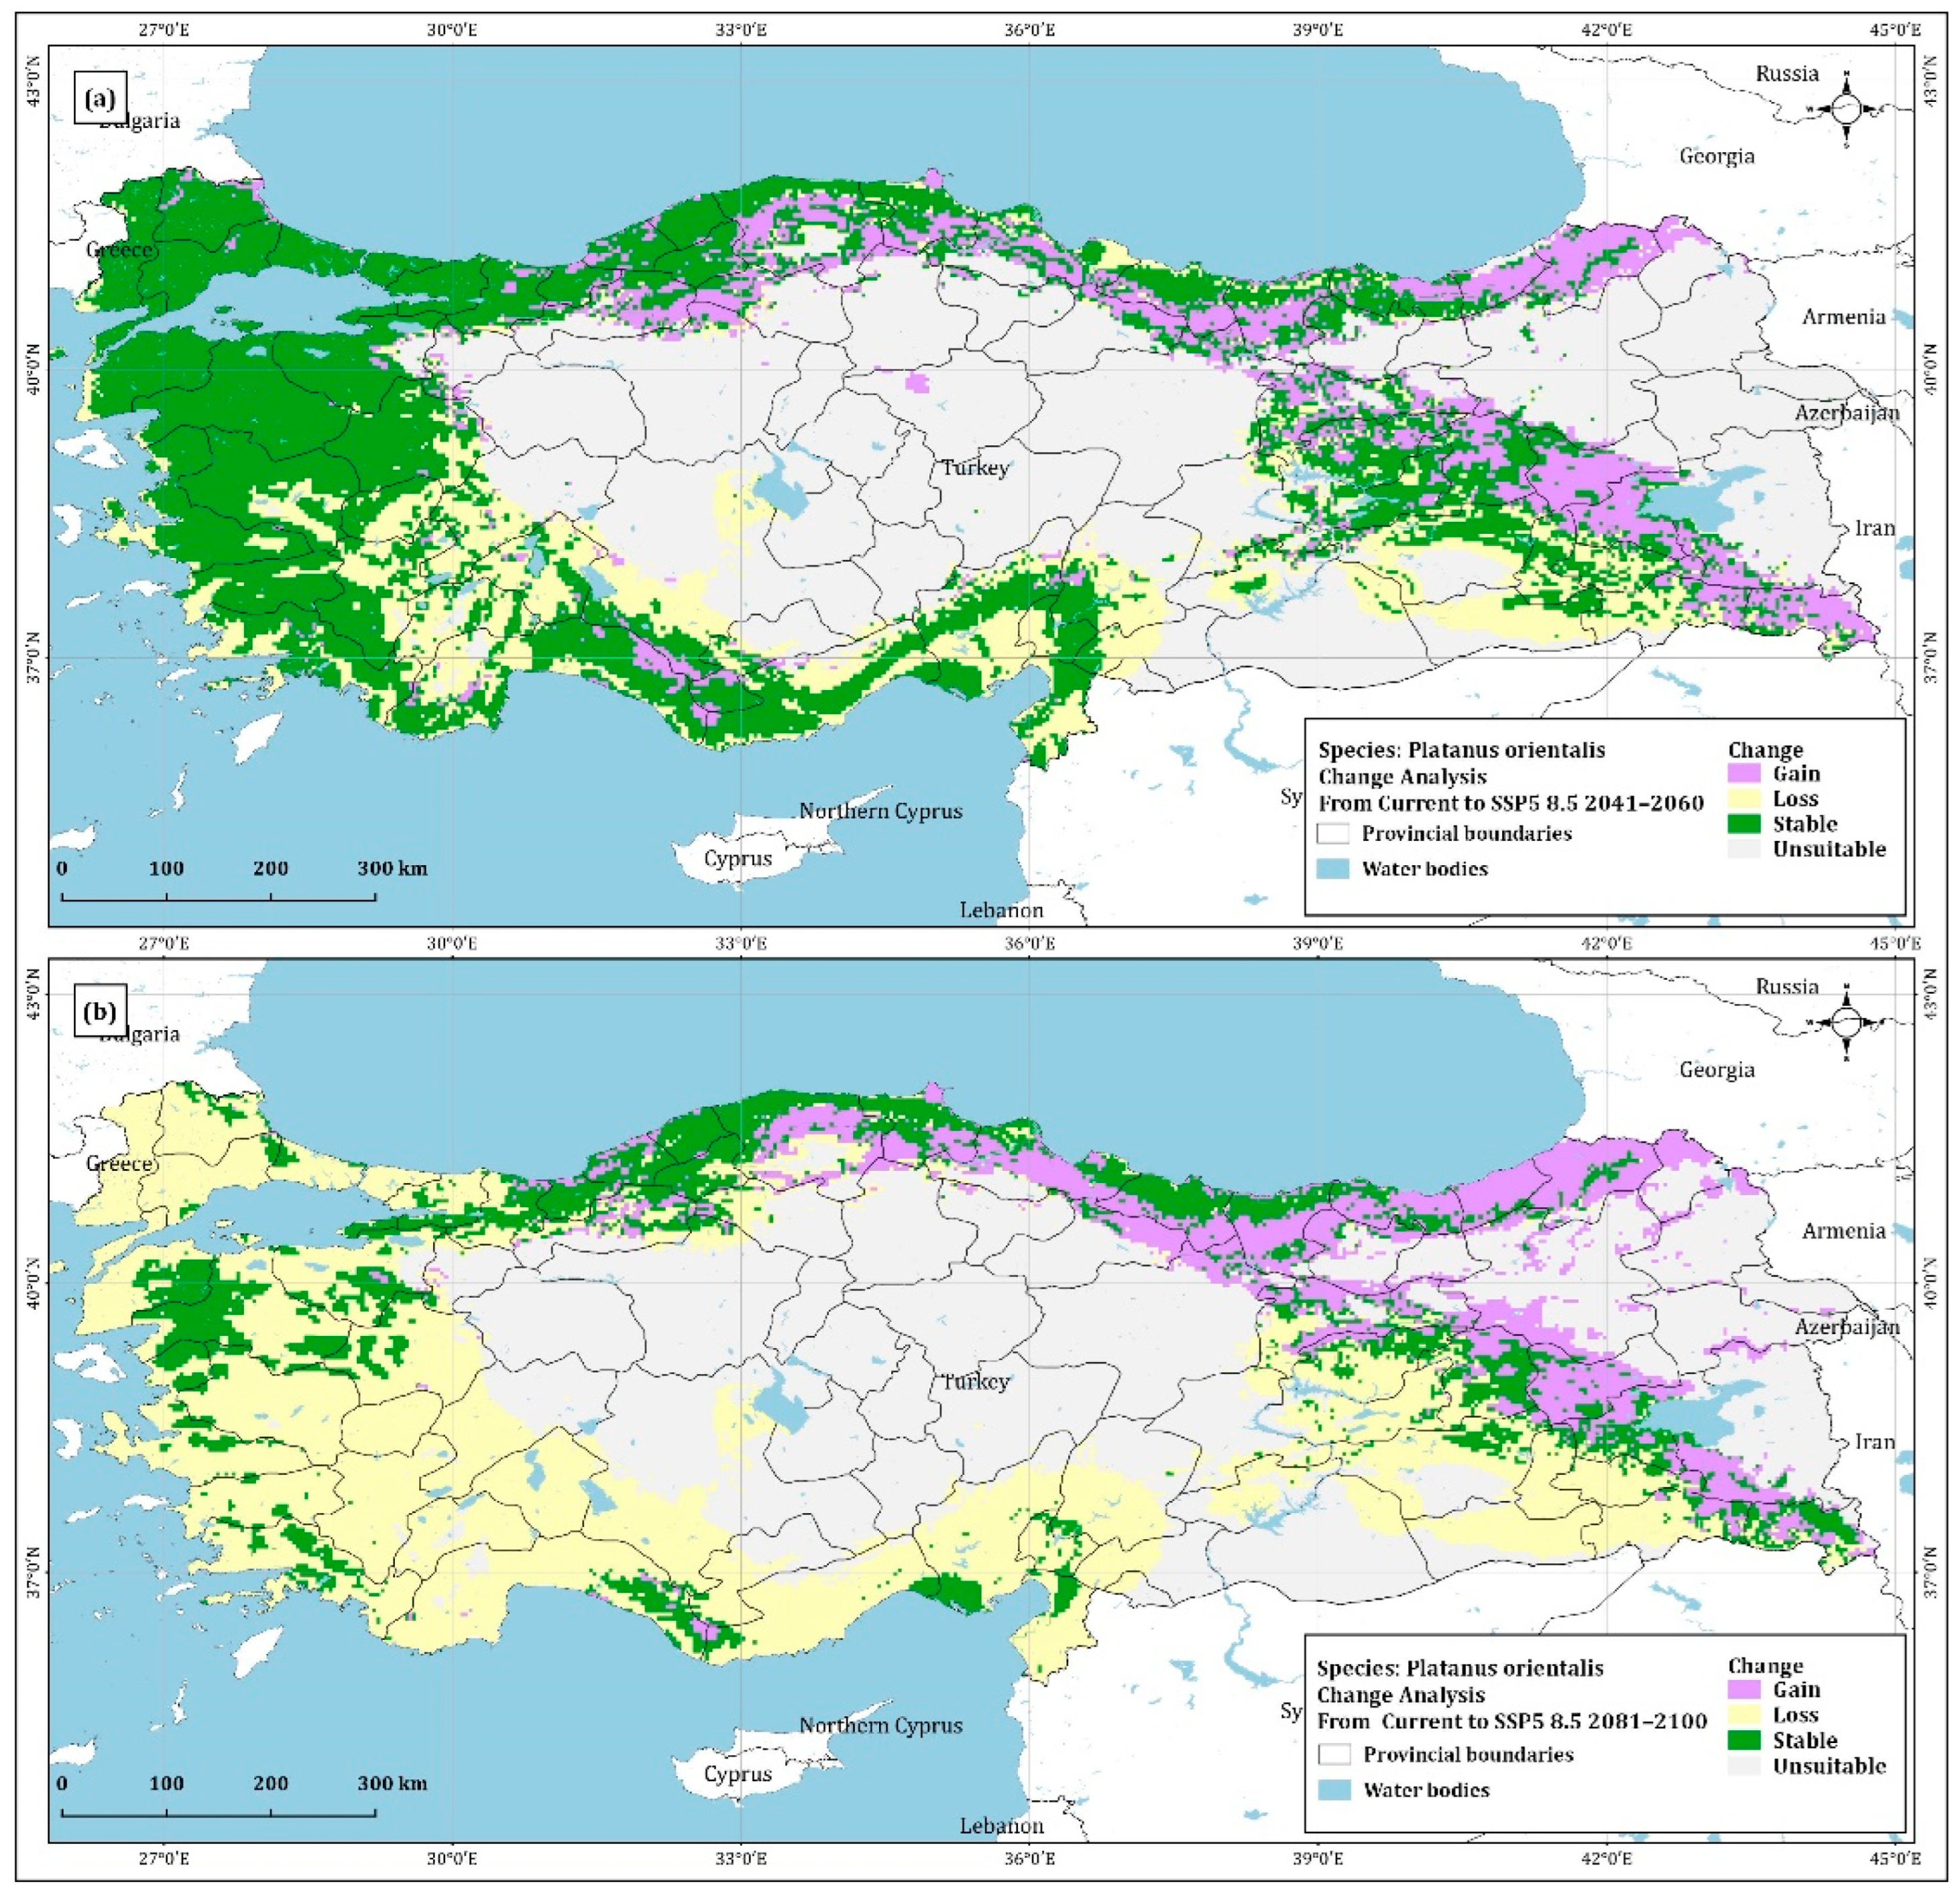
4.2. Change Analysis

The outputs of the change analysis conducted in the manner described in the Section 2 concerning the change in the potential geographical distribution areas of the target species between the present day and the future periods considered under the specified climate scenarios are shown in Figure 10 and Figure 11. These figures display the direction and size of the changes in the potential geographical distributions of Platanus orientalis predicted for the periods 2041–2060 and 2081–2100 according to the SSP2 4.5 and SSP5 8.5 climate change scenarios. As seen in Table 3, in the SSP2 4.5 scenario for the 2041–2060 period, the calculations result in “gains” in areas totaling 109,876 km2, which move up to a higher suitability class, while “losses” turn out to occur in areas totaling 79,596 km2, which come to fall into a lower suitability class. In the SSP2 4.5 scenario for the 2081–2100 period, the total area of “gains” works out lower at 96,034 km2, while the total area of “losses” rises to 157,362 km2. In the SSP5 8.5 scenario for the 2041–2060 period, the total extent of the “gains” or areas which move up to a higher suitability class is calculated to be 77,818 km2, whereas areas where “losses” occur, and which fall into a lower suitability class, cover a total of 122,315 km2. In the same (SSP5 8.5) scenario for the 2081–2100 period, the extent of the “gains” is similar at 77,756 km2, but the extent of the “losses” works out to be as great as 282,462 km2.

5. Discussion

Numerous studies have demonstrated the many adverse effects of climate change on plant and animal species, including shrinking habitats, declines in biodiversity, and even the endangerment/extinction of some species [71,72,73]. This study identified the spatial changes that are likely to be experienced in the current distribution areas of Platanus orientalis L. by modelling predicted distribution areas for the periods 2041–2060 and 2081–2100 using the SSP2 4.5 and SSP5 8.5 scenarios. Models with high prediction accuracies were obtained (AUC value = 0.887 and standard deviation = 0.005). According to the jackknife test results, the environmental factors which will affect the geographical distribution of Platanus orientalist L. the most are the bioclimatic variables of annual precipitation (BIO12) and amount of precipitation in the coldest season (BIO19). It can thus be concluded that these variables carry more importance than the other variables used in the models and have greater impacts on the geographical distribution of Platanus orientalis L. This finding is consistent with existing knowledge of the species, which seeks out humid soils for itself such as valleys and riverbanks, and of its need for humidity, particularly during the dry seasons, despite its toleration of semi-arid areas [52]. Moreover, the impact of the average temperature during the driest season variable (BIO9) supports the consistency of the models obtained.
The effects of climate change are already being seen today in changes occurring in growing seasons and the migrations of plants to areas with higher altitudes; in the years to come, it is likely to have a more severe impact on all plant species and their distributions, particularly in the case of species with stringent climatic and habitat requirements [74,75]. All these likely consequences will put biodiversity under serious pressure as they impact various animal species together with the plant species, and will limit the integrity of the ecosystem and restrict its functions [71,76,77]. The most obvious impact of climate change on plants will be the shift of the distribution areas of many plant species that are adapted to the current climate conditions in temperate zones towards higher altitudes and/or more northerly areas [78,79]. The results of the present study are consistent with those of the previous studies. Considering the areas in which the models obtained and change analyses point to future habitat gains, it is predicted that Platanus orientalis L. will begin to have a geographical distribution in valleys at high altitudes in north and south-eastern regions of Turkey like some other tree species [80,81,82]. The habitat losses which the change analyses indicate will occur in the geographical distribution of the species that are concentrated at lower altitudes in western and southern regions of Turkey.
An examination of the spatial dimensions of the changes that are predicted to occur in the periods 2041–2060 and 2081–2100 under the SSP2 4.5 and SSP5 8.5 scenarios reveals that the gains in the geographical distribution of the species will only exceed the losses in SSP2 4.5 scenario for the 2041–2060 period. In the SSP2 4.5 scenario for the 2081–2100 period and the SSP5 8.5 scenario for the 2041–2060 and 2081–2100 periods, the losses in the geographical distribution of the species are found to be greater than the gains. In all periods/scenarios other than the SSP2 4.5 scenario for the 2041–2060 period, there will be a serious increase in the areas of the current distribution range of the species that are no longer suitable for it. Platanus orientalis L. is a type of species that adapted to cooler and more humid environments in its natural geographical distribution [83,84]. This indicates that increases in aridity and temperature will have a negative effect on the distribution area of the species in Turkey. These results are in accord with recent studies on different tree species, indicating that there might be shifts from low altitudes toward high altitudes in the potential distribution areas of Carpinus orientalis and Carpinus betulus, not only in Turkey but also throughout the Europe mainly because of the changes in temperature regimes [85]. Similarly, various studies from Turkey have found there will be decreases in the potential distribution area of plant species depending on climate change in Turkey, including Phoenix theophrasti Gr., Quercus libani Olivier, and Cercis siliquastrum L. [20,67,86]. Some studies, on the other hand, reveal the opposite situation, revealing that the distribution area of some plant species, i.e., Cornus mas L., will increase. [72]. In general, therefore, it seems that whilst the ecological response and behaviour of plant species would be different depending on their environmental requirements, the future climate conditions would create totally different geographical distribution of plant species and vegetation structure where some of them will start seeking new habitats, some of them adapt to new conditions, and/or some of them will face extinction.
Platanus orientalis L, is a tall, fast-growing deciduous tree with a spreading crown that currently inhabits areas extending from south-eastern Europe to south-western Asia, preferring cool creeks and river beds [49,84]. However, the natural geographical distribution of the species has been restricted by human activities such as intensive agricultural production, changes in river banks, and increased urban development and road construction, causing serious declines in its population [52]. The species, which is also found in the Mediterranean basin, an area of rapid climate change, will face the risk of extinction unless it can adapt to these changes [52]. In this context, the main findings of the current study with respect to the development of protection strategies can be summarized under three main headings. First, it is considered that the findings of the study with respect to the areas where gains and losses are predicted to occur due to climate change in the geographical distribution of Platanus orientalis L, to the areas that are unsuitable for it, and to the areas which are predicted to remain stable, may light the way for efforts to create new living spaces for the species, the natural habitats of which are threatened by climate change. Secondly, advance observation of the species in the areas where gains and losses are predicted to occur in its geographical distribution, and the monitoring and recording of the changes that occur, will help to identify the changes that may arise in the future at an early stage. Finally, it is considered that the areas found to be stable as a result of the models obtained and the associated change analyses will help to preserve the natural geographical distribution areas of the species. In this connection, future studies that consider environmental factors such as the current situation and ongoing changes in land use/land cover, altitude, the direction and gradients of slopes, and the various characteristics of the soil in addition to bioclimatic variables will support the generation of more realistic scenarios.
It is important to remind that all of modelling approaches have some limitations in terms of their own scope and applicability. The wider limitations and advantages of the Maxent model were mentioned above (please see Section 3). Every model requires attention and expertise at different steps of the modelling procedure. For example, Maxent requires a serious consideration of the initial parameters and spatial bias in the presence data of species to maximize the accuracy of probability distribution (e.g., minimizing the bias in the occurrence data, minimization of multicollinearity in environmental variables). However, here, the most important thing is their capacity to provide us approximations about the subject under consideration within the availability of data constraints and labor. Notwithstanding its limitations, a species distribution modelling (SDM) approach based on the Maximum Entropy principle has become one of the most used methods in ecological studies in recent years, as it offers users the ability to model only with the presence data of the species, performs better with smaller sample sizes than other modelling methods, and can adapt different environmental variables together with climate [41,87].

6. Conclusions

Being part of the Mediterranean ecosystem, Turkey is expected to experience higher average annual temperatures with decreasing precipitation [88]. As one of the riparian ecosystem tree species sensitive to changes in temperature and precipitation and native to Turkey, Platanus orientalis L. may not be able to adapt to future global warming. The purpose of the current study was, therefore, to determine the current distribution of Platanus orientalis L. and investigate the influence of climate change on its future distributions for the periods 2041–2060 and 2081–2100 under the SSP5 4.5 and SSP5 8.5 scenarios using MaxEnt 3.4.1. Modelling approaches, such as the one demonstrated in this study, can be used by planners and conservation organizations to highlight the locations where the most loss and gains are obtained and so the most attention is required to sustain the natural geographical distribution areas of plant species under consideration as well as supporting efforts to create new suitable habitats for the species to maintain their lives and ensure the ecosystem services they normally provide. The models created for this study area reasonable and correct according to AUC results. The investigation of extent and locations of predicted suitable and unchanged areas for the distribution of Platanus orientalis L. has shown that its potential distribution area in Turkey, specifically, will be negatively affected by the climatic changes due to relatively medium and high increases in temperature. These findings have significant implications for developing effective conservation strategies as well as aiding decision-making processes for climate change mitigation and adaptation. In order to reduce the risk of extinction of Platanus orientalis L. in its natural distribution areas, conservation and reinforcement of the current potential distributions of Platanus orientalis L. is essential in the context of climate change. We are also aware that it is hard to prevent the ongoing effects of global climate change, in particular increasing temperatures and decreasing precipitation. However, efficient conservation measures together with activities raising the public awareness and policy activities would help us to reduce the adverse effects of climate change on native plant species, as in the case with Platanus orientalis L.

Funding

This research received no external funding.

Institutional Review Board Statement

Not applicable.

Informed Consent Statement

Not applicable.

Data Availability Statement

Not applicable.

Conflicts of Interest

The authors declare no conflict of interest.

References

  1. Secretariat, I.; Gullino, M.; Albajes, R.; Al-Jboory, I.; Angelotti, F.; Chakraborty, S.; Garrett, K.; Hurley, B.; Juroszek, P.; Makkouk, K. Scientific Review of the Impact of Climate Change on Plant Pests; FAO on behalf of the IPPC Secretariat: Rome, Italy, 2021; ISBN 92-5-134435-3. [Google Scholar]
  2. Bernstein, L.; Bosch, P.; Canziani, O.; Chen, Z.; Christ, R.; Riahi, K. IPCC, 2007: Climate Change 2007: Synthesis Report. 2008. Available online: https://pure.iiasa.ac.at/id/eprint/8667/ (accessed on 1 May 2022).
  3. Kumar, D.; Rawat, S.; Joshi, R. Predicting the current and future suitable habitat distribution of the medicinal tree Oroxylum Indicum (L.) Kurz in India. J. Appl. Res. Med. Aromat. Plants 2021, 23, 100309. [Google Scholar] [CrossRef]
  4. Gitay, H.; Suárez, A.; Watson, R.T.; Dokken, D.J. Climate Change and Biodiversity. 2002. Available online: https://www.osti.gov/etdeweb/biblio/20475293 (accessed on 1 May 2022).
  5. Peñuelas, J.; Sardans, J.; Estiarte, M.; Ogaya, R.; Carnicer, J.; Coll, M.; Barbeta, A.; Rivas-Ubach, A.; Llusià, J.; Garbulsky, M.; et al. Evidence of current impact of climate change on life: A walk from genes to the biosphere. Glob. Chang. Biol. 2013, 19, 2303–2338. [Google Scholar] [CrossRef] [PubMed]
  6. Theurillat, J.-P.; Guisan, A. Potential impact of climate change on vegetation in the European alps: A review. Clim. Chang. 2001, 50, 77–109. [Google Scholar] [CrossRef]
  7. Popp, A.; Dietrich, J.P.; Lotze-Campen, H.; Klein, D.; Bauer, N.; Krause, M.; Beringer, T.; Gerten, D.; Edenhofer, O. The economic potential of bioenergy for climate change mitigation with special attention given to implications for the land system. Environ. Res. Lett. 2011, 6, 034017. [Google Scholar] [CrossRef]
  8. McKinley, D.C.; Ryan, M.G.; Birdsey, R.A.; Giardina, C.P.; Harmon, M.E.; Heath, L.S.; Houghton, R.A.; Jackson, R.B.; Morrison, J.F.; Murray, B.C.; et al. A synthesis of current knowledge on forests and carbon storage in the united states. Ecol. Appl. 2011, 21, 1902–1924. [Google Scholar] [CrossRef]
  9. Shuckburgh, E.; Mitchell, D.; Stott, P. Hurricanes harvey, irma and maria: How natural were these ‘natural disasters’? Weather 2017, 72, 353–354. [Google Scholar] [CrossRef]
  10. Shirk, A.J.; Cushman, S.A.; Waring, K.M.; Wehenkel, C.A.; Leal-Sáenz, A.; Toney, C.; Lopez-Sanchez, C.A. Southwestern white pine (Pinus strobiformis) species distribution models project a large range shift and contraction due to regional climatic changes. For. Ecol. Manag. 2018, 411, 176–186. [Google Scholar] [CrossRef]
  11. Peterson, A.T.; Sánchez-Cordero, V.; Soberon, J.; Bartley, J.; Buddemeier, R.W.; Navarro-Sigüenza, A.G. Effects of global climate change on geographic distributions of Mexican Cracidae. Ecol. Model. 2001, 144, 21–30. [Google Scholar] [CrossRef]
  12. de Siqueira, M.F.; Peterson, A.T. Consequences of global climate change for geographic distributions of Cerrado tree species. Biota Neotrop. 2003, 3, 1–14. [Google Scholar] [CrossRef]
  13. Scheffers, B.R.; De Meester, L.; Bridge, T.C.L.; Hoffmann, A.A.; Pandolfi, J.M.; Corlett, R.T.; Butchart, S.H.M.; Pearce-Kelly, P.; Kovacs, K.M.; Dudgeon, D.; et al. The broad footprint of climate change from genes to biomes to people. Science 2016, 354, aaf7671. [Google Scholar] [CrossRef] [PubMed]
  14. Stoms, D.M.; Davis, F.W.; Cogan, C.B. Sensitivity of wildlife habitat models to uncertainties in GIS data. Photogramm. Eng. Remote Sens. 1992, 58, 843–850. [Google Scholar]
  15. Pearson, R.G. Species’ distribution modeling for conservation educators and practitioners. Lessons Conserv. 2010, 3, 54–89. [Google Scholar]
  16. El Alqamy, H.; Ismael, A.; Abdelhameed, A.; Nagy, A.; Hamada, A.; Rashad, S.; Kamel, M. Predicting the status and distribution of the Nubian ibex (Capra nubiana) in the high-altitude mountains of South Sinai (Egypt). Galemys 2010, 22, 517–530. [Google Scholar]
  17. Akhter, S.; McDonald, M.A.; van Breugel, P.; Sohel, S.; Kjaer, E.D.; Mariott, R. Habitat distribution modelling to identify areas of high conservation value under climate change for Mangifera sylvatica Roxb of bangladesh. Land Use Policy 2017, 60, 223–232. [Google Scholar] [CrossRef]
  18. Deb, J.C.; Phinn, S.; Butt, N.; McAlpine, C.A. The impact of climate change on the distribution of two threatened dipterocarp trees. Ecol. Evol. 2017, 7, 2238–2248. [Google Scholar] [CrossRef] [PubMed]
  19. Correia, R.A.; Bugalho, M.N.; Franco, A.M.A.; Palmeirim, J.M. Contribution of spatially explicit models to climate change adaptation and mitigation plans for a priority forest habitat. Mitig. Adapt. Strateg. Glob. Chang. 2017, 23, 371–386. [Google Scholar] [CrossRef]
  20. Örücü, Ö.K. Phoenix theophrasti gr.’nin iklim değişimine bağli günümüz ve gelecekteki yayiliş alanlarinin maxent modeli ile tahmini ve bitkisel tasarimda kullanimi. Türkiye Orman. Derg. 2019, 20, 274–283. [Google Scholar] [CrossRef]
  21. Sarikaya, A.G.; Orucu, O.K. Prediction of potential and future distribution areas of Anatolian Chesnut (Castanea Sativa Mill.) by using maximum entropy (maxent) modeling depending on climate change in Turkey. Int J. Ecosyst. Ecol. Sci. 2019, 9, 699–708. [Google Scholar] [CrossRef]
  22. Holt, R.D. The microevolutionary consequences of climate change. Trends Ecol. Evol. 1990, 5, 311–315. [Google Scholar] [CrossRef]
  23. Yi, Y.J.; Cheng, X.; Yang, Z.F.; Zhang, S.H. Maxent modeling for predicting the potential distribution of endangered medicinal plant (H. Riparia Lour) in Yunnan, China. Ecol. Eng. 2016, 92, 260–269. [Google Scholar] [CrossRef]
  24. Dyderski, M.K.; Paz, S.; Frelich, L.E.; Jagodzinski, A.M. How much does climate change threaten european forest tree species distributions? Glob. Chang. Biol. 2018, 24, 1150–1163. [Google Scholar] [CrossRef]
  25. Silva, C.; Leiva, F.; Lastra, J. Predicting the current and future suitable habitat distributions of the anchovy (Engraulis Ringens) using the maxent model in the coastal areas off Central-Northern Chile. Fish. Oceanogr. 2019, 28, 171–182. [Google Scholar] [CrossRef]
  26. Richards, C.L.; Carstens, B.C.; Lacey Knowles, L. Distribution modelling and statistical phylogeography: An integrative framework for generating and testing alternative biogeographical hypotheses. J. Biogeogr. 2007, 34, 1833–1845. [Google Scholar] [CrossRef] [Green Version]
  27. Gür, H. Geç kuvaterner buzul buzullararasi döngülerinin anadolu’nun biyolojik çeşitliliği üzerine etkileri. Türkiye Jeol. Bülteni/Geol. Bull. Turk. 2017, 60, 507–528. [Google Scholar] [CrossRef]
  28. Choudhary, J.S.; Kumari, M.; Mali, S.S.; Dhakar, M.K.; Das, B.; Singh, A.K.; Bhatt, B.P. Predicting impact of climate change on habitat suitability of guava fruit fly, bactrocera correcta (Bezzi) using maxent modeling in India. J. Agrometeorol. 2019, 21, 24–30. [Google Scholar] [CrossRef]
  29. Scherrer, D.; Guisan, A. Ecological indicator values reveal missing predictors of species distributions. Sci. Rep. 2019, 9, 3061. [Google Scholar] [CrossRef] [PubMed]
  30. Jaynes, E.T. Probability Theory: The Logic of Science; Cambridge University Press: Cambridge, UK, 2003; ISBN 0-521-59271-2. [Google Scholar]
  31. Dudik, M.; Phillips, S.J.; Schapire, R.E. Performance Guarantees for Regularized Maximum Entropy Density Estimation; Springer: Berlin/Heidelberg, Germany, 2004; pp. 472–486. [Google Scholar]
  32. Elith, J.; Phillips, S.J.; Hastie, T.; Dudik, M.; Chee, Y.E.; Yates, C.J. A statistical explanation of maxent for ecologists. Divers Distrib. 2011, 17, 43–57. [Google Scholar] [CrossRef]
  33. Bean, W.T.; Stafford, R.; Brashares, J.S. The effects of small sample size and sample bias on threshold selection and accuracy assessment of species distribution models. Ecography 2012, 35, 250–258. [Google Scholar] [CrossRef]
  34. Rangel, T.F.; Loyola, R.D. Labeling ecological niche models. Nat. Conserv. 2012, 10, 119–126. [Google Scholar] [CrossRef]
  35. Zhang, B.; Wang, H. Exploring the advantages of the maximum entropy model in calibrating cellular automata for urban growth simulation: A comparative study of four methods. GISci. Remote Sens. 2022, 59, 71–95. [Google Scholar] [CrossRef]
  36. Royle, J.A.; Chandler, R.B.; Yackulic, C.; Nichols, J.D. Likelihood analysis of species occurrence probability from presence-only data for modelling species distributions. Methods Ecol. Evol. 2012, 3, 545–554. [Google Scholar] [CrossRef]
  37. Fitzpatrick, M.C.; Gotelli, N.J.; Ellison, A.M. MaxEnt versus MaxLike: Empirical comparisons with ant species distributions. Ecosphere 2013, 4, 1–15. [Google Scholar] [CrossRef]
  38. Kramer-Schadt, S.; Niedballa, J.; Pilgrim, J.D.; Schröder, B.; Lindenborn, J.; Reinfelder, V.; Stillfried, M.; Heckmann, I.; Scharf, A.K.; Augeri, D.M. The importance of correcting for sampling bias in maxent species distribution models. Divers. Distrib. 2013, 19, 1366–1379. [Google Scholar] [CrossRef]
  39. Yackulic, C.B.; Chandler, R.; Zipkin, E.F.; Royle, J.A.; Nichols, J.D.; Campbell Grant, E.H.; Veran, S. Presence-only modelling using MAXENT: When can we trust the inferences? Methods Ecol. Evol. 2013, 4, 236–243. [Google Scholar] [CrossRef]
  40. Morales, N.S.; Fernandez, I.C.; Baca-Gonzalez, V. MaxEnt’s parameter configuration and small samples: Are we paying attention to recommendations? A systematic review. Peerj 2017, 5, e3093. [Google Scholar] [CrossRef]
  41. Fois, M.; Bacchetta, G.; Cogoni, D.; Fenu, G. Current and future effectiveness of the natura 2000 network for protecting plant species in Sardinia: A nice and complex strategy in its raw state? J. Environ. Plann. Man. 2018, 61, 332–347. [Google Scholar] [CrossRef]
  42. Brotons, L.; Thuiller, W.; Araújo, M.B.; Hirzel, A.H. Presence-absence versus presence-only modelling methods for predicting bird habitat suitability. Ecography 2004, 27, 437–448. [Google Scholar] [CrossRef]
  43. Wisz, M.S.; Hijmans, R.J.; Li, J.; Peterson, A.T.; Graham, C.H.; Guisan, A. NCEAS predicting species distribut effects of sample size on the performance of species distribution models. Divers Distrib. 2008, 14, 763–773. [Google Scholar] [CrossRef]
  44. Tutin, T.; Burges, N.; Chater, A.; Edmondson, J.; Heywood, V.; Moore, D. Cruciferae; Flora Europea Ed. 2; Cambridge University Press: Cambridge, UK, 1993; Volume 1, pp. 313–416. [Google Scholar]
  45. Diamandis, S. Platanus orientalis a Divine Gift for Greece. 2004, pp. 52–53. Available online: http://www.dendrology.org/site/images/web4events/pdf/Tree%20info%20IDS_04_pp52_53_Platanus.pdf (accessed on 29 May 2014).
  46. Bıçakçı, A.; Saatçioğlu, G.; Tosunoğlu, A. Allerjenik betula (huş ağaci) polenlerinin türkiye’deki dağilimlari. Asthma Allergy Immunol. 2017, 15, 142–153. [Google Scholar] [CrossRef]
  47. Akgün, B.; Okumuş, A.; Yazar, E. Gaziantep Yöresinde bulunan ve anit ağaç niteliği taşiyan doğu çinari (Platanus orientalis L.)’nin fiziksel özelliklerinin belirlenmesi. Kahramanmaraş Sütçü İmam Üniversitesi Mühendislik Bilimleri Derg. 2018, 21, 305–311. [Google Scholar] [CrossRef]
  48. Seker, D.Z.; Sivri, N.; Demir, M.; Baytimur, A.; Gunduz, E.; Eroglu, M.F. GIS based inventory and documentation of monumental trees in black sea region of Turkey. FEB Fresenius Environ. Bull. 2019, 28, 524. [Google Scholar]
  49. OGM Doğu Çınarı. Available online: https://www.ogm.gov.tr/tr/yararli-bilgiler/haftanin-agaci/do%C4%9Fu-%C3%A7%C4%B1nar%C4%B1 (accessed on 10 June 2022).
  50. Güler, Z.; Dursun, A.; Özkan, D. Volatile compounds in the leaf of plane tree (Platanus orientalis) with solid phase microextraction (SPME) technique. Int. J. Second. Metab. 2017, 4, 167–176. [Google Scholar] [CrossRef]
  51. Öztürk, M.; Uysal, I.; Yücel, E.; Altay, V.; Karabacak, E. Soil-Plant Interactions in the Monumental Plane Trees (Platanus orientalis) Grove-çanakkale-Turkey. 2017. Available online: https://hdl.handle.net/11421/16340 (accessed on 1 May 2022).
  52. Bazos, I.; Matevski, V.; Montagnani, C.; Petrova, A.; Shuka, A.; Troia, A. Platanus orientalis. The IUCN Red List of Threatened Species. Available online: https://www.iucnredlist.org/species/33951/103192536 (accessed on 1 July 2022).
  53. GBIF.org. GBIF Occurrence Download. Available online: https://doi.org/10.15468/dl.nj49bd (accessed on 9 August 2022).
  54. Davis, P.H. Flora of Turkey and The East Aegean Islands—I; David, P.H., Ed.; Edinburgh University Press: Edinburgh, UK, 1965; Volume 1. [Google Scholar]
  55. BIYOD. Biyolojik Çeşitlilik ve Odun DIşı Orman Ürünleri Veri Tabanı; Tarım ve Orman Bakanlığı Orman Genel Müdürlüğü: Ankara, Turkey, 2020. [Google Scholar]
  56. WorldClim. Global Climate and Weather Data—WorldClim. Available online: https://worldclim.org/data/index.html (accessed on 1 December 2020).
  57. Zhang, J.; Li, S. A review of machine learning based species’ distribution modelling. In Proceedings of the 2017 International Conference on Industrial Informatics—Computing Technology, Intelligent Technology, Industrial Information Integration (ICIICII), Wuhan, China, 2–3 December 2017; pp. 199–206. [Google Scholar]
  58. Sillero, N. What does ecological modelling model? A proposed classification of ecological niche models based on their underlying methods. Ecol. Model. 2011, 222, 1343–1346. [Google Scholar] [CrossRef]
  59. Yang, X.-Q.; Kushwaha, S.P.S.; Saran, S.; Xu, J.; Roy, P.S. Maxent modeling for predicting the potential distribution of medicinal plant, Justicia adhatoda L. in lesser Himalayan foothills. Ecol. Eng. 2013, 51, 83–87. [Google Scholar] [CrossRef]
  60. Cao, B.; Bai, C.; Zhang, L.; Li, G.; Mao, M. Modeling habitat distribution of Cornus officinal is with maxent modeling and fuzzy logics in China. J. Plant Ecol. 2016, 9, 742–751. [Google Scholar] [CrossRef]
  61. Phillips, S.J.; Elith, J. POC plots: Calibrating species distribution models with presence-only data. Ecology 2010, 91, 2476–2484. [Google Scholar] [CrossRef] [PubMed]
  62. Phillips, S.J.; Anderson, R.P.; Schapire, R.E. Maximum entropy modeling of species geographic distributions. Ecol. Model. 2006, 190, 231–259. [Google Scholar] [CrossRef]
  63. Gassó, N.; Thuiller, W.; Pino, J.; Vilà, M. Potential distribution range of invasive plant species in Spain. NeoBiota 2012, 12, 25–40. [Google Scholar] [CrossRef]
  64. Hosmer, D.W., Jr.; Lemeshow, S.; Sturdivant, R.X. Applied Logistic Regression; John Wiley & Sons: Hoboken, NJ, USA, 2013; Volume 398, ISBN 0-470-58247-2. [Google Scholar]
  65. Pearson, R.G.; Raxworthy, C.J.; Nakamura, M.; Peterson, A.T. Predicting species distributions from small numbers of occurrence records: A test case using cryptic geckos in Madagascar. J. Biogeogr. 2007, 34, 102–117. [Google Scholar] [CrossRef]
  66. Shcheglovitova, M.; Anderson, R.P. Estimating optimal complexity for ecological niche models: A jackknife approach for species with small sample sizes. Ecol. Model. 2013, 269, 9–17. [Google Scholar] [CrossRef]
  67. Çoban, H.O.; Örücü, Ö.K.; Arslan, E.S. MaxEnt Modeling for predicting the current and future potential geographical distribution of Quercus libani Olivier. Sustainability 2020, 12, 2671. [Google Scholar] [CrossRef]
  68. Crawshaw, L.; Buchanan, T.; Shirose, L.; Palahnuk, A.; Cai, H.Y.; Bennett, A.M.; Jardine, C.M.; Davy, C.M. Widespread occurrence of batrachochytrium dendrobatidis in ontario, canada, and predicted habitat suitability for the emerging batrachochytrium salamandrivorans. Ecol. Evol. 2022, 12, e8798. [Google Scholar] [CrossRef] [PubMed]
  69. Dai, X.; Wu, W.; Ji, L.; Tian, S.; Yang, B.; Guan, B.; Wu, D. MaxEnt model-based prediction of potential distributions of parnassiawightiana (celastraceae) in China. Biodivers. Data J. 2022, 10, e81073. [Google Scholar] [CrossRef] [PubMed]
  70. Arslan, E.S.; Örücü, Ö.K. Present and future potential distribution of the Pinus nigra Arnold. and Pinus sylvestris l. using maxent model. Int. J. Ecosyst. Ecol. Sci. 2019, 9, 787–798. [Google Scholar]
  71. Khanum, R.; Mumtaz, A.S.; Kumar, S. Predicting impacts of climate change on medicinal asclepiads of pakistan using maxent modeling. Acta Oecol. 2013, 49, 23–31. [Google Scholar] [CrossRef]
  72. Akyol, A.; Örücü, Ö.K. İklim değişimi senaryolari ve tür dağilim modeline göre kizilcik türünün (cornus mas l.) odun dişi orman ürünleri kapsaminda değerlendirilmesi. Eur. J. Sci. Technol. 2019, 17, 224–233. [Google Scholar] [CrossRef]
  73. Sarikaya, A.G.; Orucu, O.K. Maxent modeling for predicting the potential distribution of Arbutus andrachne L. in Turkey. Kuwait J. Sci. 2021, 48, 1–15. [Google Scholar] [CrossRef]
  74. Parmesan, C.; Yohe, G. A globally coherent fingerprint of climate change impacts across natural systems. Nature 2003, 421, 37–42. [Google Scholar] [CrossRef] [PubMed]
  75. Clarke, H. Conserving biodiversity in the face of climate change. Agenda—J. Policy Anal. Reform 2007, 14, 157–170. [Google Scholar] [CrossRef]
  76. Pimm, S.L. Biodiversity: Climate change or habitat loss—Which will kill more species? Curr. Biol. 2008, 18, R117–R119. [Google Scholar] [CrossRef] [PubMed]
  77. Demir, A. Küresel iklim değişikliğinin biyolojik çeşitlilik ve ekosistem kaynaklari üzerine etkisi. Ank. Üniversitesi Çevrebilimleri Derg. 2009, 1, 37–54. [Google Scholar] [CrossRef]
  78. Hughes, L. Biological consequences of global warming: Is the signal already apparent? Trends Ecol. Evol. 2000, 15, 56–61. [Google Scholar] [CrossRef]
  79. Bakkenes, M.; Alkemade, J.R.M.; Ihle, F.; Leemans, R.; Latour, J.B. Assessing effects of forecasted climate change on the diversity and distribution of european higher plants for 2050. Glob. Chang. Biol. 2002, 8, 390–407. [Google Scholar] [CrossRef]
  80. Yalçın, S. Modeling the Current and Future Ranges of Turkish pine (Pinus brutia) and Oriental beech (Fagus orientalis) in Turkey in the Face of Climate Change. Master’s Thesis, Middle East Technical University, Ankara, Turkey, 2012. [Google Scholar]
  81. López-Tirado, J.; Hidalgo, P.J. Ecological niche modelling of three Mediterranean pine species in the south of Spain: A tool for afforestation/reforestation programs in the twenty-first century. New For. 2016, 47, 411–429. [Google Scholar] [CrossRef]
  82. Akyol, A.; Örücü, Ö.K.; Arslan, E.S. Habitat suitability mapping of stone pine (Pinus pinea L.) under the effects of climate change. Biologia 2020, 75, 2175–2187. [Google Scholar] [CrossRef]
  83. Grueva, M.; Zhelev, P. Population genetic structure of Platanus orientalis L. in Bulgaria. Iforest—Biogeosciences For. 2011, 4, 186–189. [Google Scholar] [CrossRef]
  84. Velikova, V.; Tsonev, T.; Tattini, M.; Arena, C.; Krumova, S.; Koleva, D.; Peeva, V.; Stojchev, S.; Todinova, S.; Izzo, L.G.; et al. Physiological and structural adjustments of two ecotypes of Platanus orientalis L. from different habitats in response to drought and re-watering. Conserv Physiol 2018, 6, coy073. [Google Scholar] [CrossRef] [PubMed]
  85. Varol, T.; Cetin, M.; Ozel, H.B.; Sevik, H.; Zeren Cetin, I. The effects of climate change scenarios on Carpinus betulus and Carpinus orientalis in Europe. Water Air Soil Pollut. 2022, 233, 45. [Google Scholar] [CrossRef]
  86. Uzun, A.; Örücü, Ö.K. Adenocarpus complicatus (L.) Gay türünün iklim değişkenlerine bağli günümüz ve gelecekteki yayiliş alanlarinin tahmini. Turk. J. For. 2020, 21, 498–508. [Google Scholar] [CrossRef]
  87. Wei, B.; Wang, R.L.; Hou, K.; Wang, X.Y.; Wu, W. Predicting the current and future cultivation regions of Carthamus tinctorius L. using maxent model under climate change in China. Glob. Ecol. Conserv. 2018, 16, e00477. [Google Scholar] [CrossRef]
  88. Dalfes, H.; Karaca, M.; Sen, O. Climate Change Scenarios for Turkey in Climate Change & Turkey: Impact, Sectoral Analyses, Socio-Economic Dimensions; United Nations Development Programme (UNDP) Turkey Office: Ankara, Turke, 2007. [Google Scholar]
Figure 1. Leaves, fruits, and habitus of Platanus orientalis L.
Sustainability 14 11706 g001
Figure 2. Distribution area of Platanus orientalis L (Source: EUFORGEN—2022).
Sustainability 14 11706 g002
Figure 3. Study area and sample points for Platanus orientalis L.
Sustainability 14 11706 g003
Figure 4. Pearson correlation matrix of variables. In this Figure, red color indicates the highest correlation and orange color indicates high correlation.
Sustainability 14 11706 g004
Figure 5. Area below the ROC curve (AUC graph).
Sustainability 14 11706 g005
Figure 6. Jackknife graph.
Sustainability 14 11706 g006
Figure 7. Potential distribution area of Platanus orientalis L.
Sustainability 14 11706 g007
Figure 8. Predicted distribution areas of Platanus orientalis L. according to the SSP2 4.5 scenario for the periods (a) 2041–2060 and (b) 2081–2100 based on the CNRM-ESM2 climate model.
Sustainability 14 11706 g008
Figure 9. Predicted distribution areas of Platanus orientalis L. according to the SSP5 8.5 scenario for the periods (a) 2041–2060 and (b) 2081–2100 according to the CNRM-ESM2 climate model.
Sustainability 14 11706 g009
Figure 10. Changes in the predicted distribution areas of Platanus orientalis L. according to the SSP2 4.5 scenario for the periods (a) 2041–2060 and (b) 2081–2100 according to the CNRM-ESM2 climate model.
Sustainability 14 11706 g010
Figure 11. Changes in the predicted distribution areas of Platanus orientalis L. according to the SSP5 8.5 scenario for the periods (a) 2041–2060 and (b) 2081–2100 according to the CNRM-ESM2 climate model.
Sustainability 14 11706 g011
Table 1. Bioclimatic variables [56].
CodesDescriptions
BIO1Annual Mean Temperature
BIO2Mean Diurnal Range (Mean of monthly (max temp min temp))
BIO3Isothermality (BIO2/BIO7) (×100)
BIO4Temperature Seasonality (standard deviation ×100)
BIO5Max Temperature of Warmest Month
BIO6Min Temperature of Coldest Month
BIO7Temperature Annual Range (BIO5–BIO6)
BIO8Mean Temperature of Wettest Quarter
BIO9Mean Temperature of Driest Quarter
BIO10Mean Temperature of Warmest Quarter
BIO11Mean Temperature of Coldest Quarter
BIO12Annual Precipitation
BIO13Precipitation of Wettest Month
BIO14Precipitation of Driest Month
BIO15Precipitation Seasonality (Coefficient of Variation)
BIO16Precipitation of Wettest Quarter
BIO17Precipitation of Driest Quarter
BIO18Precipitation of Warmest Quarter
BIO19Precipitation of Coldest Quarter
Table 2. Spatial distribution of Platanus orientalis L. today and according to the SSP2 4.5 and SSP5 8.5 scenarios for the periods 2041–2060 and 2081–2100 according to the CNRM-ESM2-1 climate model.
Platanus orientalis L.SSP2 4.5SSP5 8.5
SuitabilityCurrent2041–20602081–21002041–20602081–2100
Unsuitable354,002.60344,905.54395,213.60385,265.82481,208.68
0–0.25108,146.17107,217.7780,215.3987,428.3981,430.03
0.25–0.5088,940.7284,551.40106,679.3693,944.35117,764.51
0.50–0.75222,810.45230,500.35186,405.97203,567.3591,237.57
0.75–16560.5213,282.5811,944.6510,252.758817.95
Table 3. Extent (km2) of changes in the potential distribution area of Platanus orientalis L. according to the SSP2 4.5 and SSP5 8.5 scenarios for the periods 2041–2060 and 2081–2100 according to the CNRM-ESM2-1 climate model by comparison with the present day.
Platanus orientalis L.SSP2 4.5SSP5 8.5
Change Type.2041–20602081–21002041–20602081–2100
Gain109,876.1996,034.2877,817.9277,756.11
Loss79,596.06157,362.45122,315.83282,462.32
Stable265,876.89198,902.42242,953.8791,154.09
Chart325,108.37328,158.53337,370.55329,084.90
Publisher’s Note: MDPI stays neutral with regard to jurisdictional claims in published maps and institutional affiliations.

