Abstract
Small-scaled linear cutting tests were first performed to study the influence of penetration on fracture characteristics by a CCS (constant cross-section) cutter. The results indicate that the increase in penetration (ranging from 2.5 mm to 5.5 mm) effectively increases chip masses between cuts and further promotes cutting efficiency. To further understand the fracture mechanism for various penetrations, 3D numerical simulations were performed using PFC 3D. The numerical fracture characteristics agree well with laboratory tests. In addition, the dynamic stress evolution analysis clearly shows that the increase in rolling force frequently results in stress concentrations in rock specimens. When stresses concentrate into critical values, fractures occur. Subsequently, these fracture propagations frequently result in stress dissipations and decreases in rolling force. Thus, the relation between the fluctuations of rolling force and the rock fractures is revealed. In addition, the increase in penetration results in the promoted stress concentrations. This phenomenon can explain why the increased penetration can result in severer fractures.
1. Introduction
Tunnel boring machines (TBMs) have been widely used in the excavation processes of traffic tunnels, hydraulic channels and mining roadways. Constant cross-section (CCS) cutters are installed on cutterhead to break rock. The cutter load directly affects the rock breakage degree and cutter wear. Further, the rock breakage efficiency and cutter wear significantly influence the excavation rate and cost [1,2]. Thus, the understanding on the relation between cutter load and rock breakage is critical.
To investigate the rock fracture characteristics and cutter load, extensive theoretical, laboratory and numerical investigations have been performed [3,4,5,6,7,8]. For the fracture characteristics, the numerical tests based on the 3D FEM-SPH coupled method indicated that the rock failure process consists of formation of the crushed zone, the micro-crack generation and the main crack propagation stages [9]. Similar results on the fracture process have also been reported [10,11,12,13]. The crack coalescence of the main cracks, initiating from adjacent crushed zones, is critical to chip formation. However, extensive factors may influence this crack coalescence. For example, Yang performed small-scaled cutting tests on sandstone specimens and proposed that joint orientation and spacing influence the crack propagation and further determine the fracture pattern [14]. Yin proposed that the joint can restrain the crack propagation [15]. Zhao stated that the crack pattern for the vertical cutting significantly differs from that for inclined cutting [16]. The laboratory tests by Liu indicated that confining stress significantly affects the main crack propagation and further determines the chip formation pattern between cuts [17].
For the cutter load, the laboratory and numerical comparison by Geng indicated that the rolling force consists of extensive fluctuations. In addition, the grinding–crushing process under the cutter may affect the cutter load [18]. Similar fluctuations have also been reported in previous works [19,20,21,22]. In addition, many factors, including the cutting sequence, the generation of free surfaces, the joints in rock specimens and the cutter spacing, may significantly affect these fluctuations [23,24,25,26].
The previous studies are significant to understanding rock fractures caused by CCS cutters. In addition, the load characteristics of the cutter for various conditions have also been extensively investigated. Moreover, previous studies have agreed that cutter load variations may correlate with rock fractures [27,28]. However, the detailed investigation on the relation between rock fractures and CCS cutter load variations is absent. Thus, the present study first performed small-scaled linear cutting tests on sandstone specimens. Then, the feasibility of 3D numerical simulation was verified by comparing the numerical results with the laboratory results. Subsequently, because stresses caused by external loads can cause fractures in rock, the dynamic stress analysis of the linear cutting tests was performed to reveal the relation between cutter load fluctuations and rock fractures.
2. Materials and Methods
2.1. Materials and Equipment
In the present work, red and yellow sandstone specimens were used. Table 1 lists the main mechanical parameters of these specimens. The length, width and thickness of these specimens were 100 mm, 70 mm and 50 mm, respectively. According to previous studies [27,28], the small-scaled linear cutting tests were performed on a self-designed cutting platform (Figure 1a). A 1/9 model of a typical 17 in cutter was used (Figure 1b). The spacing between cuts can be adjusted by inserting the guide rail on the specimen container into the guide rails on the loading base. The penetration can be adjusted by inserting or removing the high stiffness plates between the cutter rack and the loading base.

Table 1.
Mechanical parameters and tests specifications.
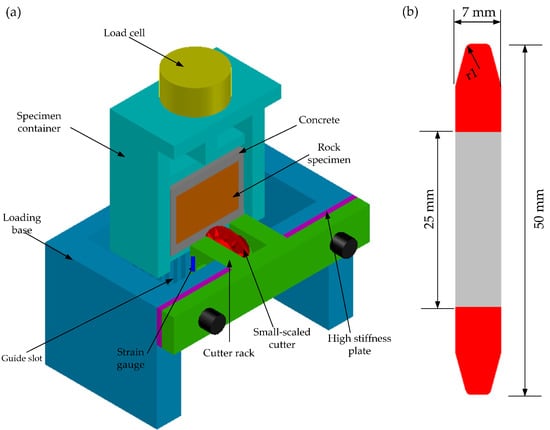
Figure 1.
Test platform: (a) the test platform; (b) the cross-section of the small-scaled cutter.
2.2. Test Method
To provide a margin between the cut and the boundary, the spacings were 30 mm and 40 mm. The penetrations for the spacing of 30 mm were 2.5 mm, 3.5 mm and 4.5 mm. For the spacing of 40 mm, the penetrations were 3.5 mm, 4.5 mm and 5.5 mm. Thus, in total, 24 cuts on 12 specimens were performed (Table 1). Before linear cutting tests, the specimen was cast in the specimen container for 3 days, using the rapid curing concrete. Then, strain gauges were installed on the calibrated cutter rack. Third, the guide rail was inserted into the specific guide slot. Fourth, the loading cell compressed the specimen container with a constant velocity of 10 mm/min. Simultaneously, the strain of the cutter rack was recorded. When the cutting distance reaches 70 mm, the first cut ceased. Then, the second cut could be accomplished by repeating the above procedures. After two cuts, the chips were collected. The rolling force could also be obtained based on the recorded data and the calibration on the cutter rack.
3. Results
The specific energy (SE), widely used to characterize cutting efficiency, can be written as:
where E and M are the consumed energy and the chip mass, respectively. The units for E, M and SE are J, g and J/g. Clearly, the smaller SE corresponds to higher cutting efficiency.
SE = E/M
Chip mass and consumed energy closely correlate to rock fractures and rolling forces, respectively. Thus, rock fractures and cutting forces are mainly analyzed.
3.1. Rock Fractures
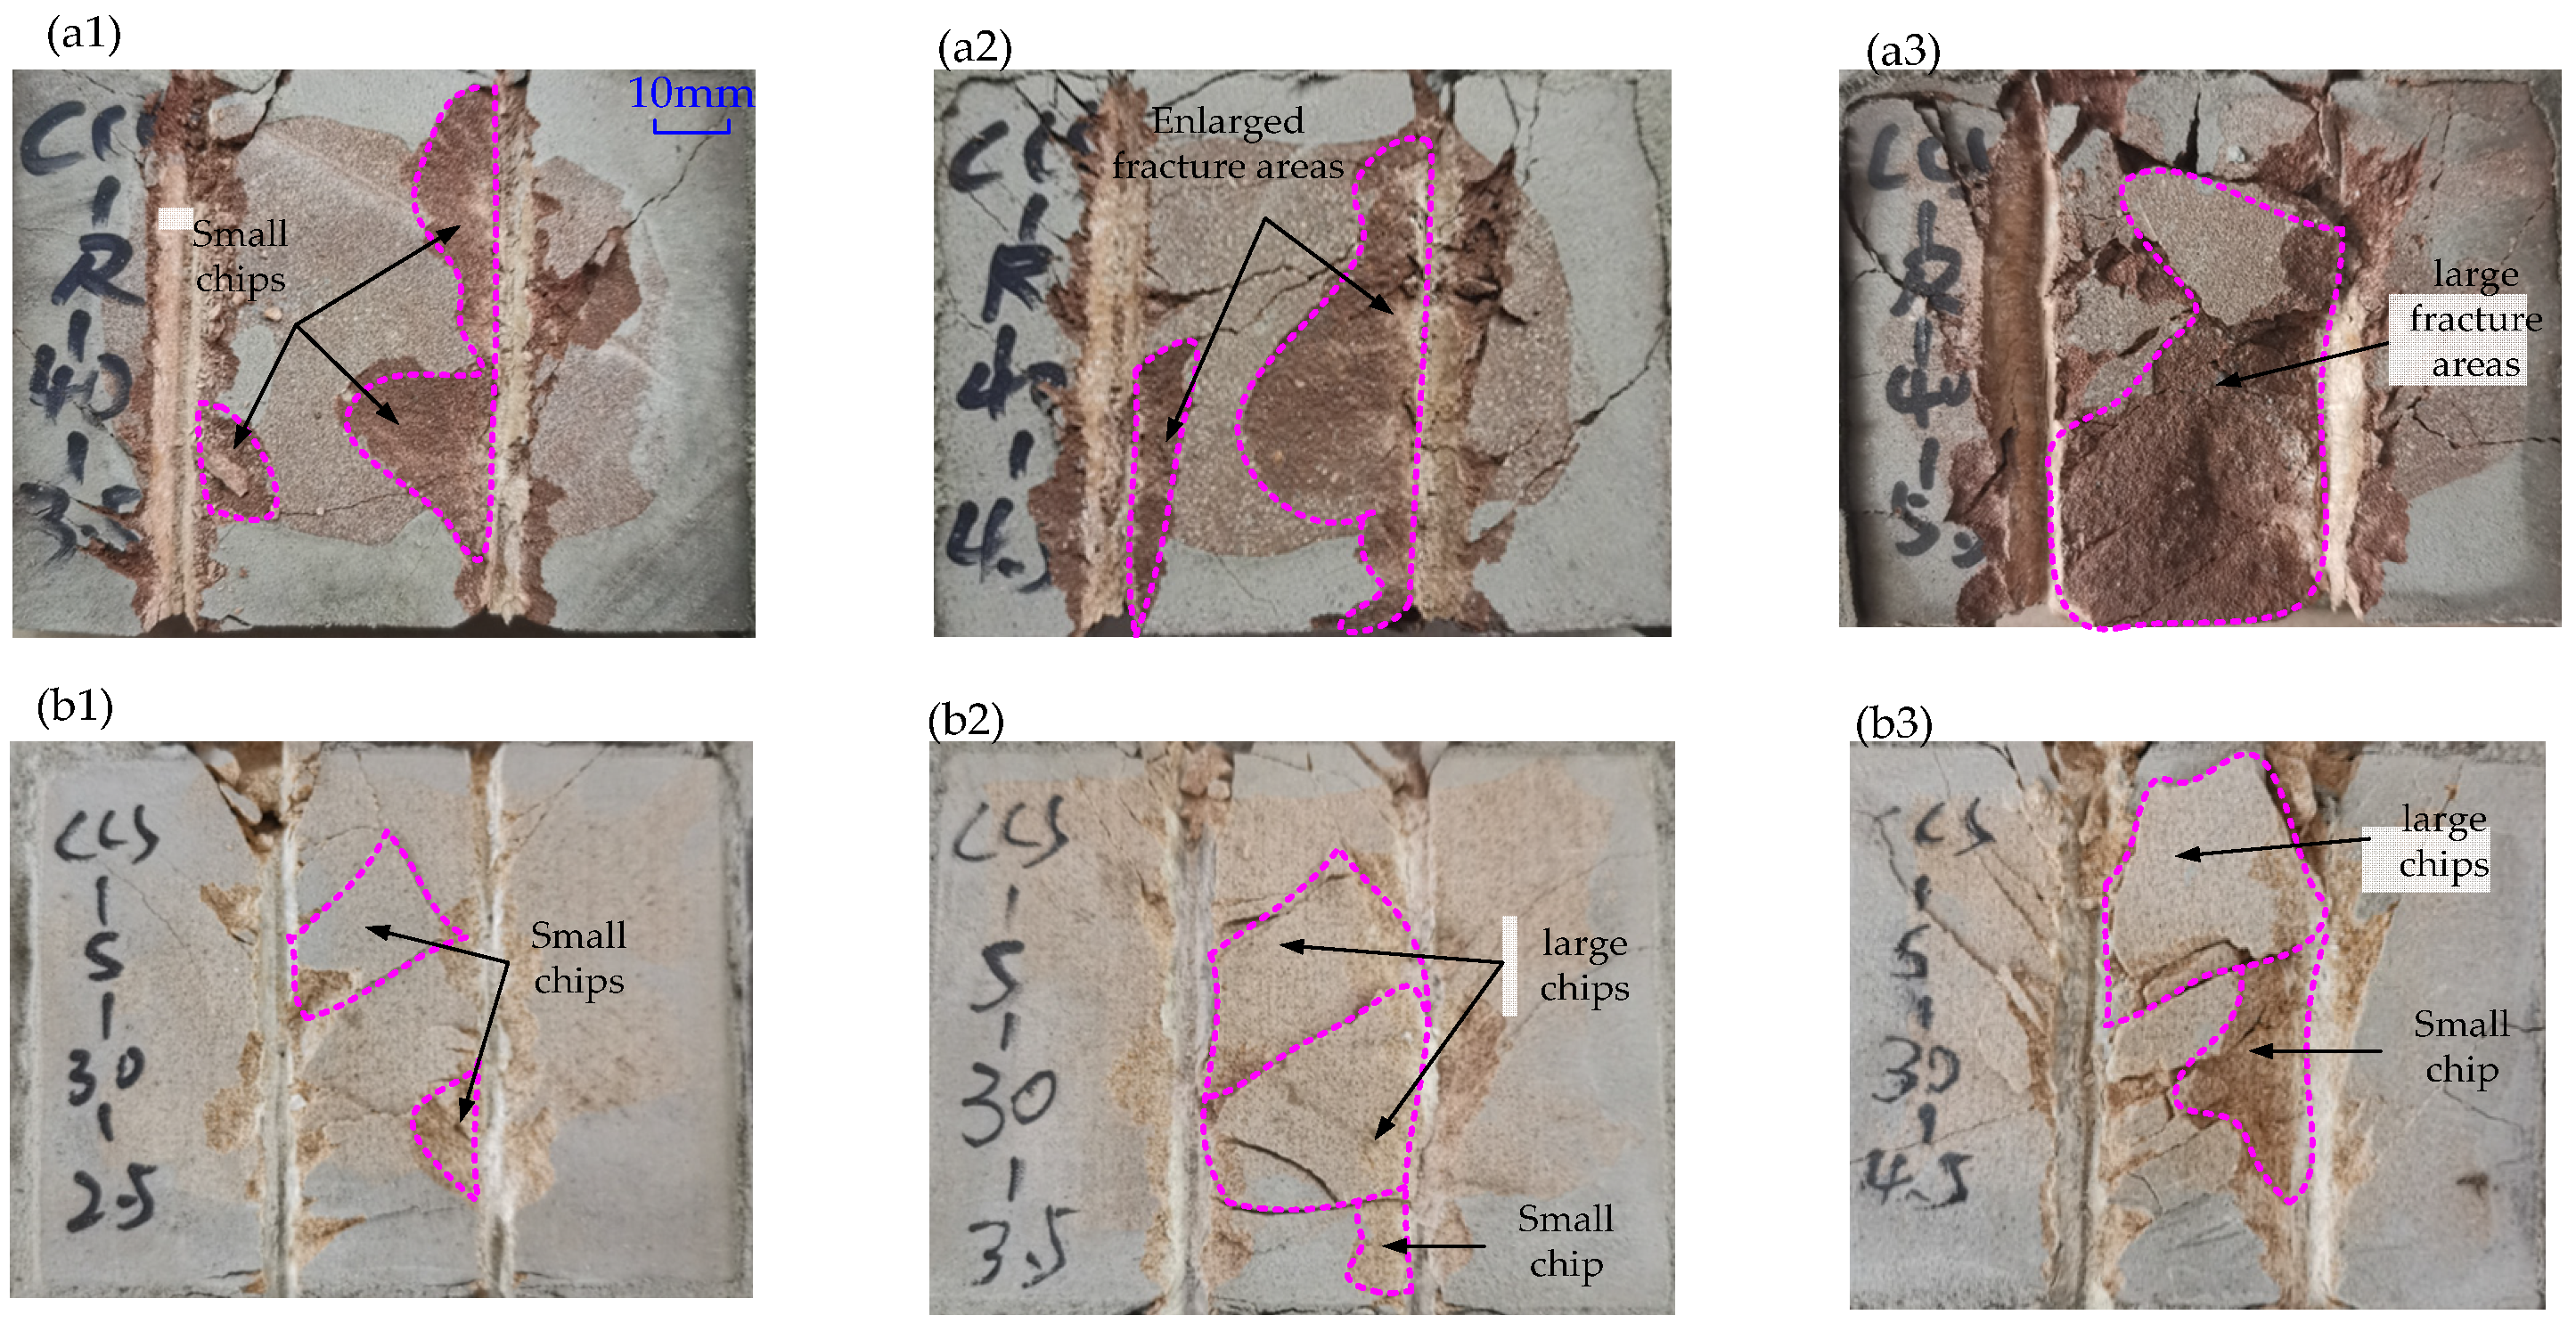
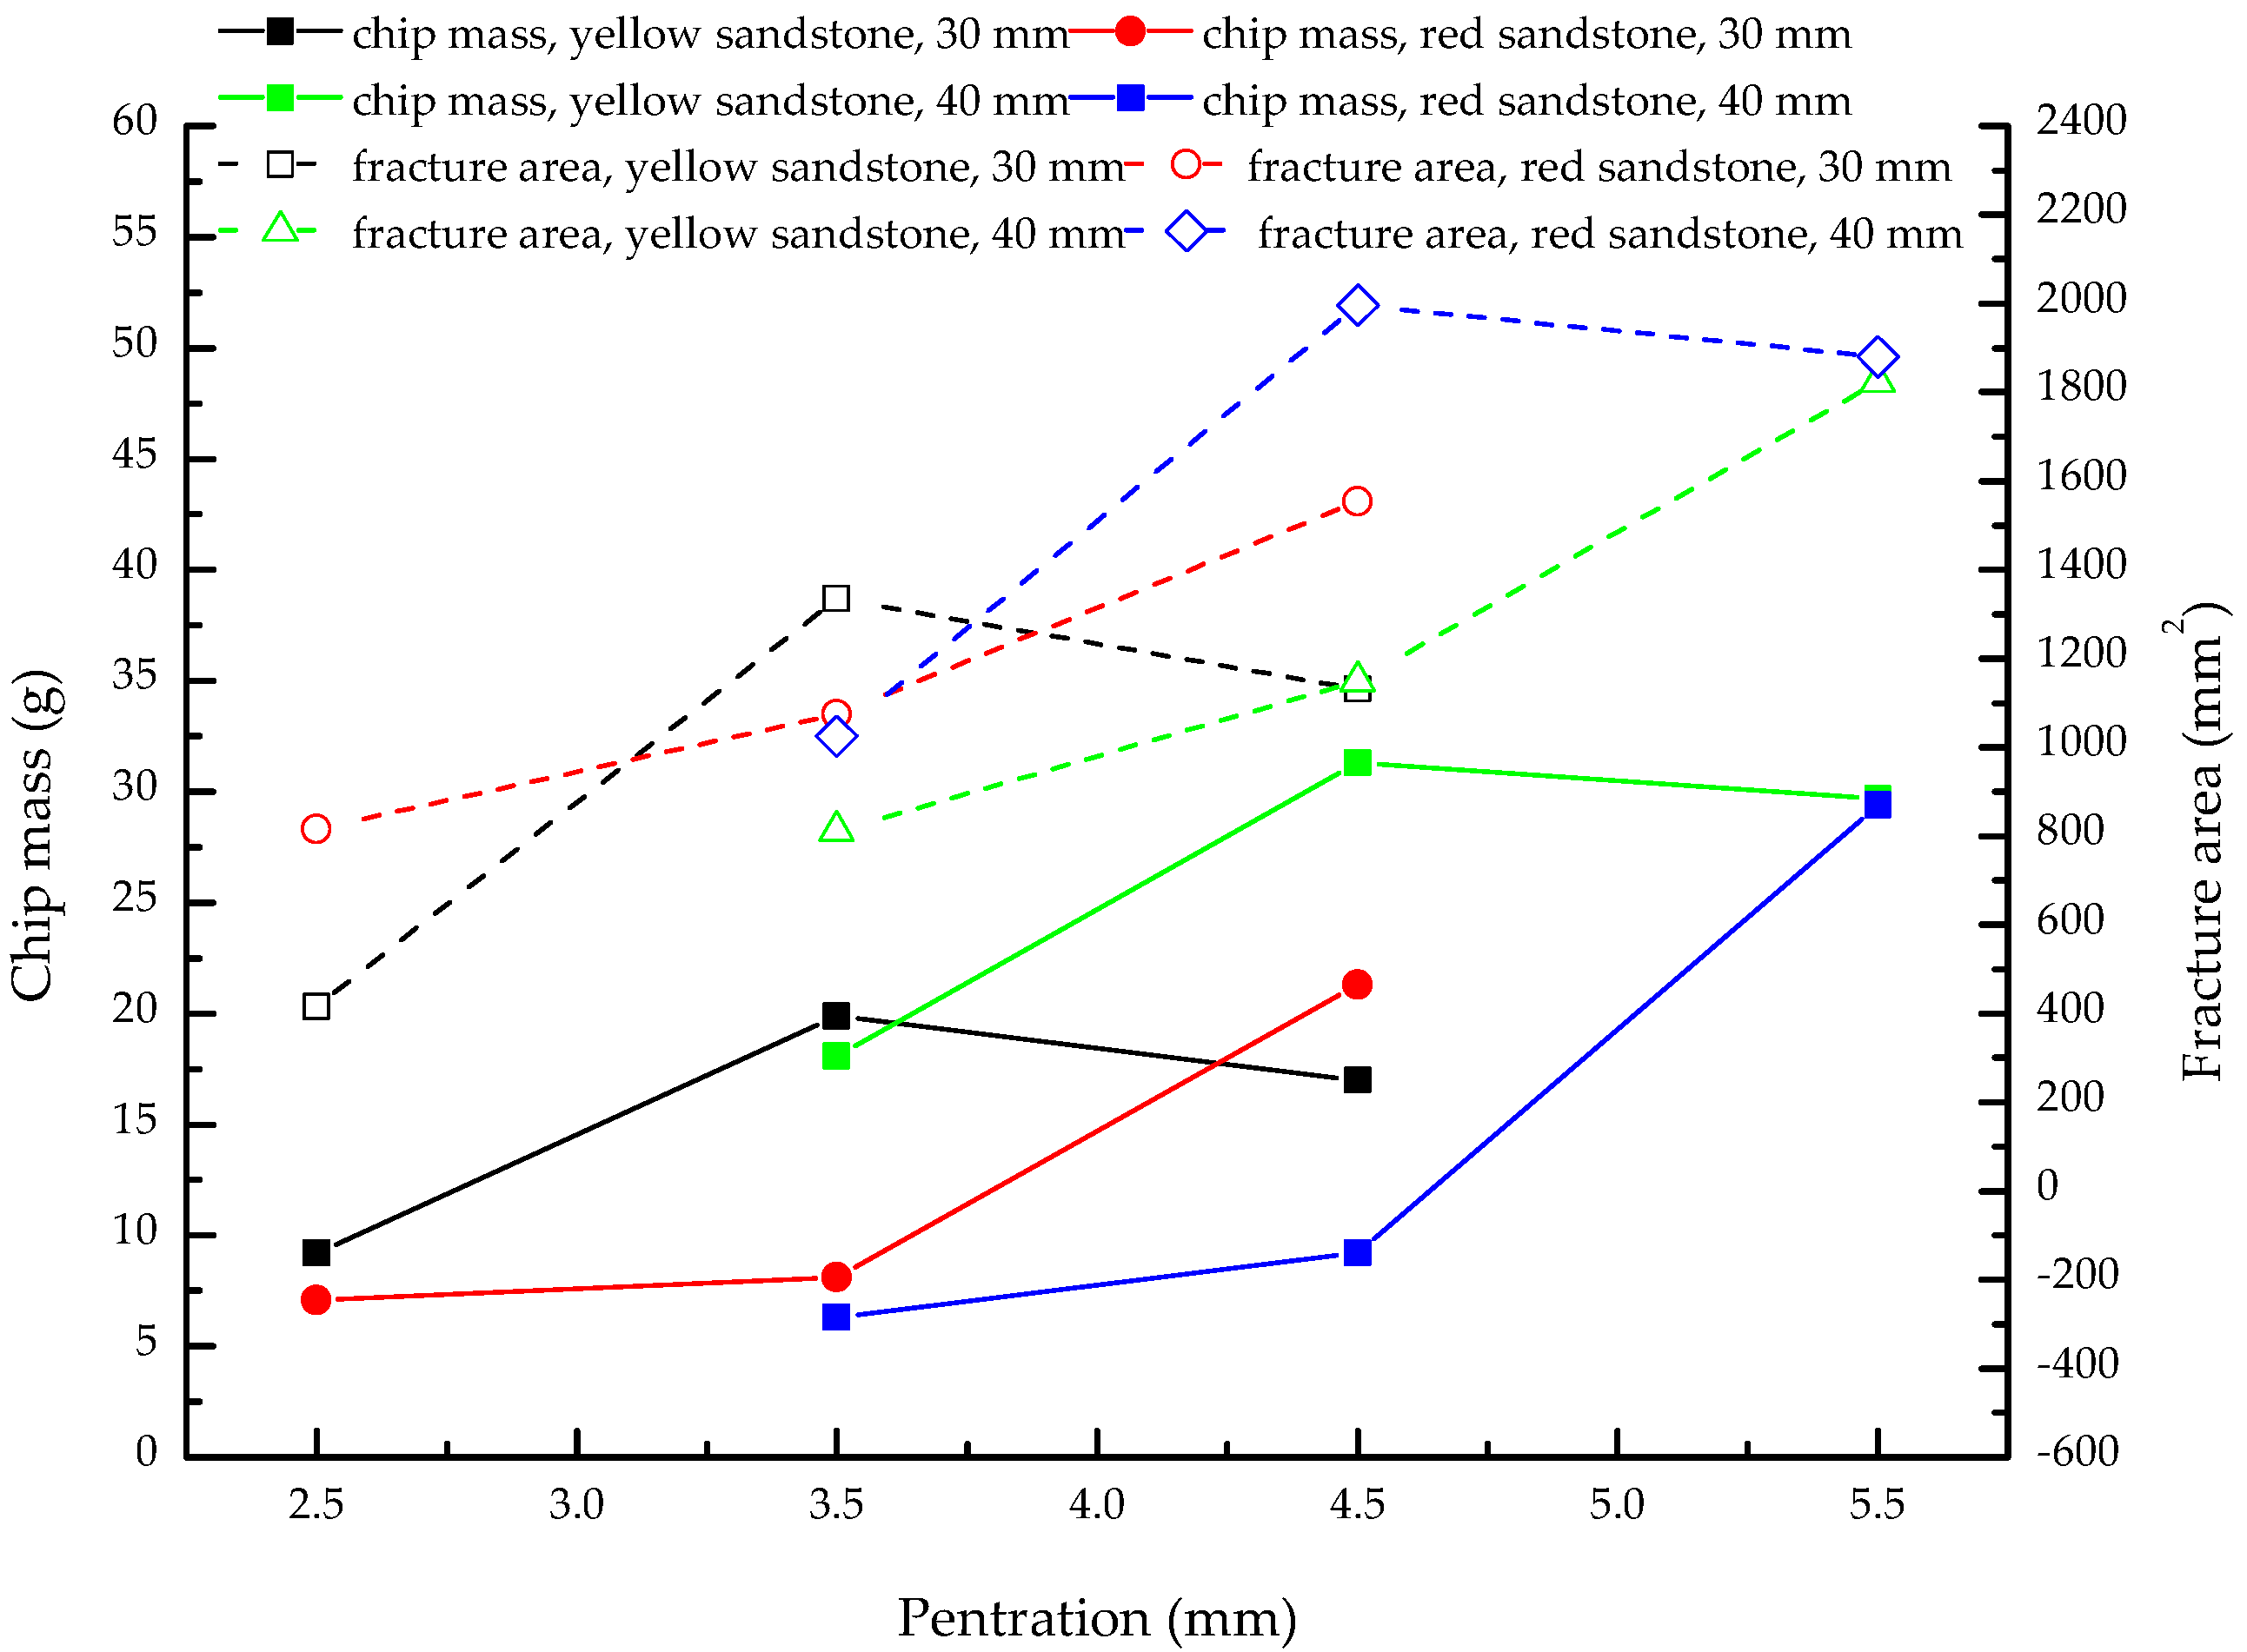
Figure 2(a1) shows that small chips (enclosed in the pink dash lines) near the cuts formed for the spacing of 40 mm when the penetration depth was 3.5 mm. When the penetration increased to 4.5 mm, the chipped area near cuts expanded (Figure 2(a2)). For the penetration of 5.5 mm, Figure 2(a3) shows that a large chip, connecting adjacent cuts, formed. Similar increases in fracture area with the increasing penetration occurred (Figure 2(b1–b3) and figures not shown). Thus, the laboratory results agree well with previous studies that the increase in penetration can expand the fracture area (Figure 3) [8,17]. Nevertheless, the relation between the fracture degree and the chip mass is still unknown. By collecting and weighing the chips after two cuts, the chip masses in linear cutting tests are plotted in Figure 3. Clearly, the increase in penetration frequently results in the promoted chip mass. Thus, we can conclude that the increase in penetration can cause increases in fracture area and chip mass.
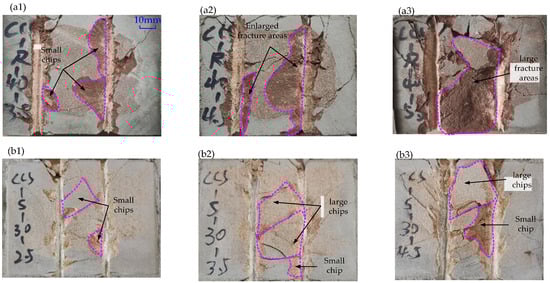
Figure 2.
Typical fractures: (a1–a3) are the fractures for the spacing of 40 mm of the red sandstone specimens; (b1–b3) are the fractures for the spacing of 30 mm of the yellow sandstone specimens.
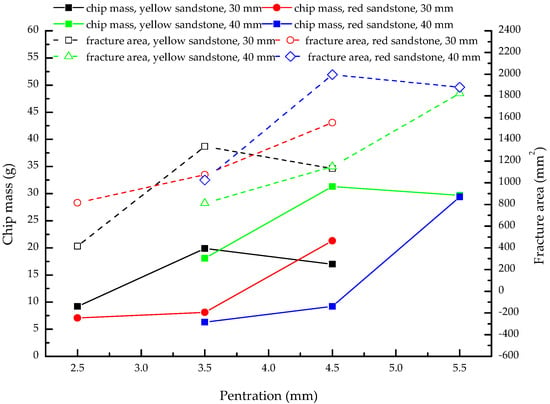
Figure 3.
Chip masses.
3.2. Rolling Force and Cutting Efficiency
Cutting energy (E) in the linear cutting test can be written as:
where Fr and l are the rolling force and cutting distance, respectively. The units of E, Fr and l are J, N and m.
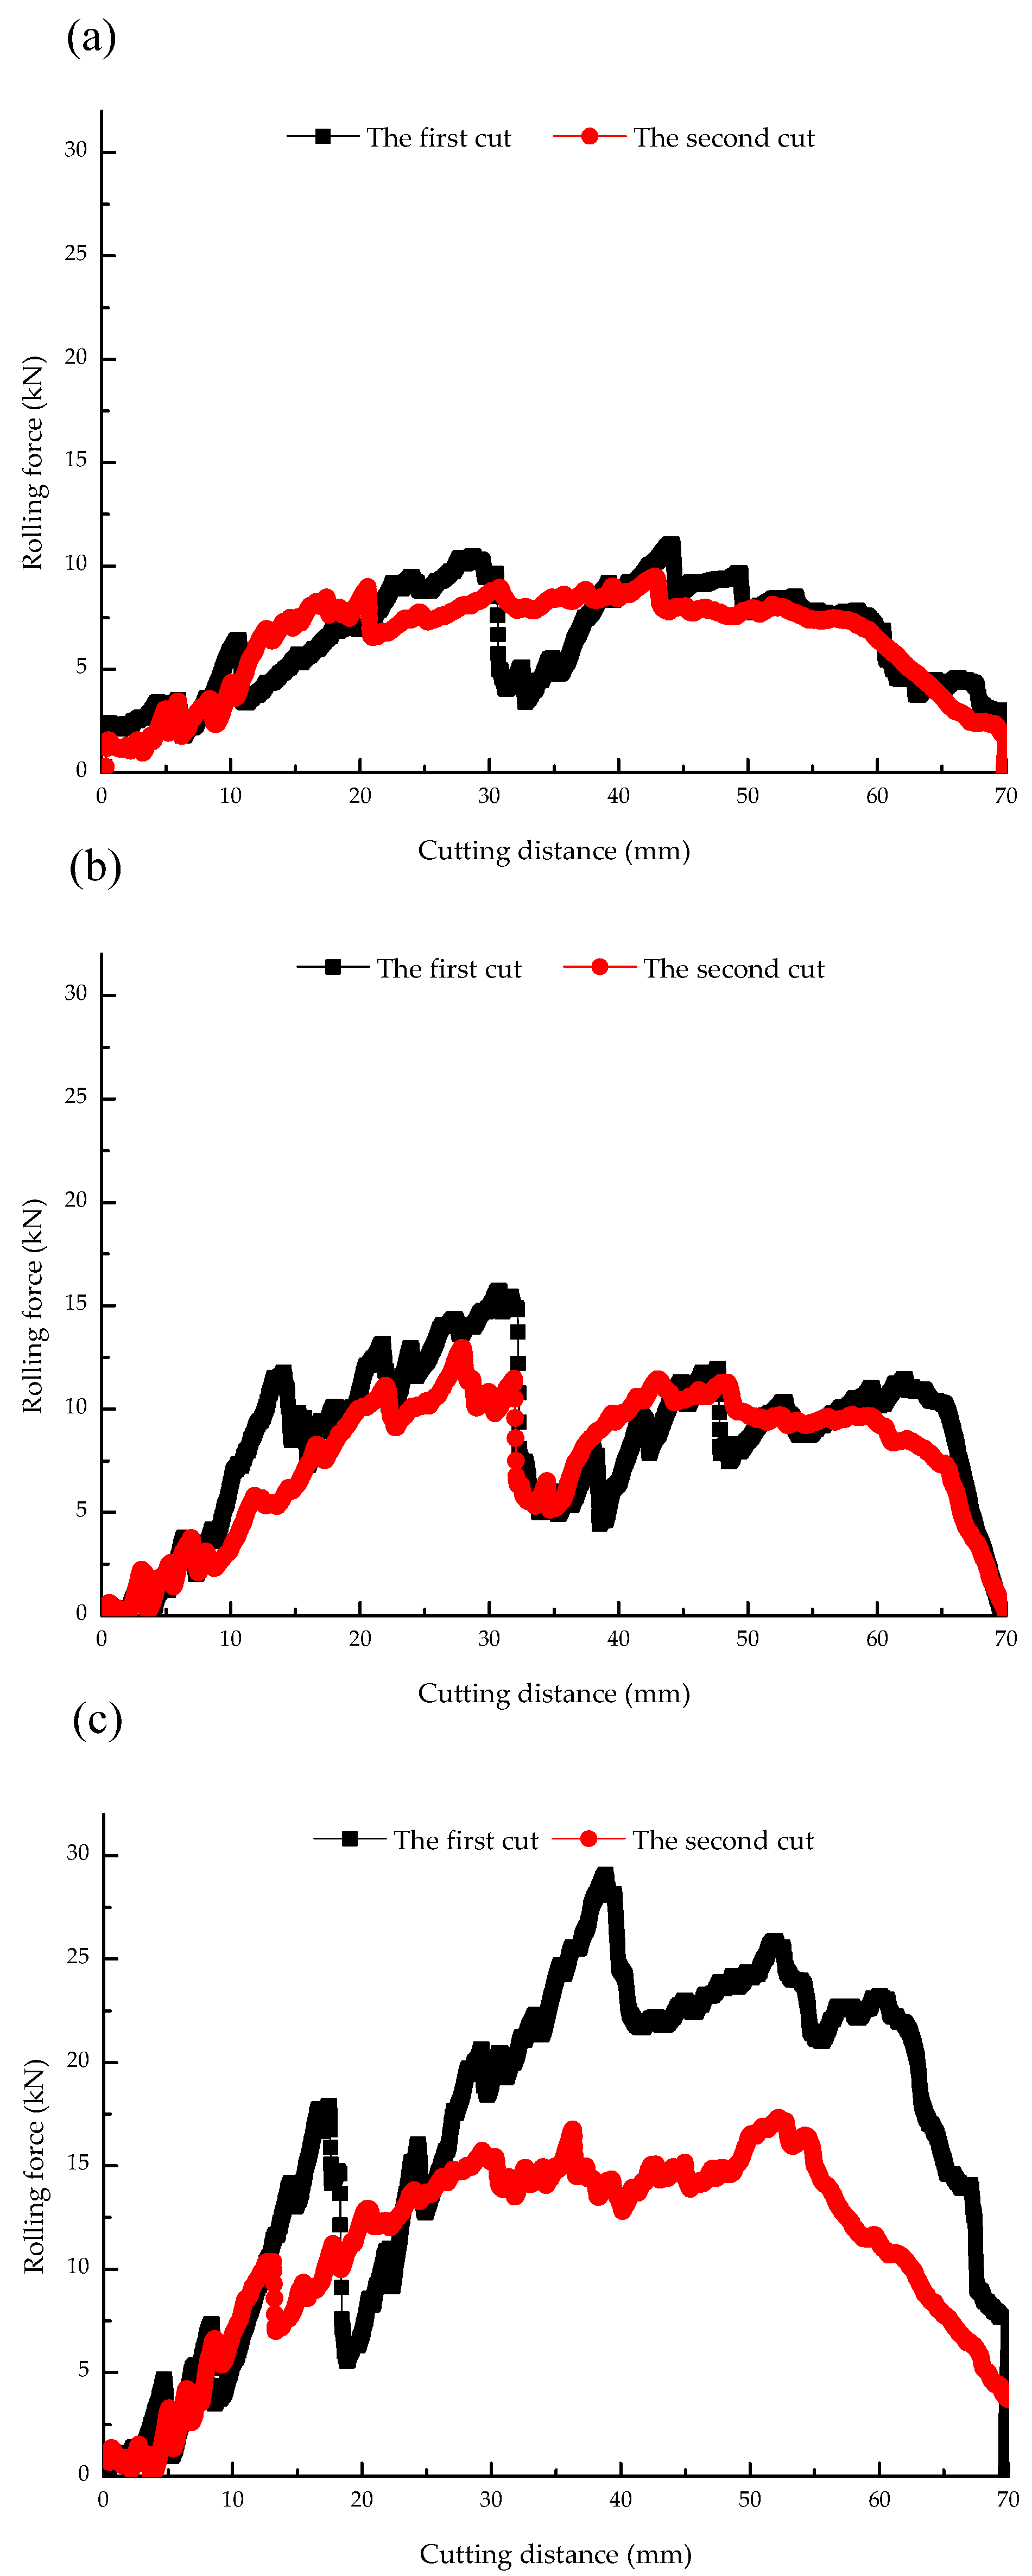
Figure 4 depicts the typical rolling forces of the red sandstone specimens when the spacing is 40 mm. When the penetration is 3.5 mm, the maximum value of the rolling force, consisting of many fluctuations, is lower than 12.5 kN (Figure 4a). Figure 4a shows that the rolling force of the second cut significantly overlaps with that of the first cut. This phenomenon is reasonable, because the damage of the first cut is limited because of the small penetration. When the penetration increases to 4.5 mm, Figure 4b clearly shows that the maximum value is higher than 15 kN. In addition, because the increased penetration of the first cut can result in promoted damage to the rock, the rolling force of the first cut is slightly higher than that of the second cut. With further increase in penetration to 5.5 mm, Figure 4c shows that the maximum rolling force increases to about 30 kN. In addition, the rolling force of the second cut is much larger than that of the first cut because of the promoted damage caused by the first cut with increased penetration. Similar results are obtained in the other tests (figures not shown).
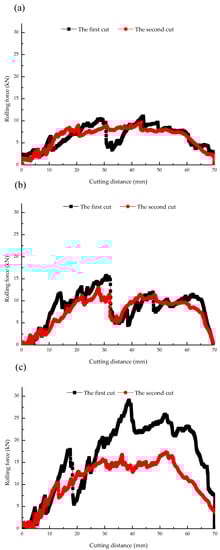
Figure 4.
Typical rolling forces: (a–c) are the rolling forces for the spacing of 40 mm when the penetrations are 3.5 mm, 4.5 mm and 5.5 mm, respectively.
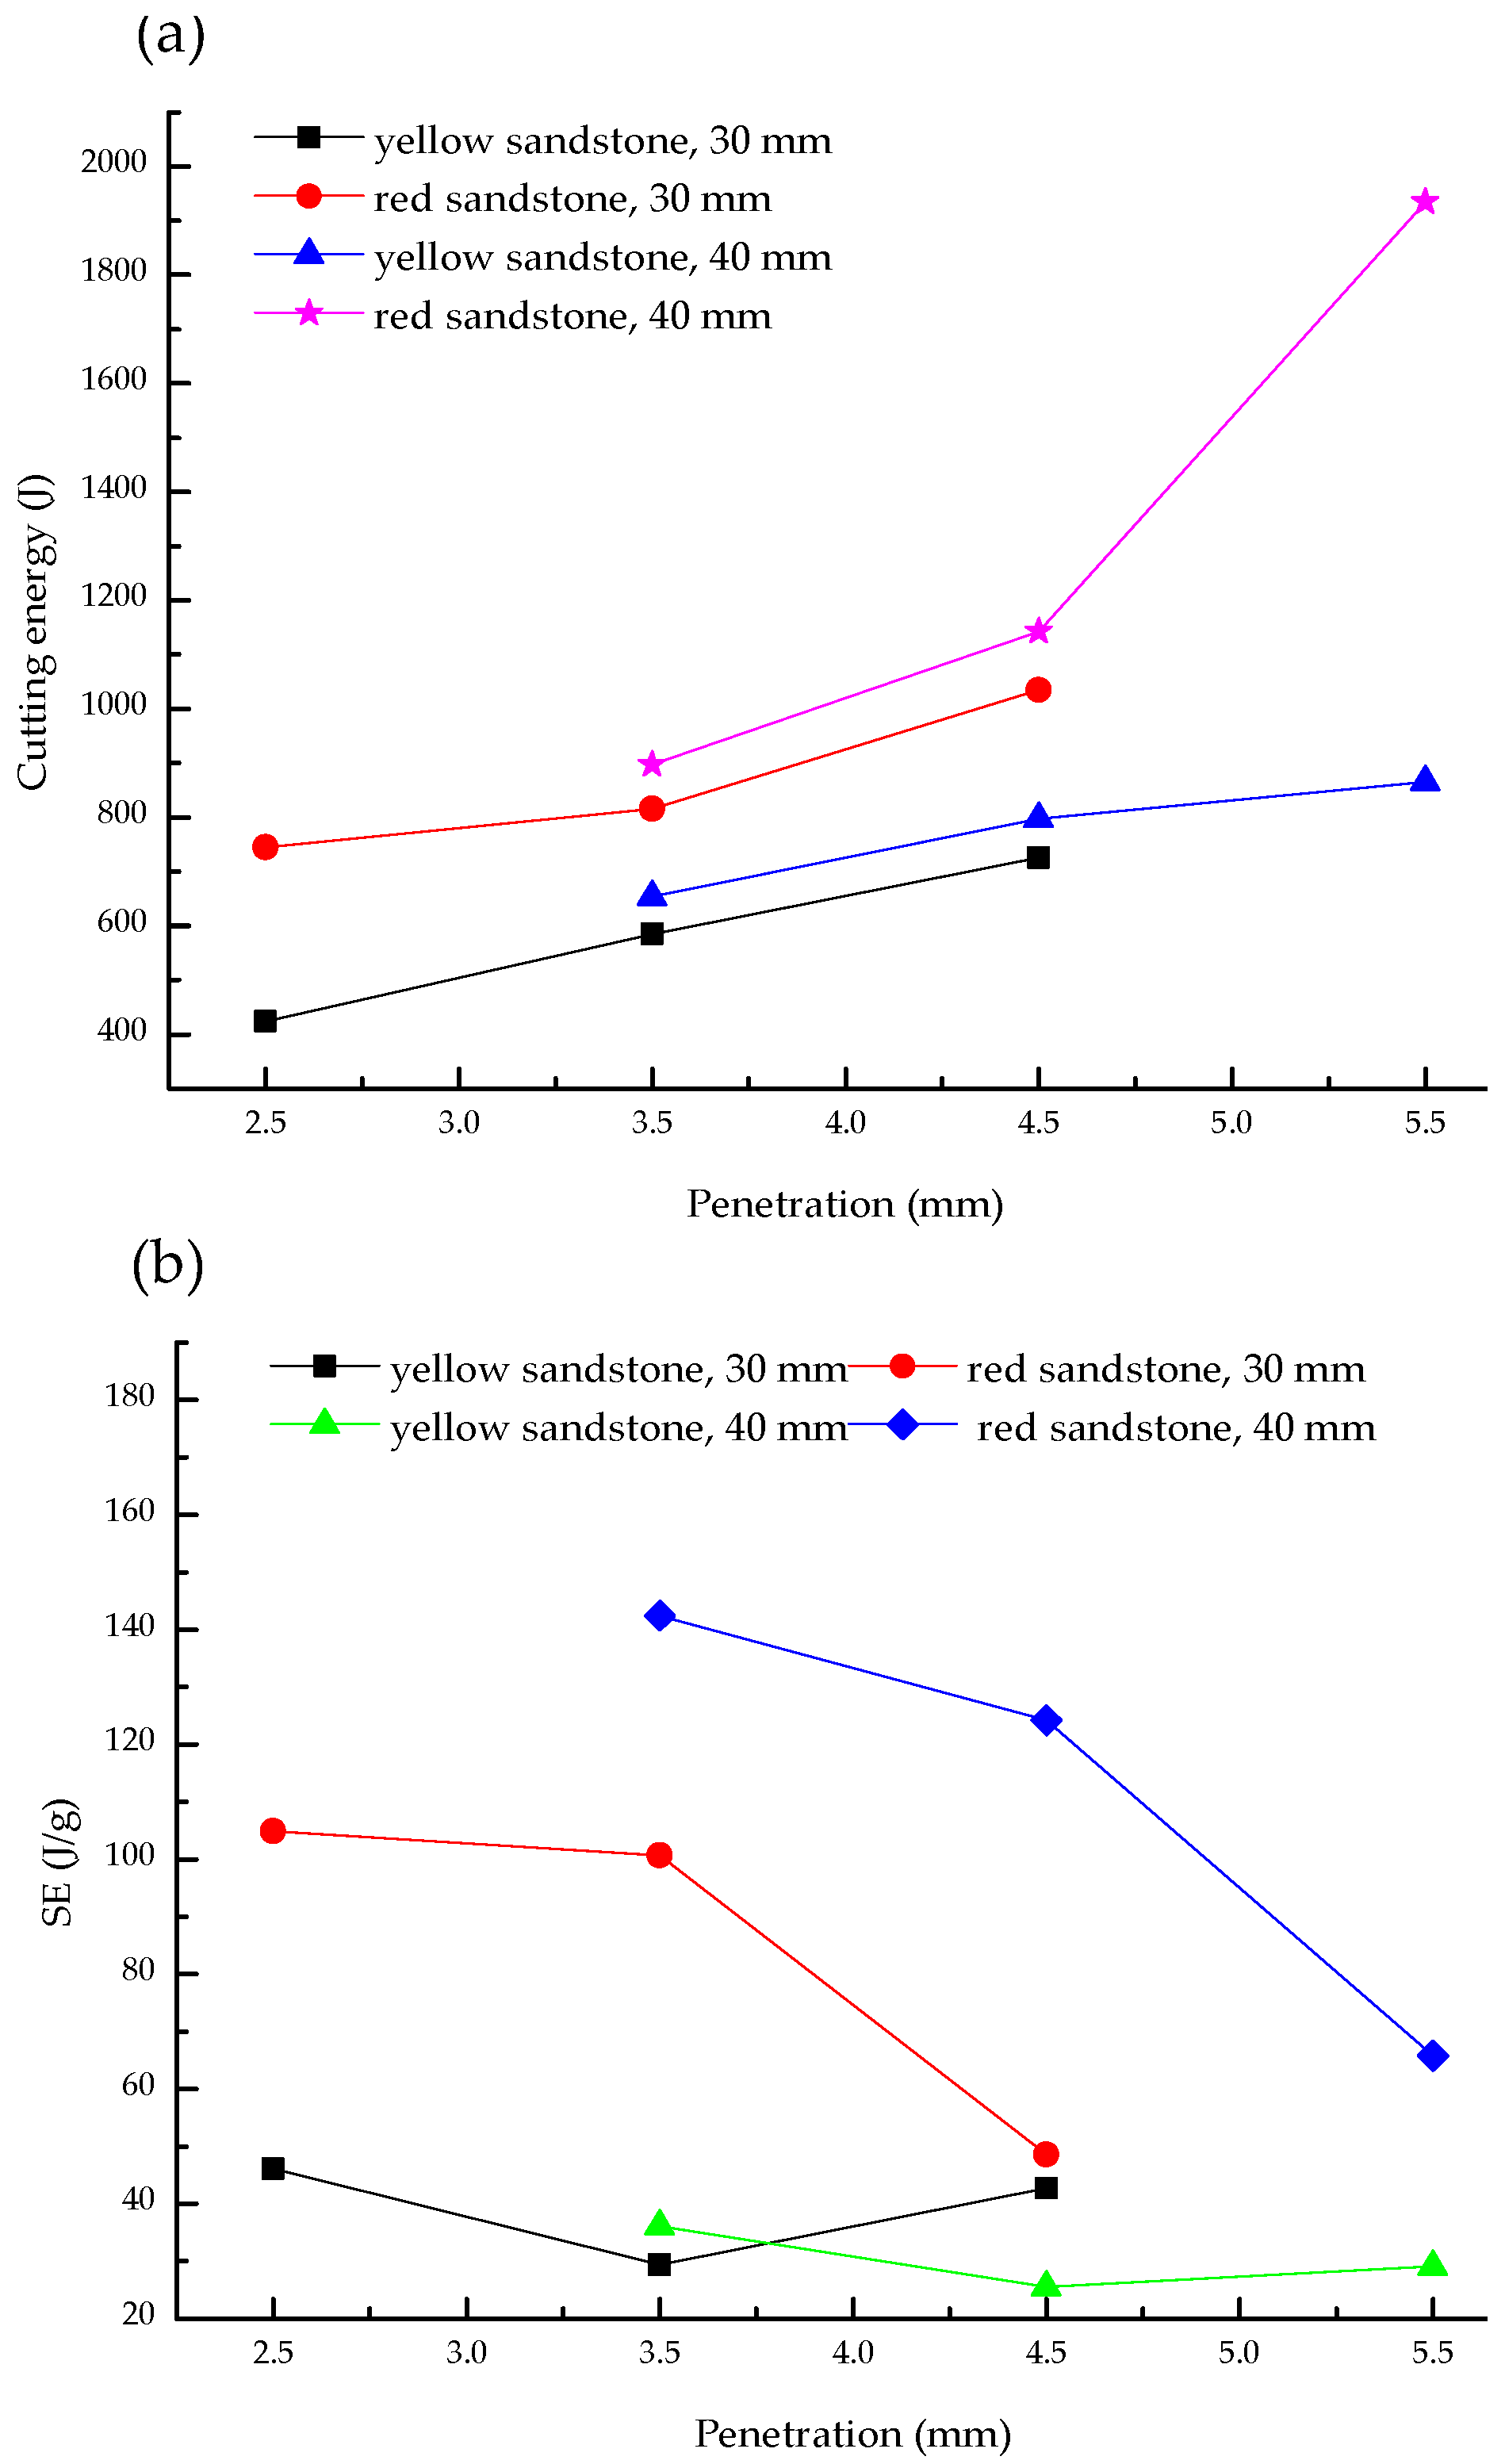
According to Equation (2), the consumed energies for various linear cutting tests are plotted in Figure 5a. Clearly, for the same spacing, the increase in penetration increases the consumed energy. This result can be explained by the influence of penetration on rolling force (Figure 4). In addition, for the same penetration depth, Figure 5a shows that the consumed energies for the spacing of 40 mm are higher. This phenomenon is reasonable, because rock specimens may be weakened by the first cut. For the same penetration, the consumed energies of the first cut for the spacings of 30 mm and 40 mm are close. Nevertheless, the weaken effect may impair with the increase in spacing. Thus, the weaken effect on the rock where the second cut acts is less obvious for the spacing of 40 mm. Consequently, the rolling forces and the consumed energies of the second cut for the spacing of 40 mm are higher.
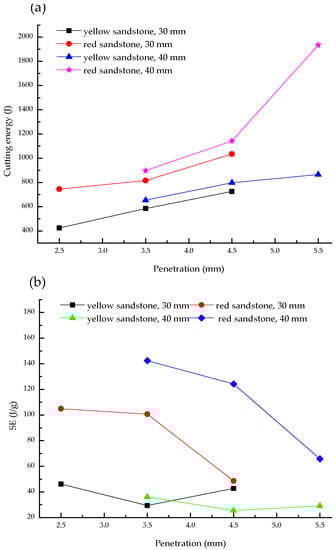
Figure 5.
Cutting energy and efficiency: (a,b) are the consumed energies and the SE, respectively.
The above descriptions indicate that the increase in penetration can increase chip masses (Figure 3). Nevertheless, the consumed energies are also promoted by the increased penetrations. To evaluate cutting efficiency, SE is obtained using Equation (1) (Figure 5b). Clearly, the SE for the red sandstone specimens decreases with the increase in penetration. For the yellow sandstone specimens, the increase in penetration first decreases SE. Then, the slightly decreased chip mass (Figure 3) and the increase in cutting energy (Figure 5a) slightly promote SE. However, Figure 5b shows that the SE integrally tends to decrease with the increase in penetration for the yellow sandstone specimens. Thus, we can conclude that the increase in penetration (ranging from 2.5 mm to 5.5 mm) can generate more chips and further promote cutting efficiency. However, the chip formation process and the relation between chip formation and rolling force fluctuations are still unknown. Thus, in the following section, the discrete element method, widely used to investigate rock fractures [29,30], is performed to discuss the laboratory results.
4. Discussion Using the Discrete Element Method
4.1. Numerical Model and Cutting Specifications
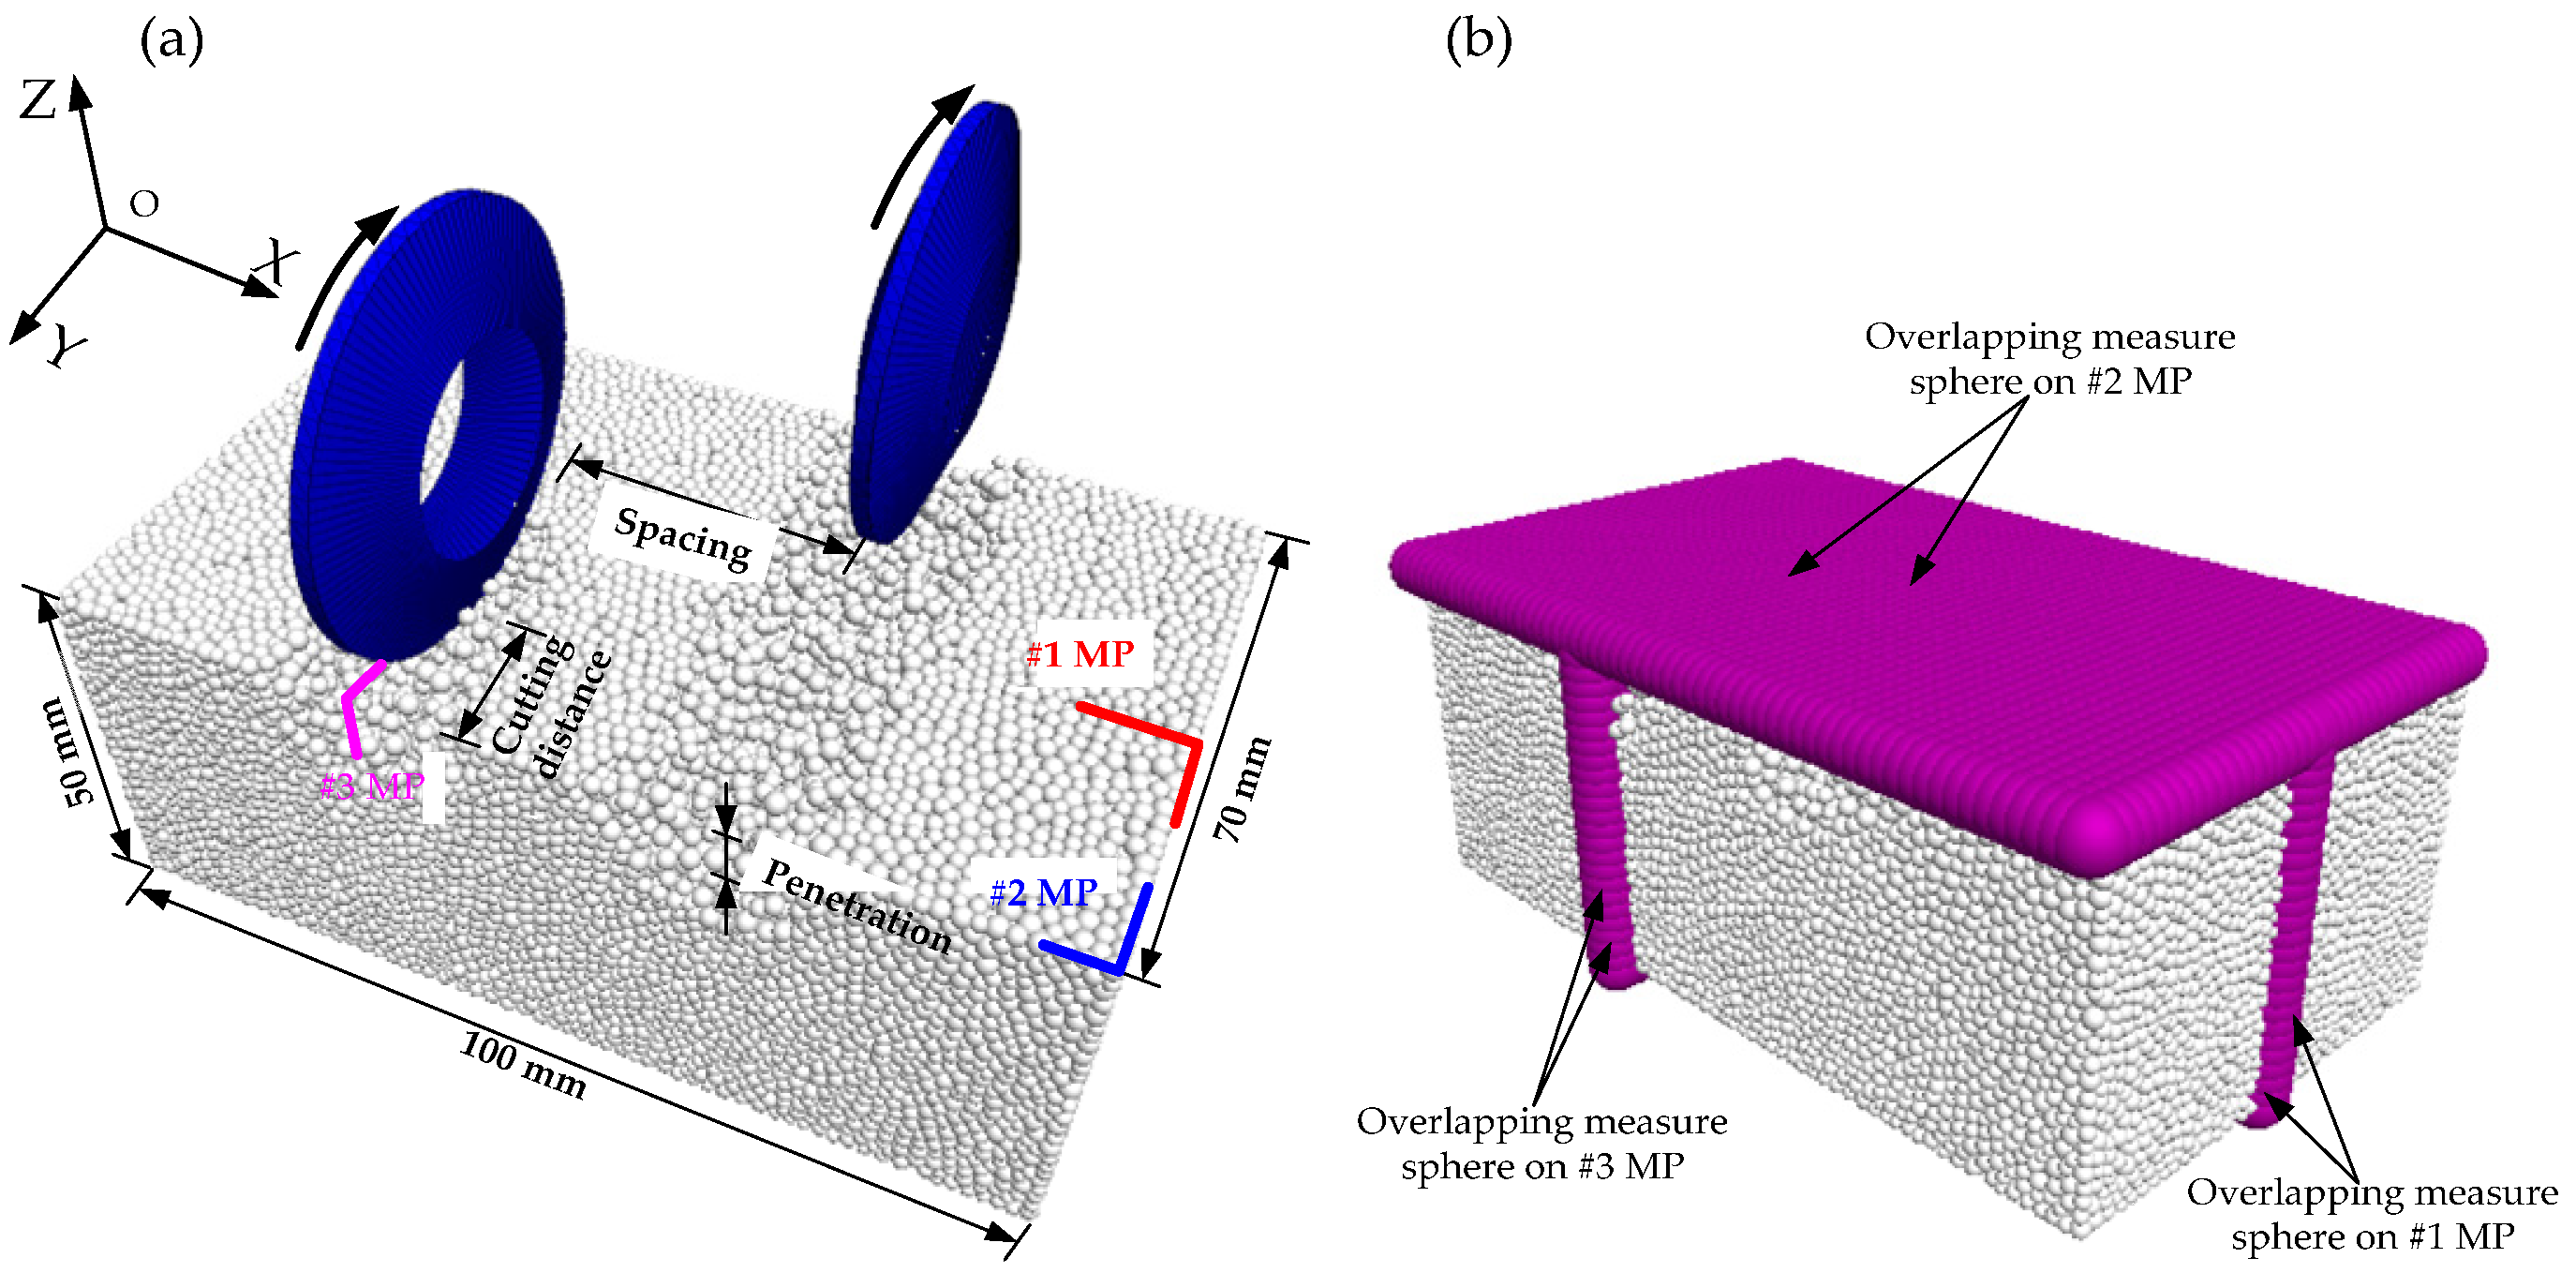
According to the laboratory specifications (Table 1), a numerical model consisting of 73,464 particles is established. These particles are connected by parallel bonds, widely used in rock fracture simulations [29,30,31]. In the present work, the linear cutting tests on red sandstone specimens for the spacing of 40 mm are simulated. Table 2 lists the mechanical parameters of this model. Clearly, the macro mechanical parameters are close to those of the laboratory tests. In the linear cutting process, the cutter advances with a constant velocity of 2 m/s [32]. Simultaneously, the angular velocity of the cutter is 85.1 rad/s. The rolling force of the cutter can cause stress concentrations in rock specimens. Then, these stress concentrations can initiate cracks and, further, form chips. Thus, to reveal the relation between rolling force and chip formation, three measure planes (MP) are installed in the model (Figure 6a). These measure planes consist of overlapping measure spheres with a radius of 4 mm (Figure 6b). Every measure sphere contains enough particles to record the stress σx, σy, σz, τxy, τxz and τyz. Thus, the contours of the tensile (σt), the shear (τ) and the compressive (σc) stresses on these planes can be plotted.
Table 2.
Numerical parameters.

Figure 6.
Numerical simulation: (a) the numerical cutting model; (b) measure planes.
4.2. Comparisons between Laboratory and Numerical Tests
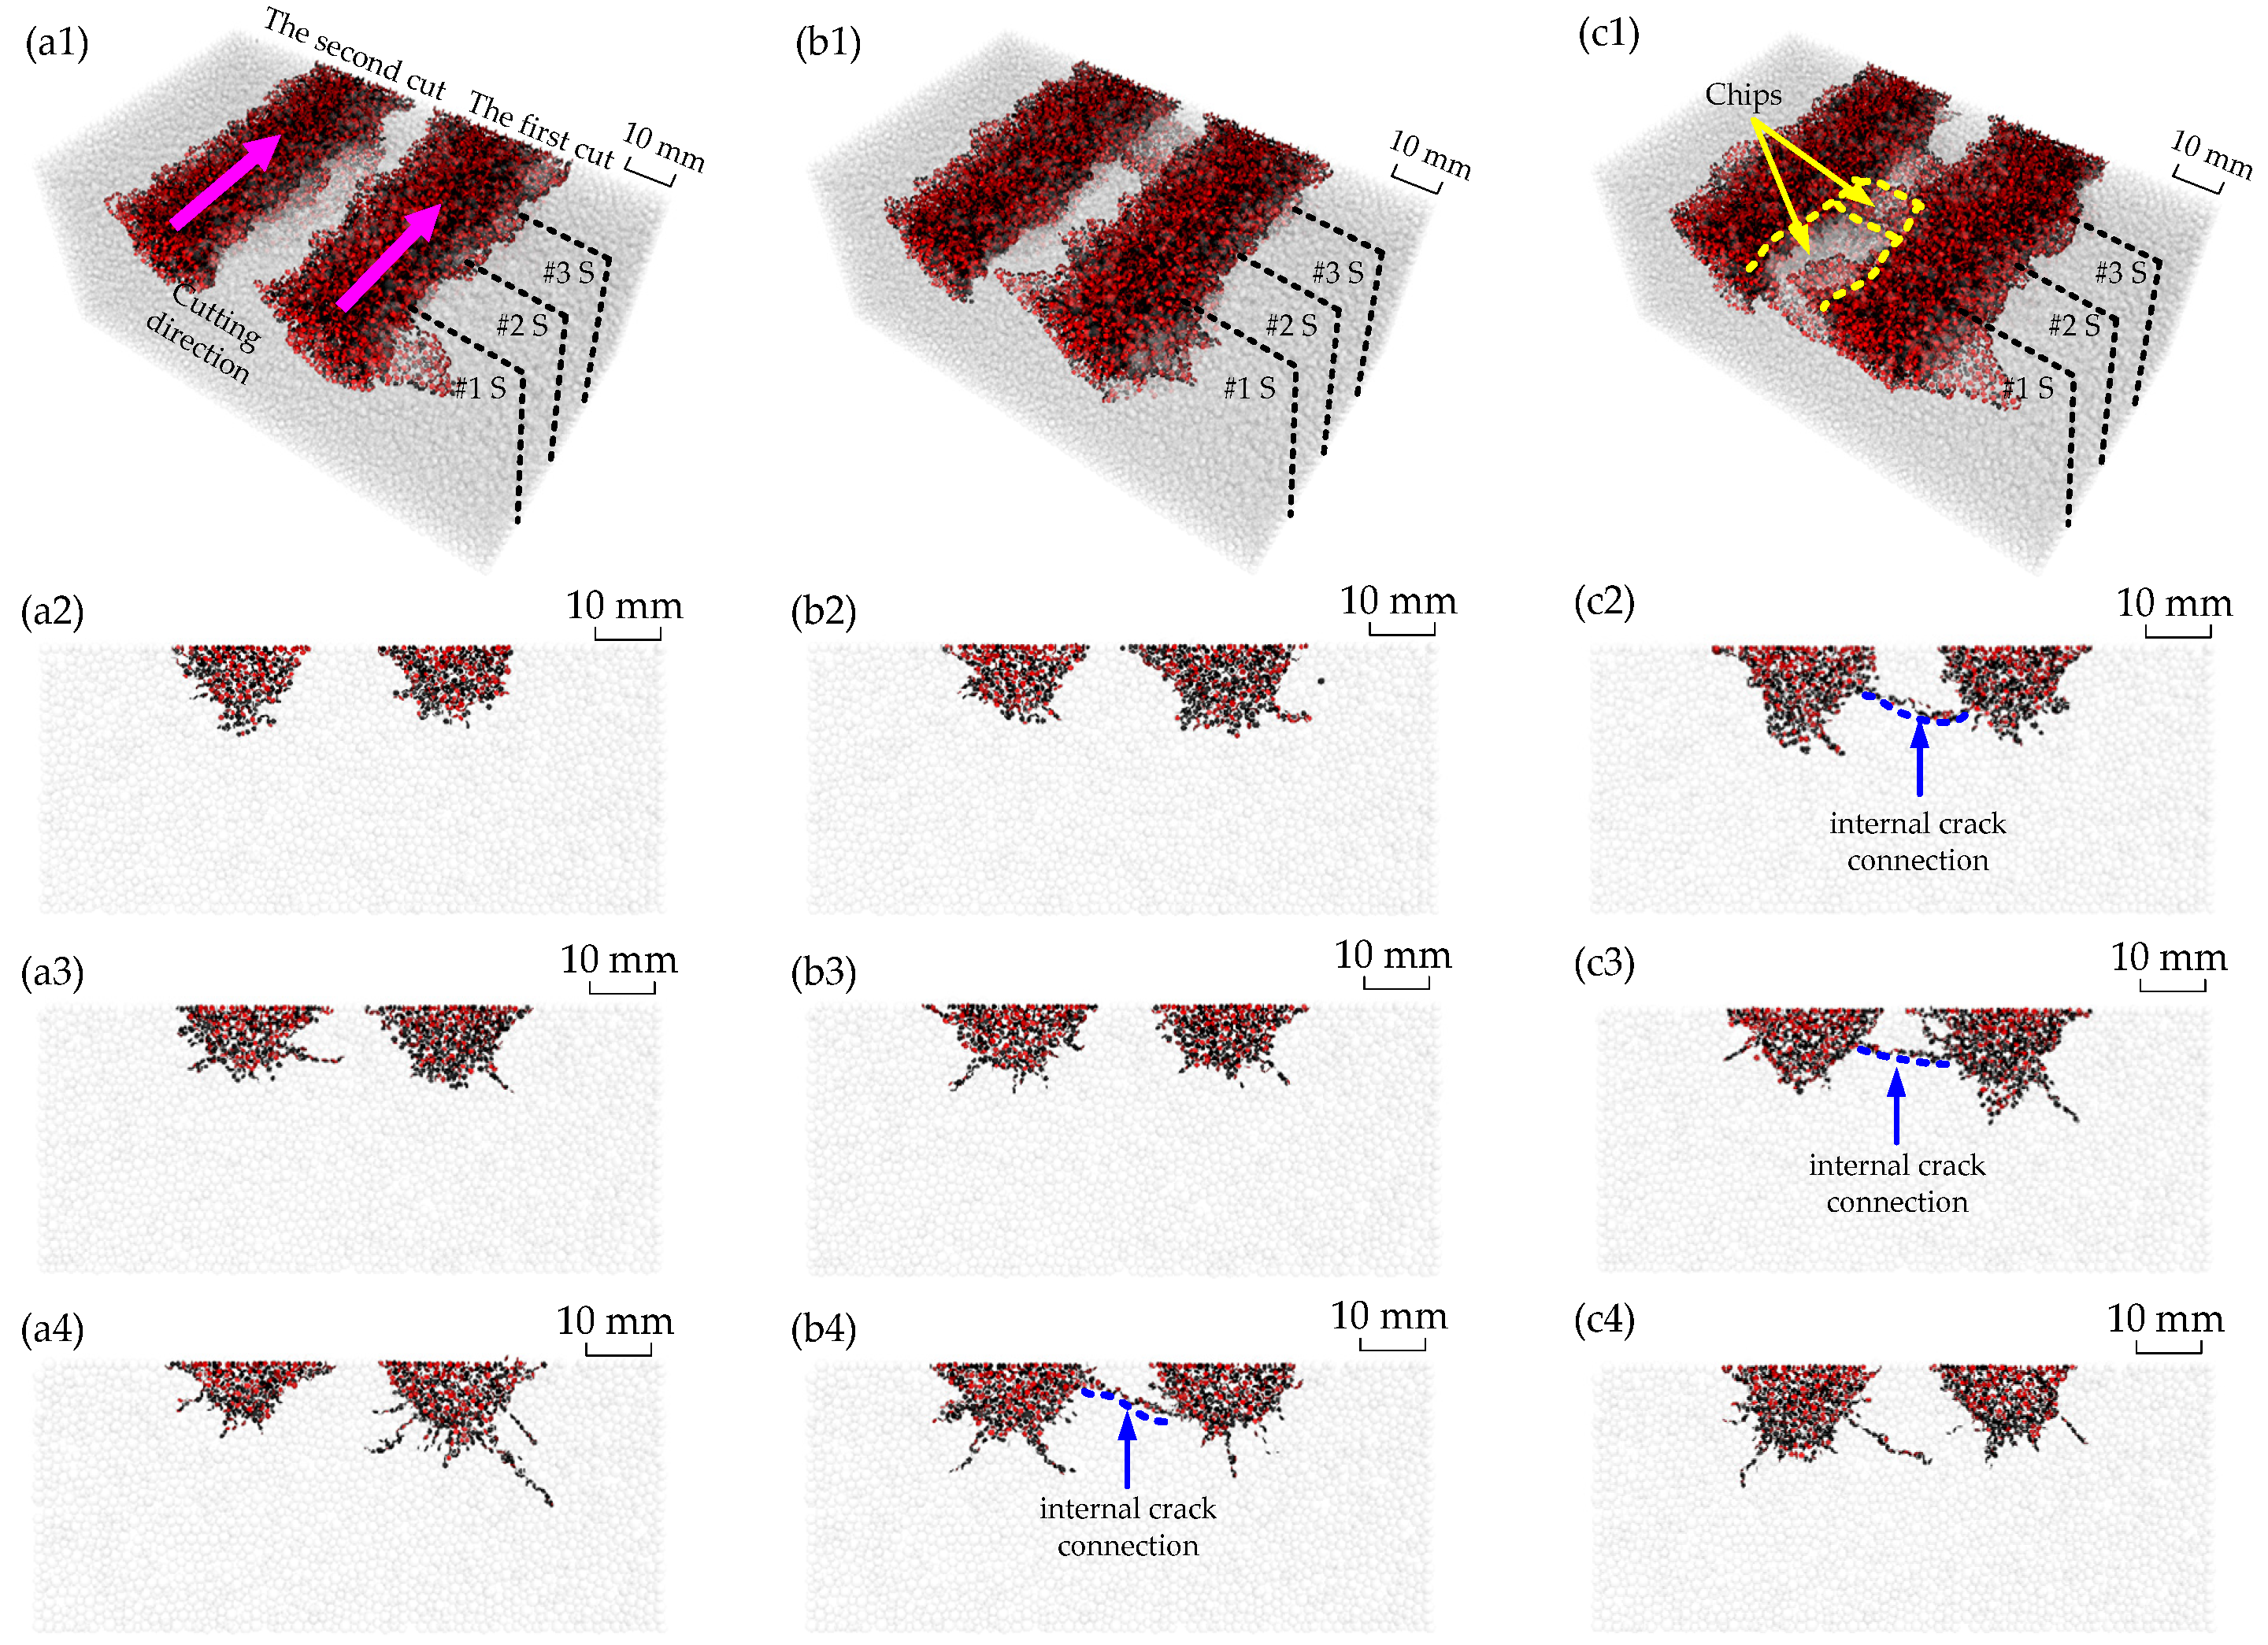
Figure 7 depicts the fractures of the red sandstone specimens for various penetrations when the spacing is 40 mm. When the penetration is 3.5 mm, Figure 7(a1) clearly shows that these two cuts seem to be independent, because the fractures on #1, #2 and #3 sections indicate that the cracks fail to connect two cuts (Figure 7(a2–a4)). Similar results are obtained for the penetration of 4.5 mm (Figure 7(b1–b3)); nevertheless, on the #3 section, a crack connects two cuts. When the penetration increases to 5.5 mm, two chips form because of the successful crack connections on #1 and #2 sections (Figure 7(c1–c3)).
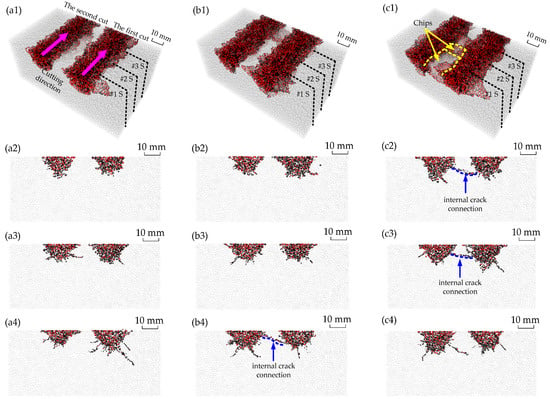
Figure 7.
Numerical fractures: (a1–c1) are the fractures after two cuts; (a2–c2) are the corresponding fractures on the #1 sections (#1 S); (a3–c3) are the corresponding fractures on the #2 sections (#2 S); (a4–c4) are the corresponding fractures on the #3 sections (#3 S).
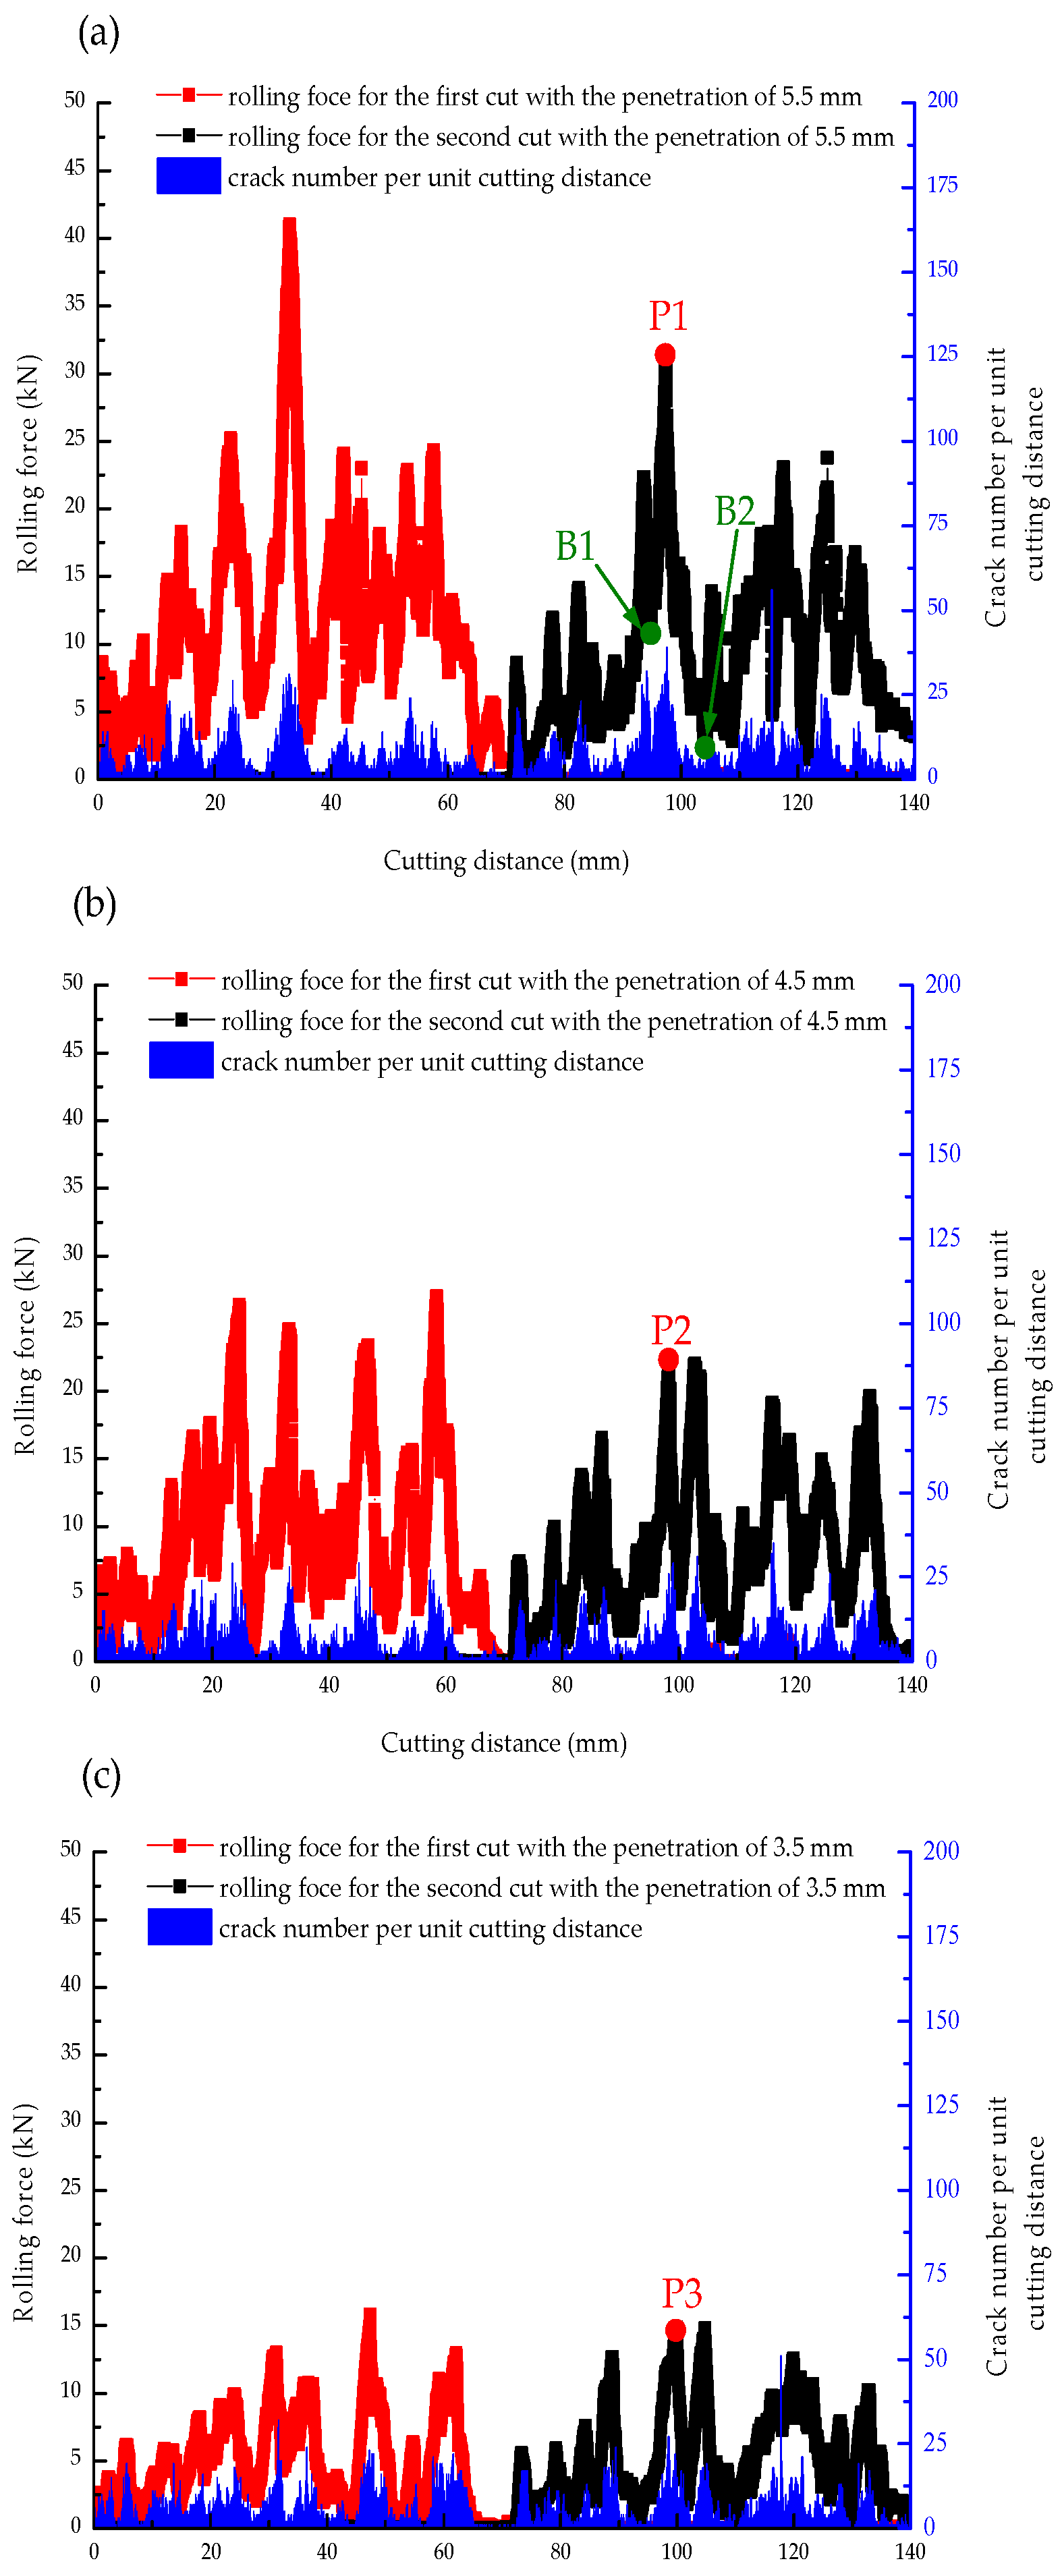
Figure 8 shows the rolling force curves for various penetrations. First, similar fluctuations in rolling forces, reported in previous studies [18,19,20,21,22] and the above laboratory tests, are observed. Second, when the penetration is 5.5 mm, the maximum rolling forces of the first and second cuts are about 41.5 kN and 31.8 kN (Figure 8a). When the penetration decreases to 3.5 mm, the corresponding values decrease to 16.1 kN and 14.8 kN (Figure 8c). Third, Figure 8 clearly shows that the increase in penetration results in a larger decrease in the second rolling force. The above descriptions on numerical fractures and rolling force indicate that the numerical results agree well with the laboratory tests. Thus, the feasibility of the numerical study is verified. More importantly, Figure 8 clearly shows that the fluctuations, especially the drops for rolling force, frequently accompany with promoted micro crack numbers per unit cutting distance. In other words, the fluctuations in rolling force correlate with rock fractures [27,28]. However, the detailed relation remains unclear.
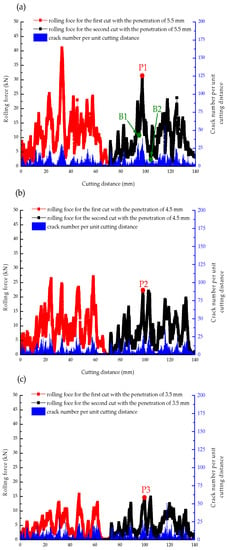
Figure 8.
Rolling forces: (a–c) are the rolling force for the penetration of 5.5 mm, 4.5 mm and 3.5 mm, respectively.
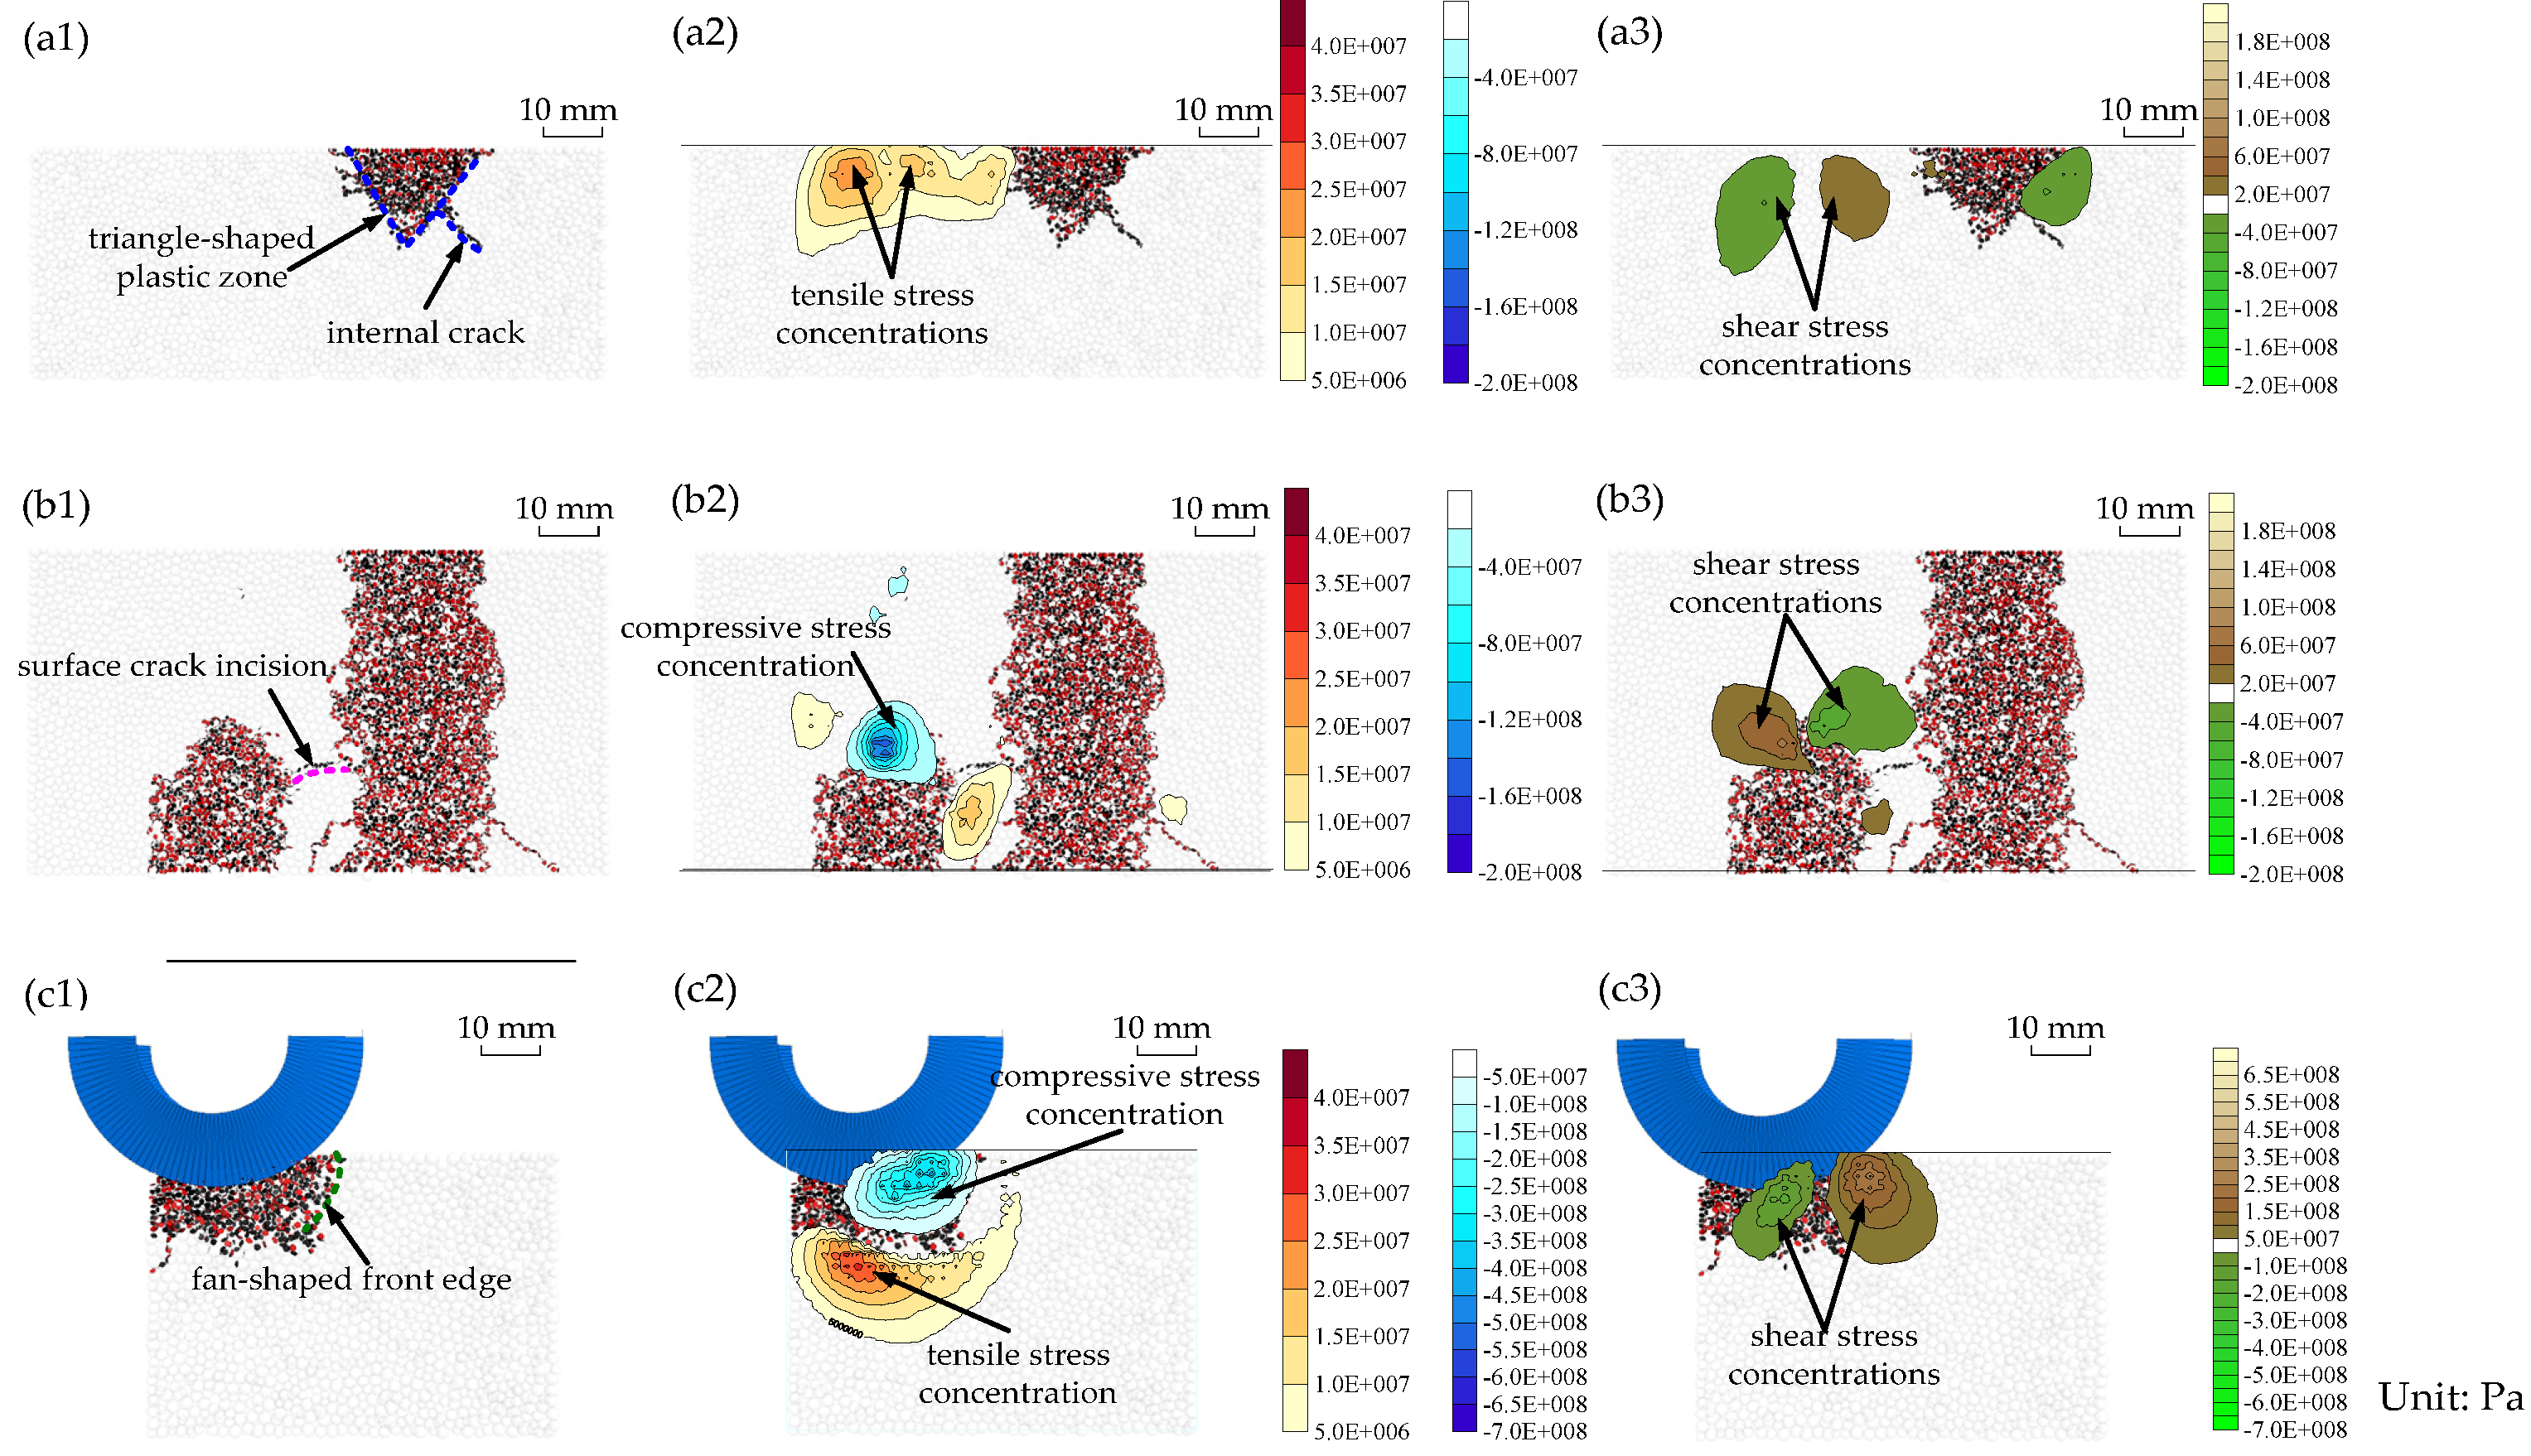
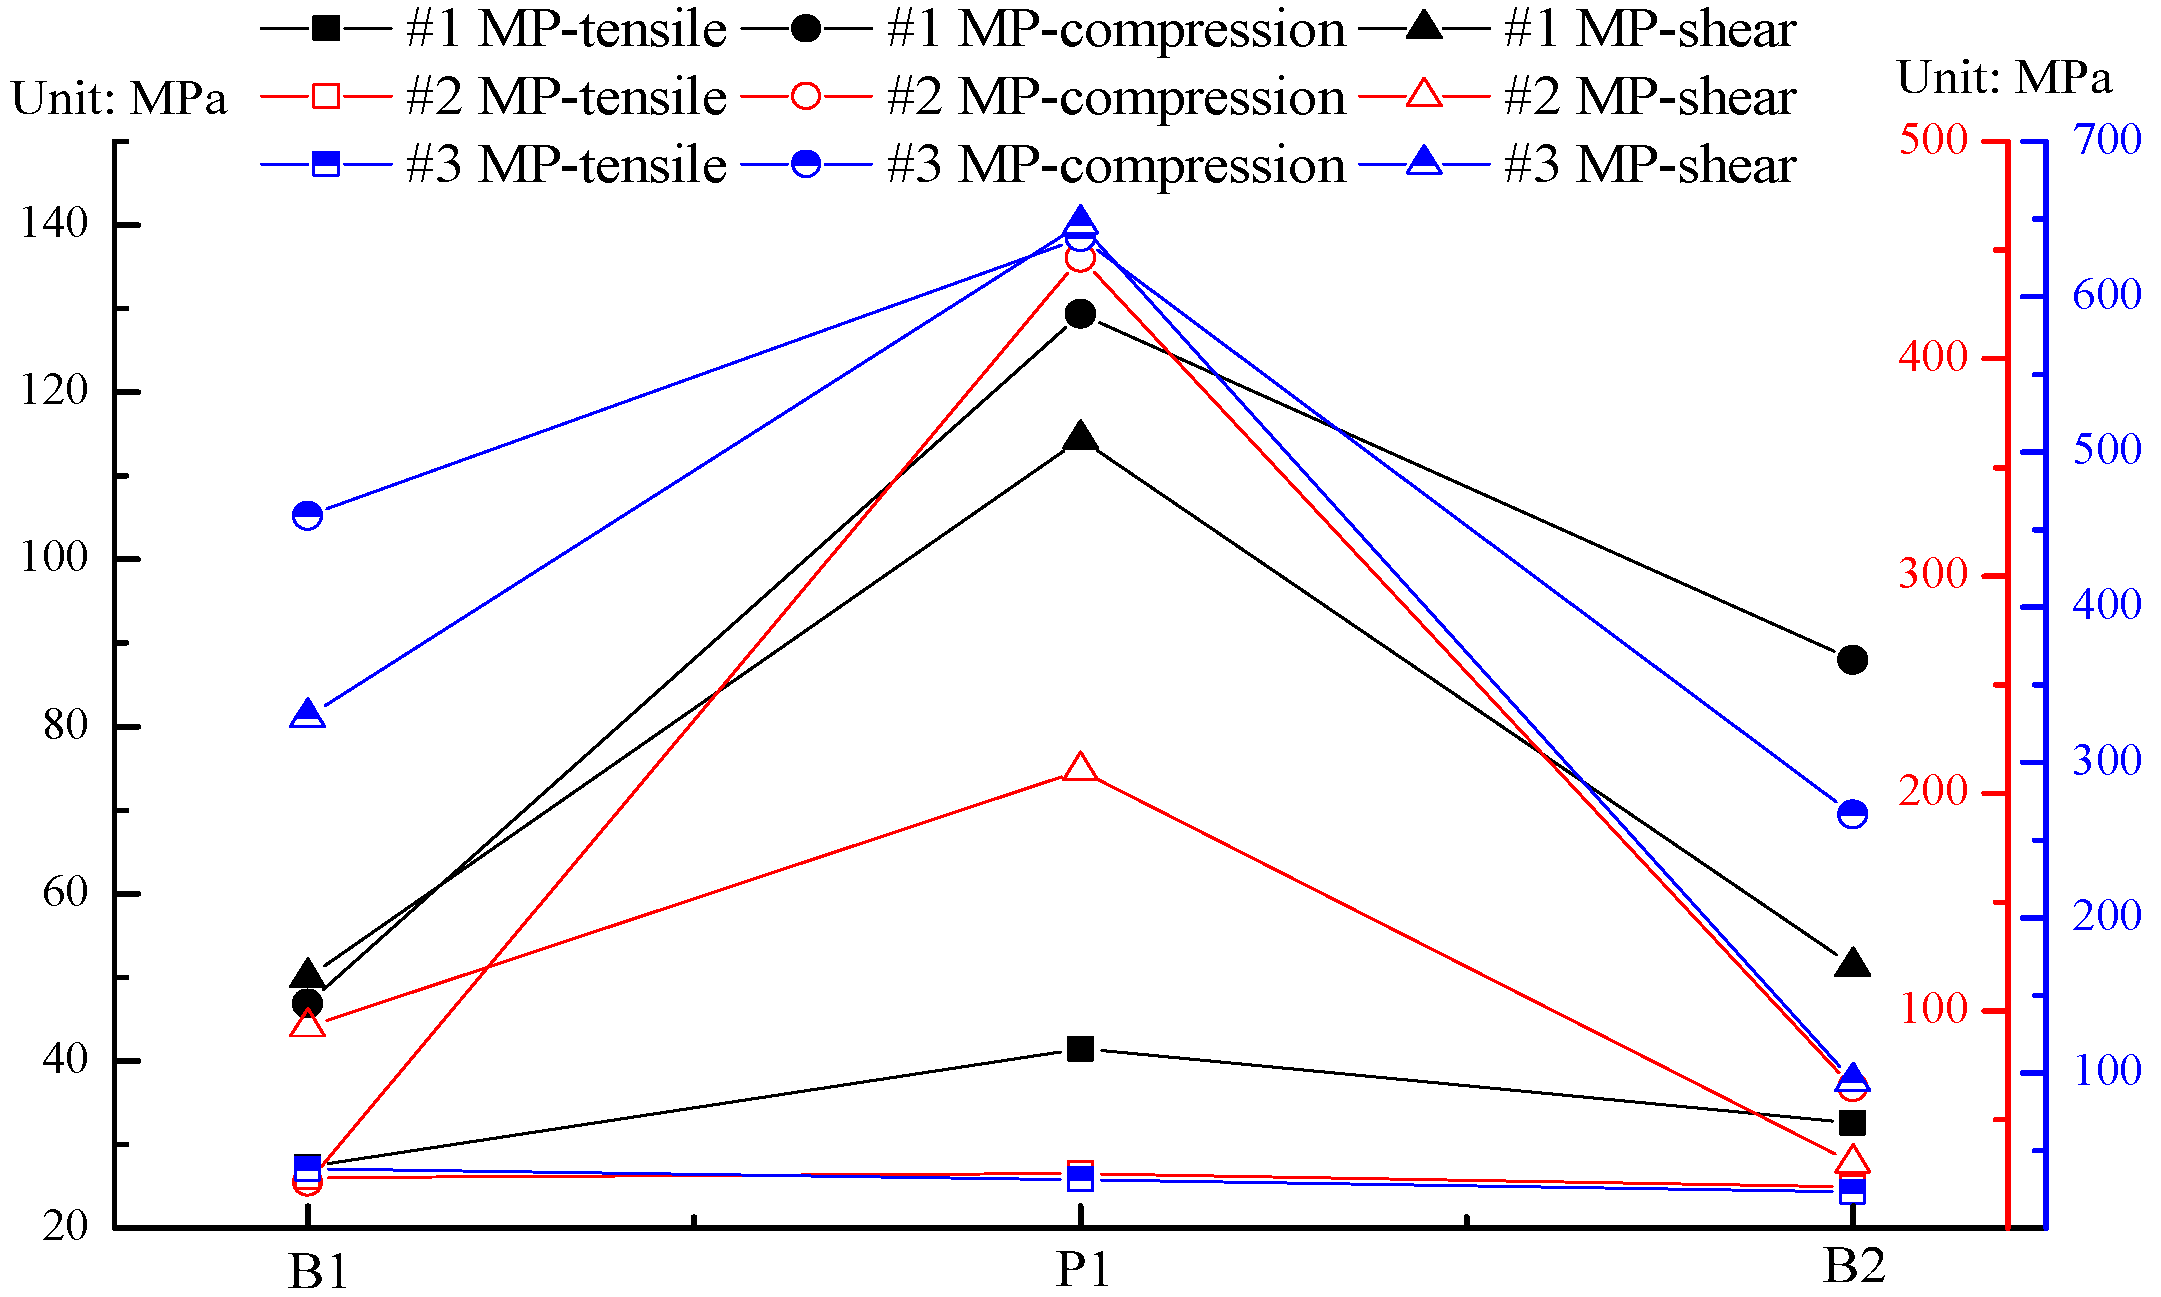
Concentrated stresses are responsible for fracture propagation [33]. To further investigate the relation between rolling force fluctuations and fracture propagation, the stress distributions on #1 MP, #2 MP and #3 MP (Figure 6a) at three points (B1, P1 and B2) are obtained (Figure 8a) when the penetration is 5.5 mm. At B1 point, Figure 9(a1) shows that a triangle-shaped plastic zone, reported in previous studies [27,28], forms after the first cut on #1 MP. Figure 9(a2) shows that tensile stress (σt) instead of compressive stress (σc) concentrates ahead of the cutter on the trajectory of the second cut. Simultaneously, shear stress (τ) slightly concentrates on #1 MP (Figure 9(a3)). On #2 MP, Figure 9(b1) indicates that a surface crack connects the adjacent cuts. Compressive (σc) and shear (τ) stresses concentrate near the contact point between the cutter and the rock (Figure 9(b2,b3)). On #3 MP, Figure 9(c1) shows that a plastic zone containing a fan-shaped front edge forms after the second cut. On the rim of this plastic zone, tensile stress (σt) concentrates (Figure 9(c2)). Compressive (σc) and shear stress (τ) also concentrates near the front contact point between the cutter and the rock (Figure 9(c2,c3)). Interestingly, the concentrated compressive (σc) and shear (τ) stresses on #3 MP are higher than those on #1 MP and #2 MP (Figure 10).
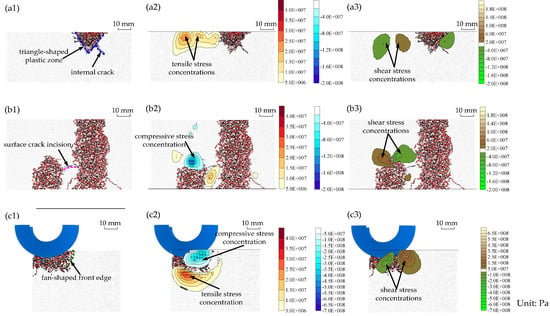
Figure 9.
Stress evolution for the penetration of 5.5 mm at B1: (a1–a3) are the fractures and stresses on the #1 MP; (b1–b3) are the fractures and stresses on the #2 MP; (c1–c3) are the fractures and stresses on the #3 MP.
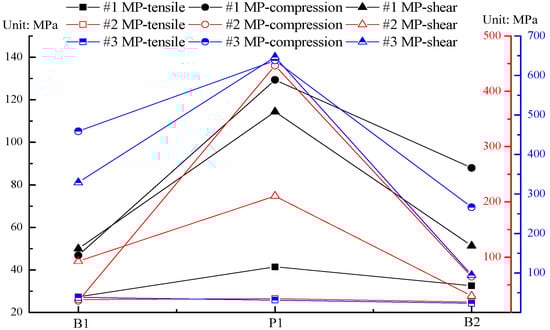
Figure 10.
The maximum stresses at B1, P1 and B2.
When the cutting distance of the second cut increases to 27.35 mm, a peak rolling force (P1) appears. On #1 MP, a nearly triangle-shape plastic zone forms on the trajectory of the second cut (Figure 11(a1)). Simultaneously, several internal cracks generate. Within this plastic zone, compressive stress (σc) concentrates. More importantly, tensile stress (σt) significantly concentrates at the tips of the internal cracks (Figure 11(a2)). In addition, shear stress (τ) concentration is significantly promoted on #1 MP (Figure 10 and Figure 11(a3)). Figure 11(b1) shows that the fractured area on #2 MP slightly expands. However, the compressive (σc) and shear (τ) stress concentrations are highly promoted (Figure 10 and Figure 11(b2,b3)). On the #3 MP, similar slightly expanded fracture area and significantly promoted stress concentrations are also observed (Figure 10 and Figure 11(c1–c3)).
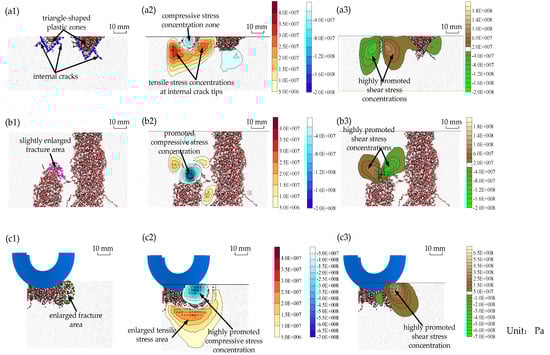
Figure 11.
Stress evolution for the penetration of 5.5 mm at P1: (a1–a3) are the fractures and stresses on the #1 MP; (b1–b3) are the fractures and stresses on the #2 MP; (c1–c3) are the fractures and stresses on the #3 MP.
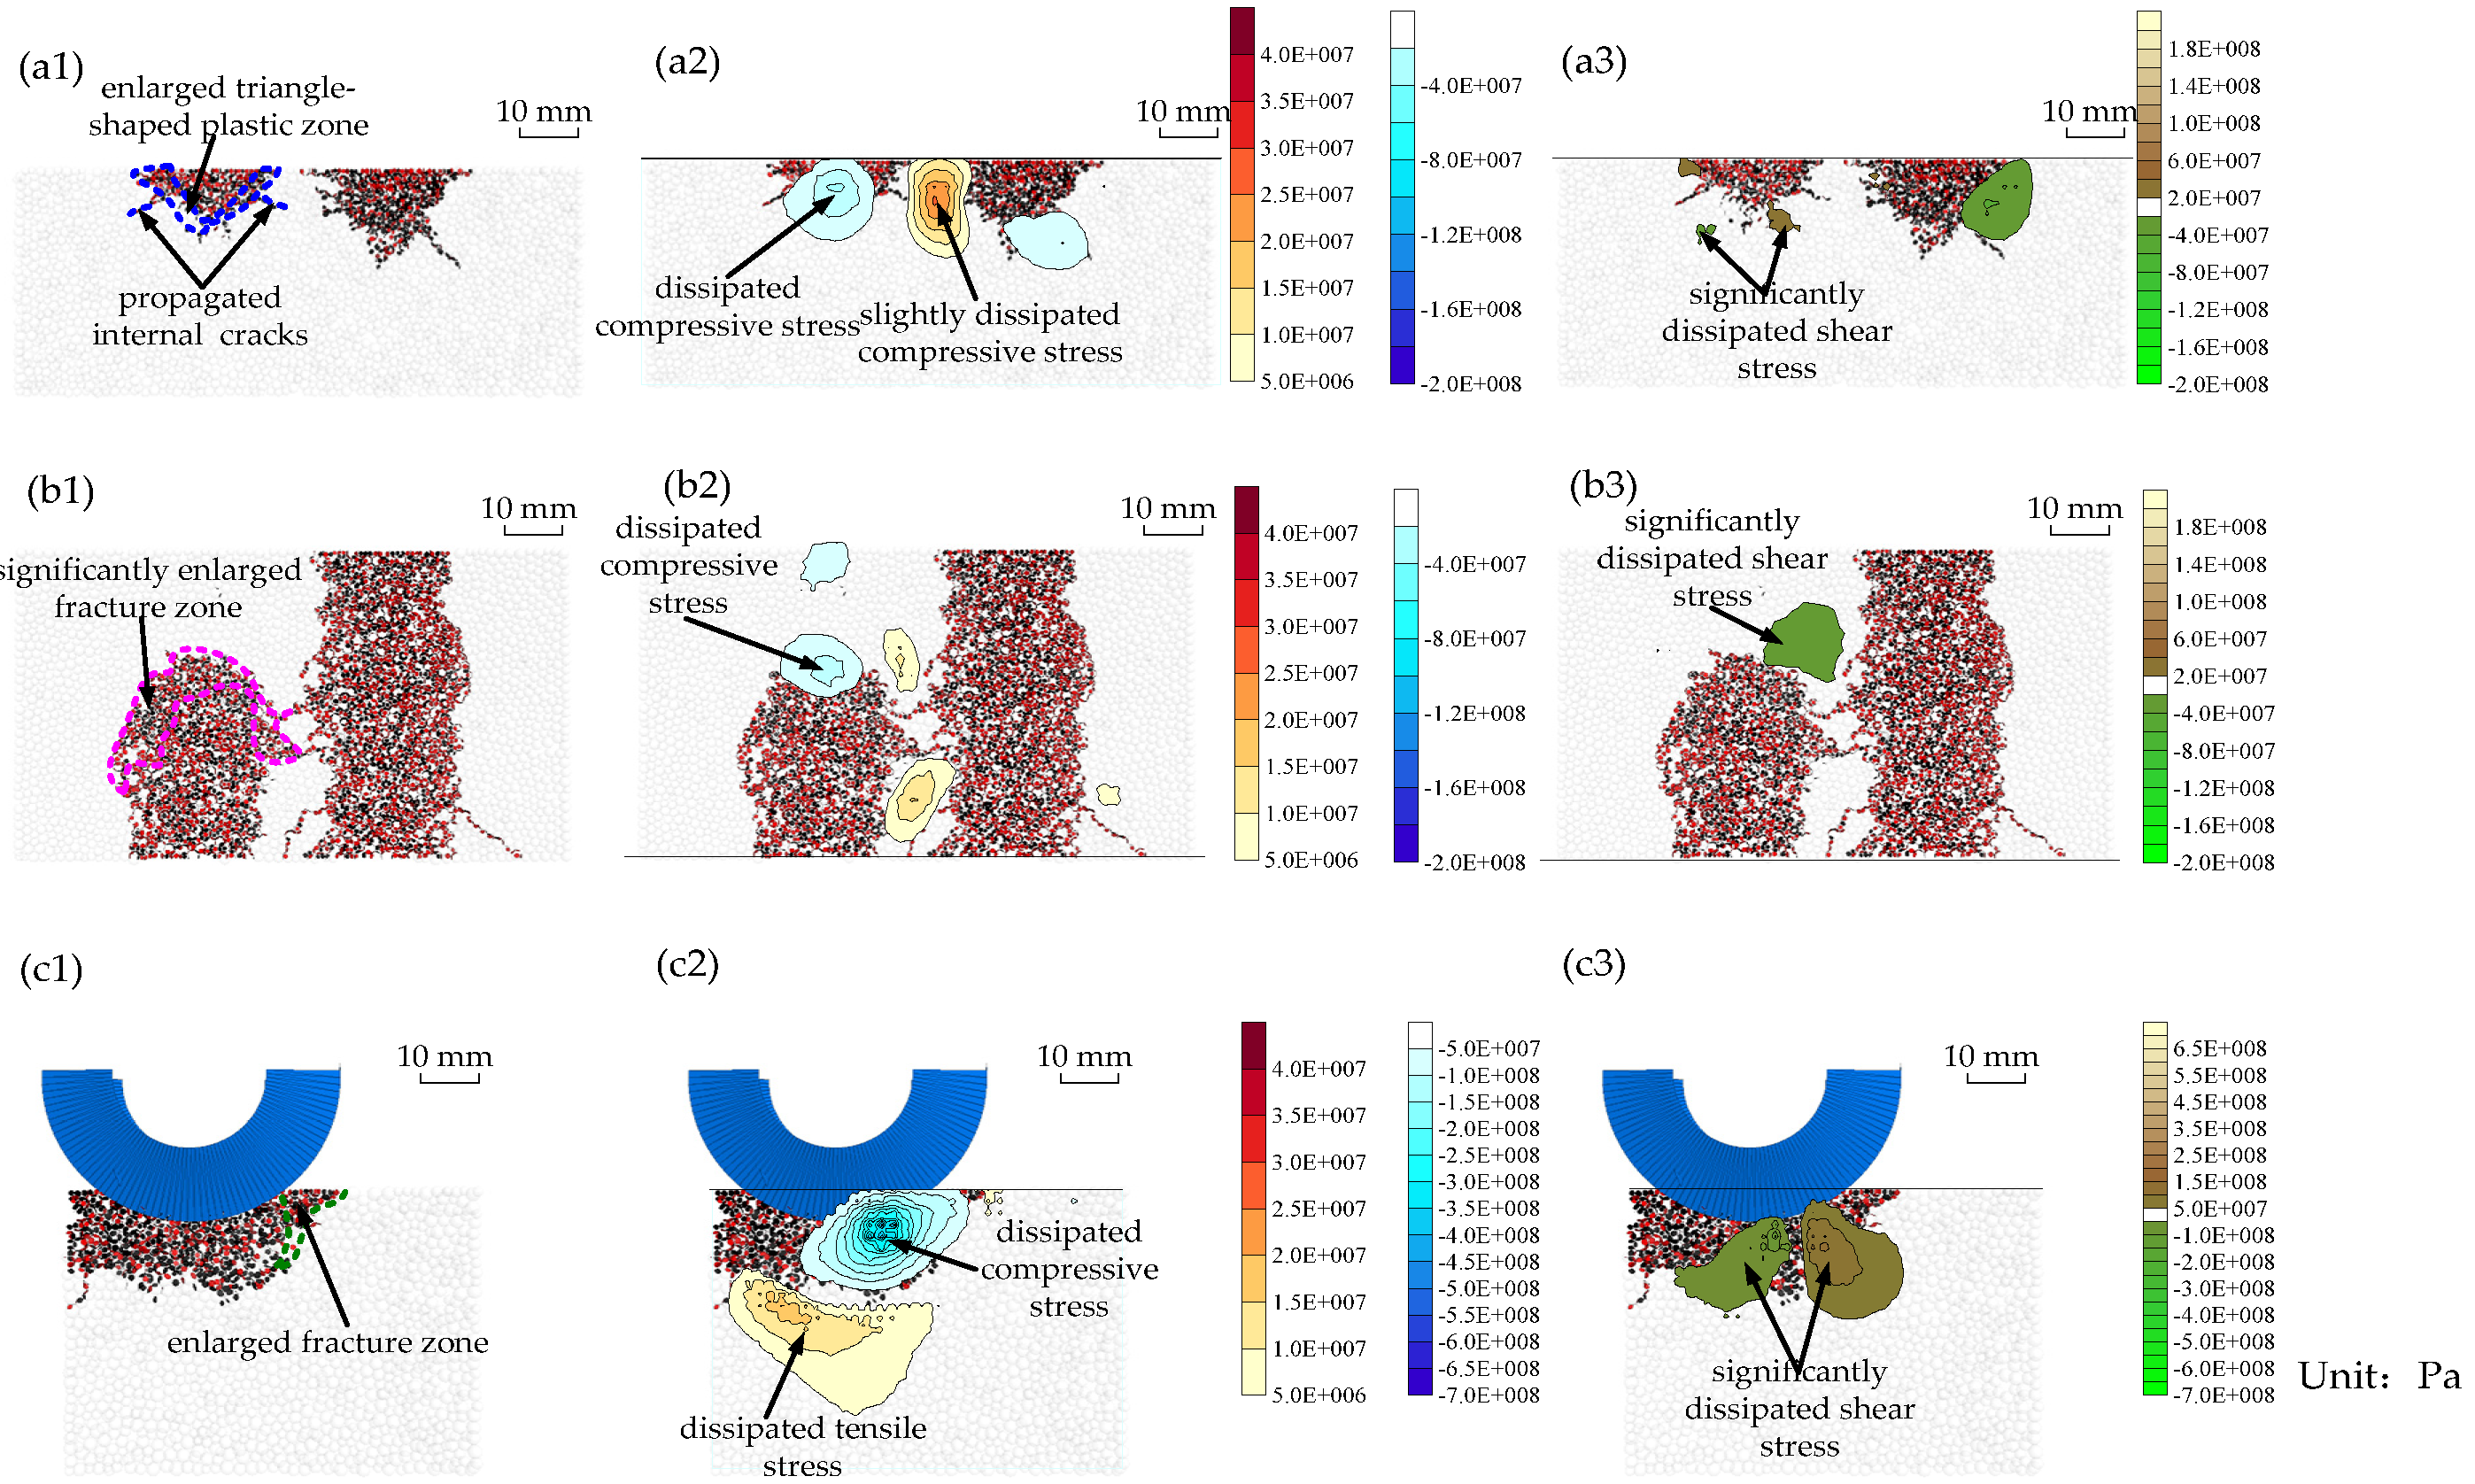
When the cutting distance further increases by 6.5 mm, the plastic zone caused by the second cut greatly enlarges (Figure 12(a1)). Simultaneously, internal cracks, accompanying significant tensile stress (σt) dissipations, obviously propagate (Figure 10 and Figure 12(a1,a2)). Simultaneously, compressive (σc) and shear (τ) stresses sharply drop (Figure 10 and Figure 12(a2,a3)). On #2 and #3 MP, similar greatly enlarged fracture areas and significant stress dissipations are observed (Figure 10 and Figure 12(b1–b3,c1–c3)).
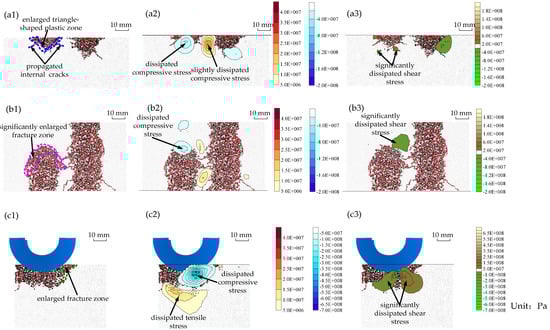
Figure 12.
Stress evolution for the penetration of 5.5 mm at B2: (a1–a3) are the fractures and stresses on the #1 MP; (b1–b3) are the fractures and stresses on the #2 MP; (c1–c3) are the fractures and stresses on the #3 MP.
The descriptions on fracture propagation and stress evolution clearly show that the increase in rolling force frequently results in stress concentrations in the rock. When the stresses reach critical values, the peak rolling force appears and the cracks in rock initiate. The crack propagation weakens the contact between cutter and rock and further decreases the rolling force. In the crack propagation process, stresses at crack tips dissipate. When the stresses dissipate to certain values, crack propagation ceases. The continuous cutting results in the increase in rolling force. Then, another fluctuation in rolling force accompanying crack propagation will appear. Thus, the stress evolution in the cutting process can properly reveal the relation between crack propagation and rolling force fluctuations.
The above descriptions clearly indicate that the concentrated stresses are responsible for rock fractures in linear cutting tests. Thus, the concentration degree of these stresses can be used to explain the influence of penetration on rock fractures. Figure 13 and Figure 14 show the stress concentrations at P2 and P3 points for the penetrations of 3.5 mm and 4.5 mm (Figure 8b,c), respectively. The cutting distances for P2 and P3 are slightly larger than that for the P1. Clearly, similar tensile (σt), compressive (σc) and shear (τ) stress concentrations are observed at these peak points. Nevertheless, Figure 15 clearly shows that the increase in penetration can effectively increase the stress concentration degree. In particular, the maximum tensile stress (σt), being responsible for the internal crack propagation between cuts, linearly increases with the increase in penetration on the #1 MP (Figure 15a). This phenomenon can explain why internal cracks fail to connect two cuts for the relatively low penetrations.
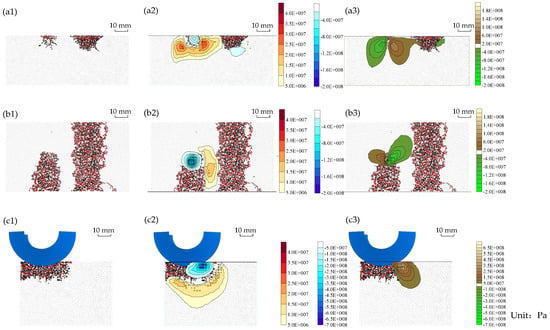
Figure 13.
Stress evolution for the penetration of 3.5 mm at P1: (a1–a3) are the fractures and stresses on the #1 MP; (b1–b3) are the fractures and stresses on the #2 MP; (c1–c3) are the fractures and stresses on the #3 MP.
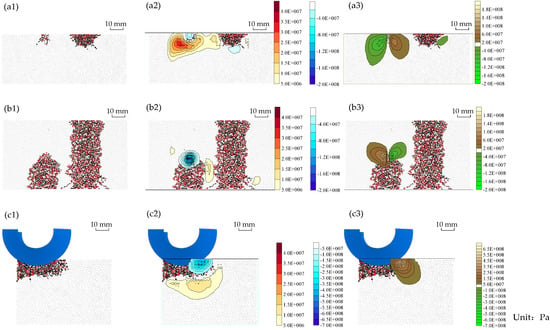
Figure 14.
Stress evolution for the penetration of 4.5 mm at P1: (a1–a3) are the fractures and stresses on the #1 MP; (b1–b3) are the fractures and stresses on the #2 MP; (c1–c3) are the fractures and stresses on the #3 MP.
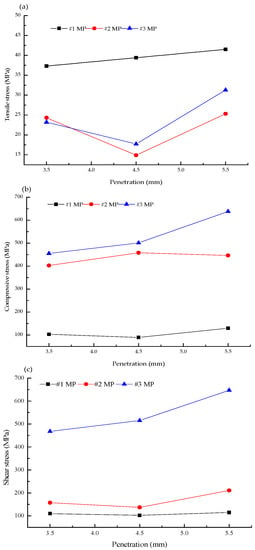
Figure 15.
The maximum stresses for various penetrations: (a–c) are maximum tensile, compressive and shear stresses, respectively.
5. Conclusions
To reveal the relation between rolling force fluctuations and rock fractures, small-scaled linear cutting tests on red and yellow sandstone specimens were first performed. The laboratory tests indicate that the increase in penetration (ranging from 2.5 mm to 5.5 mm) for the spacings of 30 mm and 40 mm can effectively promote rock fractures between cuts. In addition, the rolling force, consisting of many fluctuations, increased with the promotion of penetration. The analysis of the collected chip mass and the consumed energy indicates that the increase in penetration (ranging from 2.5 mm to 5.5 mm) can promote cutting efficiency.
The numerical results agree well with the laboratory tests in rock fractures and rolling force characteristics. More importantly, the analysis of the dynamic stress evolution indicates that the increase in rolling force frequently results in stress concentrations. Then, rock fractures initiate when these concentrations are high enough. Subsequently, the fracture propagation can cause sharp drops in rolling force. Thus, the fluctuations can be linked to the rock fractures using the stress variations. In addition, the stress concentration degree positively relates to penetration. Consequently, larger penetrations frequently result in severer rock fractures.
Author Contributions
J.L. focused on writing and laboratory test design; Z.L. performed numerical simulation and validation; G.J. performed laboratory tests. All authors have read and agreed to the published version of the manuscript.
Funding
The authors would like to acknowledge the following financial supports: Projects (51804110, 52004327) supported by the National Natural Science Foundation of China, and Projects (2020JJ5101, 2019JJ40056, 2021JJ50104) supported by the Natural Science Foundation of Hunan Province and Scientific Research Foundation of Hunan Province Education Department (21A0456, 21A0453, 20B127).
Institutional Review Board Statement
Not applicable.
Informed Consent Statement
Not applicable.
Data Availability Statement
Not applicable.
Acknowledgments
Many thanks to all the contributions and support given by the authors in preparing the writing of this article.
Conflicts of Interest
The authors declare no conflict of interest.
References
- Zhang, X.; Lin, L.; Xia, Y.; Tan, Q.; Zhu, Z.; Mao, Q.; Zhou, M. Experimental study on wear of TBM disc cutter rings with different kinds of hardness. Tunn. Undergr. Space Technol. 2018, 82, 346–357. [Google Scholar] [CrossRef]
- Xia, Y.M.; Guo, B.; Cong, G.Q.; Zhang, X.H.; Zeng, G.Y. Numerical simulation of rock fragmentation induced by a single TBM disc cutter close to a side free surface. Int. J. Rock Mech. Min. Sci. 2017, 91, 40–48. [Google Scholar] [CrossRef]
- Zhang, X.; Xia, Y.; Tan, Q.; Wu, D. Comparison Study on the Rock Cutting Characteristics of Disc Cutter under Free-face-assisted and Conventional Cutting Methods. KSCE J. Civ. Eng. 2018, 22, 4155–4162. [Google Scholar] [CrossRef]
- Haeri, H.; Marji, M.F. Simulating the crack propagation and cracks coalescence underneath TBM disc cutters. Arab. J. Geosci. 2016, 9, 124. [Google Scholar] [CrossRef]
- Qi, G.; Zhengying, W.; Hao, M. An experimental research on the rock cutting process of the gage cutters for rock tunnel boring machine (TBM). Tunn. Undergr. Space Technol. 2016, 52, 182–191. [Google Scholar] [CrossRef]
- Yang, H.; Wang, H.; Zhou, X. Analysis on the damage behavior of mixed ground during TBM cutting process. Tunn. Undergr. Space Technol. 2016, 57, 55–65. [Google Scholar] [CrossRef]
- Labra, C.; Rojek, J.; Oñate, E. Discrete/Finite Element Modelling of Rock Cutting with a TBM Disc Cutter. Rock Mech. Rock Eng. 2016, 50, 621–638. [Google Scholar] [CrossRef]
- Cho, J.-W.; Jeon, S.; Jeong, H.-Y.; Chang, S.-H. Evaluation of cutting efficiency during TBM disc cutter excavation within a Korean granitic rock using linear-cutting-machine testing and photogrammetric measurement. Tunn. Undergr. Space Technol. 2013, 35, 37–54. [Google Scholar] [CrossRef]
- Xiao, N.; Zhou, X.-P.; Gong, Q.-M. The modelling of rock breakage process by TBM rolling cutters using 3D FEM-SPH coupled method. Tunn. Undergr. Space Technol. 2017, 61, 90–103. [Google Scholar] [CrossRef]
- Liu, Q.; Pan, Y.; Liu, J.; Kong, X.; Shi, K. Comparison and discussion on fragmentation behavior of soft rock in multi-indentation tests by a single TBM disc cutter. Tunn. Undergr. Space Technol. 2016, 57, 151–161. [Google Scholar] [CrossRef]
- Innaurato, N.; Oreste, P. Theoretical Study on the TBM Tool-Rock Interaction. Geotech. Geol. Eng. 2010, 29, 297–305. [Google Scholar] [CrossRef]
- Li, X.F.; Li, H.B.; Liu, Y.Q.; Zhou, Q.C.; Xia, X. Numerical simulation of rock fragmentation mechanisms subject to wedge penetration for TBMs. Tunn. Undergr. Space Technol. 2016, 53, 96–108. [Google Scholar] [CrossRef]
- Moon, T.; Oh, J. A Study of Optimal Rock-Cutting Conditions for Hard Rock TBM Using the Discrete Element Method. Rock Mech. Rock Eng. 2012, 45, 837–849. [Google Scholar] [CrossRef]
- Yang, H.; Liu, J.; Liu, B. Investigation on the Cracking Character of Jointed Rock Mass Beneath TBM Disc Cutter. Rock Mech. Rock Eng. 2018, 51, 1263–1277. [Google Scholar] [CrossRef]
- Yin, L.; Miao, C.; He, G.; Dai, F.; Gong, Q. Study on the influence of joint spacing on rock fragmentation under TBM cutter by linear cutting test. Tunn. Undergr. Space Technol. 2016, 57, 137–144. [Google Scholar] [CrossRef]
- Zhao, X.B.; Yao, X.H.; Gong, Q.M.; Ma, H.S.; Li, X.Z. Comparison study on rock crack pattern under a single normal and inclined disc cutter by linear cutting experiments. Tunn. Undergr. Space Technol. 2015, 50, 479–489. [Google Scholar] [CrossRef]
- Liu, J.; Cao, P.; Han, D.Y. The influence of confining stress on optimum spacing of TBM cutters for cutting granite. Int. J. Rock Mech. Min. Sci. 2016, 88, 165–174. [Google Scholar] [CrossRef]
- Geng, Q.; Wei, Z.; Ren, J. New rock material definition strategy for FEM simulation of the rock cutting process by TBM disc cutters. Tunn. Undergr. Space Technol. 2017, 65, 179–186. [Google Scholar] [CrossRef]
- Yang, C.; Hassani, F.; Zhou, K.; Zhang, Q.; Wang, F.; Gao, F.; Topa, A. Numerical investigation of TBM disc cutter cutting on microwave-treated basalt with an unrelieved model. Arch. Civ. Mech. Eng. 2022, 22, 147. [Google Scholar] [CrossRef]
- Zhang, K.; Liu, W.; Yao, X.; Peng, C.; Liu, J.; Zheng, X. Investigation on Two-Step Simulation Modeling Method for Rock Breaking by TBM Disc Cutters Assisted with Laser. KSCE J. Civ. Eng. 2022, 26, 2966–2978. [Google Scholar] [CrossRef]
- Zhang, X.; Hu, D.; Li, J.; Pan, J.; Xia, Y.; Tian, Y. Investigation of rock breaking mechanism with TBM hob under traditional and free-face condition. Eng. Fract. Mech. 2021, 242, 107432. [Google Scholar] [CrossRef]
- Cheng, J.-L.; Jiang, Z.-H.; Han, W.-F.; Li, M.-L.; Wang, Y.-X. Breakage mechanism of hard-rock penetration by TBM disc cutter after high pressure water jet precutting. Eng. Fract. Mech. 2020, 240, 107320. [Google Scholar] [CrossRef]
- Hu, M.; Zhang, B.; Li, B.; Liu, B.; Cao, W.; Xu, B. TBM-cutter rock-breaking effect and mechanism considering different cutting sequences. Bull. Eng. Geol. Environ. 2022, 81, 102. [Google Scholar] [CrossRef]
- Jiang, H.; Zhang, X.; Liu, S.; Cai, Z. Research on the mechanism and performance of free-surface rock breakage by a disc cutter. Eng. Fract. Mech. 2022, 264, 108336. [Google Scholar] [CrossRef]
- Li, T.; Zhang, Z.; Jia, C.; Liu, B.; Liu, Y.; Jiang, Y. Investigating the cutting force of disc cutter in multi-cutter rotary cutting of sandstone: Simulations and experiments. Int. J. Rock Mech. Min. Sci. 2022, 152, 105069. [Google Scholar] [CrossRef]
- Tang, M.; Huang, X.; Wang, S.; Zhai, Y.; Zhuang, Q.; Zhang, C. Study of the cutter-rock interaction mechanism during TBM tunnelling in mudstone: Insight from DEM simulations of rotatory cutting tests. Bull. Eng. Geol. Environ. 2022, 81, 298. [Google Scholar] [CrossRef]
- Entacher, M.; Schuller, E.; Galler, R. Rock Failure and Crack Propagation Beneath Disc Cutters. Rock Mech. Rock Eng. 2015, 48, 1559–1572. [Google Scholar] [CrossRef]
- Entacher, M.; Lorenz, S.; Galler, R. Tunnel boring machine performance prediction with scaled rock cutting tests. Int. J. Rock Mech. Min. Sci. 2014, 70, 450–459. [Google Scholar] [CrossRef]
- Cao, R.H.; Cao, P.; Fan, X.; Xiong, X.; Lin, H. An Experimental and Numerical Study on Mechanical Behavior of Ubiquitous-Joint Brittle Rock-Like Specimens Under Uniaxial Compression. Rock Mech. Rock Eng. 2016, 49, 4319–4338. [Google Scholar] [CrossRef]
- Cao, R.H.; Cao, P.; Lin, H.; Pu, C.-Z.; Ou, K. Mechanical Behavior of Brittle Rock-Like Specimens with Pre-existing Fissures Under Uniaxial Loading: Experimental Studies and Particle Mechanics Approach. Rock Mech. Rock Eng. 2015, 49, 763–783. [Google Scholar] [CrossRef]
- Liu, J.; Wang, J.; Wan, W. Numerical study of crack propagation in an indented rock specimen. Comput. Geotech. 2018, 96, 1–11. [Google Scholar] [CrossRef]
- Choi, S.O.; Lee, S.J. Three-dimensional numerical analysis of the rock-cutting behavior of a disc cutter using particle flow code. KSCE J. Civ. Eng. 2014, 19, 1129–1138. [Google Scholar] [CrossRef]
- Gao, Y.B.; Han, P.Z.; Wang, F.; Cao, J.; Zhang, S.Q. Study on the Characteristics of Water Jet Breaking Coal Rock in a Drilling Hole. Sustainability 2022, 14, 8258. [Google Scholar] [CrossRef]


Publisher’s Note: MDPI stays neutral with regard to jurisdictional claims in published maps and institutional affiliations. |
© 2022 by the authors. Licensee MDPI, Basel, Switzerland. This article is an open access article distributed under the terms and conditions of the Creative Commons Attribution (CC BY) license (https://creativecommons.org/licenses/by/4.0/).