
Experimental Study on Stiffness Degradation of Organic Matter-Disseminated Sand under Cyclic Loading

1
School of Civil Engineering and Architecture, Hainan University, Haikou 570228, China
2
School of Civil Engineering, Tianjin University, Tianjin 300072, China
3
School of Civil Engineering, Harbin Institute of Technology, Harbin 150006, China
4
Hainan Investigation Institute of Hydrogeology and Engineering Geology, Haikou 570206, China
*
Authors to whom correspondence should be addressed.
Sustainability 2022, 14(18), 11793; https://doi.org/10.3390/su141811793
Submission received: 25 June 2022
/
Revised: 13 September 2022
/
Accepted: 16 September 2022
/
Published: 19 September 2022
(This article belongs to the Special Issue Marine Geotechnical Engineering and Marine Civil Engineering Construction)
Abstract
:Degradation of stiffness will occur in sand under cyclic loading. Organic matter-disseminated sand (OMDS) is a special sand in the northeast and western coastal region of Hainan Island. Through the stress-controlled dynamic triaxial test, the natural moisture content, vibration amplitude and consolidation ratio of OMDS under three types of cyclic loads (sine wave, triangular wave and rectangular wave) were studied. The results showed that the soil stiffness decreases with the increase in vibration times. The increase in natural moisture content and vibration amplitude, and the reduction in the consolidation ratio accelerate the softening of soil stiffness. Furthermore, based on the test results, an empirical formula was derived to reflect the rule of soil stiffness softening.
1. Introduction
With the construction of the Hainan free trade port, many structures are to be built in coastal areas. Organic matter-disseminated sand (OMDS) is a special sand in the northeast and western coastal region of Hainan Island, shown in Figure 1a. Figure 1b shows the scanning electron microscope photos of OMDS. It can be seen that the surface of the OMDS particles are obviously smoother, and there are fewer pores in the surface, which indicates that the organic matter has been immersed in pores and adsorbed to the surface of the sand particles, forming a film that wraps around the sand particles. The influence of waves, traffic and earthquakes on OMDS’s foundation should be of concern in engineering. In a wide range of studies, traffic loads could be approximately equivalent to triangular waves and sine waves, and wave loads could be equivalent to rectangular waves [1]. With the increase in dynamic cyclic load amplitude, the dynamic strain, porosity and pore pressure of soil increase, the internal structure of soil is reshaped as well, which induces the stiffness degradation of soil [2,3,4]. Under the cyclic load, the cumulative deformation of soil varies with vibration cycles [5,6], and due to the nonlinearity of soil, the stiffness acts in a complicated manner [7,8].
The characteristics of the long-term deformation and stiffness softening of soil under cyclic loading has been researched extensively by various countries’ scholars. Monismith et al. [9] proposed an exponential model for the relationship between the plastic strain of soft clay and vibration cycles. Introducing dynamic stress and static strength, Li and Selig [10,11] revised the Monismith function model and established a new function model. Idriss et al. [12] analyzed the relationship between the degradation index and vibration cycles, and established a functional relationship to describe the quantitative attenuation rule of soil cyclic stiffness. Yao et al. [13] modified the Idriss formula and redefined the softening index to describe the stiffness degradation of soft clay. Chai et al. [14] and Parr et al. [15] studied the dynamic characteristics of clay through dynamic triaxial tests, and obtained the double logarithmic relationship between dynamic strain and vibration cycles. Huurman [16] suggested that the stiffness degradation of sand was related to the cyclic stress ratio and vibration cycles. Yasuhara et al. [17] proposed a modified model function describing the relationship of the degradation index and vibration cycles based on the dynamic triaxial test of soil under cyclic loading. Tan et al. [18] analyzed the results of the cyclic triaxial test and cyclic simple shear test of cohesive soil with different plasticity indexes. Wang et al. [19] established a functional relationship between the degradation index and vibration cycles, and obtained the fracture toughness ratio of clay through the function. Huang et al. [20] introduced the dynamic deviatoric stress parameter into a functional model describing the relationship of the degradation index and vibration cycles. Cao et al. [21] established a stiffness degradation function for marine soft soil, and the relationship of the degradation index and vibration cycles was obtained by the function. Hong et al. [22] carried out a series of stress-path triaxial tests, with local strain measurements, to achieve path-dependent stiffness degradation curves of medium-dense Toyoura sand. Iraji et al. [23] modified the nonlinear Pastor–Zienkiewicz–Chan constitutive model to simulate the stiffness degradation of dense sands at dynamic loading. Mei et al. [24] analyzed the development laws between the axial permanent strain of coarse-grained soil and vibration cycles. Liu et al. [25] found that the softening index was exponentially related to cumulative pore pressure and cumulative strain.
In summary, it can be seen that the stiffness softening of clay, silt and sand under cyclic loading has been studied, while the dynamic properties of sand with organic matter are different from those of general sand. There are few reports on its stiffness degradation. In this study, the degradation laws of skeleton curves on OMDS samples were studied under three cyclic loadings with various natural moisture contents, consolidation ratios, confining pressures and vibration amplitudes.
2. Materials and Methods
2.1. Materials
The OMDS [26] was obtained from a site in Hainan Province, the upper layer soil to 1.2 m depth was cultivated soil, and the lower layer was OMDS, the sand used in this experimental study was extracted at depth ranging from 2 m to 5 m by thin-walled tube sampler. The coefficient of uniformity Cu was 2.07, the coefficient of curvature Cc was 1.25, the main physical parameters and particle grading curves are shown in Table 1 and Figure 2, respectively.
2.2. Sample Preparation
The OMDS samples were first air-dried and then passed through a sieve with opening size of 5 mm. Fully mixed with water and placed for 24 h, the sieved soil was cast into cylindrical molds which had 39.1 mm diameter and 80 mm height, as shown in Figure 3. First, the pumping saturation method was used for saturation, and then the back-pressure saturation was carried out by the dynamic triaxial instrument, until the sample saturation reached 95%. Lastly, the fully saturated samples were consolidated under the condition of isotropic consolidation.
2.3. Scheme of Dynamic Triaxial Test
In this study, the dynamic responses of OMDS under multiple cyclic loading waves were studied, and the influence of vibration amplitude and vibration cycles was considered as well; therefore, DDS-70 dynamic triaxial test equipment shown in Figure 4 was adopted. The DDS-70 system can automatically generate sine waves, triangular waves and rectangular waves with various frequencies, the maximum frequency is 10 Hz. The confining pressure of the test was 100 kPa. Because the frequency had little influence on the sand sample [27], the test frequency was set 1.0, and the test process was undrained. The test scheme is shown in Table 2.
3. Results
3.1. Skeleton Curve
The skeleton curve demonstrates the relationship between the dynamic shear stress (τd) and the dynamic shear strain (γd) [28,29], which could be expressed in terms of the dynamic axial stress (σd) and the dynamic axial strain (εd), as shown in Equations (1) and (2) [30,31].
where τd is the dynamic shear stress; σd is the dynamic axial stress; γd is the dynamic shear strain; εd is the dynamic axial strain; and μ is the Poisson’s ratio. Since the lateral displacement of the samples were not measured in this study, it was not possible to experimentally determine the Poisson’s ratio value. Therefore, instead of using τd and γd, σd and εd were used to construct the skeleton curve.
Figure 5 shows the skeleton curves of ODMS samples with varying moisture contents and consolidation ratios, and under four confining pressure levels when the wave form was a sine wave. It can be seen that, with the increase in confining pressure, σd became larger at an identical εd. Moreover, a lower moisture content and larger consolidation ratio in general resulted in the increase in σd at an identical εd. The above variation law between dynamic stress and dynamic strain under various wave forms was basically the same.
3.2. Characteristics of Stiffness Degradation
Dynamic modulus is an important parameter of soil dynamic characteristics, which can reflect the stiffness characteristics under dynamic loads. Dynamic elastic modulus, Ed, is one dynamic modulus, which is defined as the ratio between σd and εd, plotted in Figure 6. It can be seen that, under conditions of the same moisture content and consolidation ratio, the various wave forms, Ed, became smaller at a given εd when the confining pressure was reducing.
The degradation index, δd, can be used to quantify the attenuation of cyclic stiffness [8]. In the stress-controlled dynamic triaxial test, the ratio of the dynamic elastic modulus in the Nth cycle and the first cycle (i.e., the ratio of EN:E1) is the degradation index δ.
where (εd)N and (εd)1 are the axial dynamic strain in the Nth and 1st cycle respectively, and σd is the dynamic axial stress.
3.2.1. Effects of Vibration Amplitude
Figure 7 shows the relationship of the degradation index and vibration cycles under various vibration amplitudes. It can be seen that the degradation index curve decreased sharply with the increase in vibration cycles under various cyclic loads, which indicates that the soil would be destroyed with fewer vibration cycles. Since the δd–N relationship is largely independent of the vibration amplitude, there was no critical stress for OMDS under cyclic loading, which was different from clay.
3.2.2. Effects of Natural Moisture Content
Figure 8 shows the relationship of the degradation index and vibration cycles under various natural moisture contents. As observed, with the increase in vibration cycles, the degradation index curve tended to decrease rapidly in a nonlinear form, the variation range was smaller when the natural moisture content was smaller and the degradation degree was not obvious; when the natural moisture content reached 24%, the degradation index was larger than the other groups. This was consistent with the results reported by Zhong et al. [32] and was attributed to the fact that with the increase in moisture content, the water film surrounding the sand particles became thick, and the spacing between the sand particles increased. As a result, the interaction between the sand particles became weaker, which made the sand particles prone to dislocation deformation and the stiffness of OMDS prone to delegation. Figure 8 also shows that the curvatures of the degradation curves of various natural moisture contents were larger than those of vibration amplitude; the variation in natural moisture content had much influence on the degradation index.
3.2.3. Effects of Consolidation Ratio
Figure 9 shows the relationship of the degradation index and vibration cycles under various consolidation ratios. As observed, the degradation index curve decreased rapidly with the increase in vibration cycles. When the consolidation ratio kc = 2.0, the variation rate of the degradation index curve was smaller than the other groups, which indicates that the pores’ volume of soil decreased after consolidation, and the pores’ water pressure also decreased in order to prevent the soil from instability or failure under vibration load. This was consistent with the results reported by Huang et al. [33] and was attributed to the fact that the larger the consolidation ratio, the greater the axial consolidation pressure, the higher the compaction degree of OMDS sample, the stronger the ability to resist elastic deformation, and the slower the stiffness degradation of OMDS. Figure 9 also shows that the curvature of the degradation index curve with different consolidation ratios was larger than that with different natural moisture contents, which shows a greater influence of the consolidation ratio on the degradation index.
3.2.4. Effects of Wave Form
Figure 10 shows the relationship of the degradation index and vibration cycles under various wave forms. As observed, the degradation index curves of OMDS showed nonlinear variation with the increase in vibration cycles under three kinds of wave loads. Under the same vibration cycles, the attenuation degree caused by the rectangular wave load was significantly greater than that by the sine wave and triangle wave. It was found that the soil was prone to degrade under the load of the rectangular wave. This was consistent with the results reported by Cao et al. [21] and was attributed to the fact that the work of the rectangular wave was much greater than that of the sine wave and triangle wave under the same vibration frequency, and the energy dissipation of soil was much greater as well.
4. Degradation Model for OMDS
Based on the analysis of the test results and previous research, the functional relationship between the degradation index and vibration cycles of OMDS was established and is shown as
where m and n are test parameters, obtained by regression analysis; N and δd are the vibration cycles and degradation index, respectively.
In this paper, Equation (4) was used to calculate the relationship between the degradation index and vibration cycles of OMDS under various influence factors, and the results were compared with those of dynamic triaxial test (see Figure 11).
The fitting results show that the application of Equation (4) can effectively simulate the softening curves of OMDS under cyclic loads with various amounts of moisture and wave forms such as the sine wave, triangular wave and rectangular wave, which can meet the needs of engineering construction (Table 3).
5. Discussion
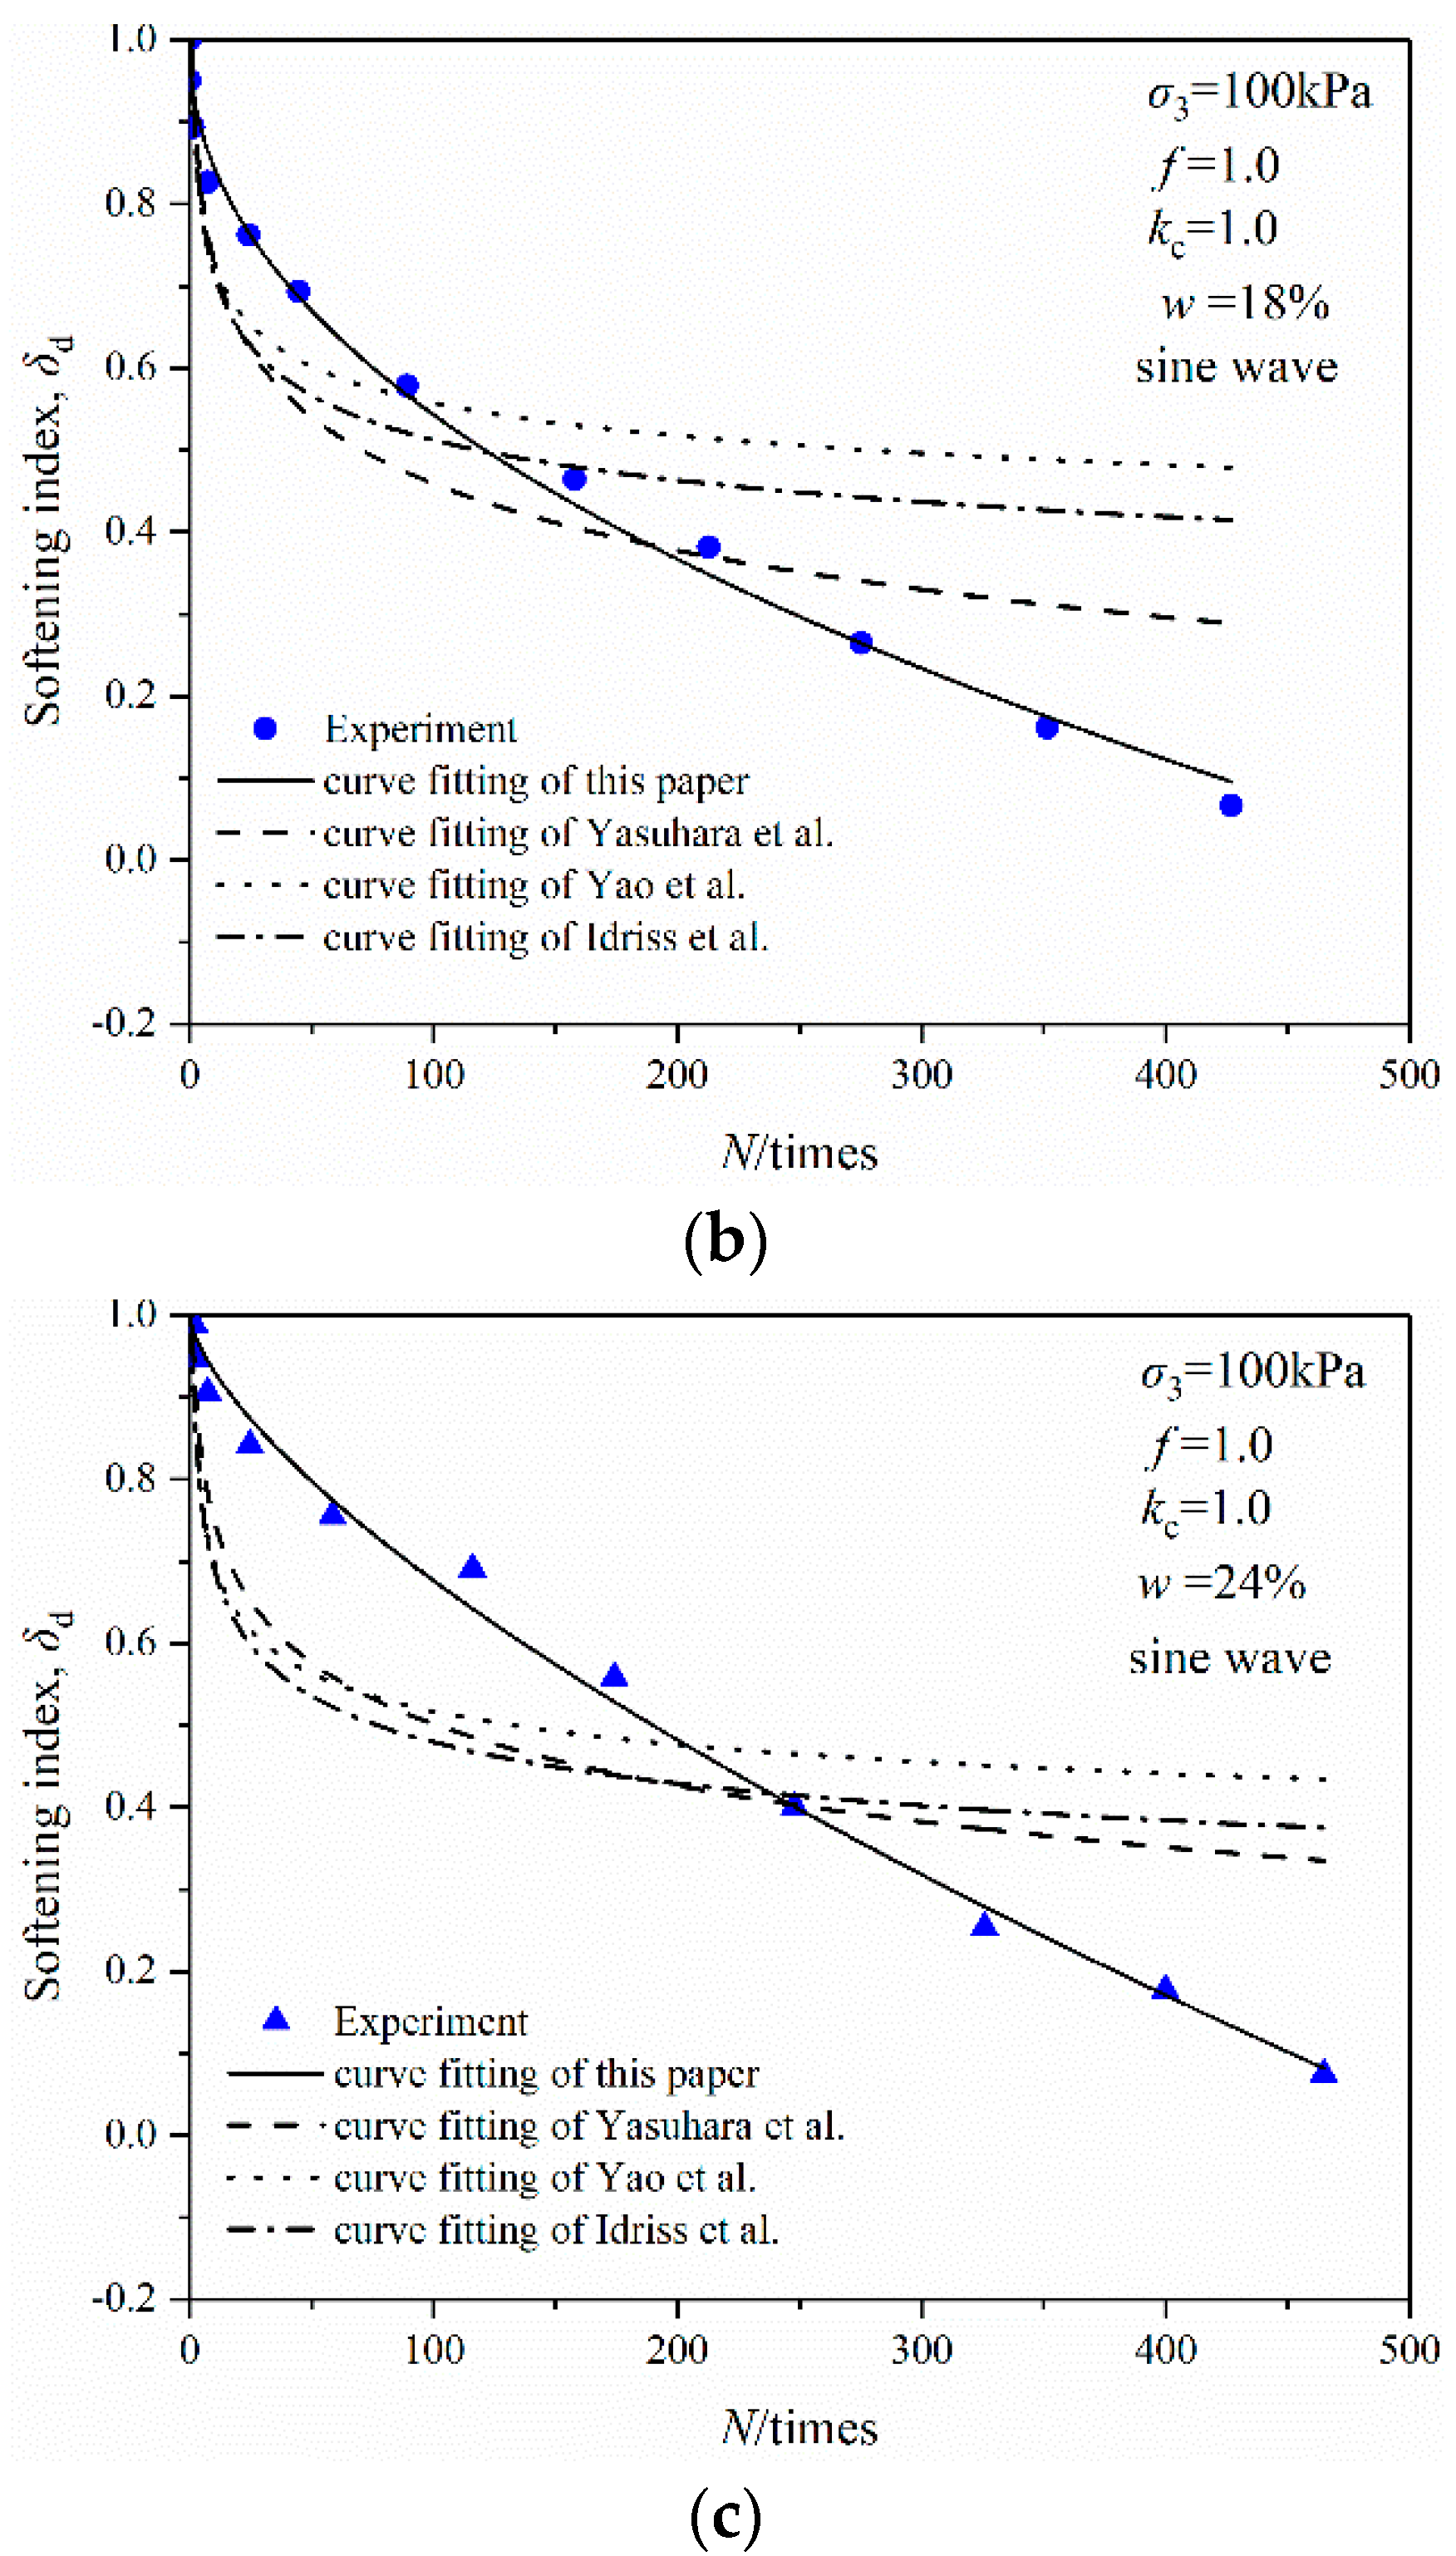
Table 4 compares the degradation models constructed by several researchers, which were adopted to fit the degradation curve of OMDS with various moisture contents under sine wave cyclic loading, as shown in Figure 12 and Table 5.
It can be seen that the stiffness degrades obviously in the initial stage of cyclic loading, and the performances of all four models are consistent. However, the stiffness degradation index of OMDS still decreases faster with the increase in vibration cycles. Then the degradation model of this paper can better represent this feature of OMDS under cyclic loading. The other three models show that the degradation index tends to stabilize as the vibration cycles increases, which is more suitable for the stiffness degradation characteristic of clay under cyclic loading.
6. Conclusions
The dynamic triaxial test of OMDS under different loads, consolidation ratios, natural moisture contents and wave forms was studied and analyzed, and the conclusions could be drawn as follows:
(1) Under cyclic loading, the soil stiffness decreases with the increase in vibration cycles. The increase in natural moisture content and vibration amplitude, and the reduction in the consolidation ratio accelerates the degradation of soil stiffness. The reason is that a higher moisture content results in the reduction in the interaction force between sand particles so that sand particles are prone to dislocation deformation; a lower consolidation ratio results in the decrease in sand compactness so that the ability to resist elastic deformation becomes weaker.
(2) The degradation index of stiffness decreases rapidly with the increase in vibration cycles, which indicates that the soil can be destroyed with fewer vibration cycles. The degradation index curves of the four load amplitudes are close to each other, which indicates that there is not a critical stress, which is different from cohesive soil. The variation amplitude of the degradation index curve is smaller when the moisture content is lower. The curvature of the degradation index curve with the same consolidation ratio is larger than that with different moisture contents. Among the different wave forms, the rectangular wave has the most obvious effect on the degradation index of OMDS.
(3) A degradation model for OMDS was established. Based on this model, the degradation index under various natural moisture contents and wave forms was fitted and analyzed. The degradation model of this paper can better represent the features of OMDS under cyclic loading.
Author Contributions
Conceptualization, J.D. and Y.Z.; methodology, J.D.; data curation, X.J., B.L. and L.J.; writing—original draft preparation, J.D.; writing—review and editing, J.D. and Y.Z.; funding acquisition, J.D. All authors have read and agreed to the published version of the manuscript.
Funding
This research was funded by the Hainan Province Science and Technology Special Fund, grant number ZDYF2022SHFZ277, the Hainan Provincial Natural Science Foundation of China, grant number 520RC548, the National Natural Science Foundation of China, grant number 52268056, the Hainan Natural Science Foundation, grant number 519QN333, and the Hainan Research Institute of Chinese Academy of Engineering Science and Technology Development Strategy, grant number 21-HN-ZD-02.
Institutional Review Board Statement
Not applicable.
Informed Consent Statement
Not applicable.
Data Availability Statement
Data available on request due to privacy restrictions.
Conflicts of Interest
The authors declare no conflict of interest.
References
- Du, J.; Liu, B.Y.; Wang, Z.C.; Zheng, G.; Zhou, H.Z. Dynamic Behavior of Cement-Stabilized Organic-Matter-Disseminated Sand under Cyclic Triaxial Condition. Soil Dyn. Earthq. Eng. 2021, 147, 106777. [Google Scholar] [CrossRef]
- Seed, H.B.; Chan, C.K. Clay strength under earthquake loading conditions. J. Jpn. Soc. Irrig. Drain. Rural Eng. 1966, 92, 53–78. [Google Scholar] [CrossRef]
- Wang, J.-Q.; Chang, Z.-C.; Xue, J.-F.; Lin, Z.-N.; Tang, Y. Experimental Investigation on the Behavior of Gravelly Sand Reinforced with Geogrid under Cyclic Loading. Appl. Sci. 2021, 11, 12152. [Google Scholar] [CrossRef]
- Lei, H.Y.; Li, B.; Lu, H.B.; Ren, Q. Dynamic Deformation Behavior and Cyclic Degradation of Ultrasoft Soil under Cyclic Loading. J. Mater. Civ. Eng. 2016, 28, 04016135. [Google Scholar] [CrossRef]
- Cai, Y.Q.; Wu, T.Y.; Guo, L.; Wang, J. Small Stiffness Degradation and Plastic Strain Accumulation of Clay under Cyclic Load with Principal Stress Rotation and Deviatoric Stress Variation. J. Geotech. Geoenviron. Eng. 2018, 144, 04018021. [Google Scholar] [CrossRef]
- He, S.-H.; Zhang, Q.-F.; Ding, Z.; Xia, T.-D.; Gan, X.-L. Experimental and Estimation Studies of Resilient Modulus of Marine Coral Sand under Cyclic Loading. J. Mar. Sci. Eng. 2020, 8, 287. [Google Scholar] [CrossRef]
- Atkinson, J.H. Non-linear soil stiffness in routine design. Geotechnique 2000, 50, 487–508. [Google Scholar] [CrossRef]
- Liang, F.; Zhang, Z.; Wang, C.; Gu, X.; Lin, Y.; Yang, W. Experimental Study on Stiffness Degradation and Liquefaction Characteristics of Marine Sand in the East Nan-Ao Area in Guangdong Province, China. J. Mar. Sci. Eng. 2021, 9, 638. [Google Scholar] [CrossRef]
- Monismith, C.L.; Ogawa, N.; Freeme, C.R. Permanent Deformation Characteristics of Sub-grade Soils due to Repeated Loading. Transp. Res. Rec. 1975, 537, 1–17. [Google Scholar]
- Li, D.; Selig, E.T. Cumulative Plastic Deformation for Fine-Grained Sub-grade Soils. J. Geotech. Geo-Environ. Eng. 1996, 122, 1006–1013. [Google Scholar] [CrossRef]
- Li, D.; Selig, E.T. Method for Railroad Track Foundation Design. II: Applications. J. Geotech. Geo-Environ. Eng. 1998, 124, 323–329. [Google Scholar] [CrossRef]
- Idriss, I.M.; Dobry, R.; Singh, R.M. Nonlinear behavior of soft clays during cyclic loading. J. Geotech. Eng. ASCE 1978, 104, 1427–1447. [Google Scholar] [CrossRef]
- Yao, M.; Nie, S. A model for calculating deformation of saturated soft clay. J. Hydraul. Eng. 1994, 7, 51–55. (In Chinese) [Google Scholar]
- Chai, J.C.; Miura, N. Traffic-load-induced permanent deformation of road on soft subsoil. J. Geotech. Geoenviron. Eng. 2002, 128, 907–916. [Google Scholar] [CrossRef]
- Parr, G.B. Some Aspects of the Behavior of London Clay under Repeated Loading; University of Nottingham: Nottingham, UK, 1972. [Google Scholar]
- Huurman, M. Development of traffic induced permanent strain in concrete block pavements. Heron 1996, 41, 29–52. [Google Scholar]
- Yasuhara, K.; Hyde, A.F.L.; Toyota, N.; Murakami, S. Cyclic stiffness of plastic silt with an initial drained shear stress. In Pre-failure Deformation of Geomaterials; Thomas Telford Ltd.: London, UK, 1998; pp. 373–382. [Google Scholar]
- Tan, K.; Vucetic, M. Behavior of medium and low plasticity clays under simple shear conditions. In Proceedings of the 4th International Conference on Soil Dynamics and Earthquake Engineering, Mexico City, Mexico, 23–26 October 1989; pp. 131–141. [Google Scholar]
- Wang, J.; Cai, Y.; Xu, C. Experimental study on degradation of stiffness of saturated soft clay under undrained cyclic loading. Rock Soil Mech. 2007, 28, 2138–2144. (In Chinese) [Google Scholar]
- Huang, M.; Li, S. Degradation of stiffness and strength of offshore saturated soft clay under long-term cyclic loading. Chin. J. Geotech. Eng. 2010, 32, 1491–1498. (In Chinese) [Google Scholar]
- Cao, Y.; Kong, L.; Yang, A. Waveform effect of cyclic loading of dynamic character and stiffness degradation characteristics of marine deposited natural soft clay. Chin. J. Geotech. Eng. 2013, 35, 583–589. (In Chinese) [Google Scholar]
- Iraji, A.; Farzaneh, O.; Hosseininia, E.S. A modification to dense sand dynamic simulation capability of Pastor-Zienkiewicz-Chan model. Acta Geotech. 2014, 9, 343–353. [Google Scholar] [CrossRef]
- Hong, Y.; Koo, C.H.; Zhou, C.; Ng, C.W.; Wang, L.Z. Small Strain Path-Dependent Stiffness of Toyoura Sand: Laboratory Measurement and Numerical Implementation. Int. J. Geomech. 2017, 17, 04016036. [Google Scholar] [CrossRef]
- Mei, H.H.; Leng, W.M.; Nie, R.S.; Li, Y.F. Study on dynamic behavior and permanent deformation characteristics of coarse-grained soil. J. Huazhong Univ. Sci. Technol. 2019, 47, 113–119. [Google Scholar]
- Liu, Y.; Zhu, S.Y.; Feng, Y.; Ma, S.K. Research on stiffness softening rules of saturated anisotropic consolidated silty soil under cyclic loading. Highway 2020, 4, 282–288. [Google Scholar]
- Du, J.; Zheng, G.; Liu, B.; Jiang, N.J.; Hu, J. Triaxial behavior of cement-stabilized organic matter–disseminated sand. Acta Geotech. 2021, 16, 211–220. [Google Scholar] [CrossRef]
- Zhang, R.; He, C.; Fei, W.; Gao, M. Effect of consolidation stress ratio on dynamic strength and dynamic pore water pressure of soil. Chin. J. Geotech. Eng. 2006, 28, 101–105. (In Chinese) [Google Scholar]
- Hardin, B.O.; Black, W.L. Closure to vibration modulus of normally consolidated clay: Design equations and curves. J. Soil Mech. Found. Div. ASCE 1969, 95, 1531–1537. [Google Scholar] [CrossRef]
- Wu, Q.; Lu, Q.; Guo, Q.; Zhao, K.; Chen, P.; Chen, G. Experimental Investigation on Small-Strain Stiffness of Marine Silty Sand. J. Mar. Sci. Eng. 2020, 8, 360. [Google Scholar] [CrossRef]
- Liu, J.K.; Cui, Y.H.; Liu, X.; Chang, D. Dynamic characteristics of warm frozen soil under direct shear test-comparison with dynamic triaxial test. Soil Dyn. Earthq. Eng. 2020, 133, 106114. [Google Scholar] [CrossRef]
- Wang, C.; Zhang, J. Experimental and Analytical Study on Residual Stiffness/Strength of CFRP Tendons under Cyclic Loading. Materials 2020, 13, 5653. [Google Scholar] [CrossRef] [PubMed]
- Zhong, H.; Sai, K.V. Normalizing Variation of Stiffness and Shear Strength of Compacted Fine-Grained Soils with Moisture Content. J. Geotech. Geoenviron. Eng. 2017, 143, 04017058. [Google Scholar]
- Huang, J.; Ding, Z.D.; Yuan, T.Y.; Dan, Z.; Li-min, P. Experimental study of dynamic deformation properties of peaty soil under cyclic loading. Rock Soil Mech. 2017, 38, 2551–2558. (In Chinese) [Google Scholar]
Figure 1.
OMDS photos: (a) on-site photo; (b) SEM photo.

Figure 2.
Grading curve of OMDS.
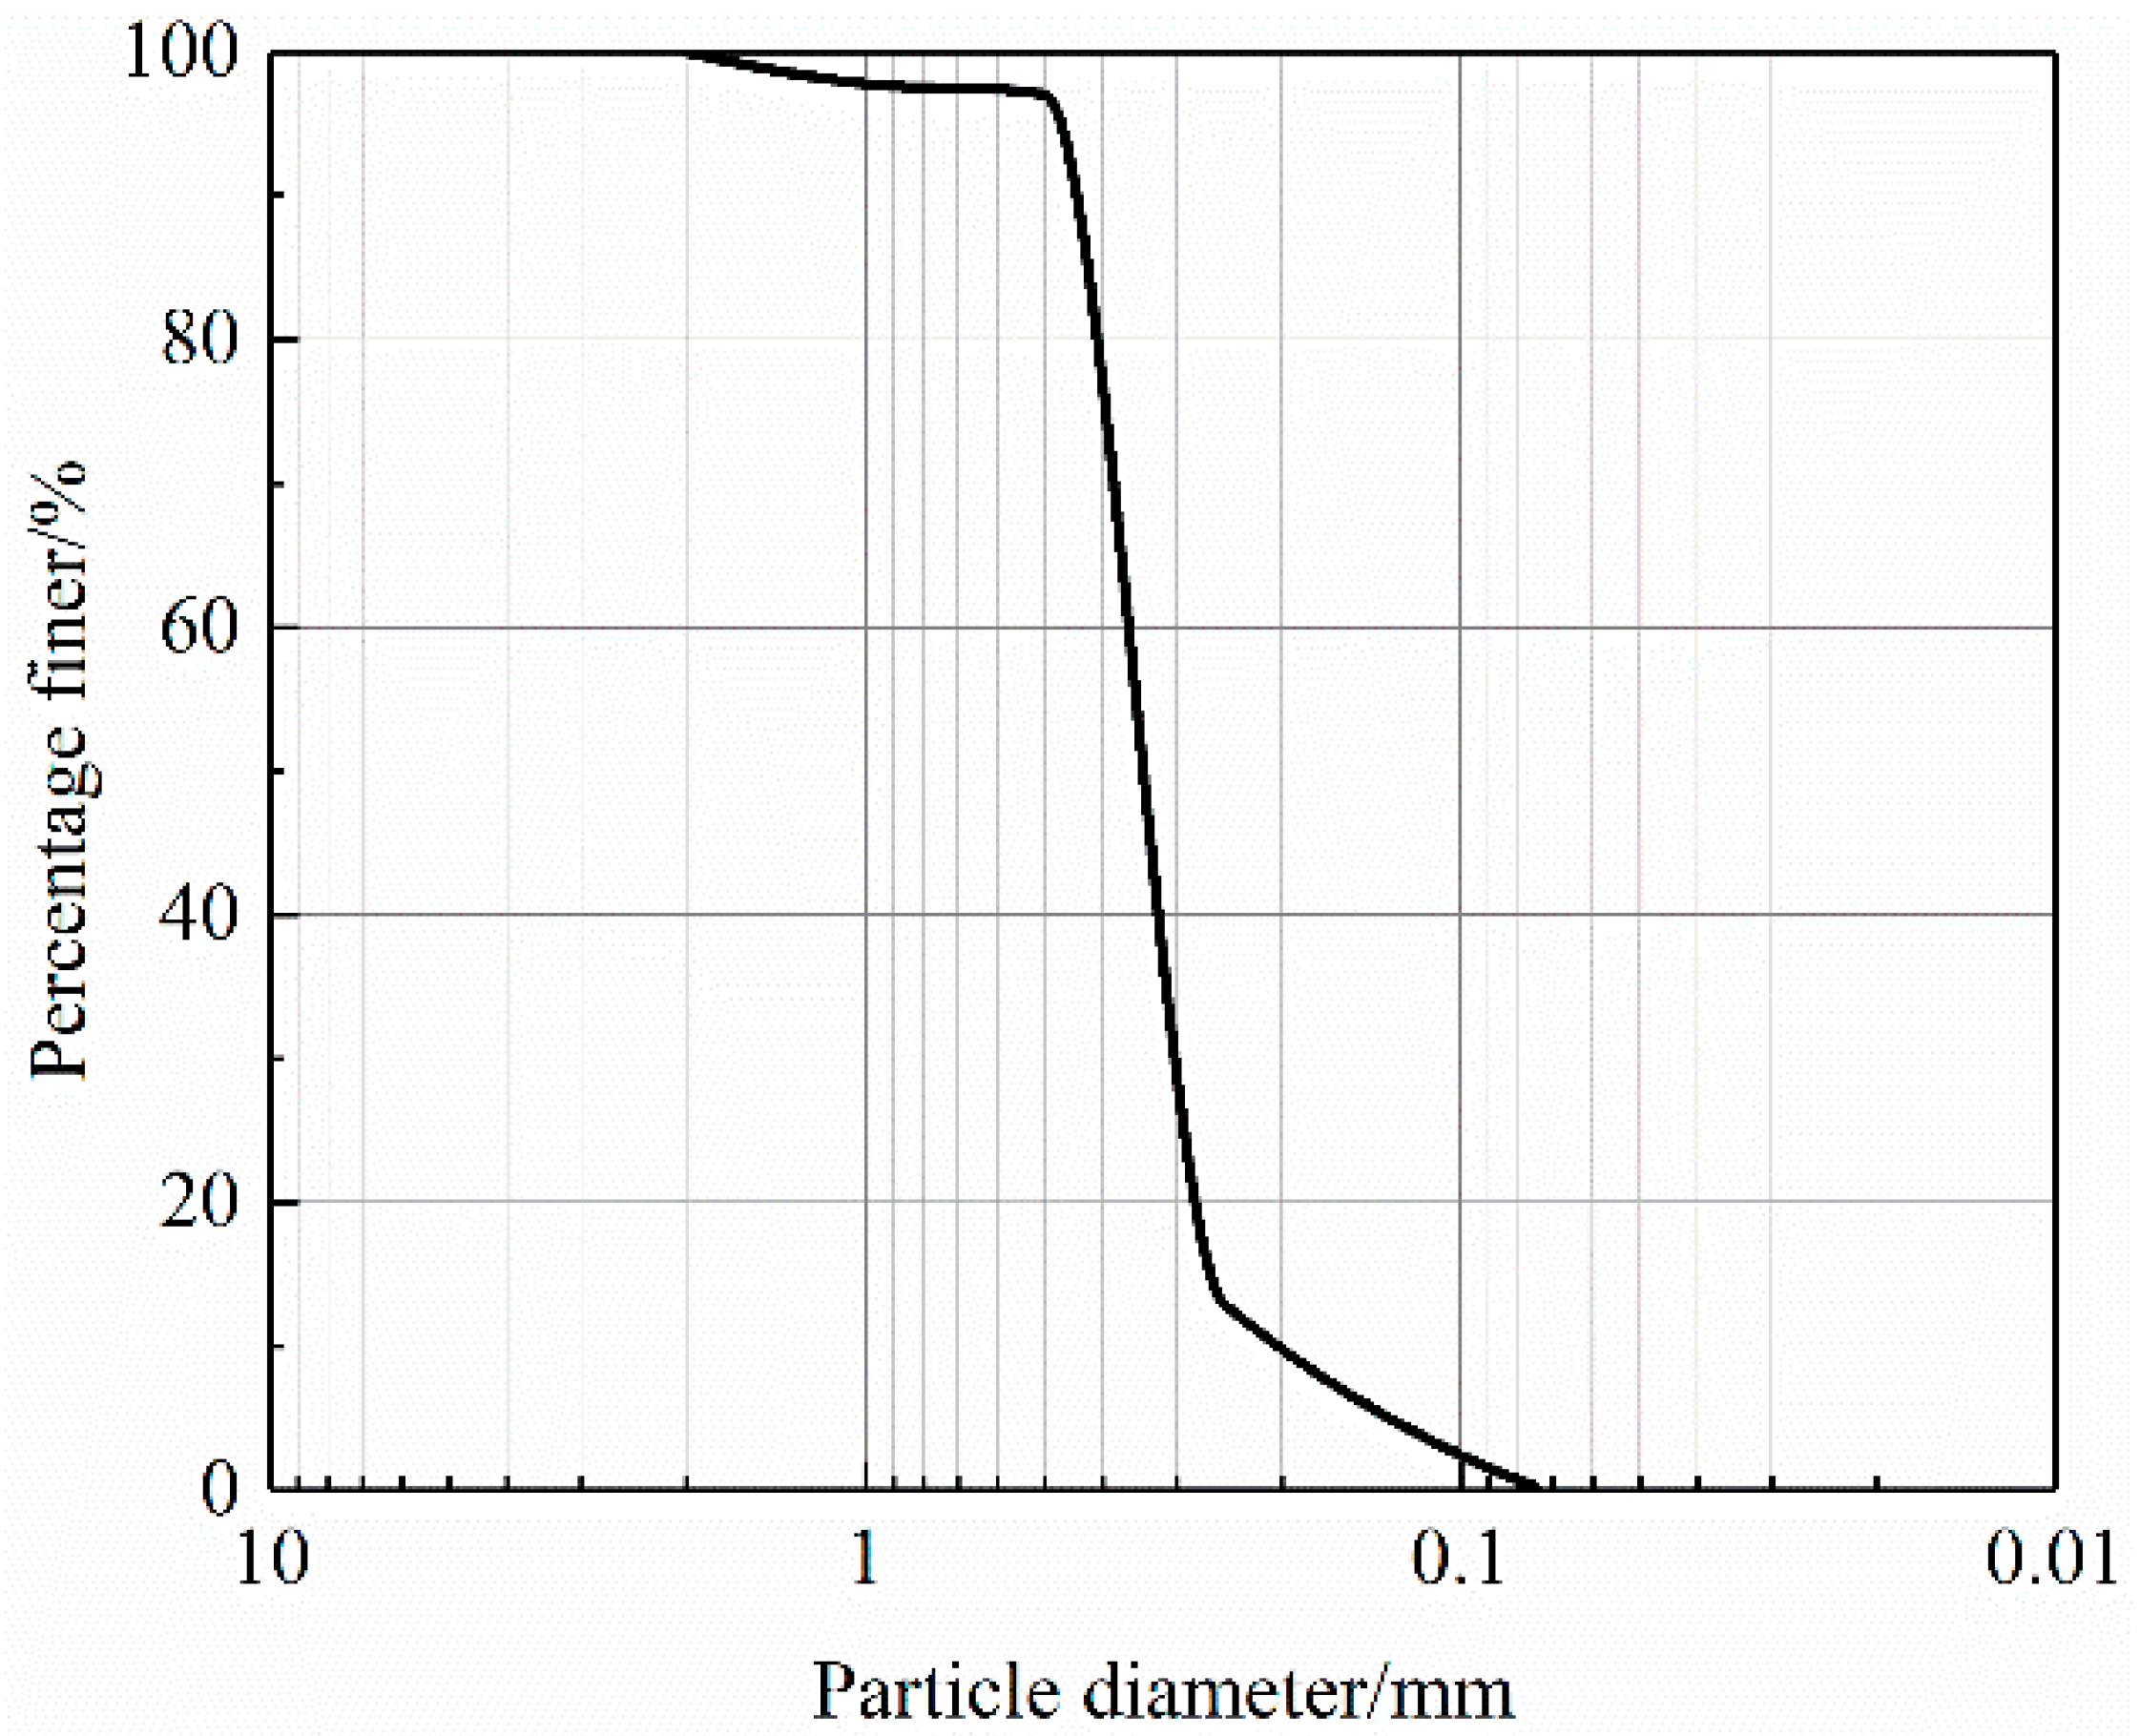
Figure 3.
Compacted OMDS samples: (a) compaction tool; (b) OMDS samples.

Figure 4.
Schematic drawing of DDS-70.
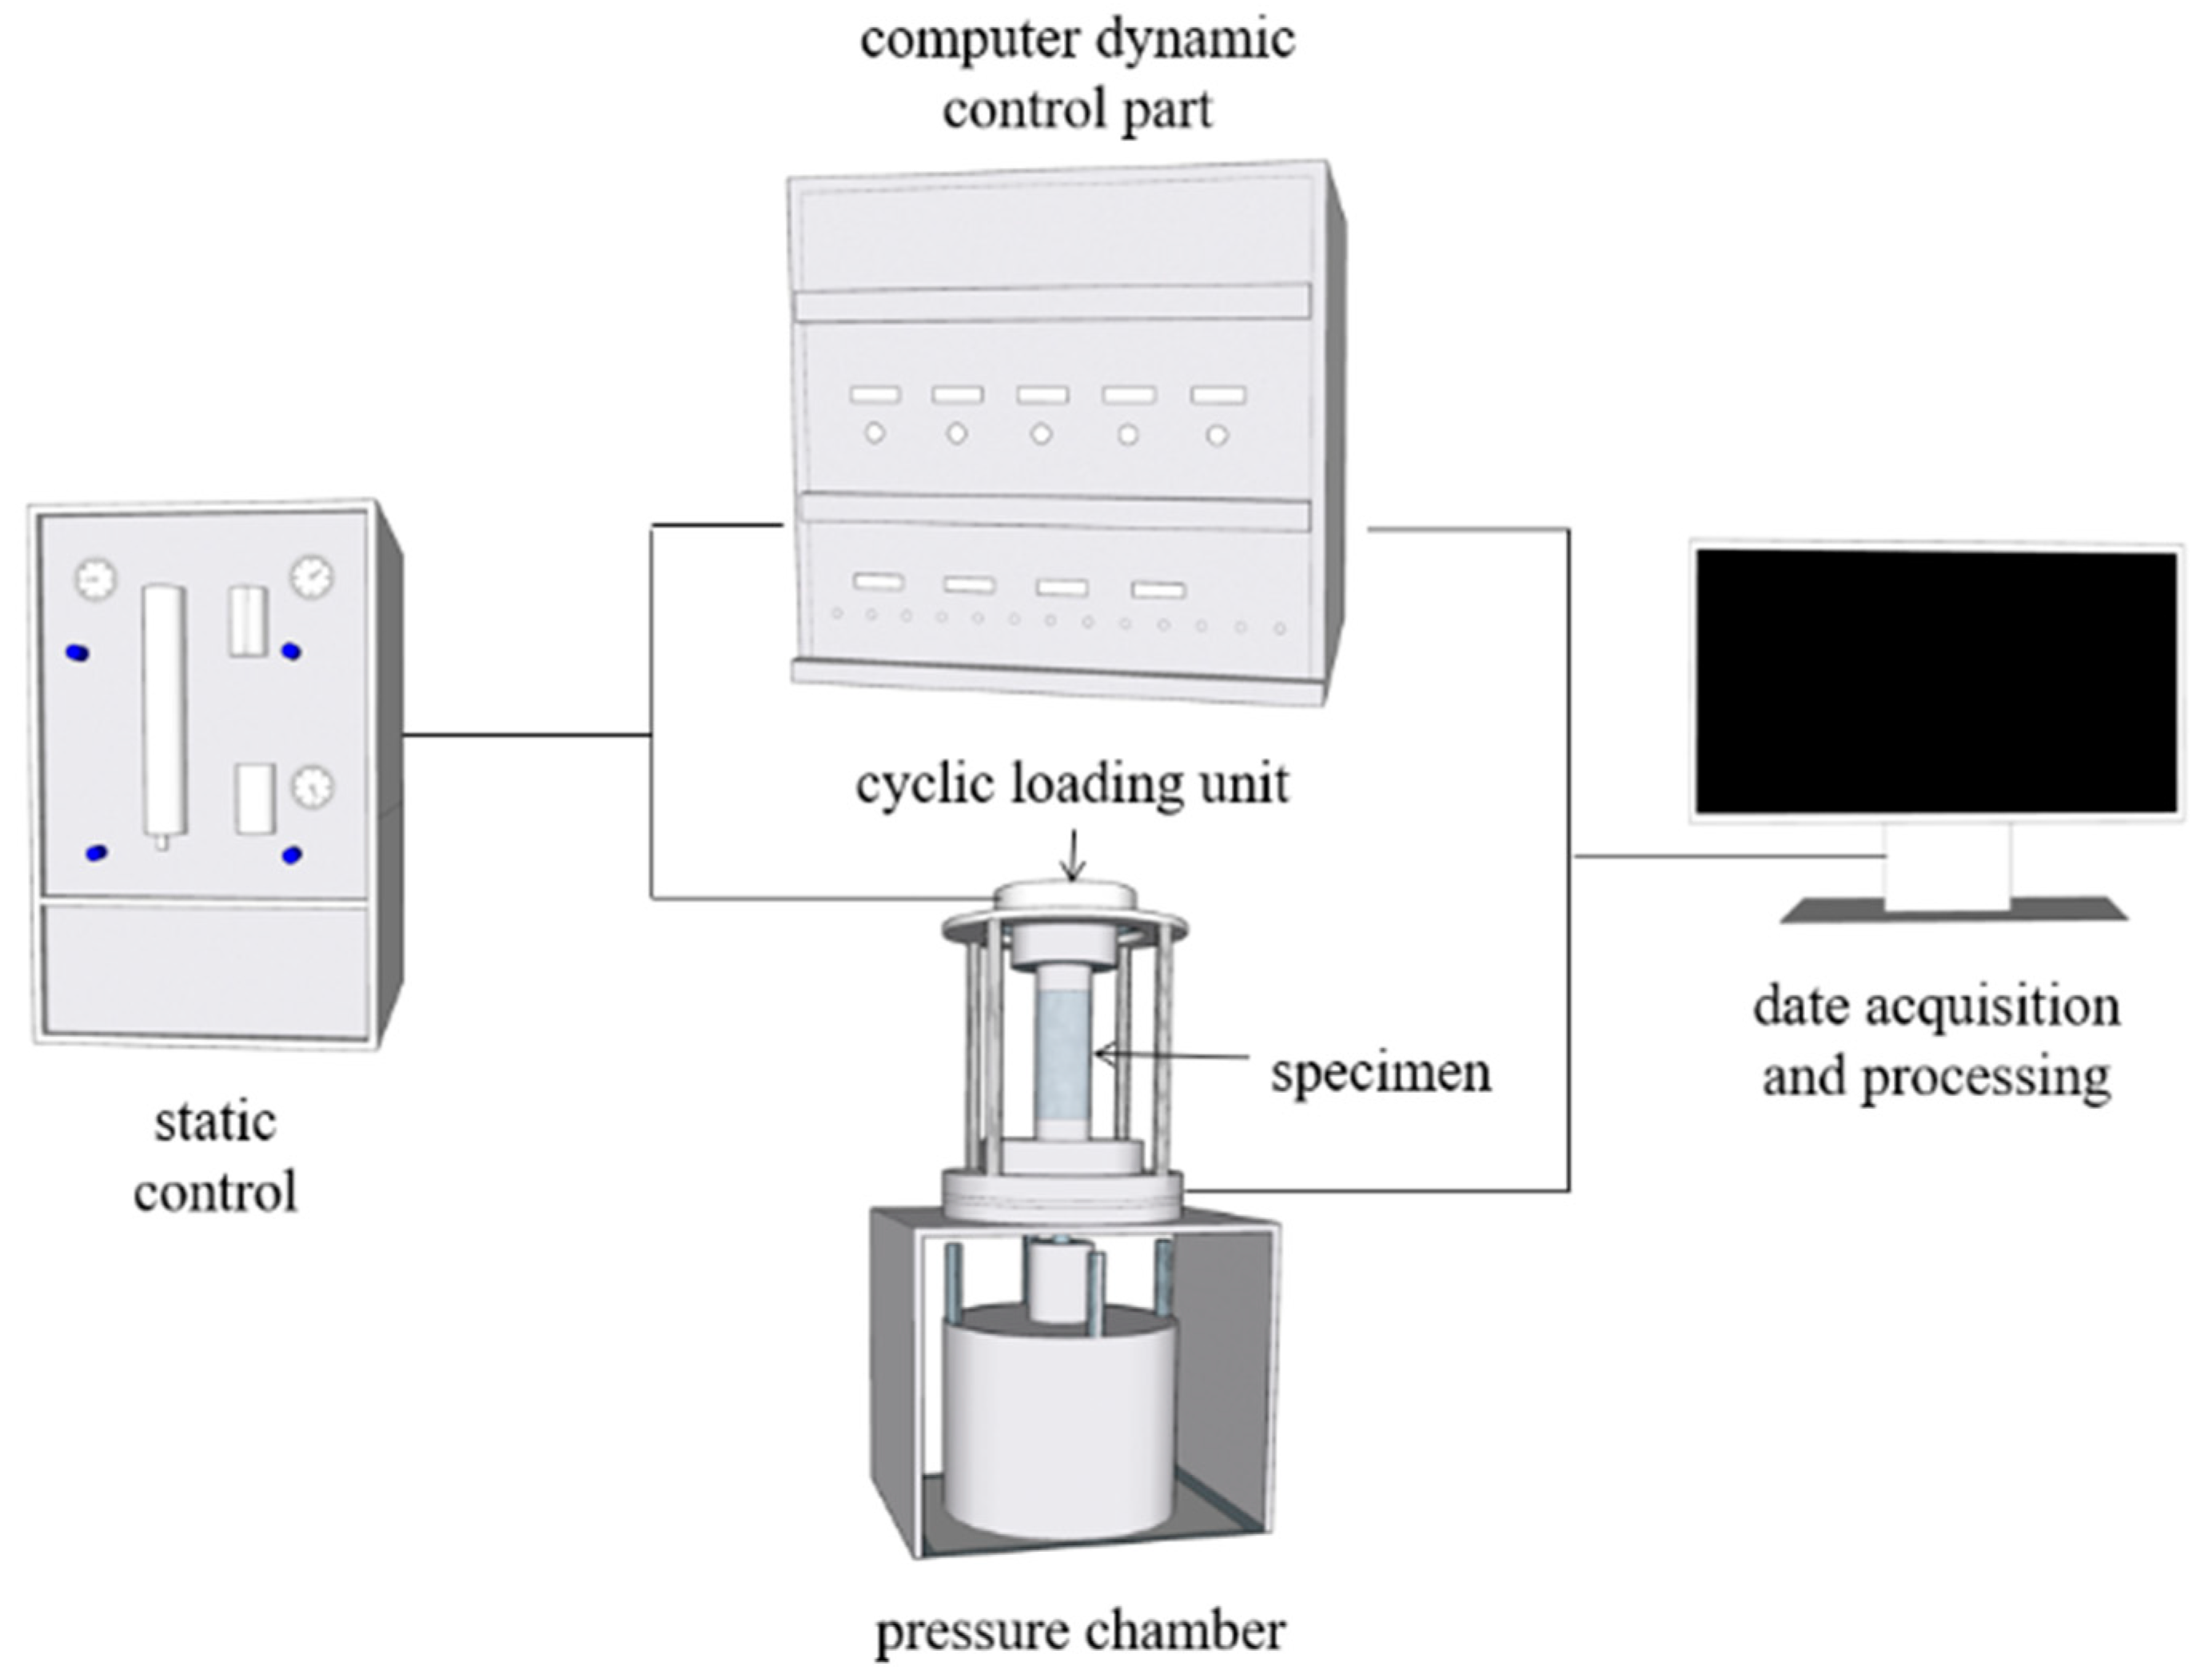
Figure 5.
Skeleton curves of OMDS samples under dynamic triaxial test: (a) sine wave, 10% moisture content, 1.0 consolidation ratio; (b) sine wave, 10% moisture content, 2.0 consolidation ratio; (c) triangular wave, 10% moisture content, 1.0 consolidation ratio; (d) rectangular wave, 10% moisture content, 1.0 consolidation ratio; (e) sine wave, 18% moisture content, 1.0 consolidation ratio; (f) sine wave, 18% moisture content, 2.0 consolidation ratio; (g) triangular wave, 18% moisture content, 1.0 consolidation ratio; (h) rectangular wave, 18% moisture content, 1.0 consolidation ratio; (i) sine wave, 24% moisture content, 1.0 consolidation ratio; (j) sine wave, 24% moisture content, 2.0 consolidation ratio; (k) triangular wave, 24% moisture content, 1.0 consolidation ratio; (l) rectangular wave, 24% moisture content, 1.0 consolidation ratio.
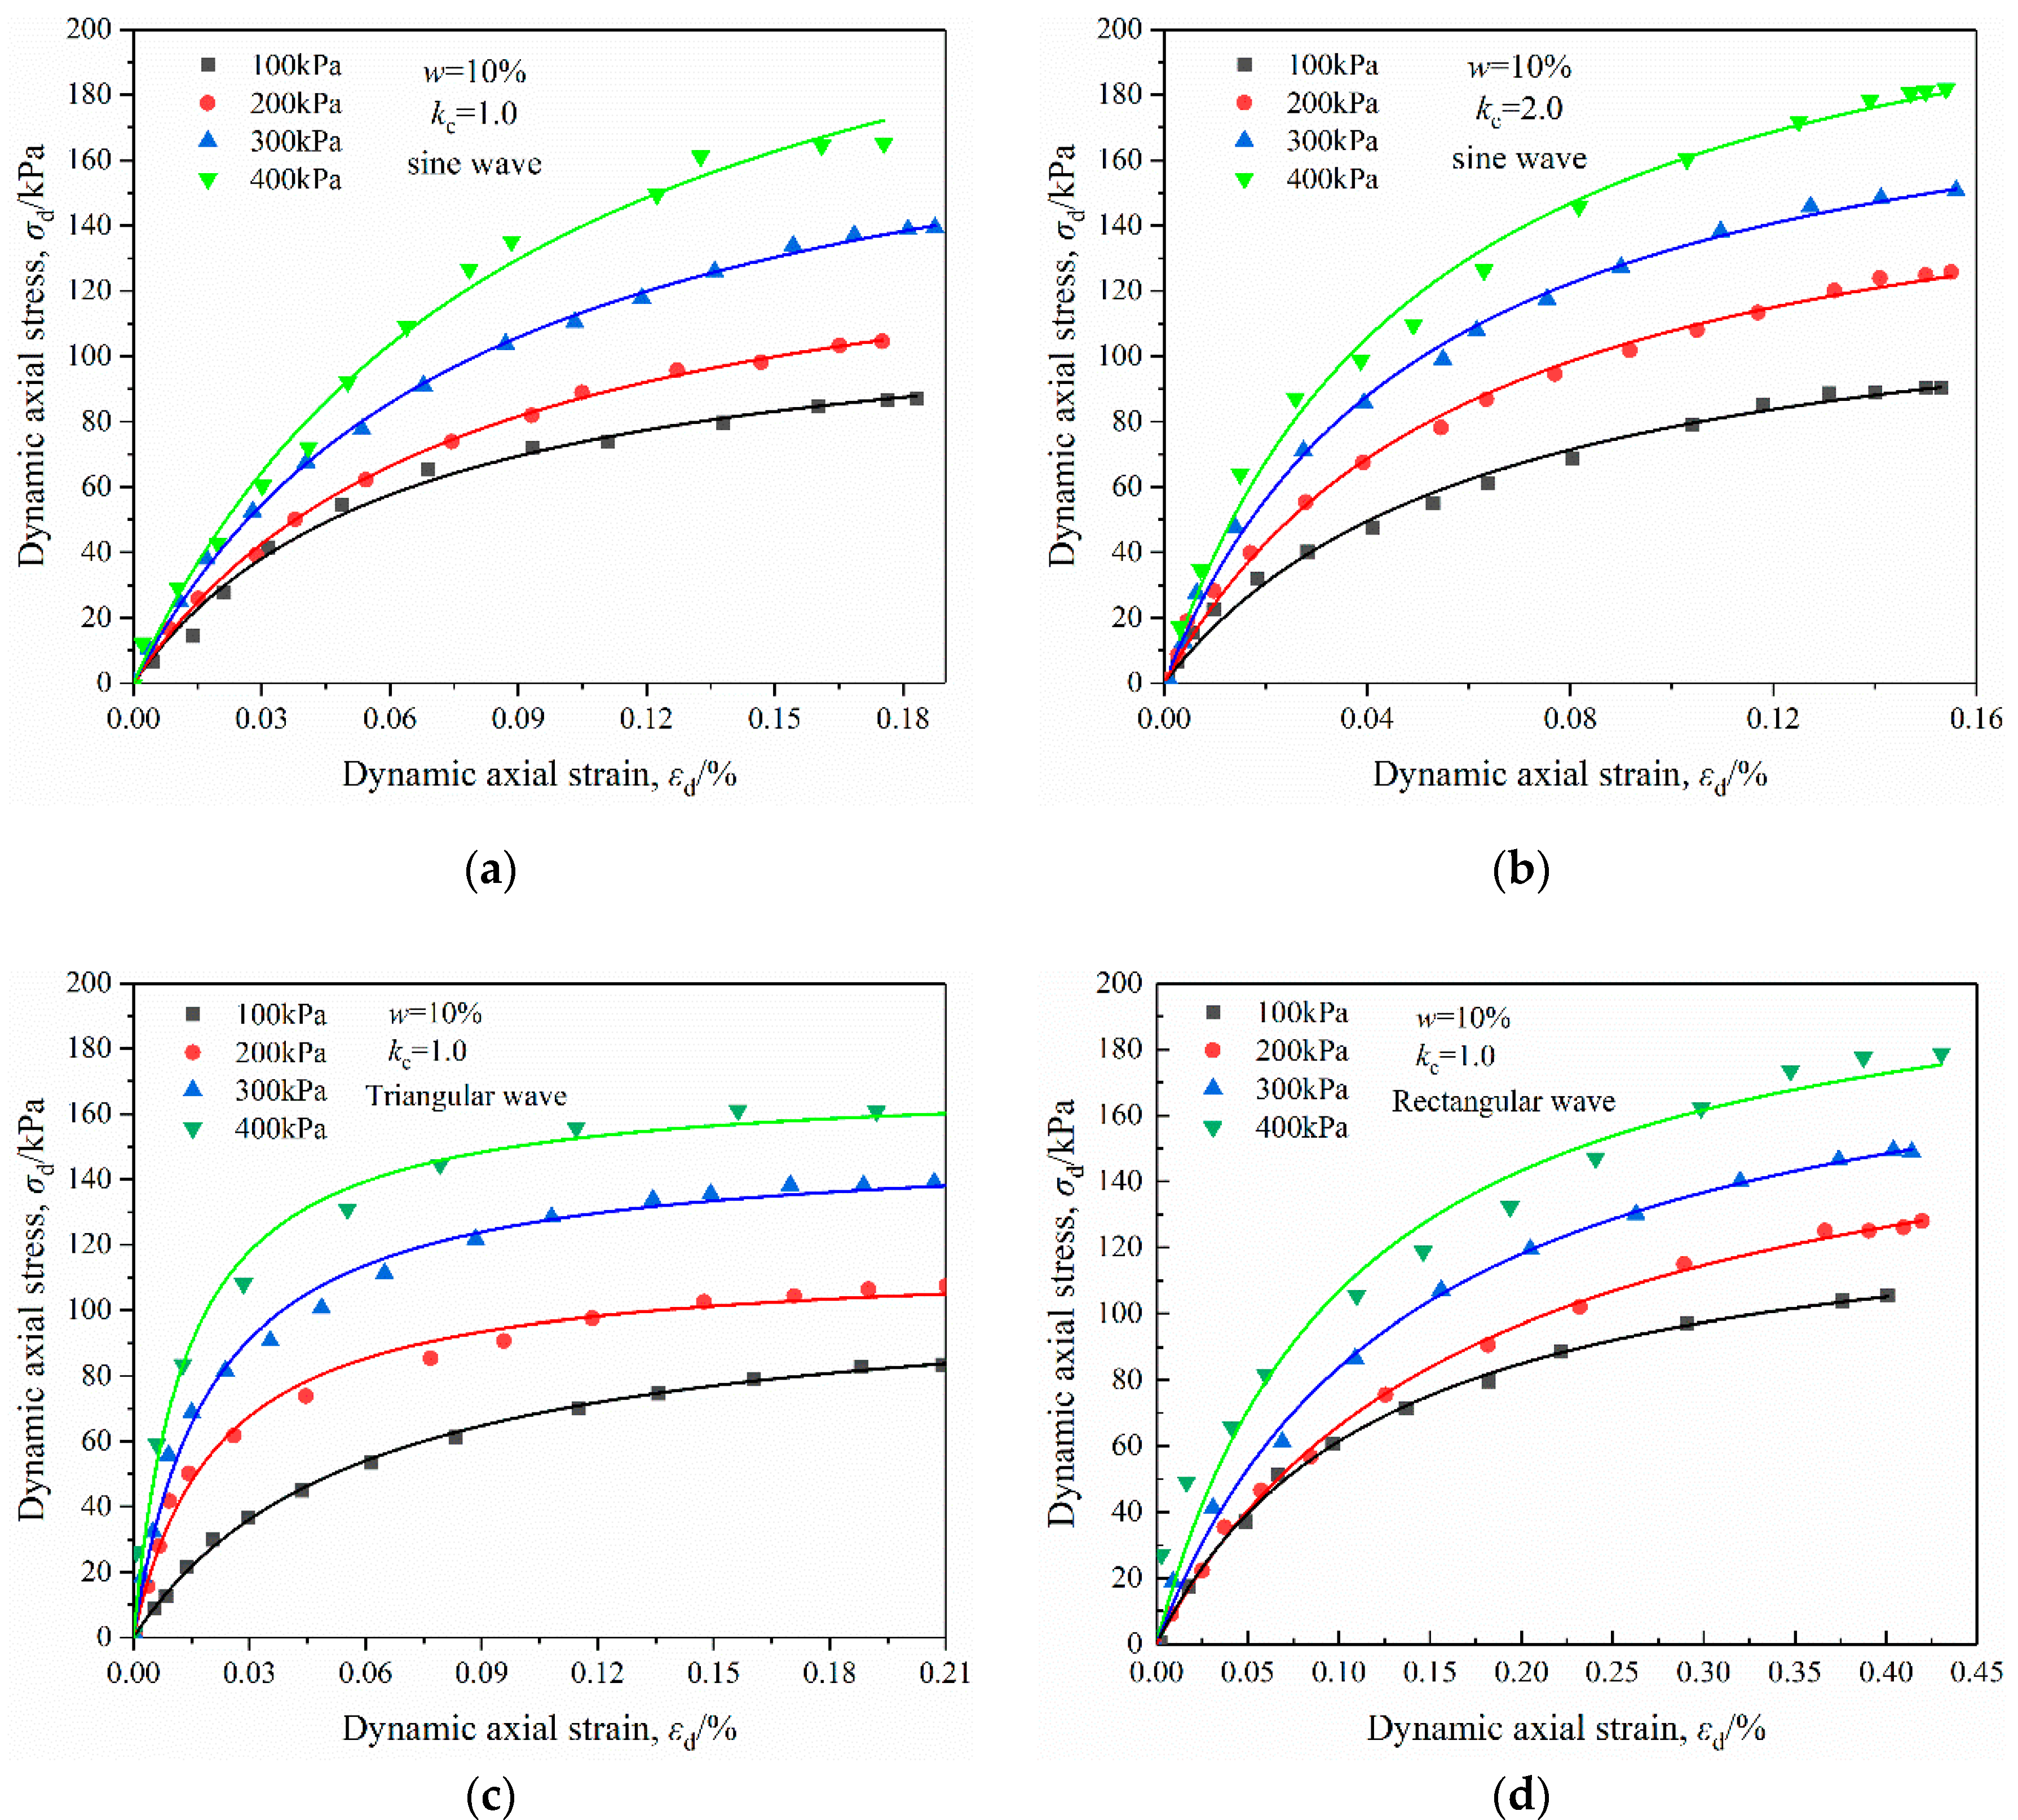
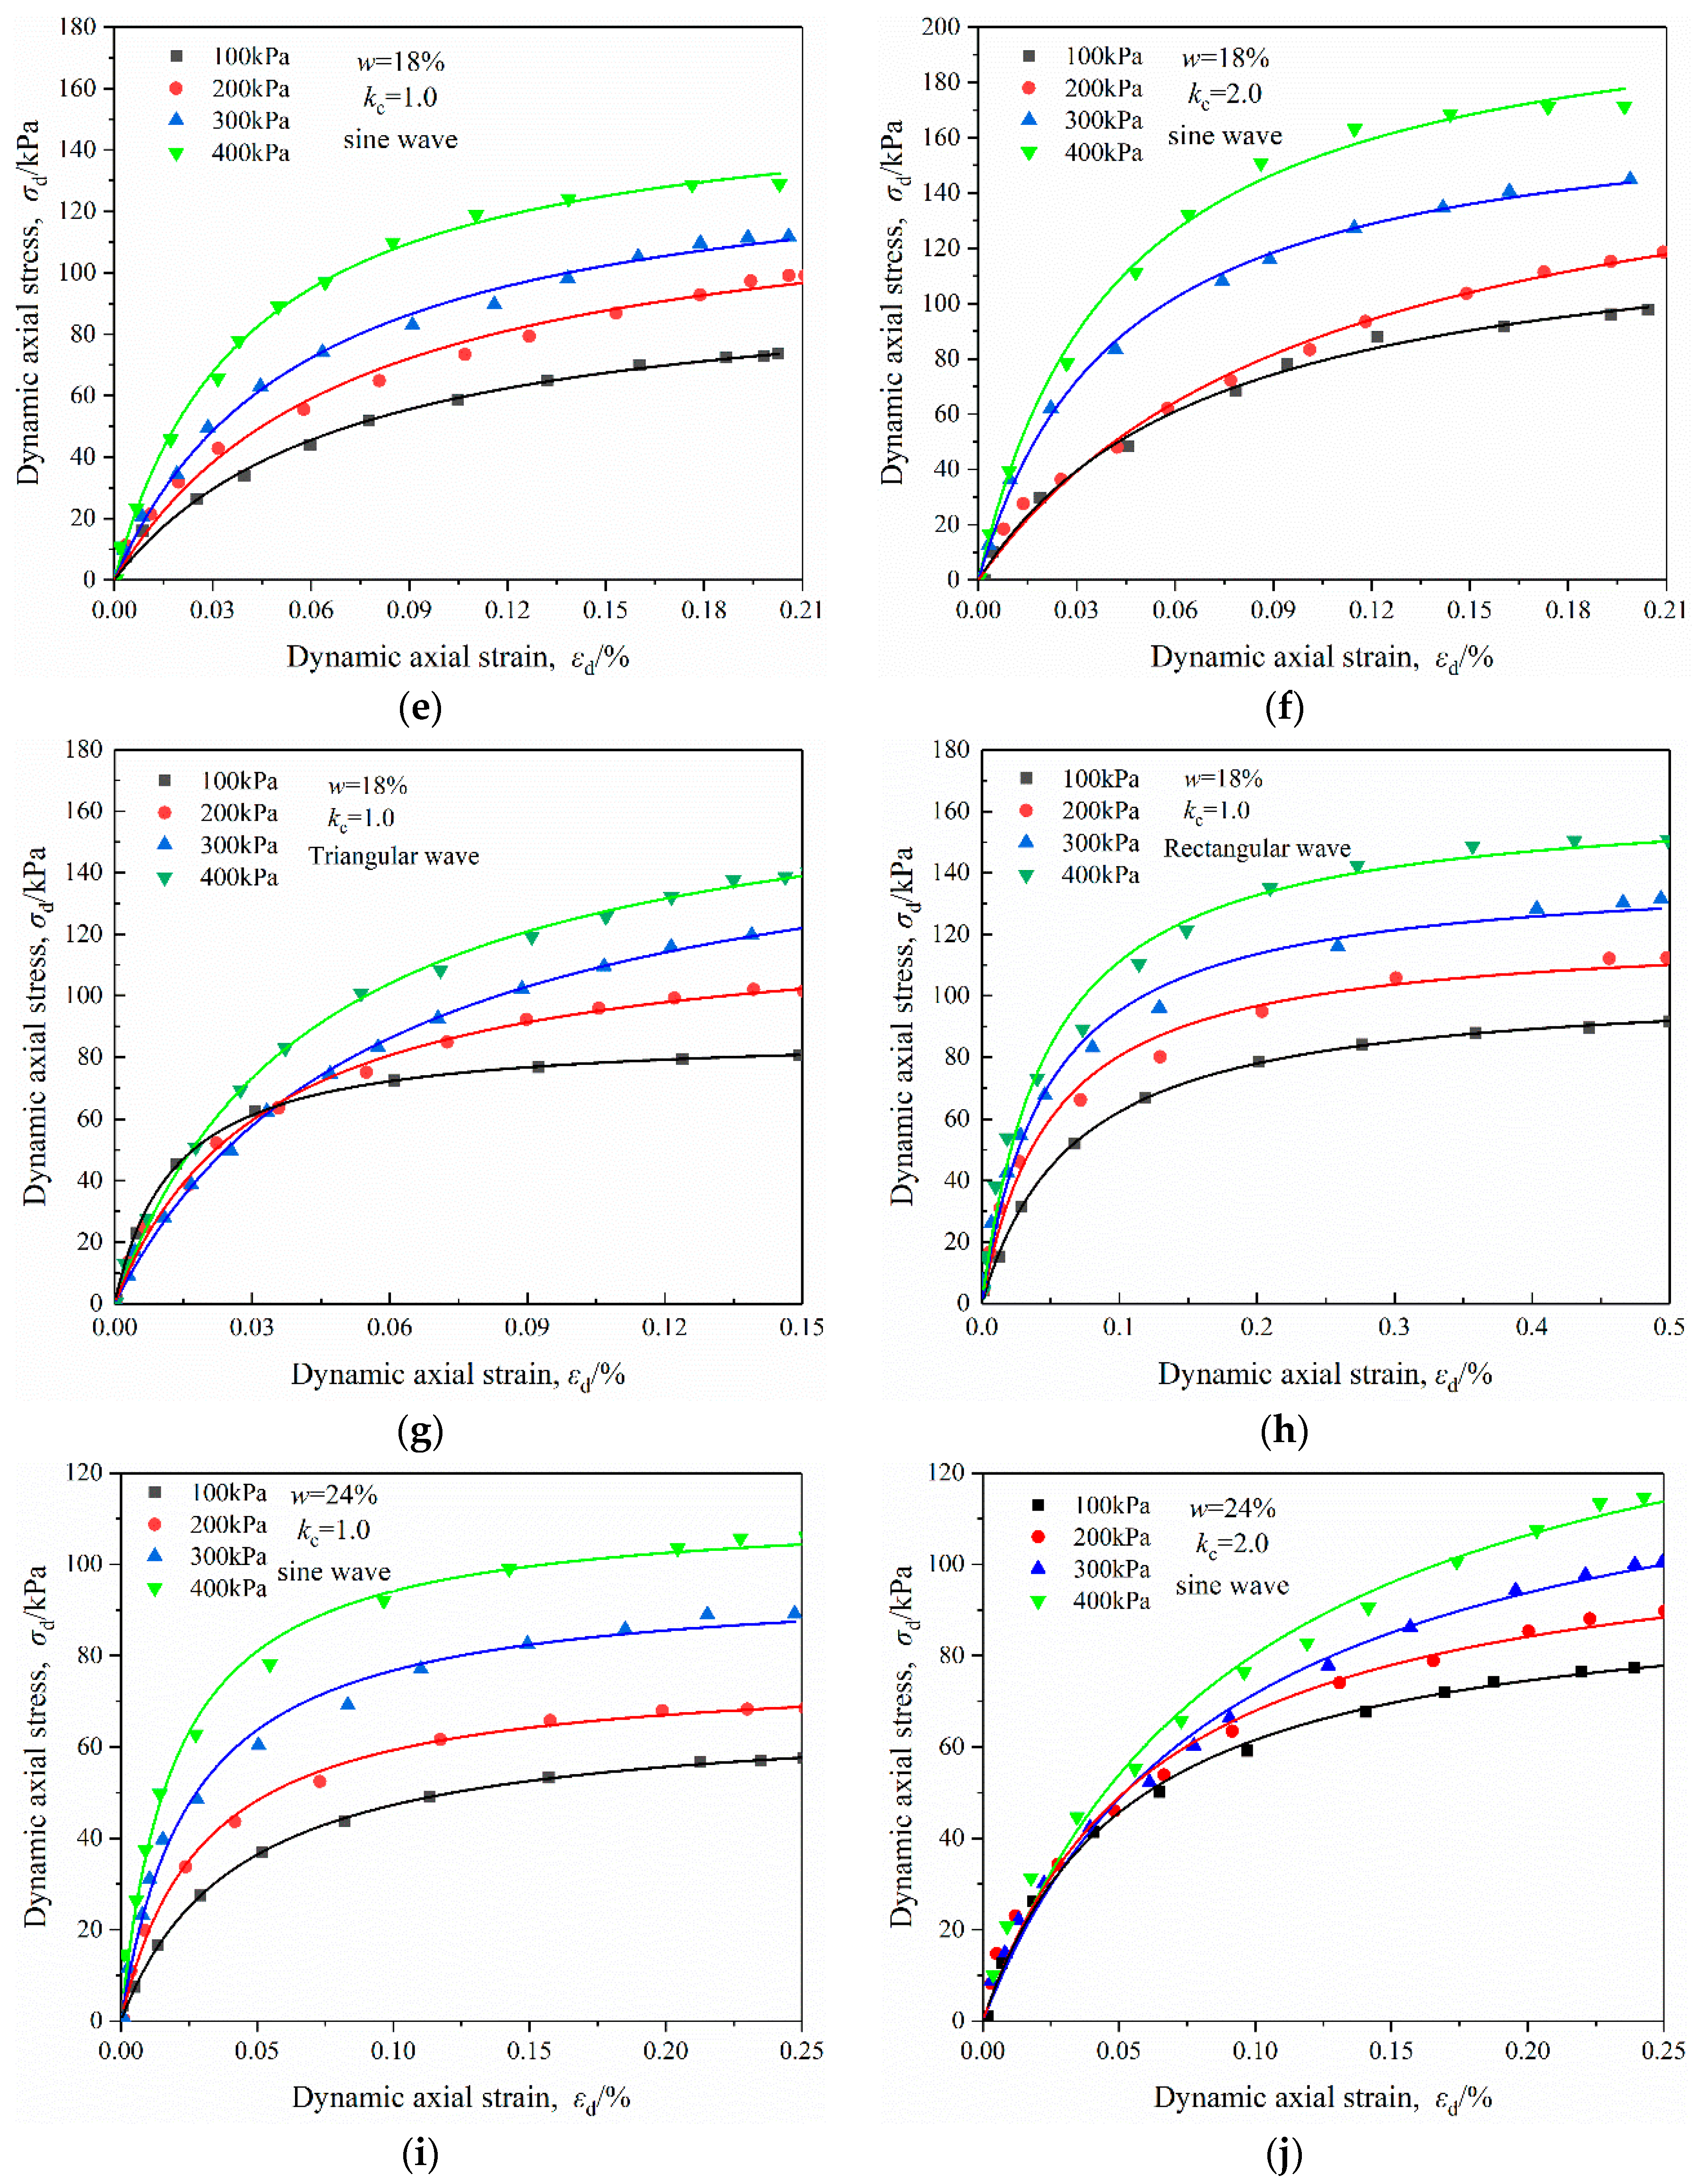

Figure 6.
Variation in Ed and εd of OMDS samples under dynamic triaxial test: (a) sine wave; (b) triangular wave; (c) rectangular wave.
Figure 6.
Variation in Ed and εd of OMDS samples under dynamic triaxial test: (a) sine wave; (b) triangular wave; (c) rectangular wave.


Figure 7.
Relationship of degradation index and vibration cycles under various vibration amplitude.
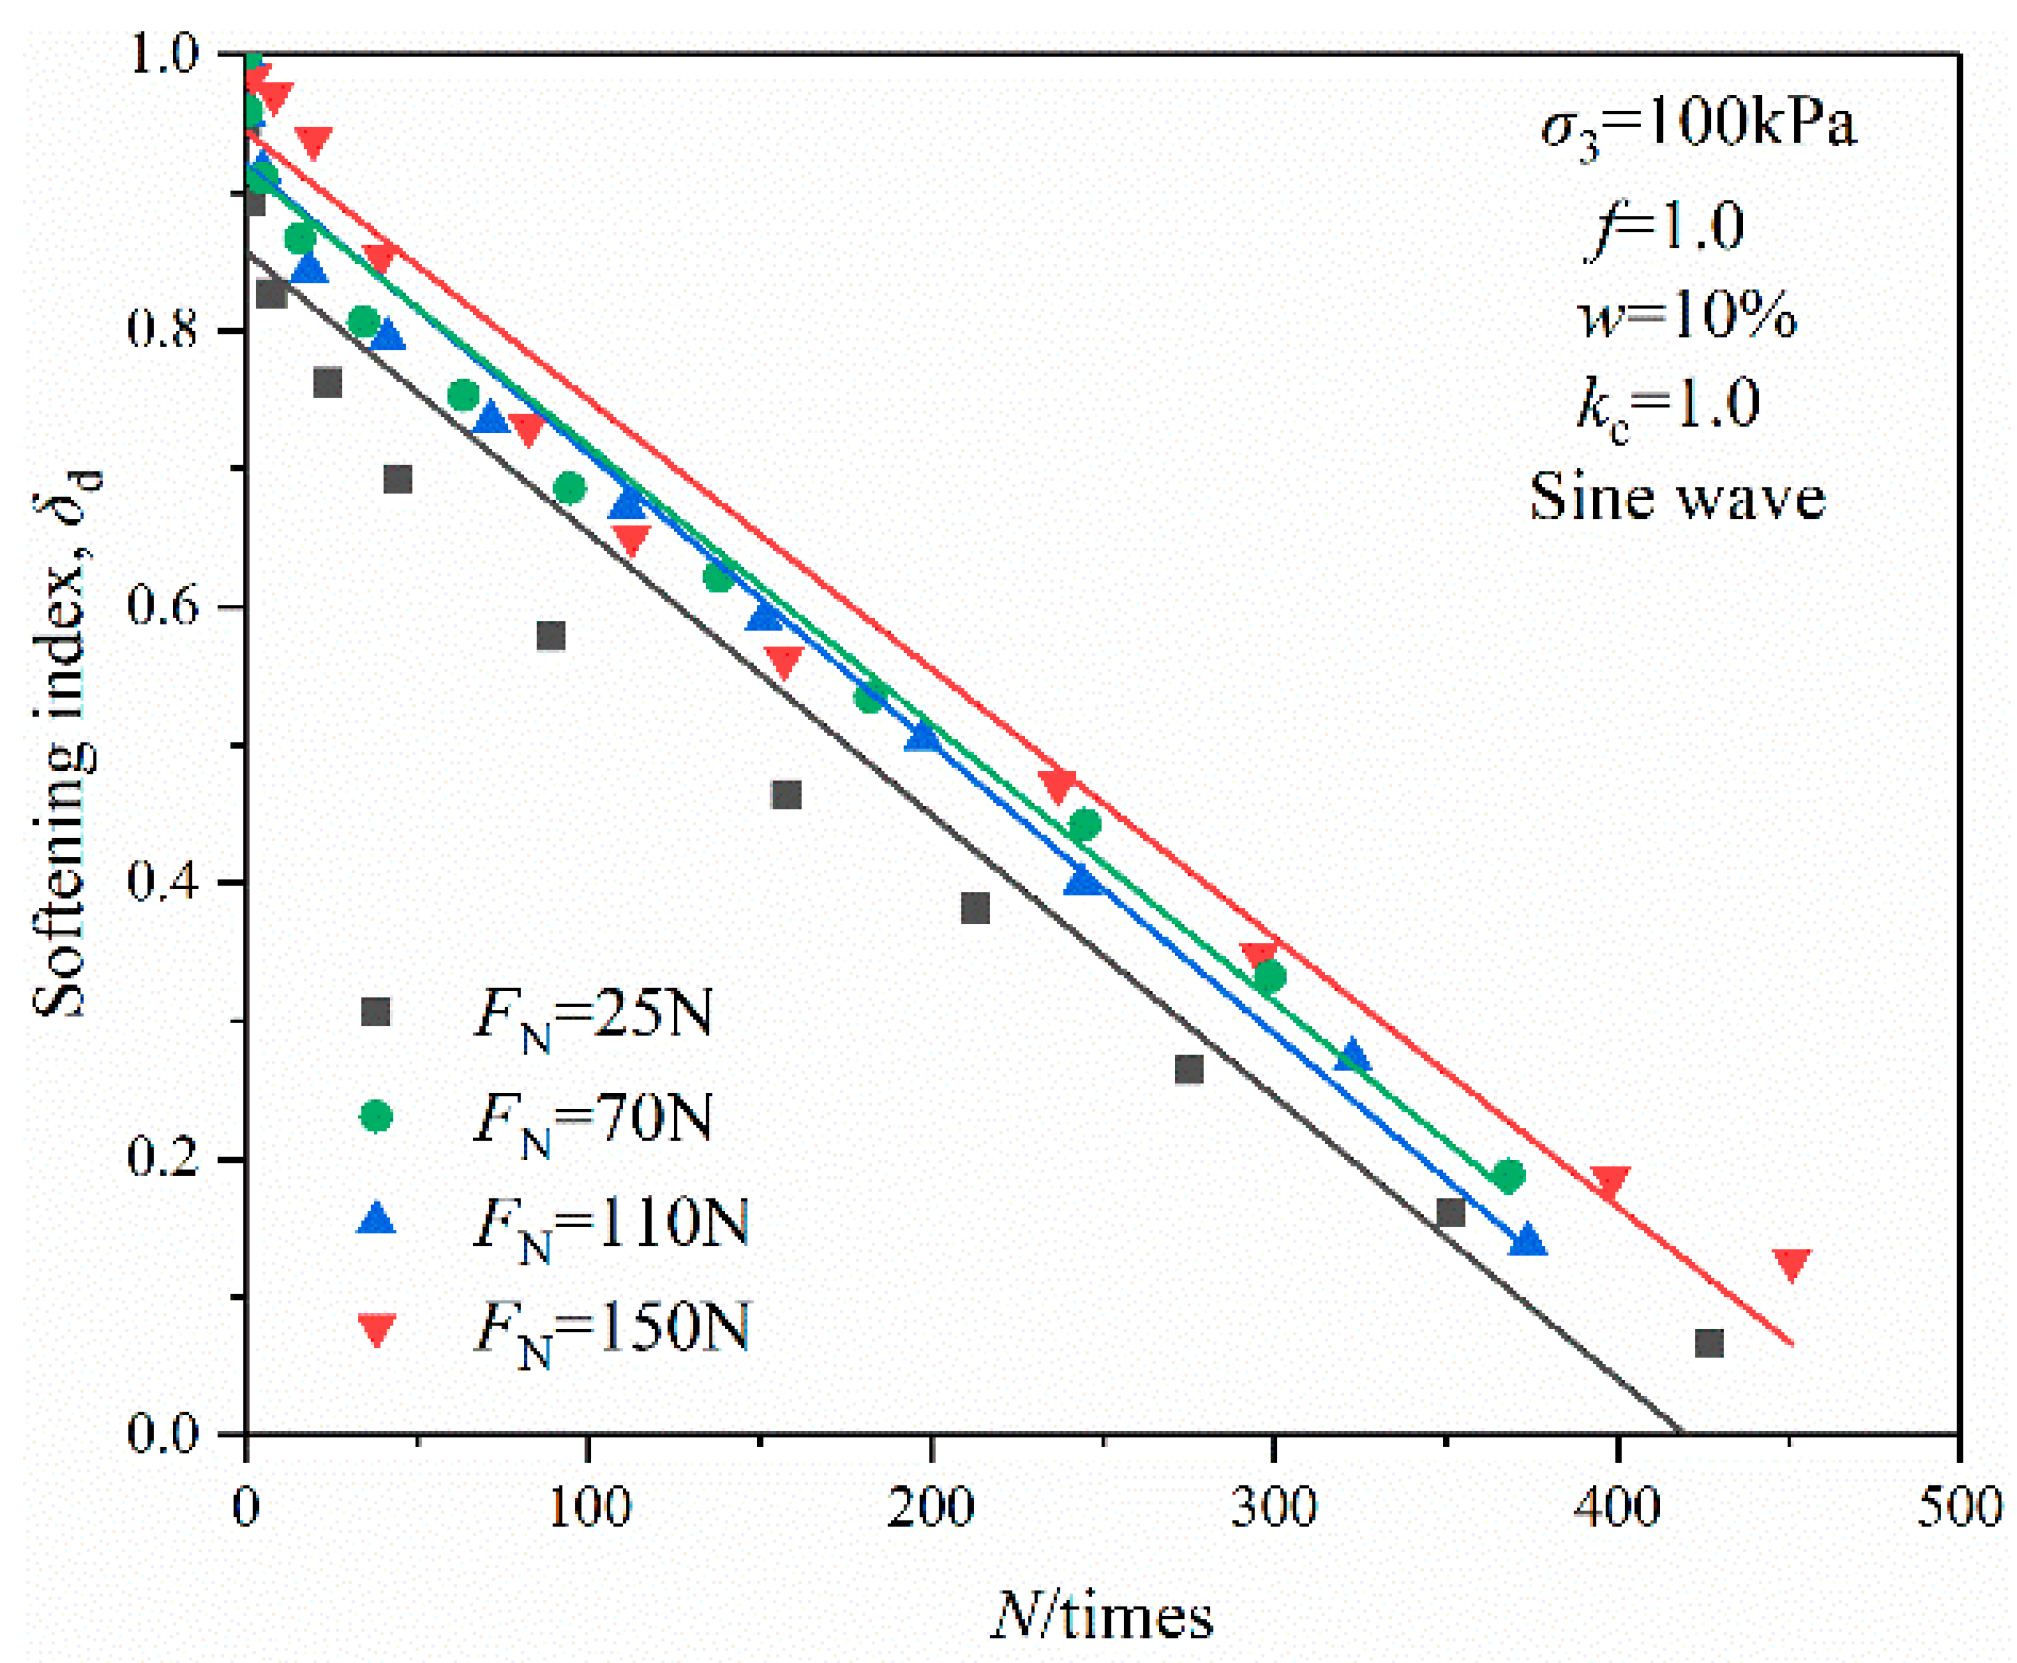
Figure 8.
Relationship of degradation index and vibration cycles under various natural moisture contents.
Figure 8.
Relationship of degradation index and vibration cycles under various natural moisture contents.

Figure 9.
Relationship of degradation index and vibration cycles under various consolidation ratios.
Figure 9.
Relationship of degradation index and vibration cycles under various consolidation ratios.
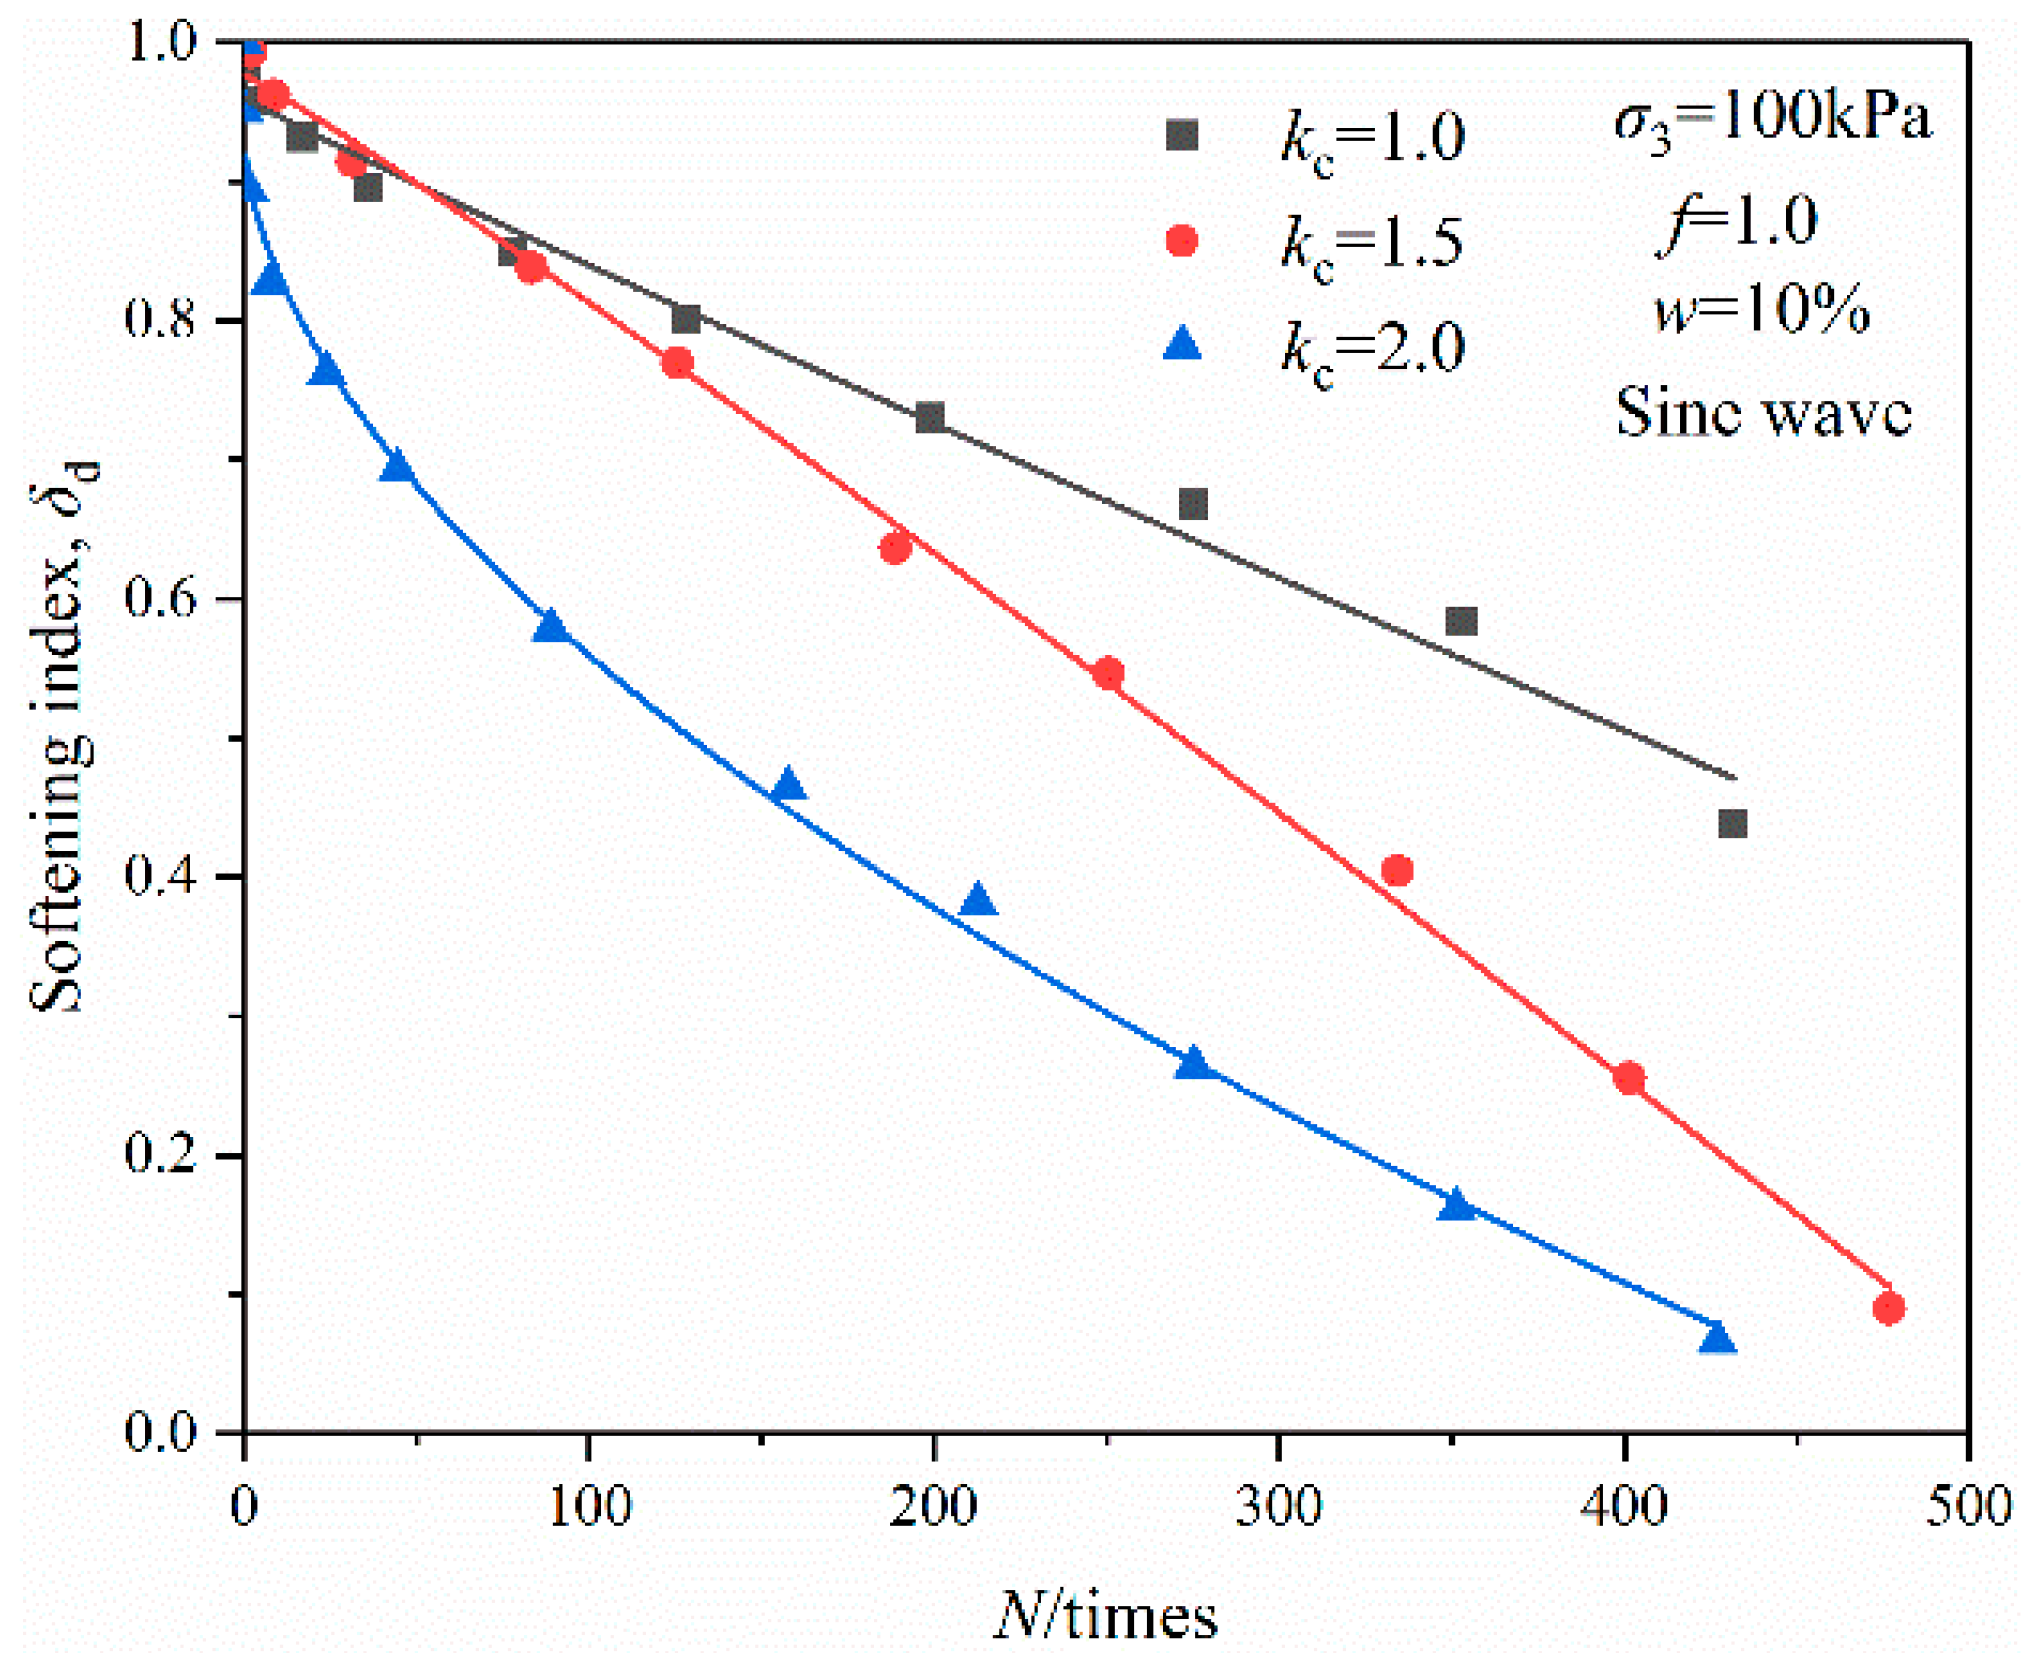
Figure 10.
Relationship of degradation index and vibration cycles under various wave forms.
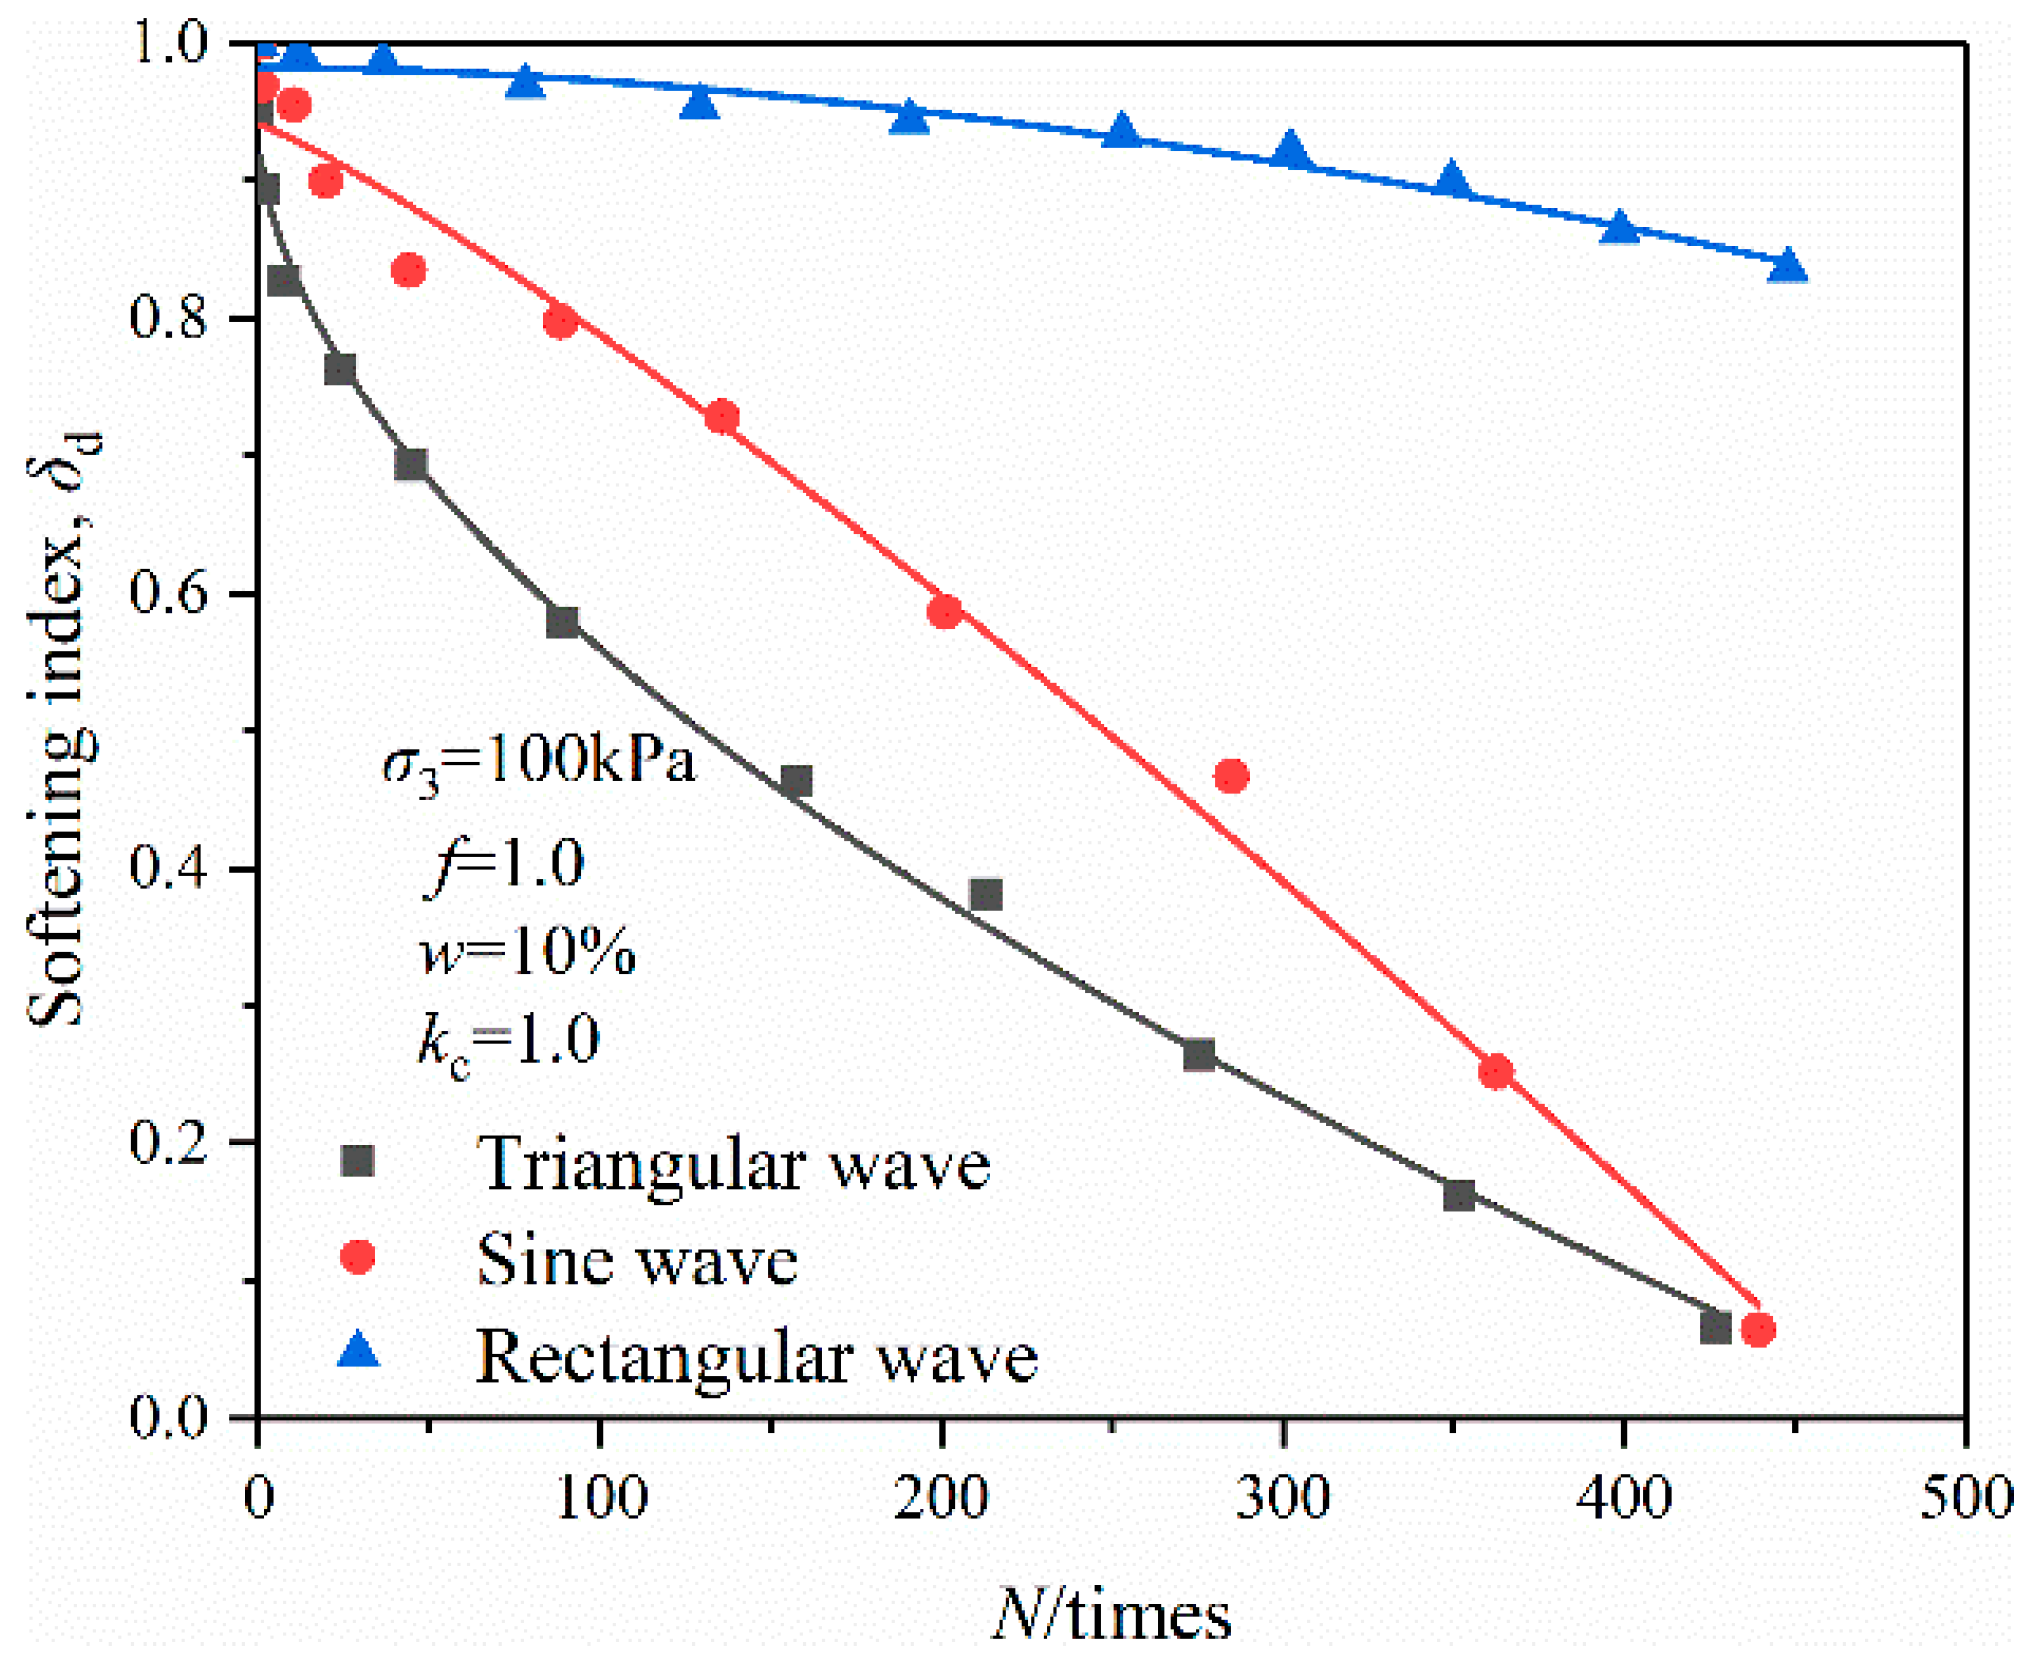
Figure 11.
Fitting of degradation index under different cyclic loading wave forms.

Figure 12.
Comparison of degradation model: (a) w = 10%; (b) w = 18%; (c) w = 24%.


Table 1.
Main physical parameters of OMDS.
| Organic Content/% | Natural Moisture Content/% | Natural Density/g·cm−3 | Minimum dry Density/g·cm−3 | Maximum Dry Density/g·cm−3 | Specific Gravity |
|---|---|---|---|---|---|
| 5.32 | 12.23 | 1.617 | 1.570 | 1.723 | 2.62 |
Table 2.
Scheme of dynamic triaxial test.
| Sample | Consolidation Ratio | Natural Moisture Content/% | Wave Form | Vibrating Load/N |
|---|---|---|---|---|
| OMDS | 1.0 | 10% 18% 24% | sine, triangular, rectangular sine, triangular, rectangular sine, triangular, rectangular | 25, 70, 110, 150 25, 70, 110, 150 25, 70, 110, 150 |
| 1.5 | 10% 18% 24% | sine, triangular, rectangular sine, triangular, rectangular sine, triangular, rectangular | 25, 70, 110, 150 25, 70, 110, 150 25, 70, 110, 150 | |
| 2.0 | 10% 18% 24% | sine, triangular, rectangular sine, triangular, rectangular sine, triangular, rectangular | 25, 70, 110, 150 25, 70, 110, 150 25, 70, 110, 150 |
Table 3.
Fitting parameters.
| Wave Form | Moisture Content/% | Fitting Parameters | ||
|---|---|---|---|---|
| m | n | R2 | ||
| Sine wave | 10 18 24 | −0.01416 −0.05232 −0.09039 | 0.67934 0.47059 0.38753 | 0.87 0.90 0.89 |
| Triangular wave | 10 18 24 | −0.00783 −0.00592 −0.00447 | 1.09822 1.19321 0.8703 | 0.79 0.82 0.85 |
| Rectangular wave | 10 18 24 | −0.00837 −0.00134 −0.00157 | 1.03818 1.02179 1.00179 | 0.79 0.82 0.88 |
Table 4.
Degradation models.
| Researcher | Degradation Model | Reference |
|---|---|---|
| Idriss et al. | [12] | |
| Yasuhara et al. | [17] | |
| Yao et al. | [13] | |
| This paper | Present work |
Table 5.
Fitting effect of models based on the experimental data.
| Sample | Wave Form | Moisture Content (%) | Residual Error Square Sum | |||
|---|---|---|---|---|---|---|
| Idriss Model | Yasuhara Model | Yao Model | This Paper | |||
| OMDS | Sine wave | 10 | 1.198 | 1.058 | 1.279 | 0.016 |
| 18 | 1.472 | 1.239 | 1.617 | 0.007 | ||
| 24 | 1.332 | 1.267 | 1.427 | 0.007 | ||
Publisher’s Note: MDPI stays neutral with regard to jurisdictional claims in published maps and institutional affiliations. |
© 2022 by the authors. Licensee MDPI, Basel, Switzerland. This article is an open access article distributed under the terms and conditions of the Creative Commons Attribution (CC BY) license (https://creativecommons.org/licenses/by/4.0/).
Share and Cite
MDPI and ACS Style
Du, J.; Jiang, X.; Liu, B.; Jia, L.; Zhang, Y. Experimental Study on Stiffness Degradation of Organic Matter-Disseminated Sand under Cyclic Loading. Sustainability 2022, 14, 11793. https://doi.org/10.3390/su141811793
AMA Style
Du J, Jiang X, Liu B, Jia L, Zhang Y. Experimental Study on Stiffness Degradation of Organic Matter-Disseminated Sand under Cyclic Loading. Sustainability. 2022; 14(18):11793. https://doi.org/10.3390/su141811793
Chicago/Turabian StyleDu, Juan, Xingfei Jiang, Bingyang Liu, Lin Jia, and Yang Zhang. 2022. "Experimental Study on Stiffness Degradation of Organic Matter-Disseminated Sand under Cyclic Loading" Sustainability 14, no. 18: 11793. https://doi.org/10.3390/su141811793
Note that from the first issue of 2016, this journal uses article numbers instead of page numbers. See further details here.