


Indicators for the Circular City: A Review and a Proposal


Abstract
:1. Introduction
2. Materials and Methods
2.1. The Importance of Indicators in a Circular City
- Quantifying the circularity of the individual proposed project with respect to the issue in which it fits;
- then, assessing the impact of the project with respect to priority issues such as mobility, waste, energy, and reduction of inputs (land, water, and energy consumption) and outputs (waste and pollutant production);
- finally, considering the urban neighborhood, it is essential to assess impacts on different related priority issues (waste, mobility, energy, etc.) to finally quantify the different projects implemented in the area.
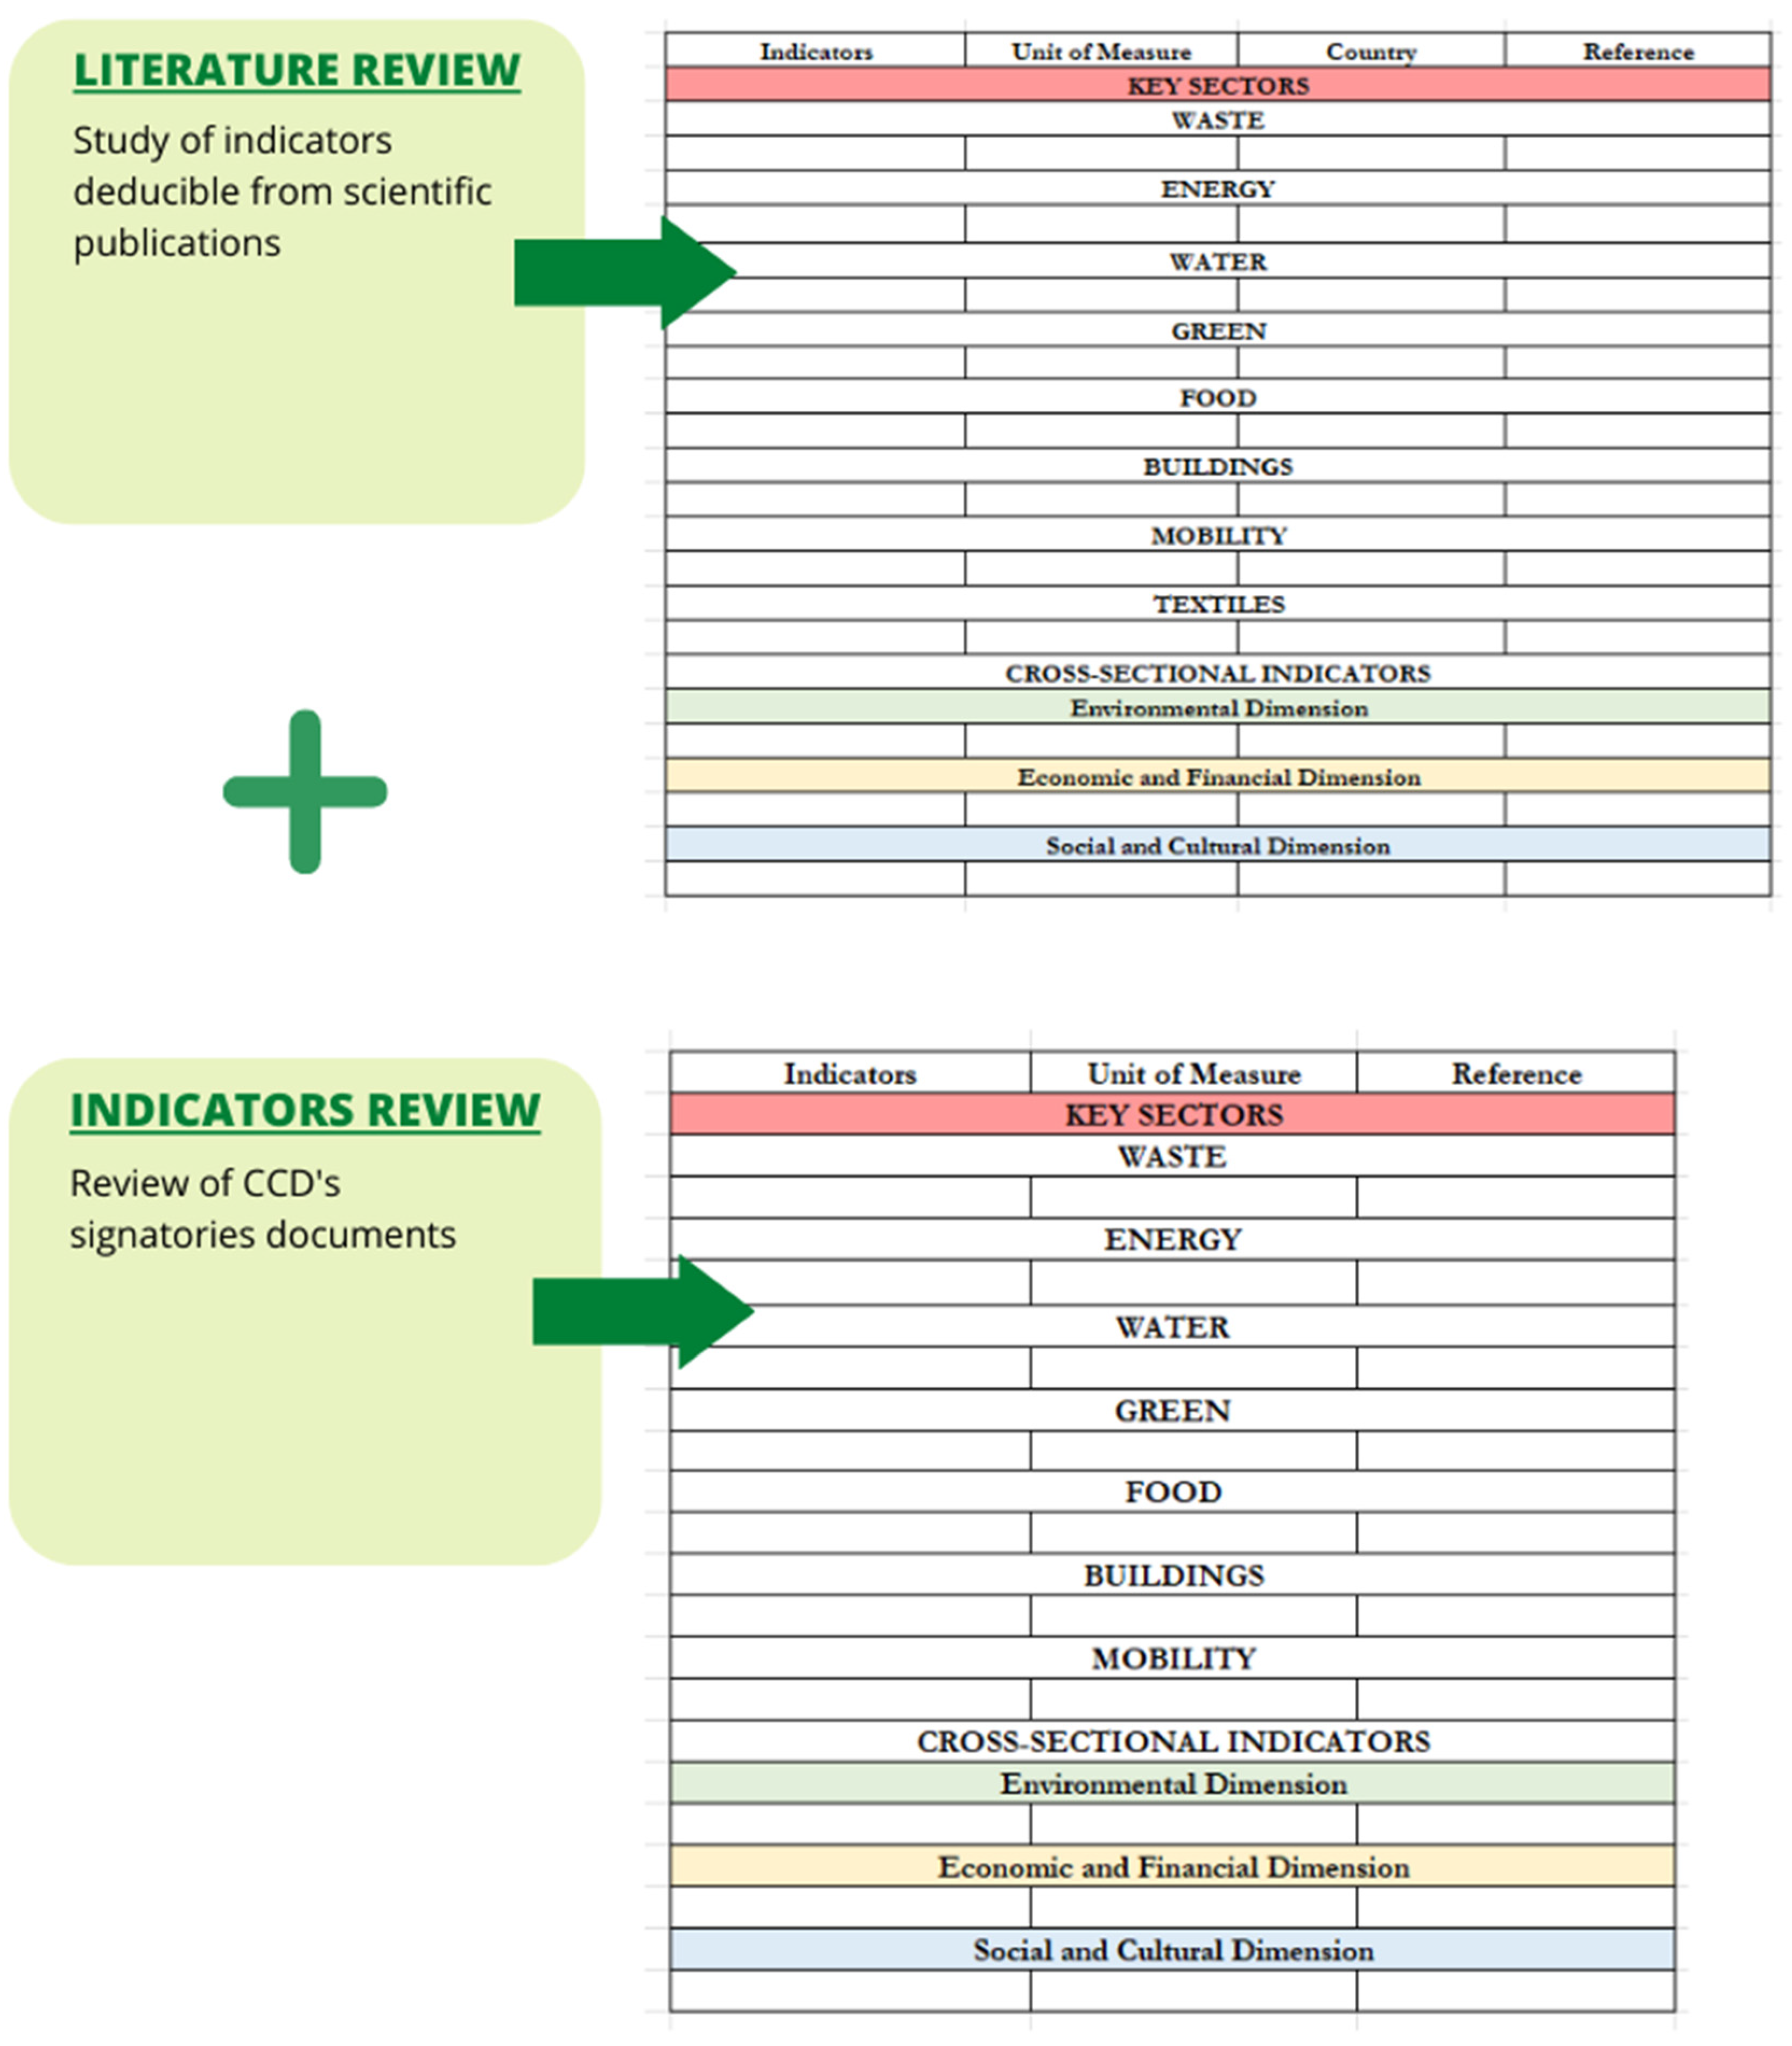
2.2. Proposed Methodology
3. Results
3.1. Databases Existing Indicators
3.2. Proposed Indicators
4. Discussion
5. Conclusions
Author Contributions
Funding
Institutional Review Board Statement
Informed Consent Statement
Data Availability Statement
Conflicts of Interest
Appendix A

| Indicator | Unit of Measure | Country | Reference |
|---|---|---|---|
| Key Sectors | |||
| Waste | |||
| Waste Quality Index | - | BR, AR | [33] |
| Waste generation | tons | BR, AR, CL, RS, IR, IT, UK | [33,34,35,36,37] |
| Recycling rate of municipal waste | %/year | US, CL, IR, SE, RS, NL, IT, FR, IS, CN, ES | [3,20,34,35,38,39,40,41] |
| Recycling rate of packaging waste | %/year | US, IT | [3,42] |
| Amount of landfilled waste | %/year or tons/year | US, SE, CL, RS, IR, NL, IT, FR, IS, CN, UK, EU, HU, EL | [3,20,34,38,39,40,43,44,45,46,47,48,49] |
| Percentage of material solid waste landfilled | |||
| Percentage of household waste landfilled | |||
| Percentage of material solid waste incinerated | %/year | UK, IT, SE | [43,47] |
| Percentage of material solid waste composted | %/year | CL, RS, IR, UK, EU, CN | [34,43,44,46] |
| Use of recycled goods in municipal administration | %/year | EU | [44] |
| Use of recycled goods in industrial production | %/year | EU | [44] |
| Percentage of material solid waste reused or recycled | %/year | EU, CN, IT, SE | [44,46,47] |
| Percentage of household waste reused or recycled | %/year | EU, SE, IR | [44,50] |
| Amount of recycled goods sold | N°/month (or year) | EU | [44] |
| Separated waste (recovery and treatment of waste generated in city) | kg/year | SE, US, IT, CN, NL | [20,36,46,48,51,52] |
| Energy | |||
| Energy saved due to the use of recycled goods in industrial production | %/year or kWh/year | CL, RS, IR, EU, EL, IT, NL | [34,38,44,49,52] |
| Energy consumption | kWh inhabitant−1 year−1 | BR, AR, CN | [33,53] |
| Non-renewable energy use | %/year or kWh/year | UK | [43] |
| Renewable energy use | %/year or kWh/year | NL, IT, ES | [38,41,48,52,54] |
| Input (energy, materials) in production processes using renewable sources | - | SE, IR, IT | [50,51] |
| Input in production processes involving reused materials | - | IT | [55] |
| Input in production processes using recycled materials | - | IT | [55] |
| Output from production processes using renewable sources | - | IT | [55] |
| Output from production processes involving reused materials | - | IT | [55] |
| Output from production processes using recycled materials | - | IT | [55] |
| Volume (amount) of resource flow | - | UK | [56] |
| Amount of recycled resources | - | UK | [56] |
| Amount of reused resources | - | UK | [56] |
| Amount of resources saved | - | BE | [57] |
| Amount of waste heat from industry used for heating the city and for horticulture | kWh/year | NL | [58] |
| Amount of groundwater warmed in the earth and used to heat homes and offices | m3/year | NL | [58] |
| Number of homes receiving their energy (heat and electricity) from biogas (i.e., fermenting the manure of cows) | N°/total | NL | [58] |
| Water | |||
| Water use | Mm3 | UK, IT, SE | [37,47] |
| Dispersion from municipal water supply | - | IT, SE | [47,48] |
| Water consumption productivity | water consumption (m3)/revenues (V) | ES | [41] |
| Water consumption for habitation (for example, reduction due to harvesting rainwater on the roofs) | %/year or l/year | UK, IT, NL, BE, CN, US, SG | [43,52,57,59,60] |
| Safe water accessibility (water issues regarding treatment and distribution) | - | SE, US, UK, SG | [20,60] |
| Water efficiency (water issues regarding treatment and distribution) | - | SE, US | [20] |
| Saving water due to the use of recycled goods in industrial production | %/year mc/year | NL, EU, UK, SG, US, CN | [38,44,60,61] |
| Amount of phosphate recovered from sewage water | kg/day | NL | [58] |
| Percentage of water consumption for habitation (for example, reduction due to harvesting rainwater on the roofs) | %/year | UK, BE | [43,57] |
| Green | |||
| Utilized agricultural area—SAU | km2 | IT, SE, UK, | [47,51,62] |
| Number of farms | IT, UK | [51,62] | |
| Ecological and sustainable land-use regeneration | % (m2 of regenerated land/m2 of abandoned land) | IT | [63] |
| Mixed functionality | - | IT | [64] |
| Permeable surface area | m2 | IT | [64] |
| Green space area per capita | m2/person | IT, SE, CN, PT | [47,48,51,59,65,66] |
| Density of the urban fabric (sqm of built environment on the total) | - | IT | [51] |
| Percentage of green roofs | %/total city surface | SE, US, PT | [20,66] |
| Food | |||
| - Amount of food waste treated - Food waste treated in small and medium-sized enterprises (SMEs) | %/total food waste | SE, US, IR, FI, PL | [20,50,67] |
| Recycling surplus food/food waste | MT, UK | [68] | |
| Unsold products recovered every day for redistribution through the market itself or nearby community facilities | kg/day | EU | [44] |
| Percentage of local nutrient recovery | % | NL | [54] |
| Food waste | - | BE | [69] |
| Circular markets | - | IT, FR, IS | [39] |
| Buildings | |||
| Number of new buildings | N° | IT, SE | [47] |
| Buildings designed for complete disassembly | N° | NL | [54] |
| Reuse of building components at their end of life | % | NL | [54] |
| Design for flexibility by using modular systems | % | NL | [54] |
| Recycling rate of recyclable materials and constructions | % | NL | [54] |
| Percentage of retrofitting interventions on buildings | %/total building | SE, US, IT | [20,63] |
| Percentage of degraded buildings | %/total building | SE, US, IT | [20,51,64] |
| Percentage of reuse or recycling of recyclable demolition materials | % | IT, NL | [52,58] |
| Mobility | |||
| Public transport usage | % of inhabitants using public transport | SE, US | [20] |
| Electrical energy consumed in the transport sector | % of transport sector using electrical energy | SE, US, IT | [20,47] |
| Integration of new transport systems | - | IT | [70] |
| Proximity to public transport | - | IT | [64] |
| Pedestrian connections | - | IT | [64] |
| Textiles | |||
| Low-impact and non-toxic materials used in production processes | % | NL | [54] |
| Sustainable materials sourced from certified or eco-verified sources | % | NL | [54] |
| Indicators | Unit of Measure | Country | Reference |
|---|---|---|---|
| Environmental Dimension | |||
| Carbon footprint | MtCO2eq | UK | [37] |
| - CO2 emissions - CO2 consumption footprint - GHG emission per capita | - | BR, AR, NL, SE, IR, CN, IT, ES, | [33,38,50,53,71,72,73] |
| - Annual amount of greenhouse gas emissions, annual amount of CO2 emissions - Percentage reduction of greenhouse gas emissions | %/year or tons/year | IT, UK, EU, NL | [42,43,44,74] |
| Air quality | mg/Nm3 | IT, NL | [48,52,65] |
| Economic and Financial Dimension | |||
| Disposable income of households (improvement through reduced costs of products and services) | €/year | IT | [42] |
| Revenue from recycled goods sold | €/month €/year | EU | [44] |
| Potential value of material after recovery and re-use | € | UK | [56] |
| Circular economy innovation budget (in relation to platforms and businesses leading to innovation in areas of the circular economy) | %/year | SE, US | [20] |
| Investment costs | m2/€ | IT | [64] |
| Payback period (PBP) | year | IT | [64] |
| Green investment | - | NL | [38] |
| Attractiveness | - | IT | [64] |
| Synergies among industries | N° | SE, US | [20] |
| Social and Cultural Dimension | |||
| Livability (e.g., improvement through reduction of time lost from congestion, reduction of air pollution, improved waste, wastewater treatment) | - | IT, UK, SG, US | [42,60] |
| Walkability (length of pedestrian path) | km | IT | [65] |
| Percentage of CE patents | [CE patents/total patents] × 100 | ES | [41] |
| Percentage of CE investment | CE investment in tangible goods (V)/total investment in tangible goods | ES | [41] |
| Percentage of CE jobs | % | ES | [41] |
| - Job creation - Employment opportunities | N° of jobs | IT, EU, BE, UK | [42,44,57,64,75] |
| Number of events and dissemination activities about circular economy | N° of events/year | EU, IT | [44,64] |
| Participants in events about circular economy (including public bodies, companies, universities, research centers, professional associations, etc.) | N° of participants/year | EU, IT, UK | [44,75] |
| Cultural and Recreational Services | N° | IT | [64] |
| Socio-cultural Associations | N° | IT | [64] |
| Potential for cultural initiatives | - | IT | [64] |
| Integration of compact adaptive space design in urban strategies | Qualitative (yes/no) | IT, UK | [75] |
| Adoption of nature-based solutions | N° of practices in the city | IT, NL, UK | [52,75] |
| Attractiveness | - | IT | [64] |
| Indicators | Unit of Measure | Reference |
|---|---|---|
| Key Sectors | ||
| Waste | ||
| Amount or percentage of recycled material | Tons/year or %/year | Circular Rotterdam, Roadmap towards the circular economy in Slovenia (Maribor), Roadmap towards the circular economy in Slovenia (Ljubljana) |
| Amount or percentage of products reused | Tons/year or %/year | Circular Rotterdam, Roadmap towards the circular economy in Slovenia (Maribor) |
| Amount or percentage of products recovered | Tons/year, or %/year, or T/inhabitant/year, or % | Circular Prague, Roadmap towards the circular economy in Slovenia (Maribor), Roadmap towards the circular economy in Slovenia (Ljubljana), The Circular Economy in Umeå, Sweden |
| Waste diverted from landfill | Tons/inhabitant/year or % | The Circular Economy in Umeå, Sweden |
| Mixed waste composition | - | Carbon Neutral Tampere 2030 Roadmap |
| Percentage of incoming/outgoing flows | %/year | Circular Paris |
| Average amount of products going to landfill or incineration | Tons/year | Circular Prague |
| Percentage of MSW landfilled disposed of in EU-compliant sanitary landfills | % | Green City Action Plan of Tirana |
| Percentage of collected MSW composted | % | Green City Action Plan of Tirana |
| Waste reduction in production of goods–raw material efficiency | kg of waste per €1000 output | Circular Prague |
| Amount or percentage of waste separation | %/year or tons/year | Circular Rotterdam, Circular Prague |
| Increase in clean plastics and drink packaging streams from residual waste | %/year | Circular Rotterdam |
| - Percentage of recycling of solid waste generated in the city - Percentage of packaging waste recycled - Percentage of municipal waste recycled | %/year or % | Circular Rotterdam, Roadmap towards the circular economy in Slovenia (Maribor), Roadmap towards the circular economy in Slovenia (Ljubljana), Green City Action Plan of Tirana, Carbon Neutral Tampere 2030 Roadmap, Making City (Oulu) |
| Tonnage of waste diverted via repair, reuse, recovery, and upcycling activities (recycling centers, artisans, second-hand goods stores, fab labs, etc.) | tons/year | Circular Paris |
| Traceability of hazardous waste | - | Roadmap towards the circular economy in Slovenia (Maribor) |
| - Amount of waste produced in the city - Amount of waste generated per capita | Tons/year, or tons/per capita/year, or kg/year/capita | Circular Rotterdam, Green City Action Plan of Tirana |
| Amount of waste produced in the city and treated within the city itself | tons/year or %/year | Circular Prague |
| Amount of solid waste reused | Tons/year or %/year | Circular Prague; Roadmap towards the circular economy in Slovenia (Maribor), Roadmap towards the circular economy in Slovenia (Ljubljana), Circular Glasgow |
| - Amount or percentage of waste avoided - Amount of household waste reduced by preventing waste and encouraging reuse | Tons/year or %/year | Circular Prague; Maribor (Slovenia), Circular Glasgow, Circular Rotterdam, Circular Paris |
| Amount of biowaste processed in biogas facilities | % or tons/year | Circular Prague |
| Share of the population with weekly municipal solid waste (MSW) collection | % | Green City Action Plan of Tirana |
| Difference between quantity of waste and quantity of products consumed | Tons of waste/tons of products consumed | Circular Rotterdam |
| Energy | ||
| Energy consumption of city properties | total consumption and consumption per m2 | Carbon Neutral Tampere 2030 Roadmap, Making City (Oulu) |
| Energy savings per year | %/year, or kg/inhabitant/year, or % | Circular Glasgow, Circular Paris, The Circular Economy in Umeå, Sweden, Making City (Oulu) |
| Energy requirement per capita | GJ/person/year | Circular Rotterdam |
| GDP per energy requirement | €/GJ | Circular Rotterdam |
| Supply of renewable energy | % | Circular Rotterdam, Carbon Neutral Tampere 2030 Roadmap |
| Embedded energy use | tons/capita | Circular Rotterdam |
| Percentage of renewable or recycled energy use | %/year | Green City Action Plan of Tirana |
| Percentage of renewable electricity and heat supply for all municipal operations | % | Carbon Neutral Tampere 2030 Roadmap |
| Electricity consumption per capita | MWh per Capita/year | Making City (Oulu) |
| Primary energy consumption per capita | MWh per Capita/year | Making City (Oulu) |
| Primary energy sources (share) | % or MWh/cap | Making City (Oulu) |
| Percentage of buildings heated mainly by natural gas | % | Circular Prague |
| Percentage of buildings heated mainly by energy from incineration | % | Circular Prague |
| Electricity consumption in industry, per unit of industrial GDP | kWh/2010 USD | Green City Action Plan of Tirana |
| Emissions from centralized energy production | t CO2e | Carbon Neutral Tampere 2030 Roadmap |
| Emissions from oil heating | t CO2e | Carbon Neutral Tampere 2030 Roadmap |
| Water | ||
| Water consumption per capita | l/day/capita | Green City Action Plan of Tirana |
| Water consumption per unit of city GDP | l/day/USD | Green City Action Plan of Tirana |
| Water savings | Ml/inhabitant/year or % | The Circular Economy in Umeå, Sweden |
| -Biochemical oxygen demand (BOD) in rivers and lakes -Ammonium (NH4) concentration in rivers and lakes | μg/l | Green City Action Plan of Tirana |
| Percentage of water samples in a year that comply with national potable water quality standards | % | Green City Action Plan of Tirana |
| Water Exploitation Index | % | Green City Action Plan of Tirana |
| Unit of water consumed in power plants, per unit of primary energy generated | l/MW/h | Green City Action Plan of Tirana |
| Industrial water consumption as percent of total urban water consumption | % | Green City Action Plan of Tirana |
| Non-revenue water | % | Green City Action Plan of Tirana |
| Annual average of daily number of hours of continuous water supply per household | h/day | Green City Action Plan of Tirana |
| Percentage of residential and commercial wastewater that is treated according to applicable national standards | % | Green City Action Plan of Tirana |
| Percentage of buildings (non-industrial) equipped to reuse grey water | % | Green City Action Plan of Tirana |
| Percentage of wastewater from energy generation activities that is treated according to applicable national standards | % | Green City Action Plan of Tirana |
| Green | ||
| Proportion of green and recreational areas per capita | % | Roadmap towards the circular economy in Slovenia (Maribor) |
| Number of contaminated sites | CSs/1000 inch (or km2) | Green City Action Plan of Tirana |
| - Concentration of mercury in soil - Concentration of cadmium in soil - Concentration of zinc in soil - Concentration of mineral oil in soil (using infrared spectroscopy) | mg/kg | Green City Action Plan of Tirana |
| Open green space area ratio per 100,000 inhabitants | Hectares or m2 per resident | Green City Action Plan of Tirana, Carbon Neutral Tampere 2030 Roadmap |
| Share of green space areas within urban limits | % | Green City Action Plan of Tirana |
| - Abundance of bird species (all species) - Abundance of other species | Annual % of change | Green City Action Plan of Tirana |
| Ecosystem services provided by green spaces | - | Carbon Neutral Tampere 2030 Roadmap |
| Food | ||
| Percentage of sustainable food | % | Circular Rotterdam |
| Amount of food waste | % | Carbon Neutral Tampere 2030 Roadmap |
| Share of units offering vegetarian options | % | Carbon Neutral Tampere 2030 Roadmap |
| Buildings | ||
| Construction materials from secondary sources | % | Circular Prague |
| Tons of residual materials not utilized (construction sector) | Tons/total | Circular Prague |
| Percentage of reduction of emissions due to smart and clean building logistics (construction sector) | % | Circular Rotterdam |
| Amount of construction waste saved by implementing interventions related to circular economy | tons/year | Circular Rotterdam |
| - Electricity consumption in residential buildings - Electricity consumption in non-residential buildings | kWh/m2 or kWh per resident | Green City Action Plan of Tirana, Carbon Neutral Tampere 2030 Roadmap |
| - Heating and cooling consumption in buildings, fossil fuel use in residential buildings, fossil fuels - Heating and cooling consumption in residential buildings, fossil fuels - Heating and cooling consumption in non-residential buildings, fossil fuels | kWh/m2 | Green City Action Plan of Tirana |
| Share of energy class A in new residential buildings | % | Carbon Neutral Tampere 2030 Roadmap |
| Share of recovered materials in construction | % | Carbon Neutral Tampere 2030 Roadmap |
| Building connected to the DH network or renewable energy grid | % | Oulu |
| Low-emission new materials, verification with CO2 calculations | % | Carbon Neutral Tampere 2030 Roadmap |
| Mobility | ||
| Access to public transport | % | Making City (Oulu) |
| Energy consumption in transport sector | kWh/year or MWh/cap | Roadmap towards the circular economy in Slovenia (Maribor), Making City (Oulu) |
| Average age of car fleet (total and by type) | Year | Green City Action Plan of Tirana |
| Percentage of diesel cars in total vehicle fleet | % | Green City Action Plan of Tirana |
| Fuel standards for light passenger and commercial vehicles | € | Green City Action Plan of Tirana |
| Share of total passenger car fleet run by electric, hybrid fuel cell, liquefied petroleum gas (LPG) and compressed natural gas (CNG) energy | % | Green City Action Plan of Tirana, Carbon Neutral Tampere 2030 Roadmap |
| Percentage of low-emission buses in bus fleet | % | Green City Action Plan of Tirana |
| Transport modal share of commuting (cars, motorcycles, taxi, bus, metro, tram, bicycle, pedestrian) | Private transport % | Green City Action Plan of Tirana |
| Transport modal share of total trips | % | Green City Action Plan of Tirana |
| Motorization rate | Number of vehicles per capita | Green City Action Plan of Tirana |
| Average number of vehicles (cars and motorbikes) per household | Number of vehicles per household | Green City Action Plan of Tirana |
| - Kilometers of road dedicated exclusively to public transit per 100,000 population - Kilometers of bicycle path per 100,000 population | Km | Green City Action Plan of Tirana |
| Share of population having access to public transport within 15 min by foot | % | Green City Action Plan of Tirana |
| Frequency of bus service | Average number of passengers at station per hour in bus network | Green City Action Plan of Tirana |
| - Average travel speed on primary thoroughfares during peak hour - Travel speed of bus service on major thoroughfares (daily average) | km/h | Green City Action Plan of Tirana |
| Share of households within 300 m or 700 m of the main public services | % | Carbon Neutral Tampere 2030 Roadmap |
| - Modal share of public transport on an autumn weekday - Modal share of walking on an autumn weekday - Modal share of cycling on an autumn weekday - Modal share of travel by car on an autumn weekday | % | Carbon Neutral Tampere 2030 Roadmap |
| Amount of outsourced transport services using low emission fuel sources | line km | Carbon Neutral Tampere 2030 Roadmap |
| Car travel output | km/person | Carbon Neutral Tampere 2030 Roadmap |
| Modal split | % | Making City (Oulu) |
| Fuel mix in mobility | % | Making City (Oulu) |
| Public infrastructure promoting low-carbon mobility | km/100,000 people | Making City (Oulu) |
| Indicators | Unit of Measure | Reference |
|---|---|---|
| Environmental Dimension | ||
| - Amount of CO2 emissions - Amount of greenhouses gases emissions - Annual CO2 equivalent emissions per capita | kg of CO2/year or tons/year/capita | Circular Glasgow, Circular Prague, Green City Action Plan of Tirana, Making City (Oulu) |
| Annual CO2 emissions per unit of GDP | Tons/m. USD of GDP | Green City Action Plan of Tirana |
| - CO2 (or CO2 equivalent) emissions saved (also through industrial and urban symbiosis) - GHG emissions saved (for example, by an increase in circularity) | Tons/year, or T CO2 equivalent/year, or %/year, or tons CO2/capita, or % | Circular Glasgow, Circular Prague, The Circular Economy in Umeå, Sweden, Making City (Oulu) |
| Amount of NOx emissions | Tons/year | Circular Prague |
| - Amount of fine dust emissions - Annual average air quality particulate matter | Tons/year or PM2.5 µg/m3 | Circular Prague Circular Rotterdam |
| CO2 intensity | tons/capita | Circular Rotterdam |
| Embedded CO2 emissions | tons/capita | Circular Rotterdam |
| - Average annual concentration of PM2.5 - Average annual concentration of PM10 - Average daily concentration of SO2 - Average daily concentration of NOx | µg/m3 | Green City Action Plan of Tirana |
| Climate change adaptation | - | Circular Prague |
| - Primary resources used - Raw material avoided - Virgin resources used - Amount of primary resource use avoided | Tons/year, or %/year, or T/inhabitant/year, or % | Circular Rotterdam, Circular Prague, Circular Glasgow, The Circular Economy in Umeå, Sweden |
| Use of renewable resources | %/year | Circular Rotterdam |
| Primary raw material demand per capita | ton/capita | Circular Rotterdam |
| Raw material consumption | %/year | Circular Prague |
| Raw materials with high risk for impact on biodiversity | % | Circular Rotterdam |
| Percentage of dwellings damaged by the most intense flooding in the last 10 years | % | Green City Action Plan of Tirana |
| Awareness and preparedness for natural disasters | - | Green City Action Plan of Tirana |
| Annual number of storm water/sewerage overflows per 100 km of network length | Number of events per year | Green City Action Plan of Tirana |
| Economic and Financial Dimension | ||
| Gross added value | €/year | Circular Prague |
| Total investments | - | Making City (Oulu) |
| Return on investment | € | Circular Prague, Making City (Oulu) |
| Sustainability of investments from the municipality | - | Green City Action Plan of Tirana |
| Value creation from growth of circular economy models | €/year | Circular Paris |
| Volume of sales from growth of circular economy models | Amount/year or €/year | Circular Glasgow |
| Sales of locally produced goods | Amount/year or €/year | Circular Glasgow |
| Revenues through sales from growth of circular economy models | €/year | Circular Glasgow |
| Change in GDP through circular activities | % | Circular Rotterdam |
| Resources productivity | - | Roadmap towards the circular economy in Slovenia (Maribor) |
| Creating added value and economic growth | €/year | Roadmap towards the circular economy in Slovenia (Maribor), Roadmap towards the circular economy in Slovenia (Ljubljana) |
| Turnover of organizations working in the circular economy (including all sectors and types) | €/year | Circular Paris |
| Existence of funding programs and economic incentives for circular economy projects with specific objectives, prioritized sectors, and a monitoring framework for the outcomes | qualitative | The Circular Economy in Umeå, Sweden |
| Estimated economic damage from natural disasters (floods, droughts, earthquakes etc.) as a share of GDP | % | Green City Action Plan of Tirana |
| Social and Cultural Dimension | ||
| - Number of new jobs - Share of circular jobs (full- or part-time jobs related to one of the seven basic principles of circular employment) - Percentage of new jobs related to the circular economy - Number of new jobs from recycling of packaging - Number of new jobs from industrial ecology - Number of new green jobs | N°/year or %/year | Circular Rotterdam, Circular Paris, Circular Glasgow, Roadmap towards the circular economy in Slovenia (Maribor), Circular Prague, Roadmap towards the circular economy in Slovenia (Ljubljana) |
| - New business opportunities - New businesses that have integrated circularity into their development process | N°/year or %/year | Circular Rotterdam, Circular Paris, Circular Glasgow, Roadmap towards the circular economy in Slovenia (Maribor), Circular Prague, Roadmap towards the circular economy in Slovenia (Ljubljana) |
| Unemployment rate | %/year | Circular Rotterdam, Roadmap towards the circular economy in Slovenia (Maribor), Malmö (Sweden), Roadmap towards the circular economy in Slovenia (Ljubljana) |
| Change in circular jobs | % | Circular Rotterdam |
| Percentage of population that shows an increase in circular behavior | % | Circular Rotterdam |
| Social cohesion (objective participation) | - | Circular Rotterdam |
| Percentage of population that describes their own health as good or very good | %/year | Circular Rotterdam |
| Percentage of population dying from diseases of the respiratory system (diseases of the respiratory system can be an air quality indicator, but also of habits such as smoking) | %/year | Circular Rotterdam |
| Number of new circular initiatives | %/year | Circular Rotterdam |
| Percentage of residents participated in dialogue and/or design related to circular economy | N°/year | Malmö (Sweden), Making City (Oulu) |
| Development of cooperative economy | - | Roadmap towards the circular economy in Slovenia (Maribor) |
| Number of new forms of enterprises (SMEs, start-ups, incubators, etc.) | N°/year | Roadmap towards the circular economy in Slovenia (Maribor), Roadmap towards the circular economy in Slovenia (Ljubljana) |
| Level of citizens’ satisfaction with the administration services | qualitative | Roadmap towards the circular economy in Slovenia (Maribor) |
| Transformation of neighborhoods and local community | - | Roadmap towards the circular economy in Slovenia (Maribor) |
| Competitiveness of the economy | - | Roadmap towards the circular economy in Slovenia (Maribor) |
| Professional and managerial transformation of the city administration | - | Roadmap towards the circular economy in Slovenia (Maribor) |
| Attractiveness in terms of tourist visits | N° of visitors/year | Roadmap towards the circular economy in Slovenia (Maribor), Roadmap towards the circular economy in Slovenia (Ljubljana) |
| Annual number of visitors (with active engagement) to the reuse hubs | N°/year | Circular Prague |
| Number of public administrations/departments involved in the design of the circular economy imitative. | N° | The Circular Economy in Umeå, Sweden |
| - Number of actions identified to achieve the objectives. - Number of circular economy projects to implement the actions. | N° | The Circular Economy in Umeå, Sweden |
| - Number of staff employed for the circular economy initiative’s design within the city, region, or administration. - Number of stakeholders involved to co-create the circular economy imitative. | N° | The Circular Economy in Umeå, Sweden |
| - Number of projects financed by the city or regional government/total number of projects. - Number of projects financed by the private sectors/total number of projects. | N° | The Circular Economy in Umeå, Sweden |
| - Existence of a circular economy strategy with specific goals and priorities, actions, sectors, and a monitoring framework. - Co-ordination mechanisms across levels of governments to set and implement a circular economy strategy or initiative are well established and functioning. - Existence of overall policy coherence between circular economy initiatives and related policy areas (e.g., climate change, sustainable development, and air quality). - Regular capacity-building programs for activities associated with designing, setting, implementing, and monitoring the circular economy strategy. - Existence of a circular public procurement framework (e.g., waste diversion from procurement activities, raw materials avoided, and percentage of recycled content). - Existence of an information system on the circular economy. Data are publicly available and citizens and business informed of the opportunities related to circular business models and behaviors. - Existence of a monitoring and evaluation framework that includes environmental, economic and social aspects. | qualitative | The Circular Economy in Umeå, Sweden |
| Residents’ satisfaction with the attractiveness and functionality of the urban environment in the continuous resident survey | - | Carbon Neutral Tampere 2030 Roadmap |
| Share of recreational areas in the total detailed planning area of the inner city | % | Carbon Neutral Tampere 2030 Roadmap |
| Indicators and [Unit of Measure] for Each Key Sectors | ||||||||
|---|---|---|---|---|---|---|---|---|
| Thematics | Waste | Energy | Water | Built Environment | Mobility | |||
| Waste | - Waste generation per capita [tons/Ab *year] | - Saving energy due to the use of recycled goods [kWh/year] | - Water consumption per capita [l/year/capita] | - Percentage of reuse or recycling of recyclable demolition materials [%] | - Amount of waste produced in the city and treated within the city itself [tons/year or %/year] | |||
| - Recycling percentage (recycling, repair, reuse, recovery, and upcycling activities) [%] | - Renewable energy use [%/year or kWh/year] | |||||||
| Energy | - Total energy consumption [kWh inhabitant−1 year−1] | - Electricity consumption in residential buildings [kWh/m2 or kWh per resident] | - Share of total passenger car fleet run by electric, hybrid fuel cell, liquefied petroleum gas (LPG) and compressed natural gas (CNG) energy [%] | |||||
| - Energy requirement per capita [GJ/person/year] | ||||||||
| - Electricity consumption in non-residential buildings [kWh/m2 or kWh per resident] | ||||||||
| - Percentage of building heating mainly through renewable sources [%/total buildings] | ||||||||
| Water | - Annual average of daily number of hours of continuous water supply per household [h/day] | - Dispersion from municipal water supply [%] | ||||||
| Built Environment | - Percentage of degraded buildings [%/total buildings] | - Public space density: Pedestrian areas, squares, and green spaces [% of municipal area/neighborhood] | ||||||
| - Percentage of retrofitting interventions on buildings [%/total buildings] | - Kilometers of road dedicated exclusively to public transit per 100,000 population [km] | |||||||
| Mobility | - Public transport usage [% of inhabitants using public transport] | |||||||
| Environmental Dimension | Economic and Financial Dimension | Social and Cultural Dimension |
|---|---|---|
| Indicators | Indicators | Indicators |
| - Annual amount of greenhouse gas emissions [%/year or tons/year] | - Green investment | - Job creation [N°] |
| - Annual amount of CO2 emissions [%/year or tons/year] | - Investment costs [m2/€] | - Employment opportunities [N°] |
| - Percentage of reduction of greenhouse gas emissions [%/year or tons/year] | - Payback period (PBP) [year] | - Number of events and dissemination activities about circular economy [N° of events/year] |
| - Return on investment [€] | - Participants in events about circular economy (including public bodies, companies, universities, research centers, professional associations, etc.) [N° of participants/year] | |
| - Nature-based solutions adoption [N°] | ||
| Certifications | ||
| - Density of certifications produced in the territory [N°/Ab] | ||
References
- Kalmykova, Y.; Sadagopan, M.; Rpsado, L. Circular economy—From review of theories and practices to development of implementation tools. Res. Conserv. Recycl. 2018, 135, 190–201. [Google Scholar] [CrossRef]
- Bourguignon, D. Closing the Loop: NEW Circular Economy Package; European Parliamentary Research Sevice: Brussels, Belgium, 2016. [Google Scholar]
- Ellen MacArthur Foundation. Growth Within: A Circular Economy Vision for a Competitive Europe; Ellen MacArthur Foundation: Cowes, UK, 2015. [Google Scholar]
- Ellen MacArthur Foundation. Towards a Circular Economy: Business Rationale for an Accelerated Transition; Ellen MacArthur Foundation: Cowes, UK, 2015. [Google Scholar]
- What Is a Circular City, A Circular City Definition. Circular City Declaration. 2020. Available online: https://circularcitiesdeclaration.eu/ (accessed on 20 March 2022).
- Fusco Girard, L.; De Rosa, F.; Nocca, F. Verso il Piano Strategico di una Città Storica: Viterbo; BDC Bollettino del Centro Calza Bini: Napoli, Italy, 2014; pp. 11–33. [Google Scholar]
- Lichfield, N. Community Impact Evaluation: Principles and Practice; Routledge: London, UK, 2005. [Google Scholar]
- Coccossis, H.; Nijkamp, P. Sustainable Tourism Development; Avebury Press: Aldershot, Avebury, UK, 1995. [Google Scholar]
- Fusco Girard, L.; Nijkamp, P. Cultural Tourism and Sustainable Local Development; Routledge: London, UK, 2016. [Google Scholar]
- Porter, M.E.; Kramer, M.R. Creating Shared Value. Harv. Bus. Rev. 2011, 89, 62–77. [Google Scholar]
- Ezzat, A.M. Sustainable Development of Seaport Cities through Circular Economy: A Comparative Study with Implications to Suez Canal Corridor Project. Eur. J. Sustain. Dev. 2016, 5, 509–522. [Google Scholar] [CrossRef]
- Williams, J. Circular Cities: What Are the Benefits of Circular Development? Sustainability 2021, 13, 5725. [Google Scholar] [CrossRef]
- Brescia, R.; Marshall, J.T. How Cities Will Save the World; Routledge: London, UK, 2018. [Google Scholar]
- Ellen MacArthur Foundation. Circular Economy in Cities Project Guide; Ellen MacArthur Foundation: Cowes, UK, 2019. [Google Scholar]
- Ministero dell’Ambiente e della Tutela del Territorio e del Mare; Ministero dello Sviluppo Economico; ENEA. Economia Circolare ed uso Efficiente Delle Risorse—Indicatori per la Misurazione Dell’economia Circolare; Ministero dell’Ambiente e della Tutela del Territorio e del Mare, Ministero dello Sviluppo Economico: Rome, Italy; ENEA: Poznań, Poland, 2018. [Google Scholar]
- European Commission, Directorate-General for Communication 2020. Circular Economy Action Plan: For a Cleaner and More Competitive Europe; Publications Office of the European Union: Luxembourg, 2020. [Google Scholar]
- European Academies’ Science Advisory (EASAC). Indicator for Circular Economy; EASAC: Halle, Germany, 2016. [Google Scholar]
- Saidani, M.; Yannou, B.; Leroy, Y.; Cluzel, F.; Kendall, A. A taxonomy of circular economy indicators. J. Clean. Prod. 2019, 207, 542–559. [Google Scholar] [CrossRef]
- Douma, A.; de Winter, J.; Ramkumar, S.; Raspail, N.; Dufourmont, J. Circular Jobs; Glodshmeding Foundation Amsterdam: Amsterdam, The Netherlands, 2015. [Google Scholar]
- Cavaleiro de Ferreira, A.; Fuso-Nerini, F. A Framework for Implementing and Tracking Circular Economy in Cities: The Case of Porto. Sustainability 2019, 11, 1813. [Google Scholar] [CrossRef]
- Fusco Girard, L.; Nocca, F. Moving towards the circular Economy/city model: Which tools for operationalizing this model? Sustainability 2019, 11, 6253. [Google Scholar] [CrossRef]
- Circle Economy. Circular Glasgow a Vision and Action Plan for the City of Glasgow; Circle Economy: Amsterdam, The Netherlands, 2016. [Google Scholar]
- Circular Change. Roadmap towards the Circular Economy in Slovenia; Circular Change: Ljubljana, Slovenia, 2018. [Google Scholar]
- Making City. H2020 Programme; Making City: Oulu, Finland, 2018. [Google Scholar]
- Mairie de Paris. White Paper on the Circular Economy of Greater Paris; Circular Economy Club Paris: Paris, France, 2017. [Google Scholar]
- Circle Economy. Circular Prague; Circle Economy: Amsterdam, The Netherland, 2019. [Google Scholar]
- Gemeente Rotterdam. Roadmap Circular Economy Rotterdam; Rotterdam Circulair: Rotterdam, The Netherlands, 2016. [Google Scholar]
- Tampere City Board. Carbon Neutral Tampere 2030; Tampere City Board: Tampere, Finland, 2020. [Google Scholar]
- Bashkia Tiran. Green City Action Plan of Tirana; Bashkia Tirane: Tirana, Albania, 2018. [Google Scholar]
- OECD Urban Studies. The Circular Economy in Umeå, Sweden; OECD Urban Studies: Paris, France, 2020. [Google Scholar]
- Richiedei, A.; Pezzagno, M. Territorializing and Monitoring of Sustainable Development Goals in Italy: An Overview. Sustainability 2022, 14, 3056. [Google Scholar] [CrossRef]
- Sistema Nazionale per la Protezione dell’Ambiente. Città in Transizione: I Capoluoghi Italiani Verso la Sostenibilità Ambientale; Sistema Nazionale per la Protezione dell’Ambiente: Rome, Italy, 2022. [Google Scholar]
- Deus, R.M.; Mele, F.D.; Bezerra, B.S.; Battistelle, R.A.G. A municipal solid waste indicator for environmental impact: Assessment and identification of best management practices. J. Clean. Prod. 2020, 242, 118433. [Google Scholar] [CrossRef]
- Behzad, M.; Hashemkhani Zolfani, S.; Pamucar, D.; Behzad, M. A comparative assessment of solid waste management performance in the Nordic countries based on BWM-EDAS. J. Clean. Prod. 2020, 266, 122008. [Google Scholar] [CrossRef]
- Stankovic, J.J.; Jankovic-Milic, V.; Marjanovic, I.; Janjic, J. An integrated approach of PCA and PROMETHEE in spatial assessment of circular economy indicators. Waste Manag. 2021, 128, 154–166. [Google Scholar] [CrossRef]
- Lombardi, G.V.; Gastaldi, M.; Rapposelli, A.; Romano, G. Assessing efficiency of urban waste services and the role of tariff in a circular economy perspective: An empirical application for Italian municipalities. J. Clean. Prod. 2021, 323, 129097. [Google Scholar] [CrossRef]
- Salemdeeb, R.; Saint, R.; Pomponi, F.; Pratt, K.; Lenaghan, M. Beyond recycling: An LCA-based decision-support tool to accelerate Scotland’s transition to a circular economy. Res. Conserv. Recycl. Adv. 2022, 13, 200069. [Google Scholar] [CrossRef]
- Nurdiana, J.; Franco-Garcia, M.L.; Heldeweg, M.A. How Shall We Start? The Importance of General Indices for circular cities in Indonesia. Sustainability 2021, 13, 11168. [Google Scholar] [CrossRef]
- Taruffi, A.; Sciullo, A.; Diemer, A.; Nedelciu, C.E. Integrating Circular Bioeconomy and Urban Dynamics to Define an Innovative Management of Bio-Waste: The Study Case of Turin. Sustainability 2021, 13, 6221. [Google Scholar] [CrossRef]
- Meng, M.; Wen, Z. Approaches and Policies to Promote Zero-Waste City Approaches and Policies to Promote Zero-Waste City. Sustainability 2021, 13, 13537. [Google Scholar] [CrossRef]
- Rincon-Moreno, J.; Ormazabal, M.; Alvarez, M.J.; Jaca, C. Advancing circular economy performance indicators and their application in Spanish companies. J. Clean. Prod. 2021, 279, 123605. [Google Scholar] [CrossRef]
- Croci, E. Circular Cities: Setting the Agenda. In Proceedings of the International Conference Circular Cities: Promoting Sustainable Innovation in Urban Systems and Service Within the Energy-Food-Water-Climate Nexus, Milan, Italy, 12 March 2018. [Google Scholar]
- Williams, J. Circular Cities: Challenges to Implementing Looping Actions. Sustainability 2019, 11, 423. [Google Scholar] [CrossRef]
- Eurocities. Full Circle. Cities and the Circular Economy; Eurocities: Brussels, Belgium, 2017. [Google Scholar]
- Hoang, N.H.; Fogarassy, C. Sustainability Evaluation of Municipal Solid Waste Management System for Hanoi (Vietnam)—Why to Choose the ‘Waste-to-Energy’ Concept. Sustainability 2020, 12, 1085. [Google Scholar] [CrossRef]
- Wang, D.; He, J.; Ting Tang, Y. Assessing the transition of municipal solid waste management by combining material flow analysis and life cycle assessment. Res. Conserv. Recycl. 2022, 177, 105966. [Google Scholar] [CrossRef]
- Maranghi, S.; Parisi, M.L.; Facchini, A.; Rubino, A.; Kordas, O.; Basosi, R. Integrating urban metabolism and life cycle assessment to analyse urban sustainability. Ecol. Indic. 2020, 112, 106074. [Google Scholar] [CrossRef]
- Perchinunno, P.; Mongelli, L.; Rotondo, F. A multidimensional approach for the identification of environmental and health wellness territories. Ecol. Indic. 2020, 110, 105911. [Google Scholar] [CrossRef]
- Banias, G.; Batsioula, M.; Achillas, C.; Patsios, S.I.; Kontogiannopoulos, K.N.; Bochtis, D.; Moussiopoulos, N. A Life Cycle Analysis Approach for the Evaluation of Municipal Solid Waste Management Practices: The Case Study of the Region of Central Macedonia, Greece. Sustainability 2020, 12, 8221. [Google Scholar] [CrossRef]
- Heshmati, A.; Rashidghalam, M. Assessment of the urban circular economy in Sweden. J. Clean. Prod. 2021, 310, 127475. [Google Scholar] [CrossRef]
- Fabbricatti, K.; Biancamano, P.F. Circular Economy and Resilience Thinking for Historic Urban Landscape Regeneration: The Case of Torre Annunziata, Naples. Sustainability 2019, 11, 3391. [Google Scholar] [CrossRef]
- Gravagnuolo, A.; Girard, L.F.; Kourtit, K.; Nijkamp, P. Adaptive re-use of urban cultural resources: Contours of circular city planning. City Culture Soc. 2021, 26, 100416. [Google Scholar] [CrossRef]
- Liu, C.; Sun, W.; Li, P. Characteristics of spatiotemporal variations in coupling coordination between integrated carbon emission and sequestration index: A case study of the Yangtze River Delta, China. Ecol. Indic. 2022, 135, 108520. [Google Scholar] [CrossRef]
- Metabolic, Circular Cities: Hello Jobs, Goodbye Waste. 2018. Available online: https://envisioncharlotte.com/wp-content/uploads/2018/03/20180201_S_Charlotte_EcoNetworkSeries_EN_Eva.pdf (accessed on 23 March 2022).
- Enel (Ente nazionale per l’energia elettrica), Cities of Tomorrow. Circular Cities. 2018. Available online: https://www.enelamericas.com/content/dam/enel-americas/about_us/econimia-circular/en/cities-of-tomorrow-en-2018.pdf (accessed on 20 March 2022).
- Owen, A.; Liddell, J. Implementing a Circular Economy at City Scale—A Challenge for Data and Decision Making, not Technology. In Proceedings of the International Sustainable Ecological Engineering Design for Society (SEEDS) Conference, Leeds Beckett University, Leeds, UK, 14–15 September 2016. [Google Scholar]
- Marin, J.; De Meulder, B. Interpreting Circularity. Circular City Representations Concealing Transition Drivers. Sustainability 2018, 10, 1310. [Google Scholar] [CrossRef]
- Agenda Stad. The Perspective of the Circular City; Agenda Stad: Amsterdam, The Netherlands, 2019. [Google Scholar]
- Yang, Z. Sustainability of Urban Development with Population Decline in Different Policy Scenarios: A Case Study of Northeast China. Sustainability 2019, 11, 6442. [Google Scholar] [CrossRef]
- Arora, M.; Yeow, L.W.; Cheah, L.; Derrible, S. Assessing water circularity in cities: Methodological framework with a case study. Res. Conserv. Recycl. 2022, 178, 106042. [Google Scholar] [CrossRef]
- Lu, C.; Pam, X.; Mao, J.; Pang, J.; Xue, B. Modeling of Waste Flow in Industrial Symbiosis System at City-Region Level: A Case Study of Jinchang, China. Sustainability 2021, 13, 466. [Google Scholar] [CrossRef]
- Williams, J. The Circular Regeneration of a Seaport. Sustainability 2019, 11, 3424. [Google Scholar] [CrossRef]
- Bosone, M.; Ciampa, F. Human-Centred Indicators (HCI) to Regenerate Vulnerable Cultural Heritage and Landscape towards a Circular City: From the Bronx (NY) to Ercolano (IT). Sustainability 2021, 13, 5505. [Google Scholar] [CrossRef]
- Della Spina, L. Multidimensional Assessment for “Culture-Led” and “Community-Driven” Urban Regeneration as Driver for Trigger Economic Vitality in Urban Historic Centers. Sustainability 2019, 11, 7237. [Google Scholar] [CrossRef]
- Cerreta, M.; Giovene di Girasole, E.; Poli, G.; Regalbuto, S. Operationalizing the Circular City Model for Naples’ City-Port: A Hybrid Development Strategy. Sustainability 2020, 12, s2927. [Google Scholar] [CrossRef]
- Rodrigues, M.; Antunes, C. Best Management Practices for the Transition to a Water-Sensitive City in the South of Portugal. Sustainability 2021, 13, 2983. [Google Scholar] [CrossRef]
- Erälinna, L.; Szymoniuk, B. Managing a Circular Food System in Sustainable Urban Farming. Experimental Research at the Turku University Campus (Finland). Sustainability 2021, 13, 6231. [Google Scholar] [CrossRef]
- Camilleri, M.A. Sustainable Production and Consumption of Food. Mise-en-Place Circular Economy Policies and Waste Management Practices in Tourism Cities. Sustainability 2021, 13, 9986. [Google Scholar] [CrossRef]
- Zeller, V.; Lavigne, C.; D’Ans, P.; Towa, E.; Achten, W.M.J. Assessing the environmental performance for more local and more circular biowaste management options at city-region level. Sci. Total Environ. 2020, 25, 140690. [Google Scholar] [CrossRef]
- Dell’Ovo, M.; Dell’Anna, F.; Simonelli, R.; Sdino, L. Enhancing the Cultural Heritage through Adaptive Reuse. A Multicriteria Approach to Evaluate the Castello Visconteo in Cusago (Italy). Sustainability 2021, 13, 4440. [Google Scholar] [CrossRef]
- Zhu, H.; Pan, K.; Liu, Y.; Chang, Z.; Jiang, P.; Li, Y. Analyzing Temporal and Spatial Characteristics and Determinant Factors of Energy-Related CO2 Determinant Factors of Energy-Related CO2 High-Resolution Gridded Data. Sustainability 2019, 11, 4766. [Google Scholar] [CrossRef] [Green Version]
- Longato, D.; Lucertini, G.; Dalla Fontana, M.; Musco, F. Including Urban Metabolism Principles in Decision-Making: A Methodology for Planning Waste and Resource Management. Sustainability 2019, 11, 2101. [Google Scholar] [CrossRef]
- Medina-Tapia, M.; Robusté, F. Implementation of Connected and Autonomous Vehicles in Cities Could Have Neutral Effects on the Total Travel Time Costs: Modeling and Analysis for a Circular City. Sustainability 2019, 11, 482. [Google Scholar] [CrossRef]
- Prendeville, S.; Bocken, N. Circular Cities: Mapping Six Cities in Transition. Environ. Innov. Soc. Trans. 2018, 26, 171–194. [Google Scholar] [CrossRef]
- Foglia, A.; Bruni, C.; Cipolletta, G.; Eusebi, A.; Frison, N.; Katsou, E.; Akyol, C.; Fatone, F. Assessing socio-economic value of innovative materials recovery solutions validated in existing wastewater treatment plants. J. Clean. Prod. 2021, 322, 129048. [Google Scholar] [CrossRef]


| City (Country) | Document Name |
|---|---|
| Glasgow (United Kingdom) | Circular Glasgow [22] |
| Ljubljana (Slovenia) | Roadmap towards the circular economy in Slovenia [23] |
| Maribor (Slovenia) | Roadmap towards the circular economy in Slovenia [23] |
| Oulu (Finland) | Making City [24] |
| Paris (France) | Circular Paris [25] |
| Prague (Czech Republic) | Circular Prague [26] |
| Rotterdam (Netherlands) | Circular Rotterdam [27] |
| Tampere (Finland) | Carbon Neutral Tampere 2030 Roadmap [28] |
| Tirana (Albania) | Green City Action Plan of Tirana [29] |
| Umeå (Sweden) | The Circular Economy in Umeå, Sweden [30] |
Publisher’s Note: MDPI stays neutral with regard to jurisdictional claims in published maps and institutional affiliations. |
© 2022 by the authors. Licensee MDPI, Basel, Switzerland. This article is an open access article distributed under the terms and conditions of the Creative Commons Attribution (CC BY) license (https://creativecommons.org/licenses/by/4.0/).
Share and Cite
Paoli, F.; Pirlone, F.; Spadaro, I. Indicators for the Circular City: A Review and a Proposal. Sustainability 2022, 14, 11848. https://doi.org/10.3390/su141911848
Paoli F, Pirlone F, Spadaro I. Indicators for the Circular City: A Review and a Proposal. Sustainability. 2022; 14(19):11848. https://doi.org/10.3390/su141911848
Chicago/Turabian StylePaoli, Federica, Francesca Pirlone, and Ilenia Spadaro. 2022. "Indicators for the Circular City: A Review and a Proposal" Sustainability 14, no. 19: 11848. https://doi.org/10.3390/su141911848
APA StylePaoli, F., Pirlone, F., & Spadaro, I. (2022). Indicators for the Circular City: A Review and a Proposal. Sustainability, 14(19), 11848. https://doi.org/10.3390/su141911848