
Low-Carbon Development from the Energy–Water Nexus Perspective in China’s Resource-Based City

Abstract
:1. Introduction
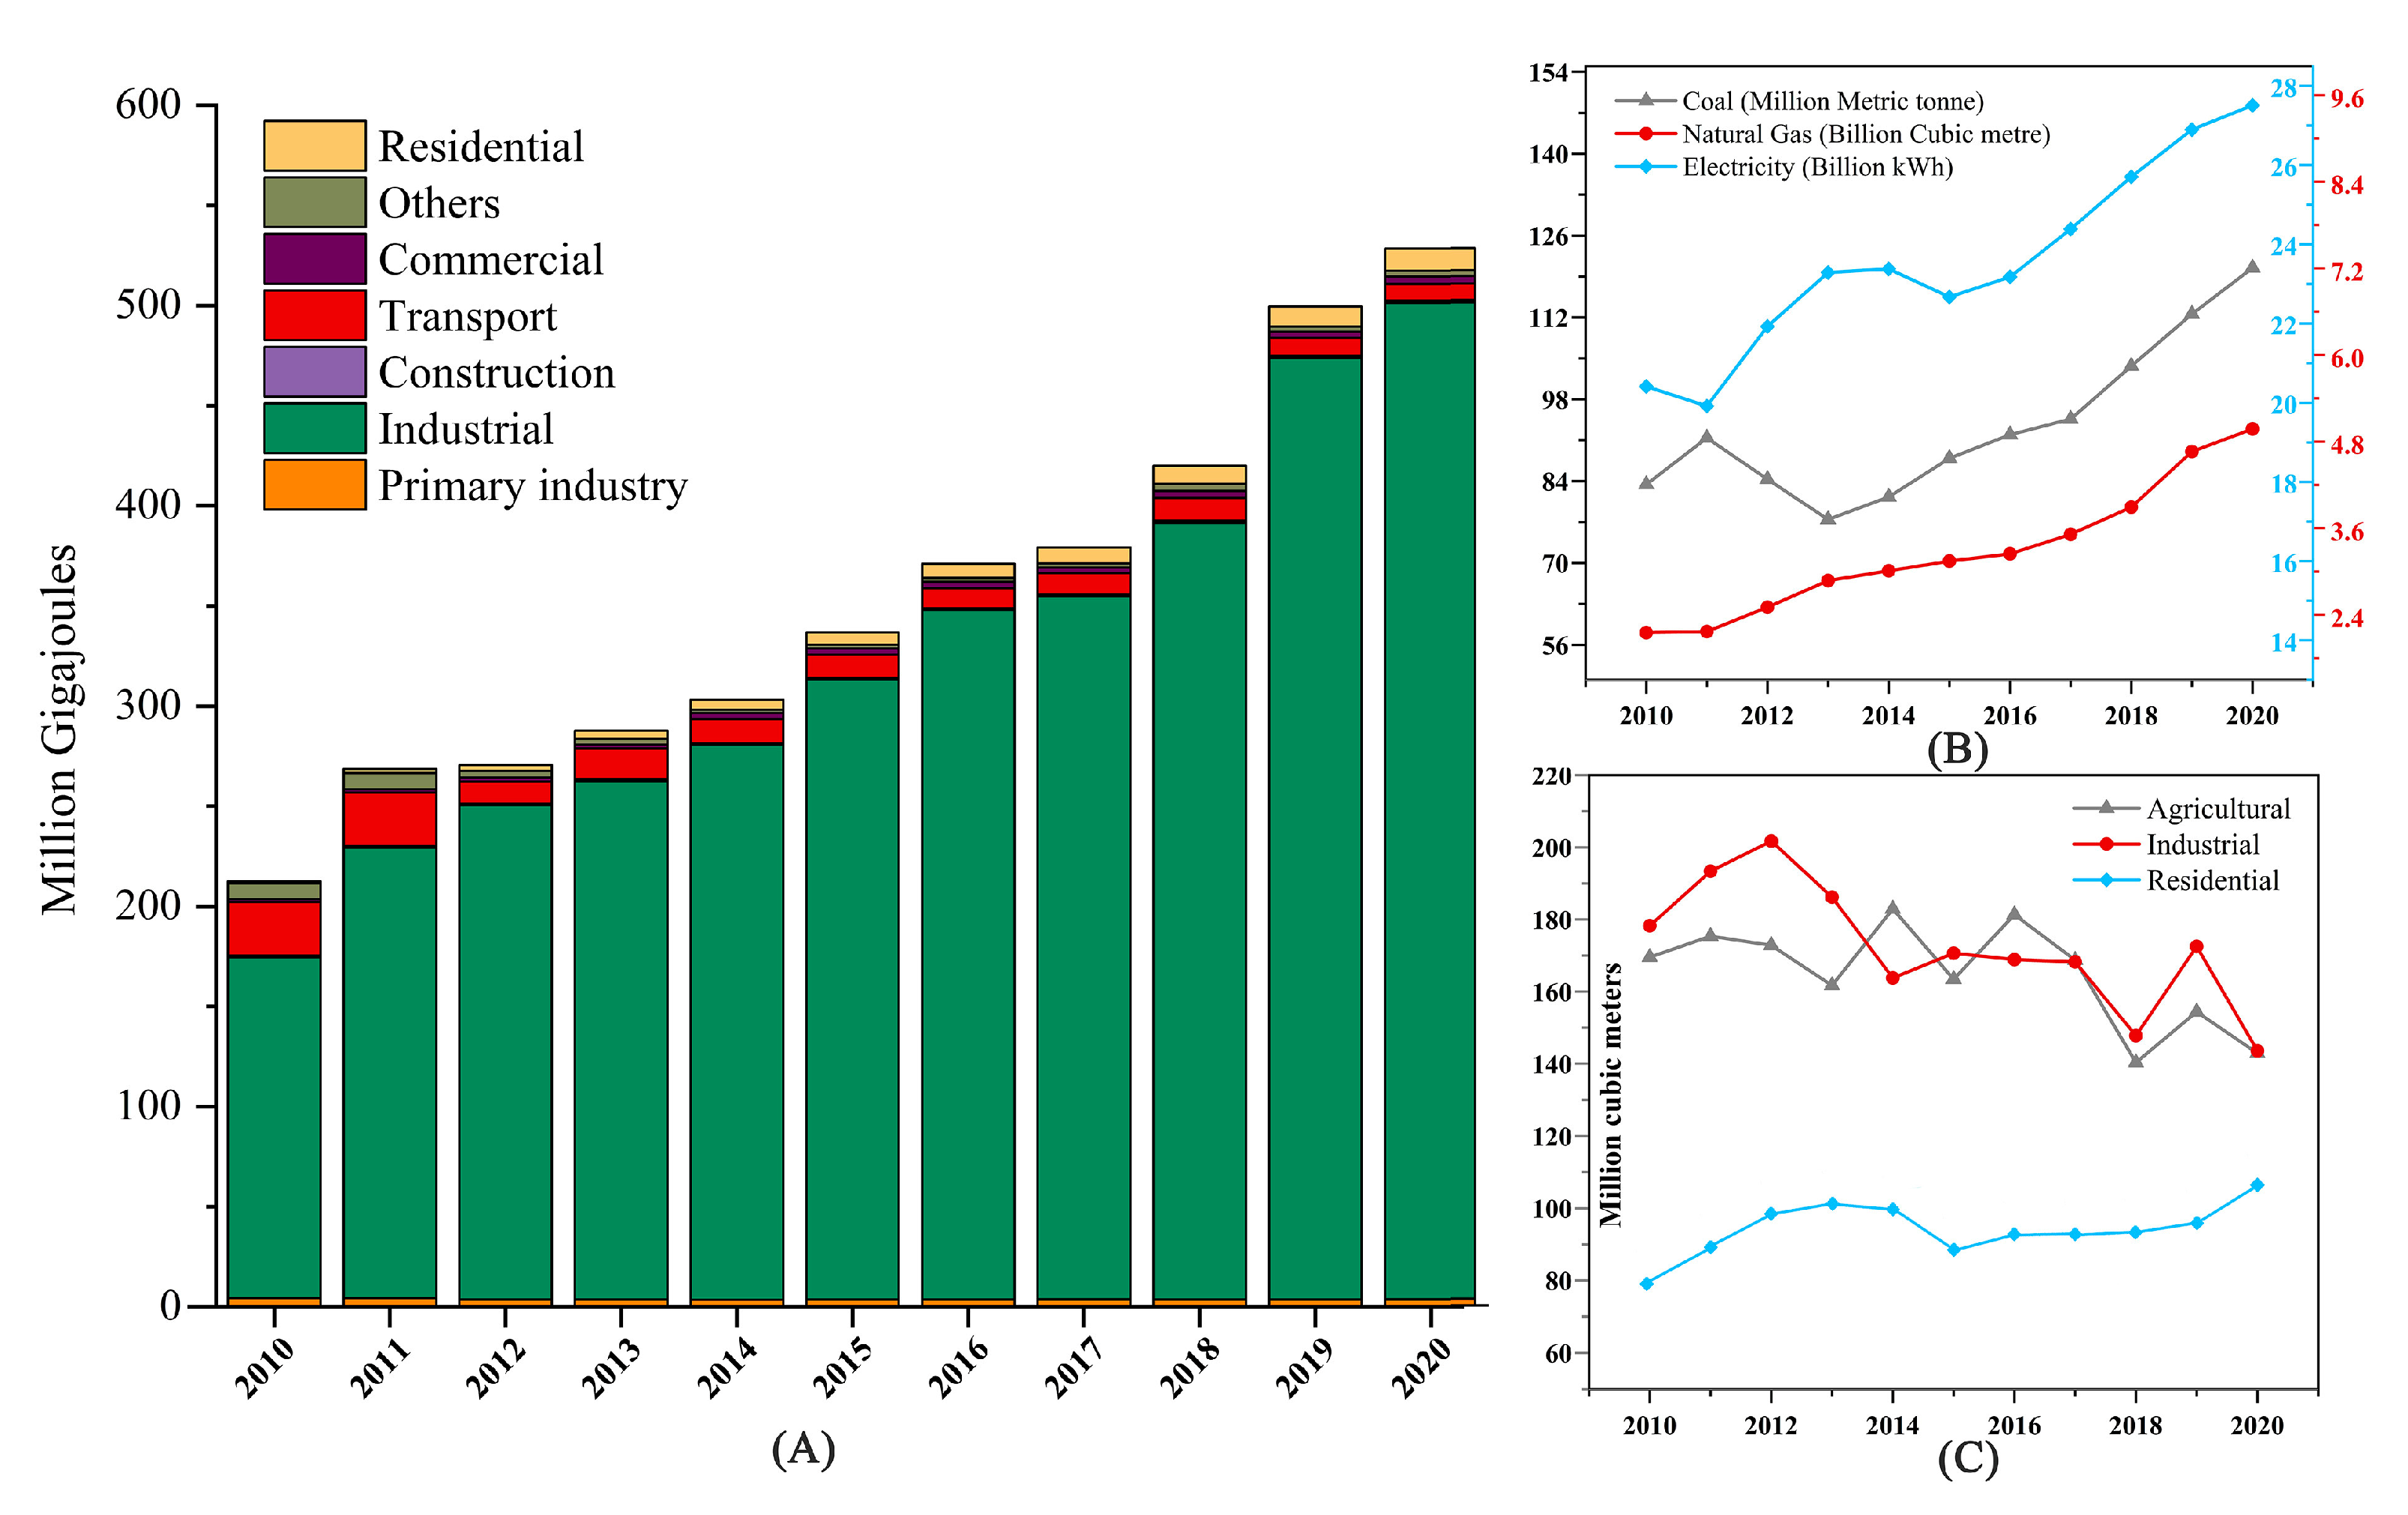
2. Data Source
3. Overview of the Study Area
4. Methods and Data Source
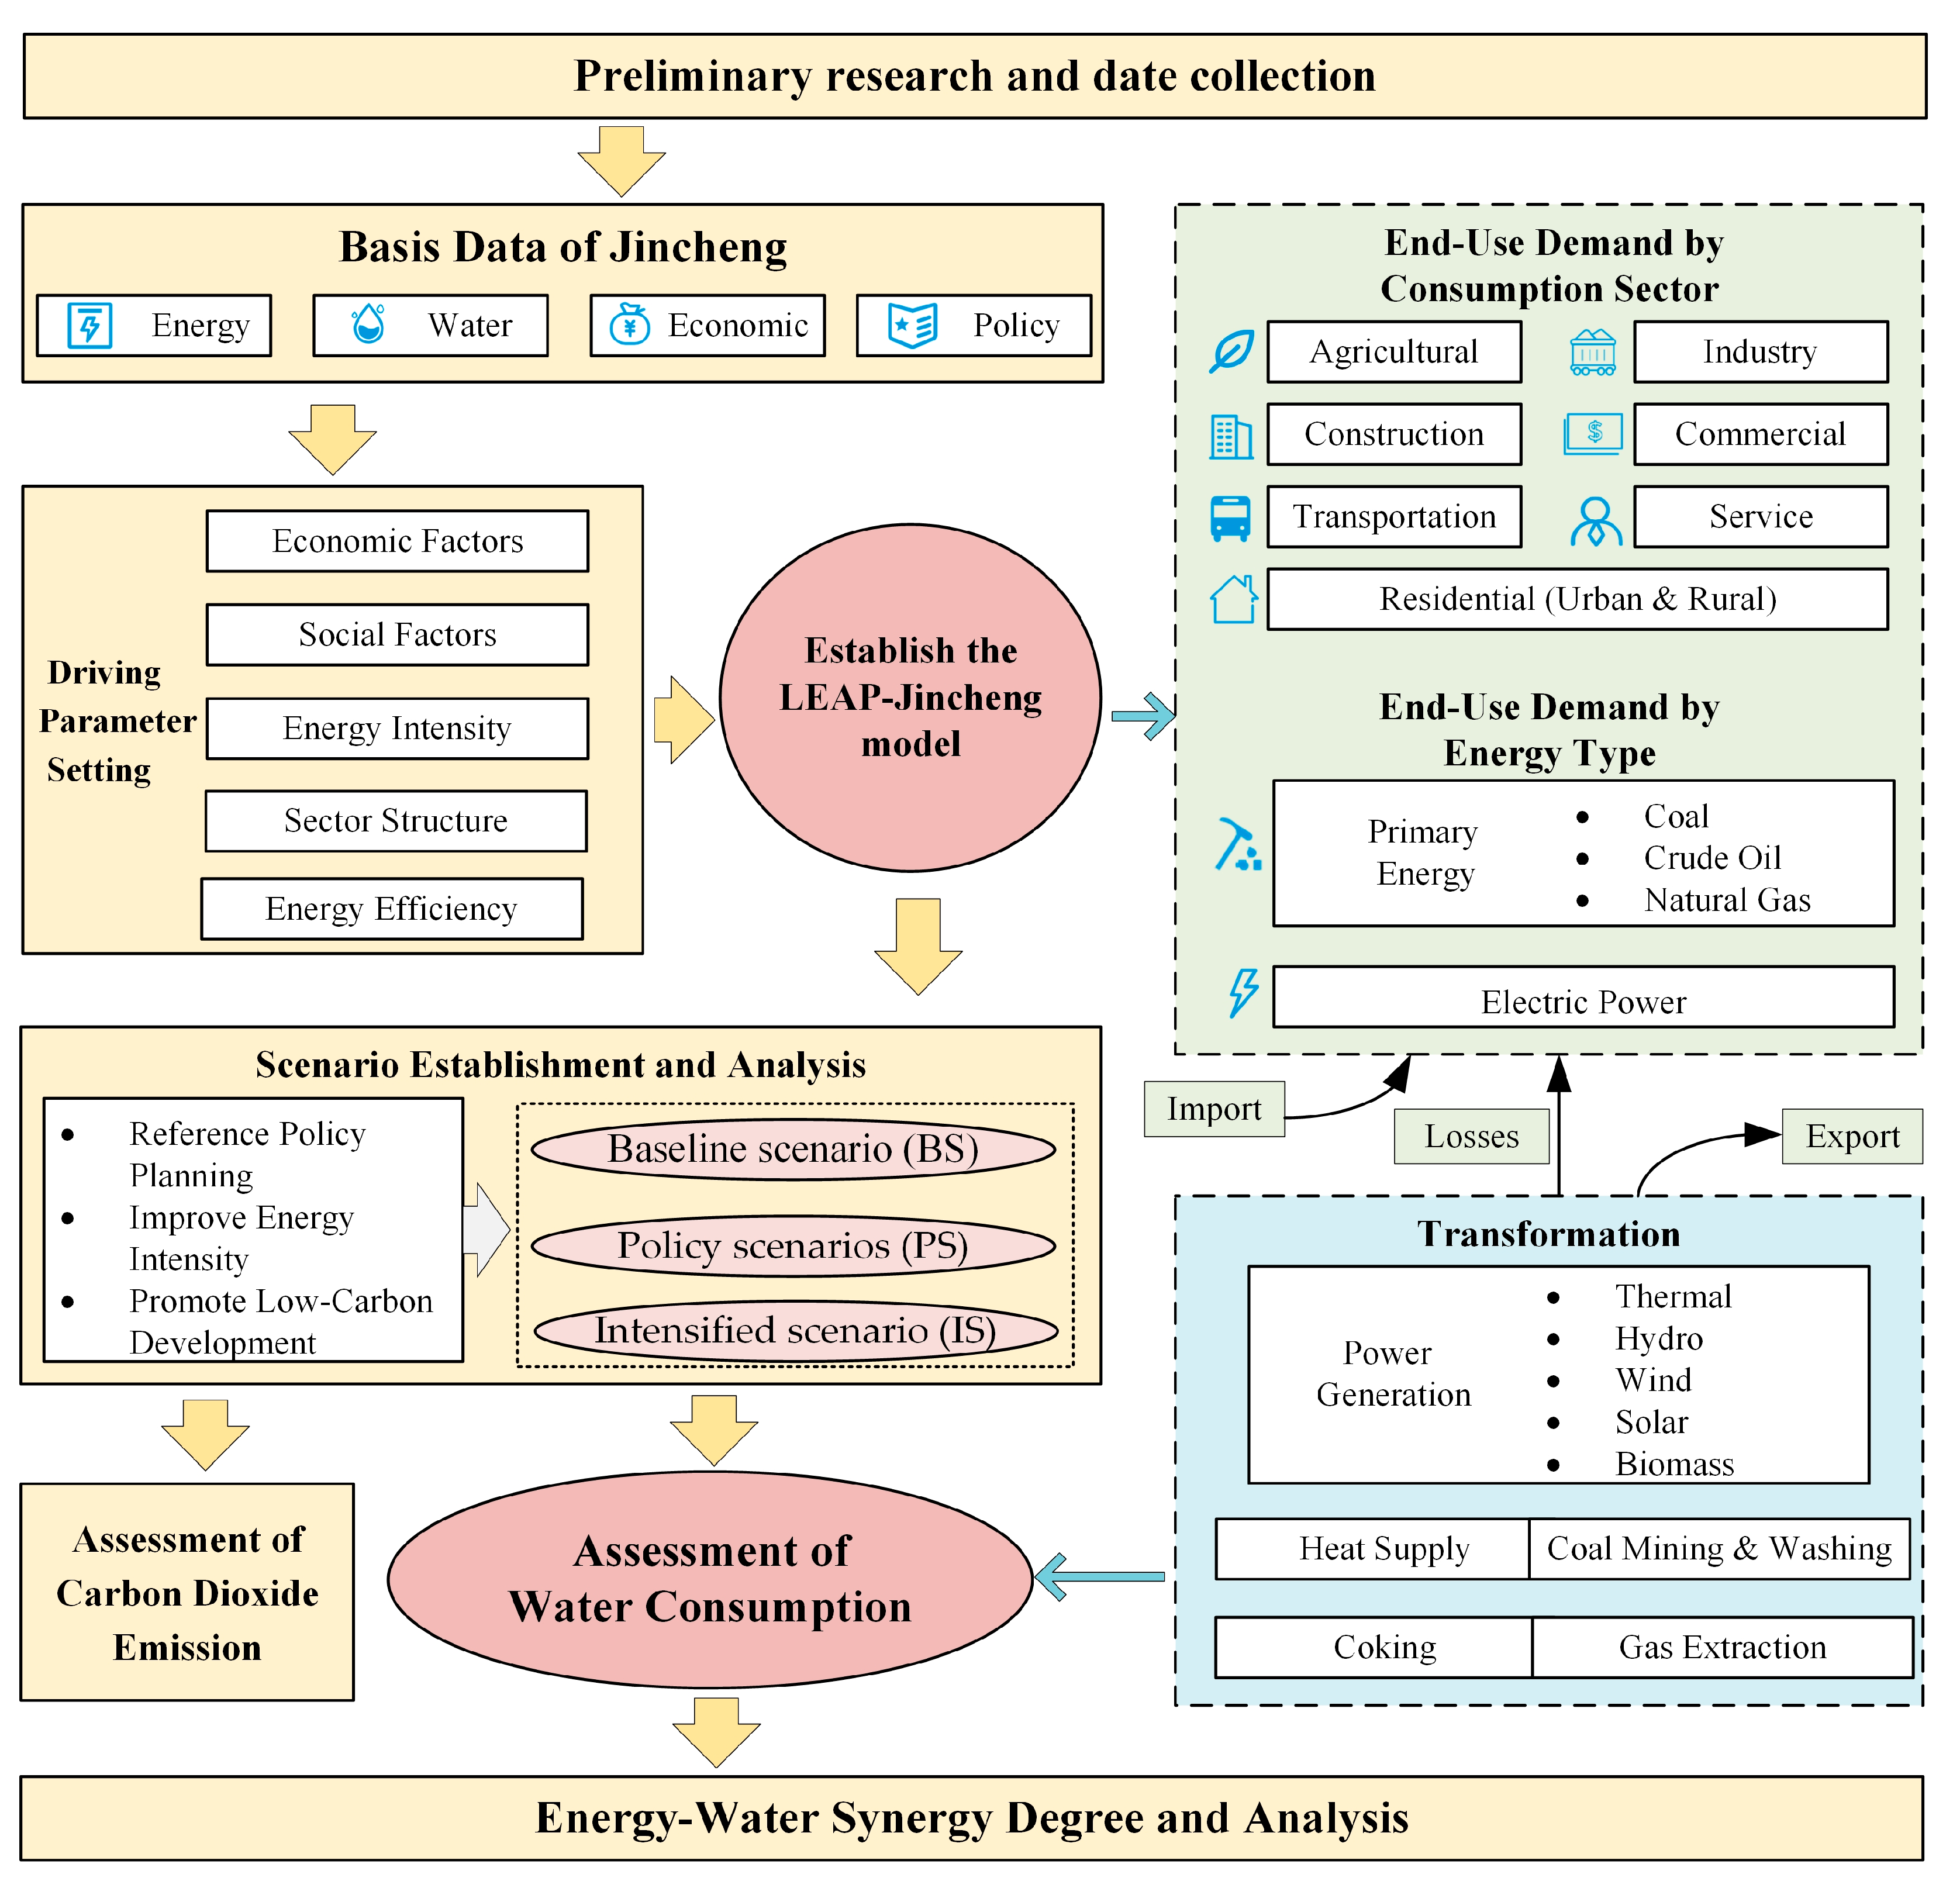
4.1. Research Framework
4.2. Low Emissions Analysis Platform
4.3. Kaya Equation
4.4. Accuracy Verification
4.5. Elastic Coefficient Analysis
5. Scenario Settings
5.1. Baseline Scenario (BS)
5.2. Policy Scenario (PS)
5.3. Intensified Scenario (IS)
6. Results and Discussions
6.1. The Forecast of Energy, Water, and Carbon Emissions
6.2. Uncertainties and Limitations
6.3. Policy Suggestions
7. Conclusions
Author Contributions
Funding
Institutional Review Board Statement
Informed Consent Statement
Data Availability Statement
Conflicts of Interest
Appendix A

| 2020 | 2030 | 2040 | 2050 | |||||
|---|---|---|---|---|---|---|---|---|
| PS | IS | PS | IS | PS | IS | PS | IS | |
| Primary industry | 501.41 | 501.41 | 426.28 | 377.38 | 395.75 | 343.02 | 387.91 | 326.25 |
| Industrial sector | 6948.98 | 6948.98 | 6139.52 | 5198.30 | 5839.36 | 4423.97 | 5553.87 | 3764.99 |
| Construct sector | 248.53 | 248.53 | 220.47 | 185.92 | 209.69 | 158.22 | 199.44 | 134.65 |
| Transport sector | 959.81 | 959.81 | 848.01 | 686.07 | 806.55 | 589.84 | 767.12 | 507.10 |
| Commercial sector | 393.70 | 393.70 | 347.84 | 340.19 | 330.83 | 307.66 | 314.66 | 278.25 |
| Service sector | 65.55 | 65.55 | 65.55 | 53.84 | 55.09 | 46.52 | 52.39 | 42.07 |
Appendix B
| 2020 | 2030 | 2040 | 2050 | |||||||||
|---|---|---|---|---|---|---|---|---|---|---|---|---|
| BS | PS | IS | BS | PS | IS | BS | PS | IS | BS | PS | IS | |
| Primary industry | 0.20 | 0.20 | 0.20 | 0.28 | 0.16 | 0.14 | 0.37 | 0.09 | 0.08 | 0.43 | 0.10 | 0.09 |
| Industrial sector | 38.51 | 38.51 | 38.51 | 54.62 | 64.88 | 54.44 | 71.00 | 60.41 | 44.82 | 83.30 | 57.37 | 37.57 |
| Construct sector | 0.04 | 0.04 | 0.04 | 0.06 | 0.08 | 0.07 | 0.08 | 0.08 | 0.06 | 0.10 | 0.08 | 0.05 |
| Transport sector | 0.49 | 0.49 | 0.49 | 0.70 | 0.82 | 0.62 | 0.91 | 1.08 | 0.68 | 1.07 | 1.20 | 0.61 |
| Commercial sector | 0.19 | 0.19 | 0.19 | 0.27 | 0.35 | 0.30 | 0.35 | 0.51 | 0.36 | 0.41 | 0.63 | 0.36 |
| Service sector | 0.04 | 0.04 | 0.04 | 0.06 | 0.07 | 0.07 | 0.07 | 0.11 | 0.09 | 0.09 | 0.14 | 0.11 |
| Urban sector | 0.58 | 0.58 | 0.58 | 0.57 | 0.49 | 0.49 | 0.55 | 0.45 | 0.43 | 0.53 | 0.44 | 0.37 |
| Rural sector | 0.44 | 0.44 | 0.44 | 0.43 | 0.30 | 0.28 | 0.41 | 0.23 | 0.20 | 0.40 | 0.21 | 0.17 |
| Total | 40.50 | 40.50 | 40.50 | 56.99 | 67.14 | 56.41 | 73.74 | 62.95 | 46.72 | 86.32 | 60.16 | 39.31 |
Appendix C
| 2020 | 2022 | 2024 | 2026 | 2028 | 2030 | 2032 | 2034 | 2036 | 2038 | 2040 | 2042 | 2044 | 2046 | 2048 | 2050 | |
|---|---|---|---|---|---|---|---|---|---|---|---|---|---|---|---|---|
| BS | 1.23 | 1.33 | 1.44 | 1.52 | 1.6 | 1.69 | 1.79 | 1.89 | 1.97 | 2.06 | 2.15 | 2.25 | 2.35 | 2.4 | 2.45 | 2.5 |
| PS | 1.23 | 1.43 | 1.61 | 1.78 | 1.9 | 2.02 | 2.03 | 2.05 | 2.04 | 2.03 | 2.01 | 2.03 | 2.05 | 2.06 | 2.06 | 2.05 |
| IS | 1.23 | 1.39 | 1.53 | 1.61 | 1.65 | 1.69 | 1.66 | 1.63 | 1.6 | 1.55 | 1.5 | 1.48 | 1.45 | 1.42 | 1.39 | 1.35 |
References
- Zhang, X.-P.; Cheng, X.-M. Energy Consumption, Carbon Emissions, and Economic Growth in China. Ecol. Econ. 2009, 68, 2706–2712. [Google Scholar] [CrossRef]
- Mekonnen, M.M.; Hoekstra, A.Y. Four Billion People Facing Severe Water Scarcity. Sci. Adv. 2016, 2, e1500323. [Google Scholar] [CrossRef] [PubMed]
- Jayal, A.D.; Badurdeen, F.; Dillon, O.W.; Jawahir, I.S. Sustainable Manufacturing: Modeling and Optimization Challenges at the Product, Process and System Levels. CIRP J. Manuf. Sci. Technol. 2010, 2, 144–152. [Google Scholar] [CrossRef]
- Rogelj, J.; den Elzen, M.; Höhne, N.; Fransen, T.; Fekete, H.; Winkler, H.; Schaeffer, R.; Sha, F.; Riahi, K.; Meinshausen, M. Paris Agreement Climate Proposals Need a Boost to Keep Warming Well below 2 °C. Nature 2016, 534, 631–639. [Google Scholar] [CrossRef] [PubMed]
- Bodansky, D. The Legal Character of the PARIS Agreement. Rev. Eur. Comp. Int. Environ. Law 2016, 25, 142–150. [Google Scholar] [CrossRef]
- Tollefson, J. IPCC Says Limiting Global Warming to 1.5 °C Will Require Drastic Action. Nature 2018, 562, 172–173. [Google Scholar] [CrossRef]
- Scott, C.A.; Pierce, S.A.; Pasqualetti, M.J.; Jones, A.L.; Montz, B.E.; Hoover, J.H. Policy and Institutional Dimensions of the Water–Energy Nexus. Energy Policy 2011, 39, 6622–6630. [Google Scholar] [CrossRef]
- Rothausen, S.G.S.A.; Conway, D. Greenhouse-Gas Emissions from Energy Use in the Water Sector. Nat. Clim. Chang. 2011, 1, 210–219. [Google Scholar] [CrossRef]
- Hamiche, A.M.; Stambouli, A.B.; Flazi, S. A Review of the Water-Energy Nexus. Renew. Sustain. Energy Rev. 2016, 65, 319–331. [Google Scholar] [CrossRef]
- Li, X.; Dong, D.; Lin, G.; Yan, R.; Li, S. Water Use for Energy Production and Conversion in Hebei Province, China. Front. Energy Res. 2020, 8, 558536. [Google Scholar] [CrossRef]
- Shan, Y.; Liu, J.; Liu, Z.; Shao, S.; Guan, D. An Emissions-Socioeconomic Inventory of Chinese Cities. Sci. Data 2019, 6, 190027. [Google Scholar] [CrossRef] [PubMed]
- Fan, J.-L.; Kong, L.-S.; Wang, H.; Zhang, X. A Water-Energy Nexus Review from the Perspective of Urban Metabolism. Ecol. Model. 2019, 392, 128–136. [Google Scholar] [CrossRef]
- Hadian, S.; Madani, K. The Water Demand of Energy: Implications for Sustainable Energy Policy Development. Sustainability 2013, 5, 4674–4687. [Google Scholar] [CrossRef]
- Endo, A.; Tsurita, I.; Burnett, K.; Orencio, P.M. A Review of the Current State of Research on the Water, Energy, and Food Nexus. J. Hydrol. Reg. Stud. 2017, 11, 20–30. [Google Scholar] [CrossRef]
- Talati, S.; Zhai, H.; Kyle, G.P.; Morgan, M.G.; Patel, P.; Liu, L. Consumptive Water Use from Electricity Generation in the Southwest under Alternative Climate, Technology, and Policy Futures. Environ. Sci. Technol. 2016, 50, 12095–12104. [Google Scholar] [CrossRef] [PubMed]
- Murrant, D.; Quinn, A.; Chapman, L.; Heaton, C. Water Use of the UK Thermal Electricity Generation Fleet by 2050: Part 1 Identifying the Problem. Energy Policy 2017, 108, 844–858. [Google Scholar] [CrossRef]
- Zhang, Y.; Zheng, H.; Yang, Z.; Li, Y.; Liu, G.; Su, M.; Yin, X. Urban Energy Flow Processes in the Beijing–Tianjin–Hebei (Jing-Jin-Ji) Urban Agglomeration: Combining Multi-Regional Input–Output Tables with Ecological Network Analysis. J. Clean. Prod. 2016, 114, 243–256. [Google Scholar] [CrossRef]
- Fang, D.; Chen, B. Linkage Analysis for Water-Carbon Nexus in China. Appl. Energy 2018, 225, 682–695. [Google Scholar] [CrossRef]
- Wang, S.; Chen, B. Accounting Framework of Energy-Water Nexus Technologies Based on 3 Scope Hybrid Life Cycle Analysis. Energy Procedia 2019, 158, 4104–4108. [Google Scholar] [CrossRef]
- Qin, Y.; Curmi, E.; Kopec, G.M.; Allwood, J.M.; Richards, K.S. China’s Energy-Water Nexus—Assessment of the Energy Sector’s Compliance with the “3 Red Lines” Industrial Water Policy. Energy Policy 2015, 82, 131–143. [Google Scholar] [CrossRef] [Green Version]
- Valek, A.M.; Sušnik, J.; Grafakos, S. Quantification of the Urban Water-Energy Nexus in México City, México, with an Assessment of Water-System Related Carbon Emissions. Sci. Total Environ. 2017, 590–591, 258–268. [Google Scholar] [CrossRef] [PubMed]
- Yang, X.; Wang, Y.; Sun, M.; Wang, R.; Zheng, P. Exploring the Environmental Pressures in Urban Sectors: An Energy-Water-Carbon Nexus Perspective. Appl. Energy 2018, 228, 2298–2307. [Google Scholar] [CrossRef]
- Nieves, J.A.; Aristizábal, A.J.; Dyner, I.; Báez, O.; Ospina, D.H. Energy Demand and Greenhouse Gas Emissions Analysis in Colombia: A LEAP Model Application. Energy 2019, 169, 380–397. [Google Scholar] [CrossRef]
- Wang, P.; Wang, C.; Hu, Y.; Liu, Z. Analysis of Energy Consumption in Hunan Province (China) Using a LMDI Method Based LEAP Model. Energy Procedia 2017, 142, 3160–3169. [Google Scholar] [CrossRef]
- Hu, G.; Ma, X.; Ji, J. Scenarios and Policies for Sustainable Urban Energy Development Based on LEAP Model—A Case Study of a Postindustrial City: Shenzhen China. Appl. Energy 2019, 238, 876–886. [Google Scholar] [CrossRef]
- Kachoee, M.S.; Salimi, M.; Amidpour, M. The Long-Term Scenario and Greenhouse Gas Effects Cost-Benefit Analysis of Iran’s Electricity Sector. Energy 2018, 143, 585–596. [Google Scholar] [CrossRef]
- Jiang, J.; Ye, B.; Shao, S.; Zhou, N.; Wang, D.; Zeng, Z.; Liu, J. Two-Tier Synergic Governance of Greenhouse Gas Emissions and Air Pollution in China’s Megacity, Shenzhen: Impact Evaluation and Policy Implication. Environ. Sci. Technol. 2021, 55, 7225–7236. [Google Scholar] [CrossRef]
- Zhou, Y.; Ma, M.; Gao, P.; Xu, Q.; Bi, J.; Naren, T. Managing Water Resources from the Energy—Water Nexus Perspective under a Changing Climate: A Case Study of Jiangsu Province, China. Energy Policy 2019, 126, 380–390. [Google Scholar] [CrossRef]
- Wang, X.; Liu, X. Research on Carrying Capacity of Water Resources and Sustainable Development Strategy of Shanxi Province. Resour. Dev. 2014, 30, 308–310+338. [Google Scholar] [CrossRef]
- Jincheng Statistical Yearbook. Available online: https://data.cnki.net/area/Yearbook/Single/N2012020028?dcode=D04 (accessed on 4 September 2022).
- Shanxi Statistical Yearbook. Available online: http://tjj.shanxi.gov.cn/tjsj/tjnj/ (accessed on 4 September 2022).
- Jincheng Water Resources Bulletin. Available online: http://swj.jcgov.gov.cn/ztzl/szygl/szygb/ (accessed on 4 September 2022).
- The World in 2050. Available online: https://www.pwc.com/gx/en/research-insights/economy/the-world-in-2050.html (accessed on 4 September 2022).
- Shanxi Province Water Consumption Rules. Available online: https://www.zixin.com.cn/doc/123845.html (accessed on 4 September 2022).
- Cao, Y. Study on Resources Carrying Capacity of Coal-Mining Area—Taking Jincheng Coal-Mining Area as an Example. J. Libr. Inf. Sci. 2010, 20, 189–191+204. [Google Scholar] [CrossRef]
- Wang, N.; Li, J. The Life Cycle of Resource Exploitation and the Development of Resource-Oriented City—Taking Jincheng of Shanxi Province as an Example. J. Jincheng Inst. Technol. 2014, 6, 60–63. [Google Scholar] [CrossRef]
- McMahon, J.E.; Price, S.K. Water and Energy Interactions. Annu. Rev. Environ. Resour. 2011, 36, 163–191. [Google Scholar] [CrossRef]
- Heaps, C.G. LEAP: The Low Emissions Analysis Platform; Stockholm Environment Institute: Somerville, MA, USA, 2022. [Google Scholar]
- Kaya, Y. Impact of Carbon Dioxide Emission on GNP Growth: Interpretation of Proposed Scenarios.; IPCC Energy and Industry Subgroup: Paris, Germany, 1989. [Google Scholar]
- Mavromatidis, G.; Orehounig, K.; Richner, P.; Carmeliet, J. A Strategy for Reducing CO2 Emissions from Buildings with the Kaya Identity—A Swiss Energy System Analysis and a Case Study. Energy Policy 2016, 88, 343–354. [Google Scholar] [CrossRef]
- Burgan, H.I.; Aksoy, H. Daily Flow Duration Curve Model for Ungauged Intermittent Subbasins of Gauged Rivers. J. Hydrol. 2022, 604, 127249. [Google Scholar] [CrossRef]
- Tang, W.; Zheng, S.; He, P.; Xu, H.; Gu, Y.; Yan, L.; Yang, Q.; Huang, C.; Shen, Y. Study on the Co-Benefit of Motor Vehicle Emission Control Based on Scenario Analysis in Hangzhou. Acta Sci. Circumstantiae 2019, 39, 2033–2042. [Google Scholar] [CrossRef]
- Research Report on Building a Modern Energy System to Promote the Transformation and Development of High Quality and High-Speed Energy. Available online: https://www.jcgov.gov.cn/dwgk/jcjjml/yjbg/202108/t20210805_1445956.shtml (accessed on 4 September 2022).
- Outline of the 14th Five-Year Plan for National Economic and Social Development of Jincheng Urban Area and The Vision Goal of 2035. Available online: http://www.jccq.gov.cn/zwgk/zfwj/202108/t20210830_1460511.shtml (accessed on 4 September 2022).
- Proposal of the CPC Shanxi Provincial Committee on Formulating the 14th Five-Year Plan for National Economic and Social Development and the Long-range Goals of 2035. Available online: http://fgw.shanxi.gov.cn/fggz/wngz/fzgh2/202104/t20210416_177332.shtml (accessed on 4 September 2022).
- Modern Energy System Planning in the 14th Five-Year Plan. Available online: http://www.gov.cn/zhengce/zhengceku/2022-03/23/content_5680759.htm (accessed on 4 September 2022).
- The Geopolitics of Renewable Hydrogen in Low-Carbon Energy Markets. Geopolit. Hist. Int. Relat. 2020, 12, 7. [CrossRef]
- Networked and Integrated Urban Technologies in Sustainable Smart Energy Systems. Geopolit. Hist. Int. Relat. 2020, 12, 45. [CrossRef]
- Chaudhary, M.L.; Al-Fatesh, A.S.; Kumar, R.; Lanre, M.S.; Frusteri, F.; AlReshaidan, S.B.; Ibrahim, A.A.; Abasaeed, A.E.; Fakeeha, A.H. Promotional Effect of Addition of Ceria over Yttria-Zirconia Supported Ni Based Catalyst System for Hydrogen Production through Dry Reforming of Methane. Int. J. Hydrogen Energy 2022, 47, 20838–20850. [Google Scholar] [CrossRef]
- Al-Fatesh, A.; Singh, S.K.; Kanade, G.S.; Atia, H.; Fakeeha, A.H.; Ibrahim, A.A.; El-Toni, A.M.; Labhasetwar, N.K. Rh Promoted and ZrO2/Al2O3 Supported Ni/Co Based Catalysts: High Activity for CO2 Reforming, Steam–CO2 Reforming and Oxy–CO2 Reforming of CH4. Int. J. Hydrogen Energy 2018, 43, 12069–12080. [Google Scholar] [CrossRef]
- Dhar, A.; Kumar, N.S.; Khimani, M.; Al-Fatesh, A.S.; Ibrahim, A.A.; Fakeeha, A.H.; Bhadja, P.; Vekariya, R.L. Naturally Occurring Neem Gum: An Unprecedented Green Resource for Bioelectrochemical Flexible Energy Storage Device. Int. J. Energy Res. 2020, 44, 913–924. [Google Scholar] [CrossRef]
- Pop, R.A.; Dabija, D.C.; Pelău, C.; Dinu, V. Usage intentions, attitudes, and behaviors towards energy-efficient applications during the COVID-19 pandemic. J. Bus. Econ. Manag. 2022, 23, 668–689. [Google Scholar] [CrossRef]


| Department | Unit | Water Consumption |
|---|---|---|
| Coal mining | m3/t | 0.27 |
| Coal washing | m3/t | 0.07 |
| Coking | m3/t | 1.8 |
| Gas extraction | m3/103 m3 | 2 |
| Heating | m3/GJ | 0.018 |
| Thermal power generation (cyclic cooling) | m3/WMh | 2.6 |
| Thermal power generation (air cooling) | m3/WMh | 0.7 |
| Thermal power generation (once-through cooled) | m3/WMh | 0.54 |
| Biomass power generation | m3/WMh | 0.19 |
| Wind power generation | m3/WMh | 0.03 |
| Metrics | Expression | Range | Remarks |
|---|---|---|---|
| Ratio of Standard Deviation | The metric approaching zero shows better performance | ||
| Relative Error | |||
| Mean Absolute Percentage Error |
| Performance | RSD | RE | MAPE |
|---|---|---|---|
| Very good | [0.0, 0.5] | [−100%, 100%] | The metric approaching zero shows better performance |
| Good | (0.5, 0.6] | ||
| Adequate | (0.6, 0.7] | ||
| Inadequate | (0.6, +∞) | (−∞, −100%)∪(100%, +∞) |
| 2020 | 2025 | 2035 | 2045 | |
|---|---|---|---|---|
| GDP growth rate | 4.312% | 3.058% | 2.389% | 1.059% |
| Population growth rate | 0.172% | −0.466% | −0.239% | −0.386% |
| Policy | Level | Policy Contents | Scenario Settings |
|---|---|---|---|
| Research Report on Building a Modern Energy System to Promote the Transformation and Development of High Quality and High-Speed Energy [43] | Jincheng | Compared with 2020, the GDP will double by 2030 and triple by 2050. | Set a linear increase in GDP between 2020–2030 and 2030–2050. |
| By 2025, the urbanization level will rise to over 65%, and by 2030, the urbanization level will reach 70%, in line with the national level. | The urbanization rate is set to increase linear between 2020–2030 and 2030–2050. | ||
| Increase coalbed methane and renewable energy, control coal, and promote the integrated development of renewable energy and traditional fossil energy. | By 2050, the share of coal will be reduced by 20%, and it will be supplemented by natural gas and electricity. | ||
| Outline of the 14th Five-Year Plan for National Economic and Social Development of Jincheng Urban Area and The Vision Goal of 2035 [44] | Accelerate upgrading new energy equipment technology, focusing on wind power equipment, photovoltaic equipment, and electric vehicle equipment. | By 2050, the proportion of thermal power generation reduced by 50%, biomass, wind, photovoltaic, hydroelectric power increased by 5%, 2%, 13%, and 30%, respectively. | |
| Accelerate the development of electrification with a focus on transportation. | By 2050, the share of gasoline vehicles will be reduced by 30%, the share of electric vehicles and new energy vehicles will be increased by 20% and 10%. | ||
| Increase the use of renewable energy for heating. | Reduce coal heating in the thermal sector by 20% by 2050, supplemented by solar energy. | ||
| Proposal of the CPC Shanxi Provincial Committee on Formulating the 14th Five-Year Plan for National Economic and Social Development and the Long-range Goals of 2035 [45] | Shanxi Province | By 2025, the economic aggregate of the province will increase significantly, the leading role of industry in economic development will be significantly enhanced, and the proportion of industrial added value in GDP will increase rapidly. | To increase the share of secondary industry by 3% by 2025 |
| Accelerate changes in the structure and mode of energy use and promote green ways of production and living. | By 2050, the share of residential electricity and natural gas will increase by 5% each, oil consumption will decrease by 10%. | ||
| Green, intelligent, and safe coal mining and efficient, clean, and deep coal utilization to lead the country. | Improve energy intensity. See Appendix B for energy intensity settings of each sector. | ||
| Continue to focus on improving the quality of water ecological environment and coordinate the conservation and utilization of water resources. | / | ||
| Modern Energy System Planning in the 14th Five-year Plan [46] | China | Energy, green, and low-carbon transformation project. | See Appendix B for energy intensity settings of each sector. |
| Remarkable results have been achieved in saving energy and reducing consumption. |
| Main Parameter | BS | PS | IS | |||||||||
|---|---|---|---|---|---|---|---|---|---|---|---|---|
| 2020 | 2030 | 2040 | 2050 | 2020 | 2030 | 2040 | 2050 | 2020 | 2030 | 2040 | 2050 | |
| GDP (RMB/billion) | 142.6 | 202.2 | 262.9 | 308.4 | 142.6 | 285.1 | 356.4 | 427.7 | - | - | - | - |
| Population (Thousand) | 2108.3 | 2148.1 | 2078.3 | 2011.3 | - | - | - | - | - | - | - | - |
| Urbanization rate (%) | 62.7 | 63 | - | - | 62.7 | 70 | 73 | 74 | - | - | - | - |
| The industrial structure (%) | 4:54:42 | - | 2:54:44 | 1:45:54 | 1:4:59 | - | - | - | - | |||
| Changes in industrial energy intensity (%) | - | - | - | - | −1.7 | −0.5 | - | - | −3 | −1.6 | - | - |
| Changes in household energy intensity (%) | - | - | - | - | −1.5 | -0.8 | −0.2 | - | −1.5 | −1.2 | −1 | - |
| Proportion of thermal power generation (%) | 96.1 | - | - | - | - | 80:6 | 77.5 | 75 | - | 70 | 60 | 50 |
| Performance Metrics | Performance Results | |
|---|---|---|
| RSD | 0.03 | Good performance |
| RE | 0.01 | Good performance |
| MAPE | 0.22 | Good performance |
| No Synergy | Synergy, Water Saving More | Synergy, Same Degree | Synergy, Energy Saving More | |
|---|---|---|---|---|
| PS | −0.77 | / | / | / |
| IS | / | / | / | 1.37 |
| A1 | A2 | A3 | A4 | A5 | A6 | A7 | A8 | A9 | A10 | A11 | |
|---|---|---|---|---|---|---|---|---|---|---|---|
| 0.9787 | 0.0213 | 0.0049 | 0.0054 | 0.9430 | 0.0022 | 0.0159 | 0.0159 | 0.0053 | 0.0152 | 0.0061 |
Publisher’s Note: MDPI stays neutral with regard to jurisdictional claims in published maps and institutional affiliations. |
© 2022 by the authors. Licensee MDPI, Basel, Switzerland. This article is an open access article distributed under the terms and conditions of the Creative Commons Attribution (CC BY) license (https://creativecommons.org/licenses/by/4.0/).
Share and Cite
Zhao, Y.; Lin, G.; Jiang, D.; Fu, J.; Li, X. Low-Carbon Development from the Energy–Water Nexus Perspective in China’s Resource-Based City. Sustainability 2022, 14, 11869. https://doi.org/10.3390/su141911869
Zhao Y, Lin G, Jiang D, Fu J, Li X. Low-Carbon Development from the Energy–Water Nexus Perspective in China’s Resource-Based City. Sustainability. 2022; 14(19):11869. https://doi.org/10.3390/su141911869
Chicago/Turabian StyleZhao, Yi, Gang Lin, Dong Jiang, Jingying Fu, and Xiang Li. 2022. "Low-Carbon Development from the Energy–Water Nexus Perspective in China’s Resource-Based City" Sustainability 14, no. 19: 11869. https://doi.org/10.3390/su141911869