Abstract
As the second most populous country in the world, India’s needs related to electricity production are still growing; thus, the country is seeking renewable energy resources as an alternative to conventional resources. Currently, India’s use of renewable energies ranks as fifth worldwide, with approximately 13.22% of the total amount of energy used in the form of solar energy, which is very nominal. Therefore, in the present study, a large-scale 20 MW solar PV power plant was modelled to access the technological and economic performances using the System Advisor Model (SAM) for the selected locations: Vishakhapatnam (VSKP), Hyderabad (HYD), Madurai (MDU), Thiruvananthapuram (TVC), and Bangalore (SBC), where solar radiation is high for South Indian states. In order to carry this out, three solar tracking mechanisms, i.e., fixed tracking (FT), single-axis tracking (SAT), and double-axis tracking (DAT), are taken into consideration at the selected locations. The results from the assessment of the FT mechanism’s yearly energy production show that 31 GWh were produced at TVC and 33 GWh were produced at VSKP, HYD, MDU, and SBC in the first year of the project, with a capacity factor (CF) from 18.5% to 19.5%. Conversely, the SAT mechanism generated an annual amount of energy, ranging from 38 GWh to 42 GWh, with an increase in the CF ranging from 22% to 23%. Furthermore, the DAT mechanism’s annual energy generated 44 GWh to 46 GWh, with the CF ranging between 25% and 26.5%. However, the recorded levelized cost of energy (LCOE) ranges were between 3.25 ¢/kWh to 4.25 ¢/kWh at the selected locations for all three mechanisms. The sensitivity analysis results also suggest that the FT and SAT mechanisms are not economically feasible because of their negative net present values (NPV) in all five locations, whereas the DAT mechanism generated positive results for all of the locations after 20 years. Furthermore, according to the study, we concluded that HYD was identified as the most feasible location in the South Indian region for installing a large-scale solar PV power project.
1. Introduction
Early in the 19th century, the production of electrical energy utilizing fossil fuel technology was adopted, and it was also recognized as the main source of power generation worldwide [1,2,3]. However, more than 33% of greenhouse gas emissions in the environment result from these fossil fuel technologies [4]. Consequently, researchers worldwide concluded that generating power using renewable energy (RE) sources was more eco-friendly and more cost-effective [5]. As a result, the production of power by solar PV has acquired prominence and interest on a global scale [6,7]. As observed in other nations, India has begun to utilize its economic potential to supply the nation with the electricity it needs. The world reported the use of 758.3 GW in total, with India coming in fifth place behind China, the EU, the USA, and Japan. India generates 47.3 GW of electricity using solar energy, as described in Figure 1 [8].
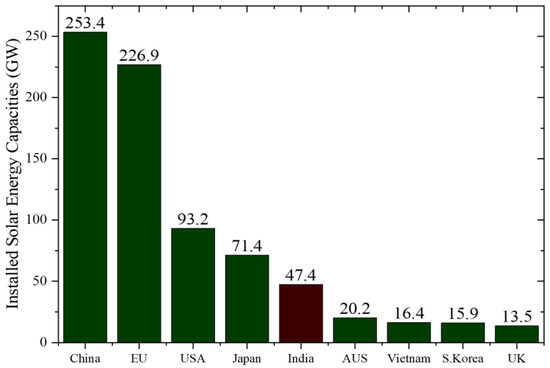
Figure 1.
Total installed solar energy capacity by the 21st century across the globe [8].
Numerous studies on India’s potential for renewable energy have sought to change the energy regulations, its potential obstacles [9], and prospects. Major difficulties highlighted are a lack of financial resources and technical expertise. According to the literature review, there are not enough studies specifically addressing India’s economic potential regarding RE sources. In addition to discussing the solar energy markets in India, the current study is focused on solar energy for the Republic of India.
Several researchers have conducted studies concerned with evaluating solar PV assessments. Kymakis et al. [10] evaluated a large-scale PV operation in Crete. The average power output, average performance ratio, and average CF were 1.33 MWh, 67.4%, and 15.3%, respectively. Sundaram et al. [11] also monitored the annual performance of a 5 MWp solar park at Sivaganga Oblast in India. Similarly, D’Adamo et al. [12] monitored the PV systems for residential buildings in Italy, and reported that the estimation of the NPV varies from 44 to 1007 EUR/kW in 25kW and 105kW plants, respectively.
Additionally, Bouacha et al. [13] monitored a 9.5 kWp PV grid connected for three years in Algeria as part of an experimental analysis. According to the findings of their investigation, the inverter and PV module efficiencies are 96% and 8.3%, respectively, and the low-performance ratio is tolerable due to the shading losses and the inverter type. However, according to a techno-economic assessment conducted in Baghdad by Aziz et al. [14], the NPV of the PV grid system decreased by 12% when diesel generators were added, whereas the carbon dioxide emissions rose by 33%. A techno assessment was carried out by Pillai et al. [15] for a 1 MW solar PV grid system on Bahrain Island. According to the assessment, Bahrain’s current cost of a kWh generation is less than 43% of the LCOE. Zou et al. [16] conducted the PV viability tests for five large sun radiation areas in China. According to the assessment, the Xigaze site’s performance is suitable for installing a PV park due to the good provision of yearly energy and high solar radiation compared with all other sites. Kazem et al. [17] performed a techno-economic assessment for a 1 MW PV grid in Oman. The study revealed that the LCOE and the CF of the proposed system of 0.228 USD/kWh, and 21.7 USD/kWh, respectively, demonstrated great promise. Furthermore, XU et al. [18] performed a techno-economic assessment for PV power generation in rural regions in Sindh Oblast, Pakistan. The preliminary results from the study revealed that the PV power generation cost 6.87 PKR/kWh, which is relatively more economical than conventional energy sources. The annual performance of a 5 MW PV grid system at the Jordan University of Science and Technology in Jordan was studied by Alshare et al. [19], and they compared their results with the SAM program. Agyekum [20] performed a techno-economic assessment for Ghana in three climatic regions. His study’s reports reveal that the northern region is a large-scale PV system because of high solar irradiance, a higher annual energy generation, and a lower LCOE. Camilo et al. [21] performed an economic assessment for a residential complex in Portugal. The study revealed the vital finding that energy storage is not profitable for residential complexes because of the high investment in batteries. Adaramola [22] calculated the cost for a rooftop 2.07 kW PV power grid system, and his study reported that the LCOE was minimized to 0.246 USD/kWh.
As per the author’s best knowledge, no study has been presented to date where a comparison between the FT, SAT, and DAT mechanisms has been demonstrated where specific potential sites in Southern India have been considered to perform a techno-economic assessment of a solar power plant (SPP). In order to understand the impact of the FT, SAT, and DAT mechanisms on the various performance parameters such as electricity to the grid, the LCOE, and NPV, a 20 MW solar power plant was chosen and separated into five South Indian regions, namely, Andhra Pradesh, Tamil Nadu, Kerala, Telangana, and Karnataka. Each region’s specific location was chosen, which had different climatic characteristics. This study will be useful for decision makers in India and other developing regions or countries that lie in the country’s equatorial line for future cleaner energy production and developing solar PV power plants.
1.1. India’s Solar Energy Potential and Solar Radiation
Solar energy is the sector of renewable energy sources in India that is growing the fastest. By the end of March 2021, the installed solar capacity in the nation was estimated to be around 154.08 GW [23], accounting for 13.2% of all the country’s RE sources. It is planned to grow electricity generation through solar PV to 450 GW by 2030 [24]. The total installed solar PV capacity in various years is shown in Figure 2. Due to solar power’s efficiency, dependability, and affordability for both business and residential complexes, India presently generates roughly 9.8% of its total electricity, a figure which is rising rapidly on a daily basis. As a result, Figure 3 depicts the geographic distribution of India’s long-term average solar energy power output from 1999 to 2018. Selected eminent places, i.e., Vishakhapatnam (VSKP), Hyderabad (HYD), Madurai (MDU), Thiruvananthapuram (TVC), and Bangalore (SBC), have an annual solar energy potential that ranges from 4.5 to 5.0 kWh/m2/day.
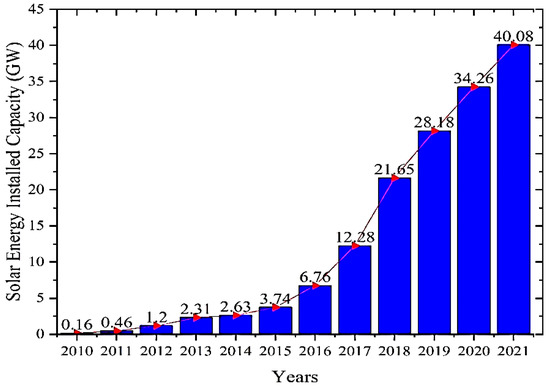
Figure 2.
The total capacity of solar energy in India between 2010 and 2021 [23,24].
1.2. Mechanism of Solar Tracking System
Solar energy technology is less popular than other RE sources because solar PV panels are set at the proper angle to capture solar energy. The main disadvantage is that fixed angels cannot adjust their orientation to follow the sun’s path, which would reduce the power and effectiveness of solar PV panels [25,26]. Therefore, several studies have been conducted by different scholars worldwide to increase efficiency, either theoretically or empirically. A study found that the solar tracking mechanism is a diverse way that harnesses the sun’s energy most effectively [27]. As a result, the solar tracking mechanism is divided into single-axis tracking (SAT) and dual-axis tracking (DAT) mechanisms, respectively. The SAT mechanism is efficient, but can only move in one direction, either horizontally or vertically [28]. To obtain the maximum energy and efficiency from the sun, however, another form of the DAT mechanism can change its movement in all directions (North, South, East, and West), and the DAT movement continues until the sun’s rays are perpendicular to the solar PV panels [29]. The DAT technology includes two rotational axes and two popular ways to execute it: azimuth altitude DAT and tip-tilt DAT [20].
1.3. Geographical Features and Solar Resource of the Present Study
In this segment, South India is divided into five regions. One location from each region was selected for the techno-economic analysis, where the annual solar radiation is high. The potential geographical locations of the sites are presented with the help of SolarGIS in Figure 3. Simultaneously, their latitude, longitude, and annual solar energy are in Table 1. The Direct Normal Irradiance (DNI) and Global Horizontal Irradiance (GHI) are measures of the quantity of solar energy that a surface receives per unit area when it is held perpendicular (or normal) to the rays that originate from the direction of the sun at its current location in the sky, and the total amount of shortwave terrestrial irradiance received by a surface horizontal to the ground, respectively.

Table 1.
Selected locations in southern regions in India [30].
Table 1.
Selected locations in southern regions in India [30].
| Region | Location | Lat (°N) | Long (°E) | DNI (kWh/m2/Day) | GHI (kWh/m2/Day) |
|---|---|---|---|---|---|
| Andhra Pradesh | VSKP | 17.68 | 83.21 | 4.6 | 5.4 |
| Telangana | HYD | 17.38 | 78.48 | 4.8 | 5.7 |
| Tamil Nadu | MDU | 9.92 | 78.11 | 5.0 | 5.9 |
| Kerala | TVC | 8.48 | 76.95 | 4.5 | 5.5 |
| Karnataka | SBC | 12.97 | 77.54 | 5.5 | 5.8 |

Figure 3.
Solar energy potential in India (downloaded from solargis) [31].
Figure 3.
Solar energy potential in India (downloaded from solargis) [31].

2. Materials and Methods
The approach utilized for the study is covered in this section. This study uses the SAM program (2021.12.2 version) to design solar power plants for all sub-regional sites. The SAM program is utilized for business, academic, or personal purposes [32]. The application assists in calculating the financial parameters and performance measures for building RE sources globally. It is a model for producing electricity that operates on the premise that a renewable energy system will provide its energy to a facility that will meet an electric load or to a building connected to the grid [20]. SAM incorporates financial models for projects with Power Purchase Agreements (PPA) and analyses some renewable energy sources’ financial and performance parameters. Based on the project’s input parameters, it forecasts the system costs and energy performance. Several academics have utilized the program to conduct techno-economic assessments of various SPPs worldwide [20]. The financial parameters used to design the solar power plant are therefore shown in Table 2, and the technical characteristics utilized for the simulation are listed in Appendix A.
Table 2.
Financial parameters used for the study.
2.1. Financial Factors
The LCOE and NPV indicators were used to assess the power facilities’ economic potential to execute the analysis. The electricity cost generated by a plant is referred to as the LCOE. It is the standard statistic for examining the energy cost generated by various generation systems. The project’s total cost is represented in dollars per kilowatt-hour of electricity generated by the plant throughout its full life. The model computes both the nominal and real LCOEs. However, the real LCOE was utilized in this research since it takes extended years of inflation into consideration during the project, i.e., it incorporates the long-term analysis, whereas the nominal LCOE is excellent for short-term evaluations. Equation (1) [32]:
where: Ao signifies the portion for the plant’s equity fund (USD), An signifies the project’s cost in n years (USD), dreal signifies the real discount rate (%), dnominal indicates the nominal discount rate (i.e., the discount rate with inflation) (%), N denotes the analysis’s time frame (years), and En denotes the amount of electricity the plant generated in n year (kWh).
When calculating the LCOE, the SAM model takes the following factors into account:
- ✓
- The charges for local and state taxes;
- ✓
- Operational costs, such as insurance premiums, maintenance and repair (O&M), and real estate taxes;
- ✓
- Capital for disbursal of assets or reserves, such as working capital, debt servicing, and equipment replacement;
- ✓
- The project’s equity investment covers sales tax, project development fees, labour and equipment expenditures, and finance fees.
The PPA financial model was chosen since it is an adequate method for determining the financial sustainability of large-scale solar power projects. The SAM replicates several financial structures using this model. In a solar power PPA, a developer arranges for the design, financing, permitting, and installation of a power plant—in this example, an SPP system—on a customer’s land for little to no cost. The customer is then charged a fixed fee by the developer, which is typically less expensive than the rate charged by the local utility. While the developer receives revenues from the sale of the electricity or energy and any tax credits that the system may create, the reduced electricity rate is intended to offset the customer’s procurement of electricity from the grid. Typically, PPA agreements last between 10 and 25 years, during which the facility’s operation and maintenance are the developers’ responsibility. The facility may be removed, the agreement may be extended, or the client may decide to purchase the facility after the term. The 25-year analysis period (lifetime) was considered in this study when calculating the LCOE. The financial criteria considered for the analysis are displayed in Table 1. Using Equation (2), the nominal discount rate can be calculated [20].
where: DR is real discount rate and IR is inflation rate
The net present value (NPV) is a different statistic frequently employed in assessing a project’s cost efficiency. A project’s whole cost-effectiveness, including costs and revenues, is measured by its net present value (NPV). Equation (3) can be used to determine the NPV [20]. When the NPV has a favorable assessment, the project is economically viable; the opposite is true when it has a negative scope.
2.2. Performance of Weather Characteristics Obtained from the Study
For a few locations in south India, the weather-characteristic performance of an SPP is depicted in Figure 4 and Figure 5. Figure 4 displays the average wind speed for all the chosen locations: VSKP, HYD, MDU, TVC, and SBC, with average values of 4.71 m/s, 3.20 m/s, 2.81 m/s, 3.53 m/s, and 3.44 m/s, respectively. The VSKP location’s average wind speed is the highest because it is close to the Andhra Pradesh region’s sea shore, whereas the MDU location’s average wind speed is the lowest in Tamil Nadu’s central region. Figure 5 shows the GHI for the chosen areas, and it was found that from March to May, GHI was high across all the locations due to strong solar radiation. Furthermore, the GHI slightly decreases for most locations from June to November because of the monsoon and winter seasons that affect solar radiation, whereas from December to February, GHI gradually increases as solar radiation increases.
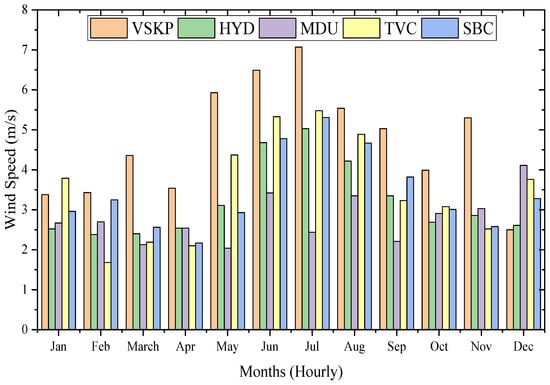
Figure 4.
Hourly wind speed data for selected locations (data obtained from the SAM program).
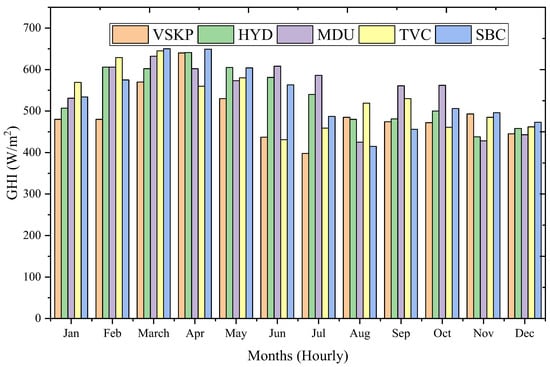
Figure 5.
Hourly GHI data for selected location (data obtained from the SAM program).
3. Results
The technical and financial outcomes for a 20 MW solar power plant that is suited for the chosen locations are provided in this section. The three components of this study address technical, economic, and, lastly, the impact of financial and economic factors on the solar PV power plant under discussion. The SAM program calculates a few parameters, and the findings are based on the chosen technical and financial parameters collected from other studies.
3.1. Technical Results for PV System for Three Mechanisms
In this paper, a 20 MW solar power plant is designed using the SAM program for all the potential locations. This section is dedicated to the technical results from the simulation for the three mechanisms, i.e., FT, SAT, and DAT, at selected locations that are presented. The characteristics of the behavior of solar PV panels that actively respond to the sun’s daylight and shut down during the sunset and monsoon seasons, remaining so until sunrise. Due to the major drawback of solar PV, these factors will affect the CF of solar PV compared with other RE sources. For a better understanding of the results, the daytime chosen in this study ranges from 7 am to 5 pm for all three configurations. Electricity exported to the grid from the system for the three mechanisms is presented in Figure 6 (annual profile) and Figure 7, Figure 8 and Figure 9. for all the locations. Figure 6 depicts the annual variation of electricity export to the grid from the system, and it can be observed that the area under the curve for FT is less than SAT and DAT. It is also worth noting that the electricity exported to the grid from the system average profile differs for different tracking systems. For FT, the peak can be seen for Hydrabad; for SAT, the peak is available for Madurai and DAT; Hydrabad and Madurai are nearly overlapping.
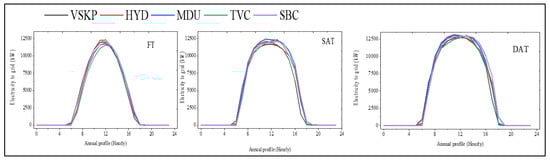
Figure 6.
Yearly electricity export to grid (kW) for all the selected locations and tracking systems.
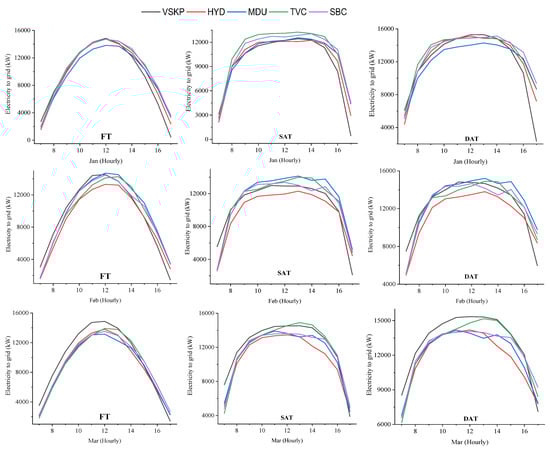
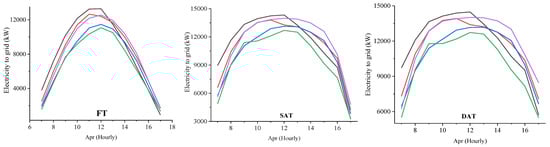
Figure 7.
Monthly (January to April) electricity export to grid (kW) for all the selected locations and tracking systems.
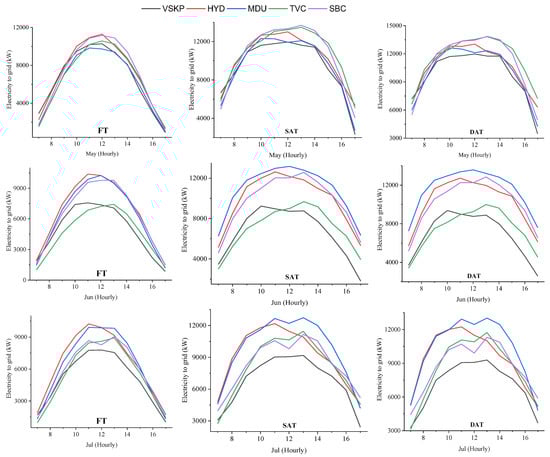
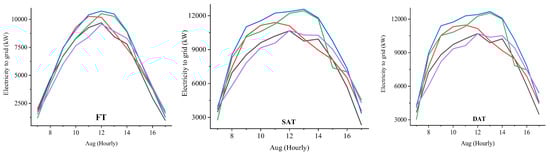
Figure 8.
Monthly (May to August) electricity export to grid (kW) SAT for all the selected locations and tracking systems.
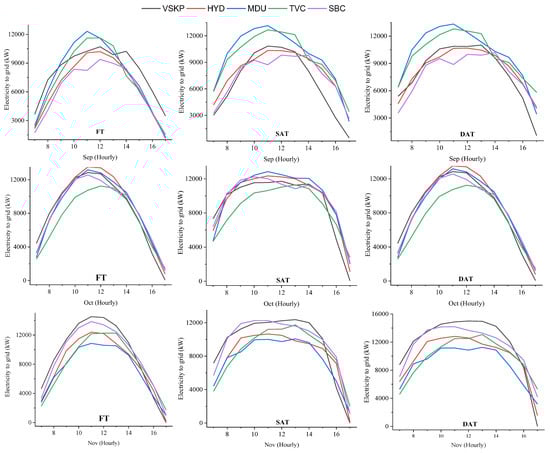
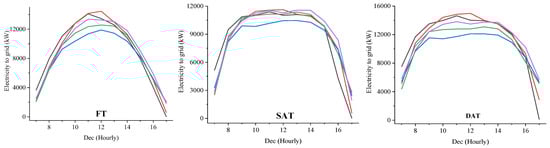
Figure 9.
Monthly (Sept to Dec) electricity export to grid (kW) DAT for all the selected locations and tracking systems.
Moreover, the peak value for almost all the sites is greater for DAT followed by SAT and then FT, which is desirable as the concept of a dual tracing system is meant for such performances. The detailed monthly variation of the electricity exported to the grid from the system can be found in Figure 7, Figure 8 and Figure 9. From the monthly variation of electricity export to the grid from the system, the curve’s width is greater for SAT and DAT compared with FT. This implies that PV panels with SAT and DAT configurations could extract more heat flux than FT. The peak value varies depending on the seasons. Furthermore, the annual energy output is highest for the DAT tracking mechanism and lowest for the FT mechanism, and it is s because the FT mechanism cannot alter the PV panel’s position according to the sun direction and is mounted to a fixed position [39]. In contrast, the DAT mechanism can alter the PV panel’s position according to the sun’s position.
Furthermore, technical results from the simulation presented for the FT, SAT, and DAT mechanisms are presented in Table 3. The annual energy generated from the FT mechanism to the grid during the first year of the project is 33.07 GWh, 33.57 GWh, 33.78 GWh, 31.87 GWh, and 33.54 GWh, with a CF of 18.9%, 19.2%, 19.5%, 18.2%, 19.1% for VSKP, HYD, MDU, TVC, and SBC locations, respectively.
Table 3.
Technical and economic results for three systems for all the locations.
On the other hand, for the SAT mechanism, the maximum annual energy generated from the grid to the system for the selected locations is 38.96 GWh, 40.37, 41.91 GWh, 40.17 GWh, and 41.33 GWh at a capacity factor of 22.2%, 23.0%, 23.9%, 22.9%, and 23.6%, respectively. On the other hand, for the DAT mechanism, the solar PV power plant generated a total electricity amount of 44.28 GWh for VSKP, 45.57 GWh for HYD, and 46.19 GWh for MDU, 44.38 GWh for TVC, and 44.16 GWh for SBC, respectively, in the first year of the project. The CF for the DAT mechanism was 25.3% for VSKP and TVC, 25.8% for HYD, 26.4% for MDU, and 25.1 for SBC, respectively.
Furthermore, Table 3 in the above results indicates that HYD and SBC have a marginal difference in electricity generation, which will be considered almost equal, and also, the CF ratio is almost the same during the project’s first year compared with other locations. Although the generation of electricity through the grid has a marginal difference, the HYD location is more feasible for the project’s construction because of better infrastructure, grid stations, and transportation system facilities (i.e., road, rail, and air) to import goods from the international markets as compared with the SBC location. The findings demonstrate that the tracking system significantly affects the systems’ performance across all sites.
CF is defined as the total amount of energy that a power plant produces to the maximum output energy over that period of the installed capacity of a power plant [40]. According to other researchers, the recorded CFs for the present study are acceptable according to Sundaram et al. [11], Martín et al. [41], and Kumar et al. [42]. In India, the CF ranges from 16% to 26% for the three solar tracking mechanisms for the selected locations. Meanwhile, these CFs will put the project on the right platform related to the performance of the solar PV panels.
3.2. Economic Analysis for PV System for Three Mechanisms
This section presents a detailed economic analysis of the selected locations of a PV power plant for the three solar tracking mechanisms. From the simulation results, locations such as HYD and SBC almost had the same LCOE (real), i.e., 4.17 ¢/kWh & 4.19 ¢/kWh for FT mechanism; 3.56 ¢/kWh, & 3.53 ¢/kWh for SAT mechanism, and 3.42 ¢/kWh for DAT mechanism compared to other VSKP, MDU, and SBC locations respectively presented in Table 3.
3.3. Sensitivity Analysis for PV System for Three Mechanisms
In this section, the sensitivity analysis results of a solar PV system for the five selected locations in South Indian states have been examined. Sensitivity analysis provides additional information to the decision makers (i.e., investors or government) about the project’s benefits. However, the sensitivity analysis shows that the predictions of the project may be far more reliable. Meanwhile, it allows the decision makers to implement additional improvements for projects in the future.
This segment applies sensitivity analysis studies to the 20 MW solar PV plant at the selected locations. Therefore, the present study’s three sensitivity analyses are conducted by varying analysis periods, sales tax rates, and annual interest rates. The first sensitivity analysis investigated the effect of varying the analysis period on the LCOE and NPV. The second sensitivity analysis has been conducted by varying imposed sales tax rates on the economic LCOE. Furthermore, the third sensitivity analysis investigated the effect of the annual interest on the economic feasibility, i.e., the LCOE for a PV project.
Figure 10, Figure 11, Figure 12 and Figure 13 illustrate the impact of LCOE and NPV values by varying the lifetime of a solar PV project. Results from the simulation indicate that LCOE values at the selected sites for the three solar mechanisms decrease with an increase in the analysis period. In addition, it was recorded that the TVC location recorded the highest LCOE, and HYD and SBC recorded the lowest LCOE for the first year of a solar project of all three solar tracking mechanisms. At the same time, the NPV value has negatively impacted the FT and SAT mechanisms during the project lifetime. However, in the case of the DAT mechanism, the impact on the NPV value starts with negative values and changes to positive values slowly only after the end of the project’s lifetime, i.e., after 20 years. The findings indicate that the PV system will not generate enough revenue to cover the project’s costs in the expected 25-year analysis period for the fixed and single-tracker technologies. However, the installation of a dual tracking system may enable the system to produce more electricity throughout the project, thereby recouping the initial expenditure.
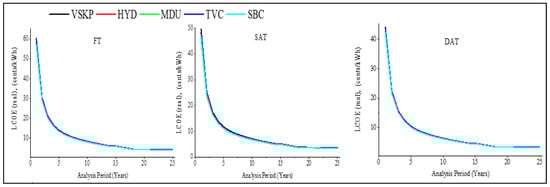
Figure 10.
Sensitivity analysis showing LCOE corresponding to project life-time period.
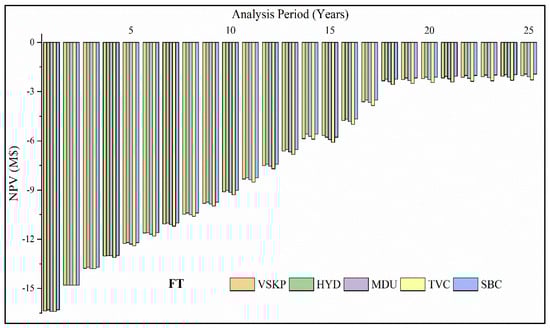
Figure 11.
Effect of NPV corresponding to project life-time period for fixed tracking system.
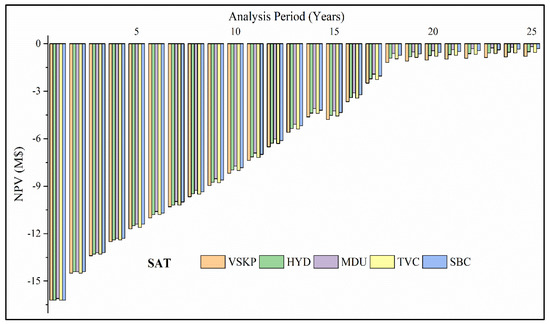
Figure 12.
Effect of NPV corresponding to project life-time period for single tracking system.
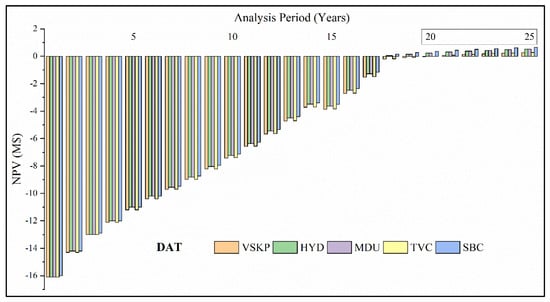
Figure 13.
Effect of NPV corresponding to project life-time period for dual tracking system.
Figure 14 illustrates that varying the imposed sales tax rate for the project has a minor impact on the LCOEs in selected locations. While Figure 15 shows a significant impact on the LCOEs by varying the annual interest of the project, LCOEs increase as the sales tax rate and annual interest rate increase. Furthermore, the DAT mechanism recorded the lowest LCOEs for the selected locations.
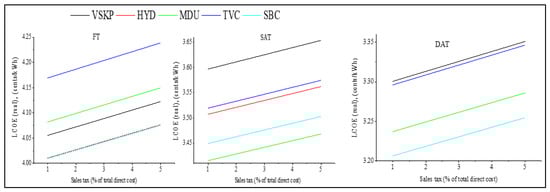
Figure 14.
Behavior of LCOE corresponding to sales tax rate.
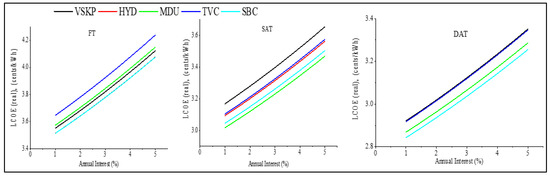
Figure 15.
Impact of LCOE correspondng to annual intrest rate.
3.4. Comparison with Other Studies
A detailed survey has been conducted to compare the results of the present study and is listed in Table 4. The list will provide a review of the location, software/program used, and key findings from the study.
Table 4.
Key findings with other published works.
3.5. Compartive Analysis of the Present Study
Figure 16a,b depicts the electricity tariff for high-voltage industries and India’s residential sector. Figure 16a shows the cost of electricity in the industrial sector, which is recorded as an average of 388 USD/MWh power purchase parity for the FY 2009–2019. The electricity tariff rates in India are higher than in other countries, including Japan, the Russian Federation, the USA, Brazil, Canada, and China—related to the cost of energy [52] for the industrial sector. The highest cost of electricity in industrial sectors is one factor that hinders the development of the renewable energy sectors in India. On the other hand, Figure 16b shows that the average cost of electricity for the residential sector is 4.86 INR/kWh (0.06 $/kWh) from 2009 to 2019, which is nominal.
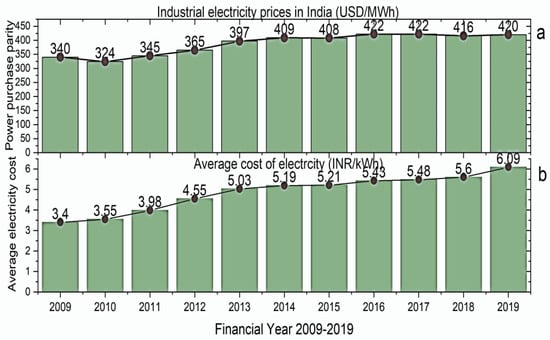
Figure 16.
Electricity tariff rate: (a) industrial, (b) residential for the FY 2009–2019 [52,53].
According to the financial year 2019, the electricity tariff rate in India is 8.86 ¢/kWh. At the same time, the obtained LCOE in the present ranges between 3.85 to 5 ¢/kWh, almost two times lower than that of the three selected mechanisms at all the locations. The obtained LCOE for a 20 MW solar PV project shows a promising result compared with other countries, such as Pakistan, Saudi Arabia, and Ghana, as shown in Table 4.
4. Conclusions, limitations and Policy Recommendations from the Study
In the present study, a techno-economic assessment of a 20 MW solar PV system has been studied in five (i.e., VSKP, HYD, MDU, TVC, and SBC) different climatic conditions in a South Indian States. The study includes the three selected mechanisms (i.e., FT, SAT, and DAT). As shown in Table 3, the annual energy output from the system ranges from 31 GWh to 33 GWh for the FT mechanism, 38 GWh to 42 GWh for the SAT mechanism, and 44 GWh to 46 GWH for the DAT mechanism, respectively, during the first year of the project at the selected locations. The solar PV system also recorded a CF ratio of 18% to 25%, which is feasible for the South Indian climatic conditions from other available studies [42], and the energy yield from the system ranges from 1.6 to 2.2 kWh/kW for all the tracking mechanisms. The performance ratio from the obtained study is between 0.74 and 0.79 for all the locations.
Furthermore, the LCOE financial results presented in Table 3 are recorded for the FT mechanism, ranging from 4.5 ¢/kWh to 5 ¢/kWh, for SAT mechanism, the obtained LCOE ranges from 4.25 ¢/kWh to 4.5 ¢/kWh, and the obtained LCOE for the DAT mechanism is ranged 4.0 ¢/kWh to 4.25 ¢/kWh, respectively. In addition, the present study conducted a sensitivity analysis on all the mechanisms at the selected locations; the effect of NPV on the FT and SAT mechanisms showed negative NPV values. The study results conclude that the DAT mechanism is promising in all aspects. The findings indicate that the PV system will not generate enough revenue to cover the project’s costs in the expected 25-year analysis period for the fixed and single-tracker technologies. However, installing a dual tracking system may enable the system to produce more electricity throughout the project, thereby recouping the initial expenditure.
In addition, the results from the SAM simulation at HYD and SBC locations generated similar annual energy output, LCOE, and CF ratio. However, we conclude that HYD is the best feasible site to install the solar system because the location is well equipped with infrastructure, transportation systems (i.e., air, rail, and road), and grid connection. Meanwhile, the Telangana region was carved out of the Andhra Pradesh region and formed a new state government in 2014, according to the state recognition act 1956 (under Article 4) of the Constitution of India [54,55]. For the development of infrastructure in any region of the state that lies within the Indian boundaries, the central government of India will provide tax relaxations to attract investors and entrepreneurs for ten years from the actual formation date.
4.1. Limitations of the Current Study
India is the seventh largest country in the world by area. The territory of India is divided into four regions: North, South, East, and West. The present study has considered only five regions of South India. However, the obtained results from the present study may not be feasible for other locations in India. Therefore, a similar techno-economic assessment analysis should be conducted for other locations to obtain solar PV potential.
Furthermore, a similar techno-economic assessment can be made for the hybrid RE sources generated for the potential regions in India, which have all unique weather conditions. Moreover, limitations such as the availability and cost of land have not been considered because the cost of land in India varies from location to location and region-to-region, which can significantly impact LCOE and NPV values. In the future, factors affecting soiling losses, annual degradation, and probability figures should be considered; thus, adding additional information will act as reference material for the other studies.
4.2. Policy Implications Development of RE Sources in South India
The following section highlights the policy implications for deploying solar RE sources in the southern region of India.
- To install a proper RE source in India, proper strategies, planning, and re-framing of the current energy policies.
- Imports from the international markets should be decreased, and in the meantime, encourage the local manufacturing units to adopt fast manufacturing to save time and be cost-effective.
- To encourage the local communities to install solar RE sources in the residential complex area by providing loans and an exemption from the tax.
- Training programs from the experts should be initiated for the local communities. They should be implemented for installing, operating, and maintaining, solar RE sources.
- The lack of financial constraints due to the increase in the poverty line in India causes an effect on the budget allocation of solar RE sources.
- The ministry of energy and power resources should continuously engage with experts in solar RE sources from various educational institutes and firms to find potential areas to install PV power plants.
Therefore, such policy implications in India will encourage the local communities and investors to step forward and invest in solar RE sources.
Author Contributions
Conceptualization, S.P. and A.K.; methodology, S.P.; software, S.P.; validation, A.K., A.G. and X.C.; formal analysis, A.K.; investigation, S.P.; resources, S.P.; data curation, A.K.; writing—original draft preparation, S.P., A.K., writing—review and editing, A.K.; visualization, M.S., X.C.; supervision, A.K.; project administration, M.S., X.C.; funding acquisition, A.G., M.S., X.C. All authors have read and agreed to the published version of the manuscript.
Funding
Strategic Priority Research Program of Chinese Academy of Sciences, Pan-Third Pole Environment Study for a Green Silk Road: XDA20060303; International Cooperation Project of the National Natural Science Foundation of China: 41761144079; Research Fund for International Scientists of National Natural Science Foundation of China: 42150410393; CAS PIFI Fellowship: 2021PC0002; K.C. Wong Education Foundation: GJTD-2020-14; Xinjiang Tianchi Hundred Talents Program: Y848041.
Institutional Review Board Statement
Not applicable.
Informed Consent Statement
Not applicable.
Data Availability Statement
All data used for the analysis are provided in the text.
Acknowledgments
The research funding from the Ministry of Science and Higher Education of the Russian Federation (Ural Federal University Program of Development within the Priority-2030 Program) is gratefully acknowledged: Grant number: FEUZ-2022-0031.
Conflicts of Interest
The authors declare no conflict of interest.
Appendix A
| Description | Characteristics | Value |
| System Design [20] | Modules pers string in subarray | 12 |
| Strings in parallel subarray | 53,744 | |
| Modules in subarray | 64,488 | |
| Strings in Voc at reference condition | 772.8 V | |
| Strings in Vmp at reference condition | 656.4 V | |
| Inverter [20] | Model: Yaskawa Soleectria Solar: SGI 750 XTMM | - |
| Total number of inverters | 22 | |
| DC-to-AC ratio | 1.21 | |
| Name plate DC capacity | 20 MWdc | |
| Total inverter capacity | 17 MWdc | |
| Maximum DC power | 0.78 MWdc | |
| Power used during operation | 3.71 kWdc | |
| Maximum DC voltage | 820 Vdc | |
| Maximum AC current | 1263.77 Adc | |
| Minimum MPPT DC voltage | 545 Vdc | |
| Maximum MPPT DC voltage | 820 Vdc | |
| Manufacturer | SunPower SPR-E19-310-COM | |
| Physical Characteristics | Material: Mono-c-Si | |
| Module length | 1.631 m | |
| Module width | 1 m | |
| Total irradiance | 1000 W/m2 | |
| Cell temperature | 25 °C | |
| Maximum power | 310.149 Wdc | |
| Maximum power voltage | 54.7 Vdc | |
| Maximum power current | 5.7 Adc | |
| Open circuit voltage | 64.4 Vdc | |
| Short circuit current | 6.0 Adc | |
| Lifetime and Degradation [15,56,57] | Annual DC degradation rate | 0.5%/year |
Figure A1 shows the module characteristics selected for the analysis available in the SAM program. The module was manufactured by an American energy sage company collaborating with the U.S. Department of Energy [57]. The material is used to develop the model technology is Mono-c-si, and the cost used to develop such technology is around 0.40 USD/Wdc [20] is obtained from the SAM program.

Figure A1.
Module characteristics at reference conditions from the SAM program.
Figure A1.
Module characteristics at reference conditions from the SAM program.

Furthermore, Figure A2 shows the inverter efficiency curve selected for the present study. Thus, Yaskawa Solectria Solar designed an American manufacturing company and the cost of an inverter obtained from the SAM program is 0.06 $/Wdc.

Figure A2.
Efficiency curve of the inverter obtained from the SAM program.
Figure A2.
Efficiency curve of the inverter obtained from the SAM program.

References
- Praveenkumar, S.; Gulakhmadov, A.; Agyekum, E.B.; Alwan, N.T.; Velkin, V.I.; Sharipov, P.; Safaraliev, M.; Chen, X. Experimental Study on Performance Enhancement of a Photovoltaic Module Incorporated with CPU Heat Pipe—A 5E Analysis. Sensors 2022, 22, 6367. [Google Scholar] [CrossRef] [PubMed]
- PraveenKumar, S.; Agyekum, E.B.; Velkin, V.I.; Yaqoob, S.J.; Adebayo, T.S. Thermal management of solar photovoltaic module to enhance output performance: An experimental passive cooling approach using discontinuous aluminum heat sink. Int. J. Renew. Energy Res. IJRER 2021, 11, 1700–1712. [Google Scholar]
- Andal, A.G.; PraveenKumar, S.; Andal, E.G.; Qasim, M.A.; Velkin, V.I. Perspectives on the Barriers to Nuclear Power Generation in the Philippines: Prospects for Directions in Energy Research in the Global South. Inventions 2022, 7, 53. [Google Scholar] [CrossRef]
- Agyekum, E.B.; PraveenKumar, S.; Alwan, N.T.; Velkin, V.I.; Shcheklein, S.E. Effect of dual surface cooling of solar photovoltaic panel on the efficiency of the module: Experimental investigation. Heliyon 2021, 7, e07920. [Google Scholar] [CrossRef]
- Agyekum, E.B.; PraveenKumar, S.; Alwan, N.T.; Velkin, V.I.; Shcheklein, S.E.; Yaqoob, S.J. Experimental Investigation of the Effect of a Combination of Active and Passive Cooling Mechanism on the Thermal Characteristics and Efficiency of Solar PV Module. Inventions 2021, 6, 63. [Google Scholar] [CrossRef]
- Agyekum, E.B.; PraveenKumar, S.; Eliseev, A.; Velkin, V.I. Design and Construction of a Novel Simple and Low-Cost Test Bench Point-Absorber Wave Energy Converter Emulator System. Inventions 2021, 6, 20. [Google Scholar] [CrossRef]
- Agyekum, E.B.; PraveenKumar, S.; Alwan, N.T.; Velkin, V.I.; Adebayo, T.S. Experimental Study on Performance Enhancement of a Photovoltaic Module Using a Combination of Phase Change Material and Aluminum Fins—Exergy, Energy and Economic (3E) Analysis. Inventions 2021, 6, 69. [Google Scholar] [CrossRef]
- Postoglu, D.; Öner, İ.V. A Comparison Between Fixed Solar Panel and Dual-Axis Solar Tracking System in Menderes District. Int. J. Innov. Res. Rev. 2021, 5, 32–38. [Google Scholar]
- Kumar, A.; Kumar, K.; Kaushik, N.; Sharma, S.; Mishra, S. Renewable energy in India: Current status and future potentials. Renew. Sustain. Energy Rev. 2010, 14, 2434–2442. [Google Scholar] [CrossRef]
- Kymakis, E.; Kalykakis, S.; Papazoglou, T.M. Performance analysis of a grid connected photovoltaic park on the island of Crete. Energy Convers. Manag. 2009, 50, 433–438. [Google Scholar] [CrossRef]
- Sundaram, S.; Babu, J.S.C. Performance evaluation and validation of 5MWp grid connected solar photovoltaic plant in South India. Energy Convers. Manag. 2015, 100, 429–439. [Google Scholar] [CrossRef]
- D’Adamo, I.; Falcone, P.M.; Gastaldi, M.; Morone, P. The economic viability of photovoltaic systems in public buildings: Evidence from Italy. Energy 2020, 207, 118316. [Google Scholar] [CrossRef]
- Bouacha, S.; Malek, A.; Benkraouda, O.; Arab, A.H.; Razagui, A.; Boulahchiche, S.; Semaoui, S. Performance analysis of the first photovoltaic grid-connected system in Algeria. Energy Sustain. Dev. 2020, 57, 1–11. [Google Scholar] [CrossRef]
- Aziz, A.S.; Tajuddin, M.F.N.; Adzman, M.R.; Mohammed, M.F.; Ramli, M.A.M. Feasibility analysis of grid-connected and islanded operation of a solar PV microgrid system: A case study of Iraq. Energy 2020, 191, 116591. [Google Scholar] [CrossRef]
- Pillai, G.; Naser, H.A.Y. Techno-economic potential of largescale photovoltaics in Bahrain. Sustain. Energy Technol. Assess. 2018, 27, 40–45. [Google Scholar] [CrossRef]
- Zou, H.; Du, H.; Brown, M.A.; Mao, G. Large-scale PV power generation in China: A grid parity and techno-economic analysis. Energy 2017, 134, 256–268. [Google Scholar] [CrossRef]
- Kazem, H.A.; Albadi, M.H.; Al-Waeli, A.H.A.; Al-Busaidi, A.H.; Chaichan, M.T. Techno-economic feasibility analysis of 1MW photovoltaic grid connected system in Oman. Case Stud. Therm. Eng. 2017, 10, 131–141. [Google Scholar] [CrossRef]
- Xu, L.; Wang, Y.; Solangi, Y.A.; Zameer, H.; Shah, S.A.A. Off-Grid Solar PV Power Generation System in Sindh, Pakistan: A Techno-Economic Feasibility Analysis. Processes 2019, 7, 308. [Google Scholar] [CrossRef]
- Alshare, A.; Tashtoush, B.; Altarazi, S.; El-khalil, H. Energy and economic analysis of a 5 MW photovoltaic system in northern Jordan. Case Stud. Therm. Eng. 2020, 21, 100722. [Google Scholar] [CrossRef]
- Agyekum, E.B. Techno-economic comparative analysis of solar photovoltaic power systems with and without storage systems in three different climatic regions, Ghana. Sustain. Energy Technol. Assess. 2020, 43, 100906. [Google Scholar] [CrossRef]
- Camilo, F.M.; Castro, R.; Almeida, M.E.; Pires, V.F. Economic assessment of residential PV systems with self-consumption and storage in Portugal. Sol. Energy 2017, 150, 353–362. [Google Scholar] [CrossRef]
- Adaramola, M.S. Techno-economic analysis of a 2.1kW rooftop photovoltaic-grid-tied system based on actual performance. Energy Convers. Manag. 2015, 101, 85–93. [Google Scholar] [CrossRef]
- Installed Capacity of Various Renewable Modes of Energy. Available online: https://pib.gov.in/Pressreleaseshare.aspx?PRID=1564039 (accessed on 22 August 2022).
- Renewable Energy Industry, Solar Energy Companies in India—IBEF. Available online: https://www.ibef.org/industry/renewable-energy (accessed on 22 August 2022).
- Hafez, A.Z.; Yousef, A.M.; Harag, N.M. Solar tracking systems: Technologies and trackers drive types—A review. Renew. Sustain. Energy Rev. 2018, 91, 754–782. [Google Scholar] [CrossRef]
- Qiu, L.; He, L.; Lu, H.; Liang, D. Systematic potential analysis on renewable energy centralized co-development at high altitude: A case study in Qinghai-Tibet plateau. Energy Convers. Manag. 2022, 267, 115879. [Google Scholar] [CrossRef]
- Abdelghani-Idrissi, M.A.; Khalfallaoui, S.; Seguin, D.; Vernières-Hassimi, L.; Leveneur, S. Solar tracker for enhancement of the thermal efficiency of solar water heating system. Renew. Energy 2018, 119, 79–94. [Google Scholar] [CrossRef]
- Gerra, D.D.; Iakovleva, E.V. Sun tracking system for photovoltaic batteries in climatic conditions of the Republic of Cuba. IOP Conf. Ser. Mater. Sci. Eng. 2019, 643, 012155. [Google Scholar] [CrossRef]
- Hoffmann, F.M.; Molz, R.F.; Kothe, J.V.; Nara, E.O.B.; Tedesco, L.P.C. Monthly profile analysis based on a two-axis solar tracker proposal for photovoltaic panels. Renew. Energy 2018, 115, 750–759. [Google Scholar] [CrossRef]
- Kumar, D. Mapping solar energy potential of southern India through geospatial technology. Geocarto Int. 2019, 34, 1477–1495. [Google Scholar] [CrossRef]
- Solar Resource Maps of India. Available online: https://solargis.com/maps-and-gis-data/download/india (accessed on 22 August 2022).
- Kamel, S.; Agyekum, E.B.; Adebayo, T.S.; Taha, I.B.M.; Gyamfi, B.A.; Yaqoob, S.J. Comparative Analysis of Rankine Cycle Linear Fresnel Reflector and Solar Tower Plant Technologies: Techno-Economic Analysis for Ethiopia. Sustainability 2022, 14, 1677. [Google Scholar] [CrossRef]
- Hernández-Moro, J.; Martínez-Duart, J.M. Analytical model for solar PV and CSP electricity costs: Present LCOE values and their future evolution. Renew. Sustain. Energy Rev. 2013, 20, 119–132. [Google Scholar] [CrossRef]
- Qasim, M.A.; Alwan, N.T.; PraveenKumar, S.; Velkin, V.I.; Agyekum, E.B. A New Maximum Power Point Tracking Technique for Thermoelectric Generator Modules. Inventions 2021, 6, 88. [Google Scholar] [CrossRef]
- OECD. Energy Technology Perspectives 2008: Scenarios and Strategies to 2050; Organisation for Economic Co-operation and Development: Paris, France, 2008. [Google Scholar]
- Income Tax Slab for FY 2022-23, FY 2021-22|Revised Income Tax Slabs, New & Old Tax Rates in India. Available online: https://cleartax.in/s/income-tax-slabs (accessed on 7 March 2022).
- Welcome to Commercial Taxes Department. Available online: https://apct.gov.in/apportal/AllActs/APVAT/APVATSchedules.aspx (accessed on 7 March 2022).
- National Institute of Public Finance and Policy. Sales Tax Systems In India: A Profile; National Institute of Public Finance and Policy: New Delhi, India, 1956; pp. 1–15. [Google Scholar]
- Jensen, A.R.; Sifnaios, I.; Furbo, S.; Dragsted, J. Self-shading of two-axis tracking solar collectors: Impact of field layout, latitude, and aperture shape. Sol. Energy 2022, 236, 215–224. [Google Scholar] [CrossRef]
- Morales Pedraza, J. Chapter 4—Current Status and Perspective in the Use of Coal for Electricity Generation in the North America Region. In Conventional Energy in North America; Morales Pedraza, J., Ed.; Elsevier: Amsterdam, The Netherlands, 2019; pp. 211–257. ISBN 978-0-12-814889-1. [Google Scholar] [CrossRef]
- Martín-Martínez, S.; Cañas-Carretón, M.; Honrubia-Escribano, A.; Gómez-Lázaro, E. Performance evaluation of large solar photovoltaic power plants in Spain. Energy Convers. Manag. 2019, 183, 515–528. [Google Scholar] [CrossRef]
- Shiva Kumar, B.; Sudhakar, K. Performance evaluation of 10 MW grid connected solar photovoltaic power plant in India. Energy Rep. 2015, 1, 184–192. [Google Scholar] [CrossRef]
- Hafeez, H.; Kashif Janjua, A.; Nisar, H.; Shakir, S.; Shahzad, N.; Waqas, A. Techno-economic perspective of a floating solar PV deployment over urban lakes: A case study of NUST lake Islamabad. Sol. Energy 2022, 231, 355–364. [Google Scholar] [CrossRef]
- Ahmed, N.; Naveed Khan, A.; Ahmed, N.; Aslam, A.; Imran, K.; Sajid, M.B.; Waqas, A. Techno-economic potential assessment of mega scale grid-connected PV power plant in five climate zones of Pakistan. Energy Convers. Manag. 2021, 237, 114097. [Google Scholar] [CrossRef]
- Ud-Din Khan, S.; Wazeer, I.; Almutairi, Z.; Alanazi, M. Techno-economic analysis of solar photovoltaic powered electrical energy storage (EES) system. Alex. Eng. J. 2022, 61, 6739–6753. [Google Scholar] [CrossRef]
- Uddin, M.N.; Biswas, M.M.; Nuruddin, S. Techno-economic impacts of floating PV power generation for remote coastal regions. Sustain. Energy Technol. Assess. 2022, 51, 101930. [Google Scholar] [CrossRef]
- Zhang, Y.; Lundblad, A.; Campana, P.E.; Benavente, F.; Yan, J. Battery sizing and rule-based operation of grid-connected photovoltaic-battery system: A case study in Sweden. Energy Convers. Manag. 2017, 133, 249–263. [Google Scholar] [CrossRef]
- Martín-Pomares, L.; Martínez, D.; Polo, J.; Perez-Astudillo, D.; Bachour, D.; Sanfilippo, A. Analysis of the long-term solar potential for electricity generation in Qatar. Renew. Sustain. Energy Rev. 2017, 73, 1231–1246. [Google Scholar] [CrossRef]
- Shabani, M.; Dahlquist, E.; Wallin, F.; Yan, J. Techno-economic impacts of battery performance models and control strategies on optimal design of a grid-connected PV system. Energy Convers. Manag. 2021, 245, 114617. [Google Scholar] [CrossRef]
- Said, Z.; Mehmood, A.; Waqas, A.; Amine Hachicha, A.; Loni, R. Central versus off-grid photovoltaic system, the optimum option for the domestic sector based on techno-economic-environmental assessment for United Arab Emirates. Sustain. Energy Technol. Assess. 2021, 43, 100944. [Google Scholar] [CrossRef]
- Li, C. Economic and performance evaluation of grid-connected residential solar photovoltaic systems in Northwest China. Energy Sources Part Recovery Util. Environ. Eff. 2019, 44, 5473–5489. [Google Scholar] [CrossRef]
- Industrial Electricity Prices in India and Selected Countries, 2005–2019—Charts—Data & Statistics—IEA. Available online: https://www.iea.org/data-and-statistics/charts/industrial-electricity-prices-in-india-and-selected-countries-2005-2019 (accessed on 13 March 2022).
- India—Cost of State Electricity Supply 2019|Statista. Available online: https://www.statista.com/statistics/808201/india-cost-of-state-electricity-supply/ (accessed on 12 March 2022).
- Home|Department of Personnel & Training|MoPP&P|GoI. Available online: https://dopt.gov.in/ (accessed on 22 August 2022).
- The Constitution (Seventh Amendment) Act, 1956|National Portal of India. Available online: https://www.india.gov.in/my-government/constitution-india/amendments/constitution-india-seventh-amendment-act-1956 (accessed on 22 August 2022).
- Jordan, D.C.; Kurtz, S.R. Photovoltaic degradation rates—An Analytical Review. Prog. Photovolt. Res. Appl. 2013, 21, 12–29. [Google Scholar] [CrossRef]
- Our Team|EnergySage. Available online: https://www.energysage.com/about-us/team/ (accessed on 14 March 2022).


Publisher’s Note: MDPI stays neutral with regard to jurisdictional claims in published maps and institutional affiliations. |
© 2022 by the authors. Licensee MDPI, Basel, Switzerland. This article is an open access article distributed under the terms and conditions of the Creative Commons Attribution (CC BY) license (https://creativecommons.org/licenses/by/4.0/).