Article

An Empirical Framework to Sustain Value Generation with Project Risk Management: A Case Study in the IT Consulting Sector

by
Raffaele Testorelli
* and
Chiara Verbano
Department of Management and Engineering, University of Padova, Stradella S. Nicola 3, 36100 Vicenza, Italy
*
Author to whom correspondence should be addressed.
Sustainability 2022, 14(19), 12117; https://doi.org/10.3390/su141912117
Submission received: 6 September 2022 / Revised: 16 September 2022 / Accepted: 18 September 2022 / Published: 25 September 2022

Abstract

:
Projects are the main vehicles of innovation and growth and are characterised by inherent uniqueness and uncertainty, particularly in the current complex, dynamic, and highly uncertain business environment. In most types of organisations, much effort is expended on dealing with risk-related issues in order to ensure project success. For this reason, there is growing interest from both academia and practitioners in Project Risk Management (PRM) as a value generation process for different stakeholder groups, particularly to understand what value can be generated in projects through PRM and how value generation can be improved, while considering contextual factors and the impacts on the individual, organisational, and societal levels. This study analyses value generation through PRM in a pilot case study in the IT consulting sector. From the analysis of the results, it is possible to grasp preliminary indications on how to promote value generation in projects through PRM; in addition, the integration of ecological and social impacts into the notion of value generation through PRM provides a perspective on the sustainability orientation of projects. This work contributes to filling a gap in the literature and provides guidance to organisations on how to tailor the PRM system to maximise value generation in projects to different stakeholder groups.

1. Introduction

Risk can be defined as the effect in terms of positive or negative deviation from the expected outcome resulting from uncertainty [1]. Therefore, Risk Management (RM) supports organisations in achieving their target objectives, reducing potential losses, and exploring new opportunities in an environment full of uncertainties [1,2]. All types of organisations are taking an increasing interest in RM, and many efforts are expended on dealing with risk-related issues [3].
Furthermore, recent directions of international standards in RM are giving increasing relevance to the benefits generated through RM, both mitigating negative risk and fostering positive risk; therefore, RM should be considered as a value generation process [1,4,5]. These considerations are even more important in the context of projects that are the main vehicles of innovation and growth but, at the same time, are characterised by inherent uniqueness and uncertainty, particularly in the current complex, dynamic, and highly uncertain business environment [6,7,8].
The RM stream that deals with the management of risks in projects is called Project Risk Management (PRM). PRM is a systematic process that aims to identify and manage risk, implementing systems and procedures to identify, analyse, evaluate, and address risks [9,10]. The goal of PRM is to mitigate the probability of occurrence and the impact of negative risks (threats), as well as to improve the probability of occurrence and the impact of positive risks (opportunities) in the context of projects [11,12].
In recent years, there has been growing interest, both from academics and practitioners, in value generation in projects for multiple stakeholders, at the individual, organisational, and society levels, where risks and opportunities, in addition to the creation of products and/or services, are managed as well [13,14,15]. However, while international standards have increasingly considered PRM as a value generation process, the empirical literature reports some conflicting results; for example, in connection with the adoption of a more or less formalised PRM process, a proactive or reactive approach to PRM, the degree of formal, open, and transparent communication about risk [13], suggesting that the PRM system has been analysed in different contexts while adopting specific and diverse perspectives and levels of analysis. In fact, while Elkington and Smallman [16] claim that PRM is essential for project success and that the most successful projects have implemented PRM, the criteria to choose between practices, activities, and tools and the benefits obtained should be better understood [17].
For all these reasons, there is growing interest from both academia and practitioners in PRM as a value generation process [13,18], particularly to understand what value can be generated and how value generation can be enhanced [13,19], considering contextual factors [13,20,21] and the impacts on the overall organisation [18,22,23].
This work contributes to filling a gap in the PRM literature, addressing the contradictory findings reported, giving guidance to organisations on how to tailor the PRM system to maximise value generation in projects for different stakeholder groups, and providing indications to researchers on future directions.

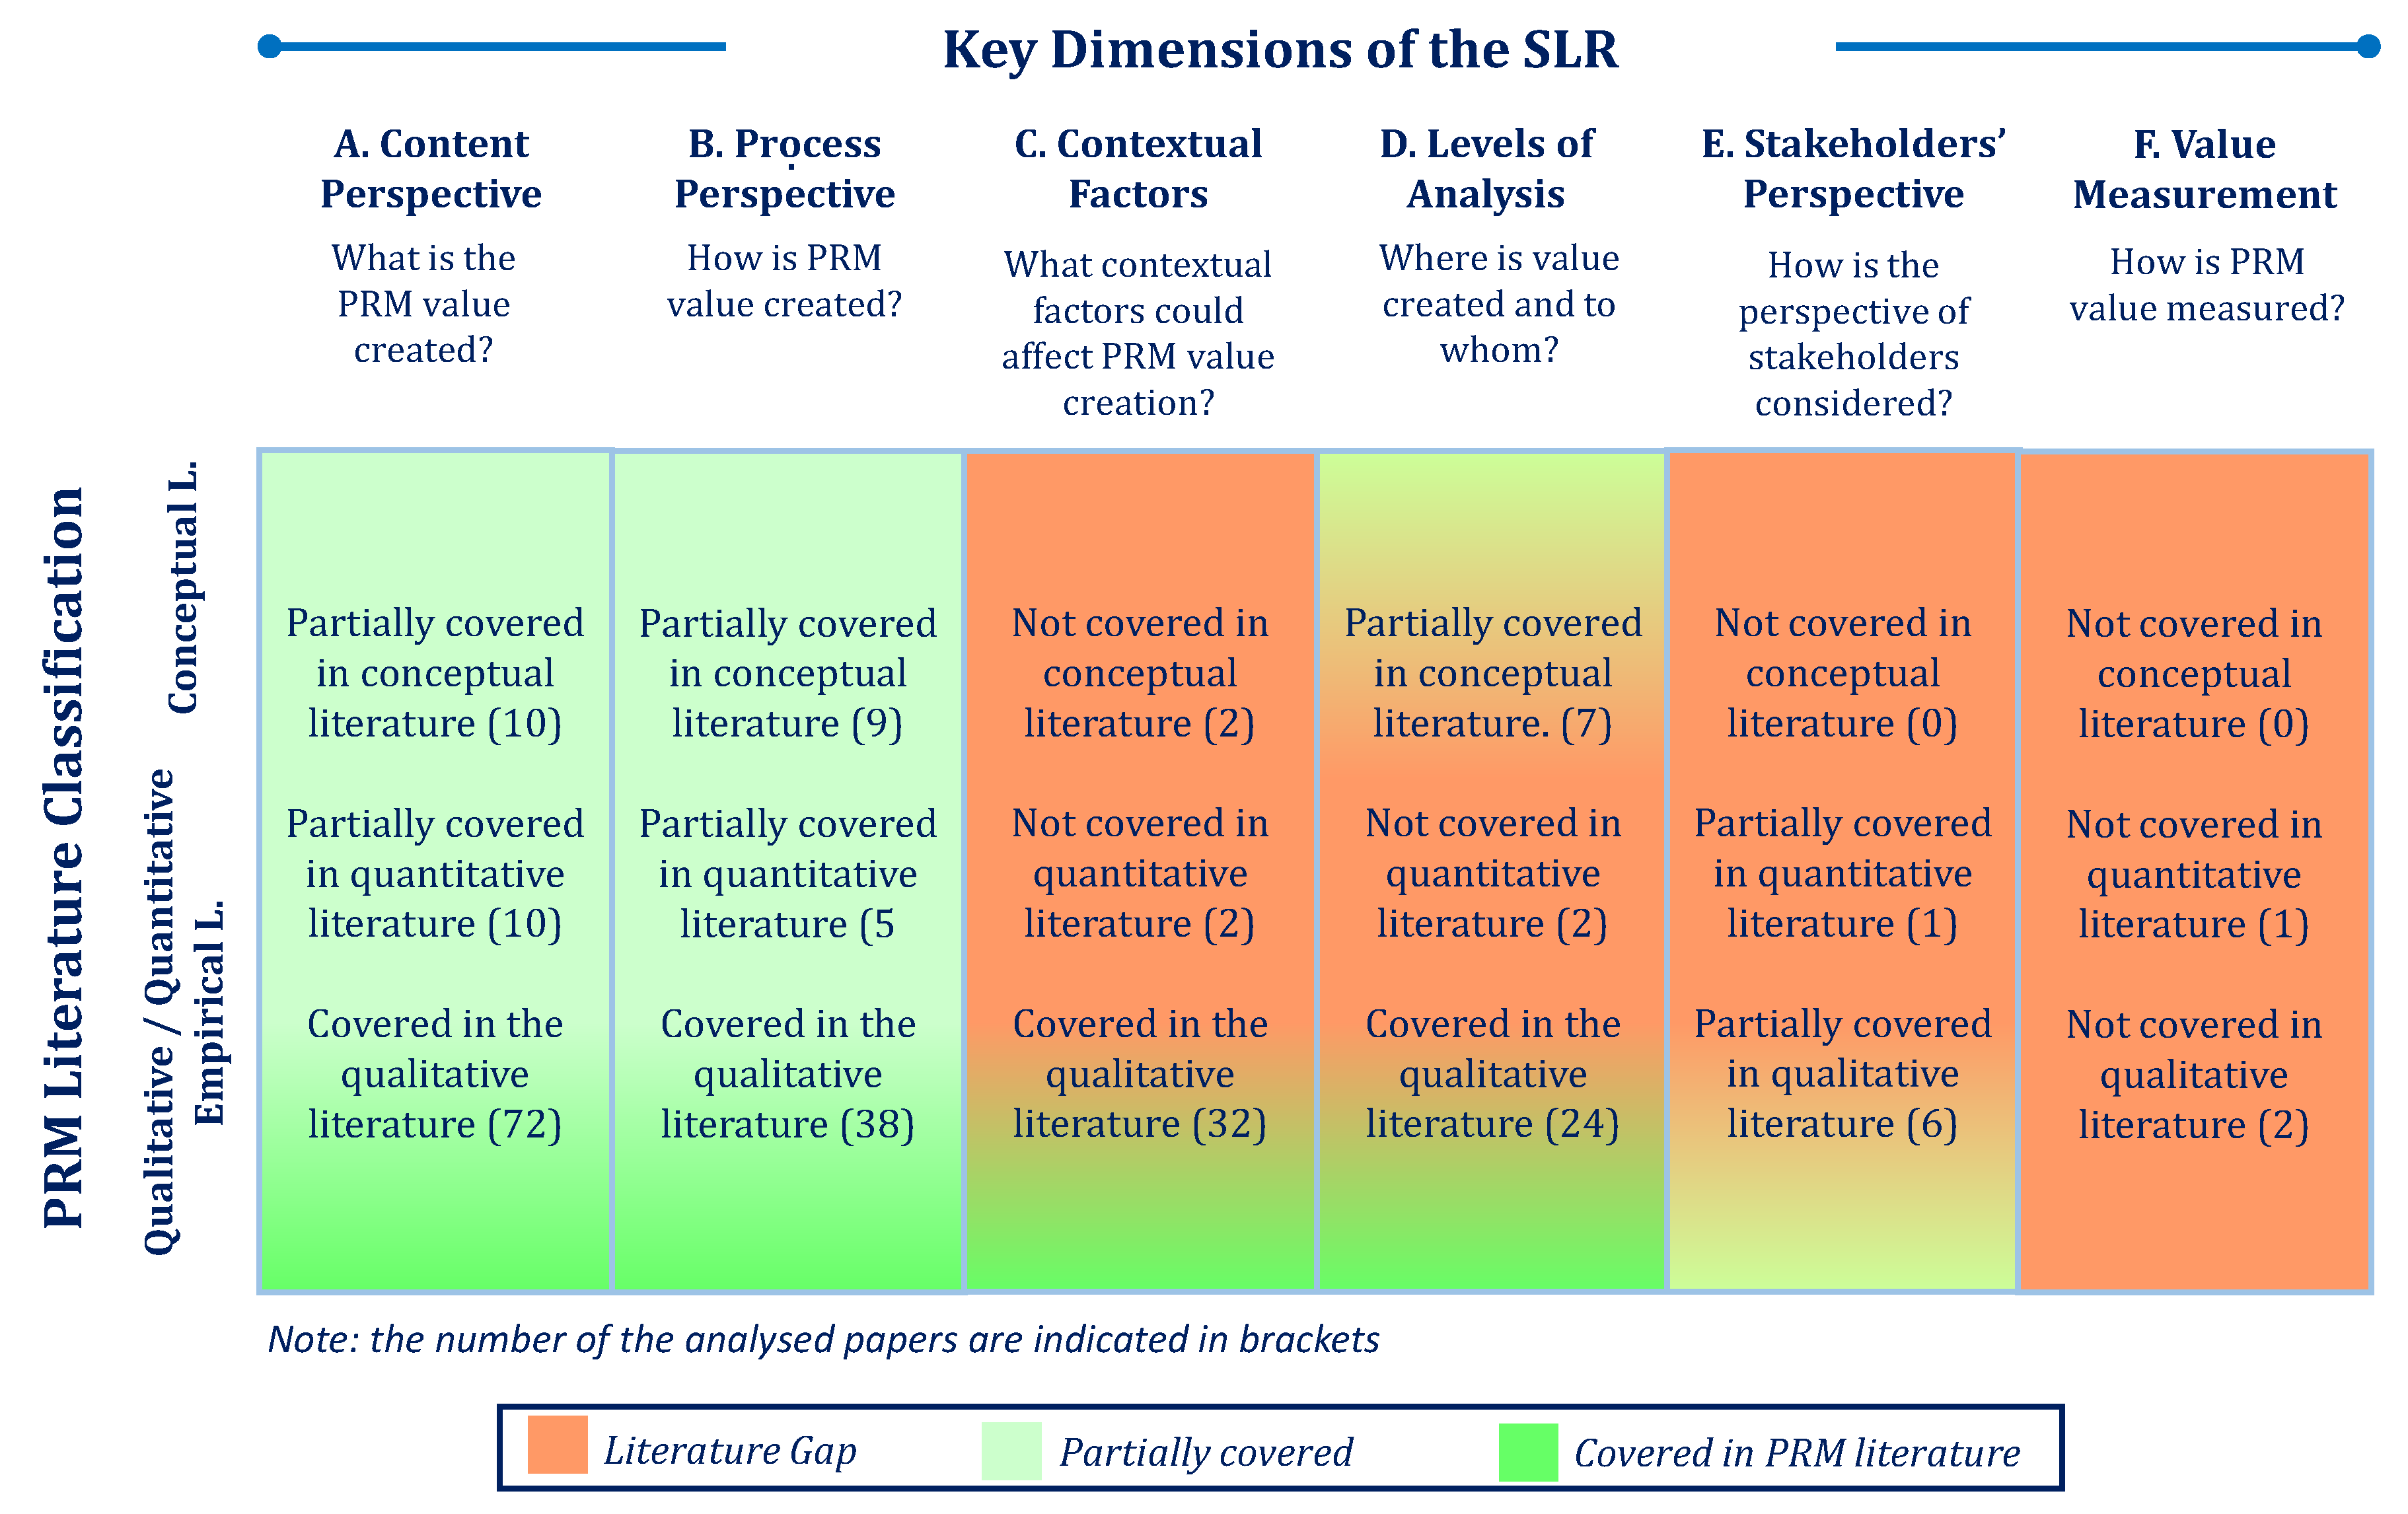
2. Main Concepts and Literature Review

Considering that there is no consensus among researchers on how to define and measure the value generated through PRM, the following definitions have been used in the research:
  • PRM economic value: It is defined as the ratio between the economic benefits generated through PRM for a stakeholder or a group of stakeholders and the cost of PRM implementation [24,25,26,27];
  • PRM intangible benefit: It is defined as the utility of the additional intangible benefits generated through PRM, as perceived by a stakeholder or a group of stakeholders [13,24,28];
  • PRM value: It is defined as the total value generated through PRM for a stakeholder or a group of stakeholders and includes both PRM economic value and PRM intangible benefit;
  • PRM value generation: It is the process of value generation through PRM. The generation of PRM value depends on the relative amount of value that is subjectively realised by a target user, who is the focus of value generation. The generation of PRM value is context-specific and depends on the level of analysis, whether an individual, an organisation or a society [15,24].
A systematic literature review (SLR) on value generation through PRM was performed between July and November 2020 based on the guidelines proposed by Macpherson and Holt [29], and Tranfield, Denyer, and Smart [30] and adapted to this specific research. To build a database (DB) with the relevant studies available in the literature on the topic, the two most widespread literature DBs were used, particularly Elsevier’s Scopus and the Web of Science Core Collection by Clarivate Analytics [31,32], using different combinations of the following keywords (title/topic): Project Risk Management, Project Management, Risk Management, Value Creation, Value Generation, Value Management, Benefits Management, Benefits Realisation, Performance, Agile. The research was limited to articles and reviews and research categories related to Management, Engineering, Business, and Economics; moreover, Q1, Q2, Q3 (quartiles ranking) journals in WoS, and Q1 and Q2 in Scopus were included. Finally, 116 articles were identified and published during the period 2004 to 2020, revealing a growing and global interest in the topic.
For the analysis of the identified literature, a framework has been designed that includes six dimensions of analysis (Figure 1). In particular, four dimensions of analysis have been considered as suggested by [15]: (a) the content of value generation (content perspective), (b) the value generation process (process perspective), (c) the context of value generation (contextual factors), and (d) the levels of analysis (individual, organisational, societal levels). Furthermore, two other dimensions of analysis have been considered, as suggested by International Standards (see, for example, [1]) and many authors (see, for example, [24], particularly (e) the targets of value generation (stakeholders’ perspective), and (f) the measurement of value generated through PRM (value measurement), due to the specific objectives of the research.
From the SLR, it emerges that 83% of the analysed literature is empirical, providing contradictory results regarding the nature of the value generated through PRM (content perspective) and the ways it is generated in terms of practices, activities and tools (process perspective). The results suggest that the context in which the projects are conducted (e.g., in terms of the business sector, company size, process/project organisation), the maturity level of the PRM system adopted, defined as the extent to which risk management is embedded within the organisation [33], the level of analysis considered (e.g., project, company, customer, business ecosystem, societal and environmental levels), and the perspective adopted by the specific stakeholder, influence both the value generation process and the generated value. Moreover, the studies analysed do not offer adequate tools to measure the economic value and additional intangible benefits generated through PRM.
Another important point relates to the scope and levels adopted for these analyses. About 40% of the analysed literature considers only the project level, while a lower number of papers (23%) extend the analysis to at least two levels of analysis; more frequently, they are the project level (including the individual level related to project team members) and the customer level (including customers, and customers of customers); alternatively, they are the project level and the company level (including the mesolevels related to the program and portfolio levels). Only a few papers extend the analysis to the business ecosystem level (including suppliers, R&D partners, and business partners) and to the society level as a whole (including ecological and social impacts).
Despite these results, it is fundamental to understand who are the expected and actual receivers of the value generated through PRM and how important the specific type of value is to the receivers. In other terms, it is necessary to understand which stakeholder groups’ PRM generates value and how this value is perceived by the stakeholders taking into account their conflicting interests and subjective value systems. For example, the value generated by a project may be captured by the organisation or society; conversely, a project may be able to capture solely the value created by a well-intentioned public initiative initiated at the societal level [15]. However, it emerges from the SLR that a limited number of papers adopt diverse stakeholders’ perspectives. Finally, the value generated at one level of analysis may move to other levels of analysis according to a phenomenon called value slippage [15].
In order to foster value generation through PRM, it is necessary to measure the value generated; however, very few papers provide suggestions on how the value generated through PRM can be measured, while a relevant number of them indicate that the measurement of the value generated is an important direction to advance research in this field (see, e.g., [24,34,35,36]).
Based on the results obtained from the SLR, the six dimensions used for the systematic literature review can be mapped into three main elements:
  • Context in which PRM has been implemented includes the contextual factors and considers the stakeholders’ perspectives;
  • PRM implementation considers the PRM activities, practices, and tools adopted in the project (process perspective) [33,37], and the project risks and opportunities analysed on different levels of analysis and considering the stakeholders’ perspective;
  • PRM value generated considers the type of value generated through PRM (content perspective) and the measure of the value generated (value measurement), while considering the recipients of value generation (stakeholders’ perspective) and the level of analysis (individual, organisational, societal levels).
Finally, it should be noted that the definition of PRM value generation integrates the notion of economic, social, and environmental sustainability. In fact, the economic value and the intangible benefit for the environment and society at large generated through PRM are considered in the evaluation of the PRM value generated.

3. Objectives and Methodology

Given the research gaps that emerged from the literature review, the aim of the study is to analyse and promote value generation through PRM in its specific project contexts, considering the content and process of value generation through PRM, the contextual factors, the different levels of analysis, the diverse perspectives of stakeholders and the issue of value measurement.
In more detail, an empirical framework of analysis has been designed based on the results emerging from the SLR to respond to the following research questions:
  • RQ1a: What economic value and intangible (not monetary) benefits are generated through PRM for stakeholders?
  • RQ1b: How can the economic value and the intangible benefit generated through PRM be measured?
  • RQ2: How do contextual factors impact PRM value generation?
  • RQ3: How can PRM be improved to increase the value generated?
The objective of this research is, therefore, to answer the defined RQs; the case study methodology has been adopted, given the exploratory and explanatory nature of the objective of this research [38]. The unit of analysis is the PRM implementation in the specific project, with a focus on the different salient aspects of the adopted PRM system.
At the same time, the case study analysis will allow testing of the validity of the framework developed to support value generation with PRM.

3.1. Empirical Framework

The empirical framework of analysis, based on the results obtained from the SLR, includes three main elements (Figure 2) linked to the key dimensions of PRM value generation (Figure 1):
  • Context in which PRM has been implemented, including the characteristics of the company, the project, the project stakeholders, and the respondents;
  • PRM implementation, particularly the maturity level of the PRM system adopted (activities, practices, and tools) [33,37], project risks and opportunities;
  • PRM value generated for stakeholders, both in terms of actual/potential PRM economic value and PRM intangible benefit.

3.2. Case Selection

The case selection has been performed adopting the following criteria:
  • A project developed by a project-oriented company operating in a business sector where the project management practices are particularly relevant (e.g., consulting sector);
  • A project where PRM has been implemented;
  • A project that involves both internal and external stakeholders (e.g., performed for a customer company);
  • A project finished for at least 6 months, to consider the PRM value generated during the whole project life cycle;
  • Availability and knowledge of the Project Manager and at least another project stakeholder.
For this case study, a project performed by an IT consulting company based in Italy was selected. To protect the confidentiality of the company, in the rest of the article, the company will be called Alpha.

3.3. Data Collection and Analysis

A questionnaire has been designed to collect quantitative and qualitative information, divided into 3 parts and 10 sections. To ensure internal validity through triangulation and increase data reliability [39], in-depth interviews have been conducted with two respondents (project stakeholders). The detailed contents of the questionnaire are reported in Appendix A.
Furthermore, qualitative and quantitative methods have been applied for data analysis. In particular, to measure the economic value generated through PRM, the PRM economic value index (PVI econ) has been defined as the ratio between the economic value generated for stakeholders both by managing project risks and fostering opportunities and the costs of PRM implementation. The PVI econ index has been designed based on previous literature [24,40,41] and has been improved, including the economic impact of positive risks and the adoption of perspectives from diverse stakeholders (see Appendix B).
If the value of PVI econ > 1, this implies that the economic benefits have been greater than the cost paid for PRM. On the other hand, a value of PVI econ ≤ 1 implies that the economic benefits have been equal to or lower than the cost paid for PRM. Thus, the higher the value of PVI econ, the higher the PRM economic value generated.
To measure the PRM intangible benefit, a utility function has been defined based on a multi-attribute utility function [42] and improved by adopting the perspectives of the different stakeholders (see Appendix B).
The value of U intang can range from 1 (the perceived value of the intangible benefit is very low) to 7 (the perceived value of the intangible benefit is very high). The higher the value of U intang, the higher the intangible benefit perceived by stakeholders.

4. Findings

4.1. Context

Alpha is an IT consulting company based in Italy and is organised according to a combined model (both by projects and by processes); it employs 22 people, and it had a turnover of EUR 2 million in 2019. The main activity of Alpha is to support its client companies operating in the manufacturing sector in their path of digital transformation, adopting methodologies such as Design Thinking and Agile to conceive innovative solutions.
The project analysed has been carried out by Alpha for a customer company operating in the fashion-branded eyewear industry. The project aimed to improve both the efficiency and reliability of the cost estimation process for new products, using process digitalisation and the management of data related to production costs; it led to the design and implementation of a new cost estimation software application. The project cost EUR 70000.00 and involved five people for 8 months (1 Project Manager, 1 Software Team Leader, 2 Software Developers, 1 UX Designer).
Two project stakeholders were interviewed, one internal to the project team (Project Manager), and the other external to the project team (Alpha’s CEO) (Table 1).

4.1.1. Respondents’ Value System

To evaluate the subjective value system of the respondents, various sets of closed questions were asked to collect their subjective interest in different groups of benefits on a 7-point Likert-type scale from one (very low interest) to seven (very high interest). Therefore, an array of weights has been deducted for both respondents [28] (Figure 3).
The results indicate that both respondents consider the most important benefits those generated for the customer company and the project team (7.0 for both respondents); also, the strategic benefits to Alpha and the benefits to project management are considered relevant (7.0 for the CEO, 6.0 for the Project Manager).
On the contrary, some discrepancies emerged in relation to other dimensions of the value system: The Project Manager demonstrated to be interested in the organisational benefits to Alpha, which were not particularly relevant to the CEO (6.0 for the Project Manager, 4.0 for the CEO); in contrast, the CEO demonstrated great interest in the benefits for the business ecosystem that were not particularly relevant to the Project Manager (6.0 for the CEO, 4.0 for the Project Manager). These discrepancies can be explained by the different organisational roles, perspectives, and levels of experience of the respondents within Alpha (Figure 3).

4.1.2. Project Complexity

To evaluate subjective perceptions of the respondents about the project complexity, they were asked to classify the following project dimensions on a 7-point Likert type scale from one (very low) to seven (very high), according to [43,44,45], particularly the levels of (1) uncertainty and instability, (2) uniqueness and novelty, (3) criticality of stakeholders, and (4) dynamic complexity (Figure 4). Each dimension has been evaluated on the basis of various subdimensions.
The results indicate that the respondents had fairly similar perceptions about the overall level of project complexity that was considered medium-low (3.15 for the Project Manager, 3.33 for the CEO).
In particular, both respondents perceived a high level of difficulty in the management of stakeholders, mainly due to the variety of perspectives of external stakeholders and the lack of experience of the project team with the parties involved (5.3 for both respondents).
In addition, both respondents perceived a medium-high level of uniqueness and novelty (3.5 for the Project Manager, 4.0 for the CEO), except for the subdimensions multidisciplinarity of the required knowledge (7.0 for the Project Manager, 5.0 for the CEO) and quality levels of requirements (1.0 for the Project Manager, 5.0 for the CEO).
Finally, the level of uncertainty and instability was perceived as low (2.4 for the Project Manager and 2.8 for the CEO), except for the project scope creep, which turned out to be an element of project instability (6.0 for both respondents). Both respondents perceived a very low level of dynamic uncertainty (1.0 for both respondents), revealing that the project was not perceived as influenced by the external environment.

4.1.3. Stakeholders Analysis

The respondents have identified two external project stakeholders in the customer company that were relevant to the project, particularly the Head of Product Engineering and the Head of Master Data and Cost Estimation.
Therefore, the Project Manager, responsible for the management of stakeholders, was asked to classify the identified stakeholders on a 7-point Likert type scale from one (very low) to seven (very high) in terms of their (1) interest in the project, measured by the degree to which they will be active or passive, (2) their attitude to the project, measured by the degree to which they will ‘back’ (support) or ‘block’ (resist), and (3) their power or ability to influence the project, derived from their positional or resource power in the organisation, or from their credibility as a leader or expert [46].
The score obtained led to the stakeholders map (Figure 5), indicating that the identified stakeholders can be classified into two different groups, particularly (1) the group of saviours, including Alpha’s CEO and the Head of Master Data and Cost Estimation in the customer organisation, whom both demonstrated a high level of interest in the project and a positive attitude and influence; and (2) a sleeping giant represented by the Head of Product Engineering in the customer organisation who demonstrated a positive attitude, occasionally influential or passive, and a low level of interest in the project. The three project stakeholders reported on the map were perceived to have fairly similar power to influence the project.

4.2. PRM Implementation

PRM was implemented in the project through an informal process, as part of the project management activities, with the support of basic PRM techniques; the Project Manager was responsible for PRM. The project team and Alpha’s CEO actively participated in PRM activities; on the contrary, the external project stakeholders were not involved.
Project risks have been identified and tracked with the support of a risk register and evaluated through a qualitative risk analysis using a probability and impact matrix. Risk response planning and implementation activities have been carried out using a proactive approach to risk management, and the status of risks has been continuously monitored. The overall implementation of PRM in the project corresponds to a maturity level three labelled ‘defined’, according to the Risk Management Maturity Model [33].
It should be noted that Alpha’s CEO demonstrated strong commitment and clear sponsorship of PRM and that the Project Manager facilitated a collaborative teamwork environment and open and transparent communication on the status of project risks within Alpha.
During interviews, quantitative and qualitative information on identified and/or encountered risks has been collected, including risk type, risk sources, risk responses, stakeholders involved, risk evaluation before and after the implementation of risk responses, and actual impacts of risks in terms of losses and opportunities captured. In particular, three main risks have been identified through PRM: a strategic risk, an operative risk, and a technical risk (Table 2).
The strategic risk was related to a possible misalignment of the project results with the project objectives and the goals and expectations of the customer company. The source of strategic risk was a low level of awareness of the client’s company about its own needs, which generated uncertainty about the scope of the project. The strategic risk has been identified, mitigated, and actually encountered during the project. Indeed, due to the risk responses that have been implemented by the Project Manager, Alpha has been shielded from the risk impact; particularly, the Project Manager solicited formal client decisions at the critical decision points during the project life cycle. On the contrary, the customer company has been negatively impacted by the strategic risk, and the changes in project scope generated additional costs for the customer company and an additional business opportunity for Alpha (a new sprint has been added to the project).
The operative risk was related to a possible misalignment between the project requirements and the functionalities implemented in the software application. The source of the operative risk was a potential misunderstanding of the project requirements by the project team, which could eventually lead to inadequate functionalities implemented in the software application. The operative risk has been identified, mitigated, and actually encountered during the project, leading to additional costs for Alpha.
Finally, the technical risk was related to the potential technical difficulties related to the integration of the new software application with the existing ICT applications of the customer company. The source of technical risk was an inadequate level of technical analysis performed before the start of the project. The technical risk has been identified and fully mitigated by further technical analysis.

4.3. PRM Value Generation

4.3.1. PRM Economic Value

Alpha paid for the cost of PRM implementation as part of project management activities. Indeed, during the project life cycle, Alpha invested about 20% of the effort of the Project Manager in PRM, corresponding to a cost of about EUR 3000.00 (4.3% of the project budget). The customer company was not involved in PRM, except for the time spent in the meetings scheduled with Alpha to manage the issues related to the strategic risk, which actually led to a project scope creep and an additional cost to the customer company (corresponding to EUR 1000.00).
The overall PRM economic value, which considers the value generated for all the stakeholders, is equal to PVI econ = 5.50, which means that despite the small investment in PRM, the economic value generated is significantly high, even if it is unevenly distributed between stakeholders. In fact, Alpha captured 60% of the PRM economic value generated, and the customer company captured the remaining 40%; the stakeholders at the other levels of analysis did not capture any economic value (Figure 6).
Alpha captured the business opportunity generated by the management of the strategic risk, which led to new activities and a project extension (economic value of the opportunity: EUR 10,000.00). PRM has also generated economic value for the customer company, despite the extra cost generated by the strategic risk; in particular, PRM has mitigated the technical risk that could lead to an impact in terms of additional internal activities for the customer company related to the integration of existing applications with the new application developed by Alpha. PRM did not generate economic value for the business ecosystem and society at large due to the nature of the project.
Finally, the management of the operative risk did not generate value due to the fact that it led to additional project costs. This extra work could be avoided by better managing stakeholders.

4.3.2. Additional PRM Intangible Benefit

Respondents were asked various sets of closed questions about their perceptions of the intangible benefit actually obtained through PRM on a 7-point Likert-type scale (Figure 7).
The total intangible benefit, which considers all stakeholders, is equal to U intang = 3.74, which means that despite the small investment in PRM, the generated intangible benefit has been perceived as medium-high. The results indicate that the intangible benefit has been generated particularly at the customer level, leading to increased customer satisfaction and greater customer trust (6.0 for the Project Manager, 5.0 for the CEO); at the project management level, particularly in terms of better project alignment with the overall business strategy, improved planning and forecasting, better respect of the project schedule, budget, and scope, and improved decision making (5.4 for the Project Manager, 5.2 for the CEO); and also at the project team level, in terms of improved team performance, higher team skills and capabilities in PRM, and greater team satisfaction and morale (4.6 for the Project Manager, 5.0 for the CEO).
Furthermore, respondents also perceived that a relevant intangible strategic benefit had been generated for Alpha (3.3 for the Project Manager, 3.6 for the CEO), particularly in terms of improved achievement of strategic goals, greater overall mitigation of business risk level, improved brand recognition, and greater internal stakeholders’ satisfaction. In addition, the organisational benefit to Alpha has been perceived as less relevant (2.6 for the Project Manager, 3.6 for the CEO). Finally, PRM did not generate PRM intangible benefits for the business ecosystem and society at large.
The overall PRM intangible benefit generated according to the subjective value system of the respondents is medium-high (3.54 for the Project Manager, 3.94 for the CEO). All the aforementioned analyses are performed with PROValue ©, software specifically developed by the authors of this research to support data analysis.

5. Discussion

From the analysis of PRM in the pilot case, it was possible to grasp interesting evidence on how to generate value through PRM. First, the results indicate that PRM has created economic value at two different levels of analysis for the related stakeholders, particularly at the company Alpha level (12.9% of the project budget) and at the customer company level (10.7% of the project budget) (Figure 8). It should be noted that PRM economic value has been generated in different ways.
In fact, the PRM economic value at the customer company level has been generated by reducing negative risks, especially those risks that are related to the internal organisation (operative risk) and technical issues (technical risk). In contrast, the PRM value at the company Alpha level has been generated through a positive risk (opportunity), and particularly fostering the strategic risk related to the uncertainty about the project goals and scope due to conflicting interests among external stakeholders and an insufficient level of awareness about their own needs. The PRM system protected Alpha from the impact of the strategic risk while generating an additional business opportunity; however, it did not protect the customer company from its negative impact. It should be noted that if external stakeholders had been involved in PRM, they would have been protected by the PRM system, and Alpha would not capture the new business opportunity. Consequently, the results suggest that value generation through PRM depends on the stakeholder involvement in PRM; particularly, in the project analysed, PRM moved economic value from external stakeholders at the customer company level towards the internal stakeholders at the company Alpha level.
Furthermore, PRM has also generated relevant intangible benefit, particularly at the project management level, in terms of better project alignment with the overall business strategy, improved planning and forecasting, better respect of the project schedule, budget and scope, and better decision-making; at the project team level, in terms of improved team performance, higher team skills and capabilities in PRM, and higher team satisfaction and morale; at the customer level, leading to increased customer satisfaction and greater customer trust; and finally to Alpha, in terms of improved brand recognition, better achievement of strategic goals, greater satisfaction of internal stakeholders, and lower overall business risk. Alpha’s CEO has also perceived the organisational benefits for Alpha as relevant. In contrast, PRM did not generate an intangible benefit for the business ecosystem and society at large, including ecological and social impacts, revealing a weak orientation of the project towards sustainability due to the nature of the project itself.
Finally, it should be noted that the value generated through PRM has been positively influenced by the strong commitment of the CEO and his clear sponsorship of PRM, although limited to the stakeholders internal to Alpha and to the deep level of knowledge of the Project Manager on PRM.
In order to foster PRM value generation in the analysed project, PRM could also be extended to include the external stakeholders (at the customer company level). In this scenario, the PRM system would also have protected external stakeholders from the impact of the strategic risk; consequently, Alpha would not be able to capture the business opportunity, but PRM would have generated a higher and more valuable PRM intangible benefit at the customer company level.
From the analysis of the results, preliminary indications emerged on how to foster value generation in projects through PRM, in particular:
  • Adopting a multilevel approach in the analysis of the value generated through PRM, considering that economic value can slip from one level of analysis to another;
  • Carefully evaluating which stakeholders have to be involved in PRM, considering this aspect influences the generation of both PRM economic value and PRM intangible benefit;
  • Mapping all relevant stakeholders at the beginning of the PRM process and defining appropriate strategies to manage the different stakeholder groups. In fact, stakeholders are of primary relevance in the generation of PRM value and could be sources of project risk (particularly ‘sleeping giants’);
  • Analysing the value system of the respondents, considering that the value system influences the perceived level of PRM intangible benefit.

6. Conclusions

This study analyses value generation through PRM in a case study in the IT consulting sector while testing the validity of the empirical framework that has been designed to respond to the research questions.
From the analysis of PRM in the selected case, it was possible to grasp interesting evidence on value generation through PRM. Particularly, the results indicate that: (1) stakeholders have a fundamental role in PRM value generation; (1) PRM generates economic value for stakeholders at different levels of analysis; (3) PRM can move economic value from the outside to the inside of the PRM scope while creating opportunities or negative impacts for different stakeholders; (4) PRM generates relevant intangible benefit particularly at the project management level, at the project team level, at the customer company level, and at the company level; (5) the PRM intangible benefit has been influenced by the value systems of respondents.
Furthermore, from the analysis of the results, some preliminary indications of general validity emerged on how to foster value generation in projects through PRM, particularly, (1) adopting a multilevel approach in the analysis of the value generated; (2) considering the scope of PRM, in terms of which project stakeholders have to be involved in PRM; (3) mapping all relevant stakeholders groups at the beginning of the PRM process and defining the most appropriate strategies to manage them; (4) considering the diverse value systems of the respondents, while evaluating the PRM intangible benefit.
This work contributes to filling a gap in the PRM literature, provides indications to researchers on future directions, and gives guidance to organisations on how to tailor PRM implementation to maximise value generation to different stakeholder groups in the context of projects. In addition, the proposed multi-stakeholder approach allows the integration of ecological and social impacts into the notion of value generation, providing a perspective on the sustainability orientation of the projects.
Although this is a single pilot case, limited to a specific industrial sector, it provides the first indications of new and previously missing aspects of value generation through PRM. Furthermore, the case study verified the validity of the proposed empirical framework that could be used in future case studies, which should focus on different types of industries, companies, and projects.
This study also presents a limitation due to the fact that it is based on two interviews with project stakeholders. However, the selection of a project manager who is already known to the researchers has positively impacted the depth of the analysis due to the full collaboration in the project and the full availability of data and information related to the project.

7. Patents

PROValue © is a software tool specifically developed by the authors of this research to support the data analysis of PRM economic value and PRM intangible benefits for different stakeholders generated through PRM. All the aforementioned analyses are performed with PROValue ©.

Author Contributions

Conceptualization, R.T.; methodology, R.T. and C.V.; software, R.T.; validation, R.T. and C.V.; formal analysis, R.T.; investigation, R.T.; resources, C.V.; data curation, R.T.; writing—original draft preparation, R.T.; writing—review and editing, C.V.; visualization, R.T.; supervision, C.V.; project administration, R.T. and C.V.; funding acquisition, C.V. All authors have read and agreed to the published version of the manuscript.

Funding

This research was funded by the University of Padova, grant number VERB_SID19_01.

Institutional Review Board Statement

Not applicable.

Informed Consent Statement

Not applicable.

Data Availability Statement

Not applicable.

Conflicts of Interest

The authors declare that they have no conflict of interest.

Appendix A. Questionnaire

Part (A)—Context
  • Company profile: business sector, company type, number of employees, type of organisation, type of products/services, annual turnover [47];
  • Project profile: project type, project objectives and scope, project geography and organisation, project team size, project budget, project duration, perceived project complexity (7-point Likert-type scale), project risk losses [43,44];
  • Project stakeholders’ profiles: stakeholder groups, stakeholders’ roles in the company and or external organisations, stakeholders’ roles in the project, stakeholders’ level of interest in the project as measured by the extent to which they will be active or passive (7-point Likert-type scale), stakeholders’ attitude to the project as measured by the extent to which they will support or resist (7-point Likert-type scale), stakeholders’ power or ability to influence the project (7-point Likert-type scale), derived from their positional or resource power in the company or external organisations, or from their credibility as a leader or expert [46];
  • Respondent value system: Respondents were asked diverse sets of closed questions to collect their subjective interest in different types of benefits that could potentially be generated from PRM at different levels (7-point Likert-type scale), based on [48] and extended to all project stakeholders.
Part (B)—PRM Implementation
5.
RM maturity level: PRM practices and activities implemented, and tools adopted, thus determining the level of maturity of the company towards PRM [33,37];
6.
Project risks: quantitative and qualitative information has been collected on the project risks identified and/or encountered during the project, including risk type, risk sources, risk responses, project stakeholders involved, risk evaluation in terms of probability and impact before and after the implementation of the risk responses;
7.
PRM cost: total cost of PRM implementation, including internal and external resources engaged, training courses, tools, and other investments in PRM [49].
Part (C)—PRM Value Generation
8.
PRM actual economic benefits: quantitative and qualitative information has been collected to evaluate (1) project risk reduction, defined as the difference between the initial evaluation of project risks (in terms of probability and impact), and the evaluation of the same risks after the implementation of risk responses [40,41], and (2) the impact of opportunities generated by positive risks through PRM;
9.
PRM potential economic benefits: quantitative and qualitative information has been collected to evaluate potential project risk reduction considering the risks that have been could be managed in a more effective way during the project;
10.
PRM Intangible Value: respondents were asked diverse sets of closed questions about their perceptions of the benefits actually obtained through PRM during the project (7-point Likert-type scale).

Appendix B. Value Measurement Indexes

Qualitative and quantitative methods have been applied for data analysis. In particular, to measure the economic value generated through PRM, the PRM economic value index (PVI econ) has been defined as the ratio between the economic value generated for stakeholders both by managing project risks and fostering opportunities, and the costs of PRM implementation.
P V I e c o n = j = 1 S   i = 1 N   r i j + o i j j = 1 S   i = 1 N   c i j
where:
  • (S): number of project stakeholders;
  • (j): jth project stakeholder, where j = (1, …, S);
  • (i): ith project risks, where i = (1, …, N);
  • (rij): risk reduction of the ith project risks for the jth project stakeholder;
  • (oij): economic opportunities for the jth project stakeholder generated through the management of the ith project risk;
  • (cij): cost paid by the jth project stakeholder to manage the ith project risks.
To measure the PRM intangible benefit, a utility function has been defined, based on a multi-attribute utility function [41] and improved by adopting the perspectives of the different stakeholders.
U j   i n t a n g = i = 1 n w i j   u i j
where:
  • (S): number of project stakeholders;
  • (j): jth project stakeholder, where j = (1, …, S);
  • (i) = ith intangible benefit obtained through PRM;
  • (wij) is the relative importance (weight) of the ith intangible benefit to the jth project stakeholder.
  • (wij) have been determined on the basis of the project stakeholder value system, where i = 1 J w i j = 1
  • (uij) is the perceived utility of the ith intangible benefit obtained through PRM to the jth project stakeholder (7-point Likert type scale).

References

  1. ISO 31000; Risk Management. International Organization for Standardization: Geneva, Switzerland, 2018. Available online: http://www.iso.org.2018 (accessed on 1 January 2020).
  2. Radner, R.; Shepp, L. Risk vs. profit potential: A model for corporate strategy. J. Econ. Dyn. Control 1996, 20, 1373–1393. [Google Scholar] [CrossRef]
  3. Fernando, Y.; Walters, T.; Ismail, M.N.; Seo, Y.W.; Kaimasu, M. Managing project success using project risk and green supply chain management: A survey of automotive industry. Int. J. Manag. Proj. Bus. 2018, 11, 332–365. [Google Scholar] [CrossRef]
  4. COSO. Enterprise Risk Management—Integrated Framework; Committee of Sponsoring Organizations of the Treadway Commission (COSO): New York, NY, USA, 2017. [Google Scholar]
  5. de Pooter, M. Don’t Manage Risk, Manage Value. Internal Auditor. June 2019. Available online: https://iiafiji.org (accessed on 1 January 2020).
  6. Maylor, H.; Brady, T.; Cooke-Davies, T.; Hodgson, D. From projectification to programmification. Int. J. Proj. Manag. 2006, 24, 663–674. [Google Scholar] [CrossRef]
  7. PMI. A Guide to the Project Management Body of Knowledge (PMBOK Guide), 3rd ed.; PMI: Chuo, Tokyo, 2004. [Google Scholar]
  8. Shimizu, T.; Park, Y.W.; Hong, P. Project managers for risk management: Case for Japan. Benchmarking 2012, 19, 532–547. [Google Scholar] [CrossRef]
  9. Badri, A. The challenge of integrating ohs into industrial project risk management: Proposal of a methodological approach to guide future research (case of mining projects in Quebec, Canada). Minerals 2015, 5, 314–334. [Google Scholar] [CrossRef]
  10. Raz, T.; Michael, E. Use and benefits of tools for project risk management. Int. J. Proj. Manag. 2001, 19, 9–17. [Google Scholar] [CrossRef]
  11. Borge, D. The Book of Risk; John Wiley & Sons: Hoboken, NJ, USA, 2002. [Google Scholar]
  12. PMI. A Guide to the Project Management Body of Knowledge (PMBOK Guide), 5th ed.; PMI: Chuo, Tokyo, 2013. [Google Scholar]
  13. Willumsen, P.; Oehmen, J.; Stingl, V.; Geraldi, J. Value creation through project risk management. Int. J. Proj. Manag. 2019, 37, 731–749. [Google Scholar] [CrossRef]
  14. Winter, M.; Smith, C.; Morris, P.; Cicmil, S. Directions for future research in project management: The main findings of a UK government-funded research network. Int. J. Proj. Manag. 2006, 24, 638–649. [Google Scholar] [CrossRef]
  15. Lepak, D.P.; Smith, K.G.; Taylor, M.S. Value creation and value capture: A multilevel perspective. Acad. Manag. Rev. 2007, 32, 180–194. [Google Scholar] [CrossRef]
  16. Elkington, P.; Smallman, C. Managing project risks: A case study from the utilities sector. Int. J. Proj. Manag. 2002, 7863, 49–57. [Google Scholar] [CrossRef]
  17. Cagliano, A.C.; Grimaldi, S.; Rafele, C. Choosing project risk management techniques. A theoretical framework. J. Risk Res. 2015, 18, 232–248. [Google Scholar] [CrossRef]
  18. Andersen, E.S. Do project managers have different perspectives on project management? Int. J. Proj. Manag. 2016, 34, 58–65. [Google Scholar] [CrossRef]
  19. Andersen, E.S. Value creation using the mission breakdown structure. Int. J. Proj. Manag. 2014, 32, 885–892. [Google Scholar] [CrossRef]
  20. Turner, R.; Ledwith, A.; Kelly, J. Project management in small to medium-sized enterprises: Matching processes to the nature of the firm. Int. J. Proj. Manag. 2010, 28, 744–755. [Google Scholar] [CrossRef]
  21. Turner, R.; Ledwith, A. Project management in small to medium-sized enterprises: Fitting the practices to the needs of the firm to deliver benefit. J. Small Bus. Manag. 2018, 56, 475–493. [Google Scholar] [CrossRef]
  22. Sanchez, H.; Robert, B.; Bourgault, M.; Pellerin, R. Risk management applied to projects, programs, and portfolios. Int. J. Manag. Proj. Bus. 2009, 2, 14–35. [Google Scholar] [CrossRef]
  23. Serra, C.E.M.; Kunc, M. Benefits Realisation Management and its influence on project success and on the execution of business strategies. Int. J. Proj. Manag. 2015, 33, 53–66. [Google Scholar] [CrossRef]
  24. Laursen, M.; Svejvig, P. Taking stock of project value creation: A structured literature review with future directions for research and practice. Int. J. Proj. Manag. 2016, 34, 736–747. [Google Scholar] [CrossRef]
  25. European Standard 12973; Value Management. European Standard LLC.: New York, NY, USA, 2000. Available online: https://www.en-standard.eu (accessed on 1 January 2020).
  26. Morris, P. Reconstructing Project Management; Wiley Blackwell: Chichester, UK, 2013. [Google Scholar]
  27. Quartermain, M. Value Engineering. In Project Management Pathways; Association for Project Management, Ed.; Association for Project Management: Buckinghamshire, UK, 2002. [Google Scholar]
  28. Scholz, R.W.; Tietje, O. Embedded Case Study Methods: Integrating Quantitative and Qualitative Knowledge; SAGE Publications: Thousand Oaks, CA, USA, 2002. [Google Scholar]
  29. Macpherson, A.; Holt, R. Knowledge, Learning and Small Firm Growth: A Systematic Review of the Evidence. Res. Policy 2007, 36, 172–192. [Google Scholar] [CrossRef]
  30. Tranfield, D.; Denyer, D.; Smart, P. Towards a Methodology for Developing Evidence-Informed Management Knowledge by Means of Systematic Review. Br. J. Manag. 2003, 14, 207–222. [Google Scholar] [CrossRef]
  31. Cavacini, A. What is the Best Database for Computer Science Journal Articles? Scientometrics 2015, 102, 2059–2071. [Google Scholar] [CrossRef]
  32. Guz, A.N.; Rushchitsky, J.J. Scopus: A System for the Evaluation of Scientific Journal. Int. Appl. Mech. 2009, 45, 351–362. [Google Scholar] [CrossRef]
  33. Yeo, K.T.; Ren, Y.T. Risk Management Capability Maturity Model for Complex Product Systems (CoPS) Projects. Syst. Eng. 2009, 12, 275–294. [Google Scholar] [CrossRef]
  34. Artto, K.; Ahola, T.; Vartiainen, V. From the front end of projects to the back end of operations: Managing projects for value creation throughout the system lifecycle. Int. J. Proj. Manag. 2016, 34, 258–270. [Google Scholar] [CrossRef]
  35. Chen, Y.S.; Chuang, H.M.; Sangaiah, A.K.; Lin, C.K.; Huang, W.B. A study for project risk management using an advanced MCDM-based DEMATEL-ANP approach. J. Ambient Intell. Humaniz. Comput. 2019, 10, 2669–2681. [Google Scholar] [CrossRef]
  36. Pargar, F.; Kujala, J.; Aaltonen, K.; Ruutu, S. Value creation dynamics in a project alliance. Int. J. Proj. Manag. 2019, 37, 716–730. [Google Scholar] [CrossRef]
  37. PMI. A Guide to the Project Management Body of Knowledge (PMBOK Guide), 6th ed.; PMI: Chuo, Tokyo, 2017. [Google Scholar]
  38. Yin, R.K. Discovering the Future of the Case Study. Method in Evaluation Research. Eval. Pract. 1994, 15, 283–290. [Google Scholar] [CrossRef]
  39. Voss, C.; Tsikriktsis, N.; Frohlich, M. Case Research in Operations Management. Int. J. Oper. Prod. Manag. 2002, 22, 195–219. [Google Scholar] [CrossRef]
  40. Ahmadi-Javid, A.; Fateminia, S.H.; Gemünden, H.G. A Method for Risk Response Planning in Project Portfolio Management. Proj. Manag. J. 2020, 51, 77–95. [Google Scholar] [CrossRef]
  41. Serpell, A.F.; Ferrada, X.; Rubio, L. Measuring the performance of project risk management: A preliminary model. Organ. Technol. Manag. Constr. Int. J. 2019, 11, 1984–1991. [Google Scholar] [CrossRef] [Green Version]
  42. Keeney, R.L.; Raiffa, H. Decisions with Multiple Objectives—Preferences and Value Tradeoffs; Cambridge University Press: Cambridge, UK, 1993. [Google Scholar]
  43. Qazi, A.; Quigley, J.; Dickson, A.; Kirytopoulos, K.A. Project Complexity and Risk Management (ProCRiM): Towards modelling project complexity driven risk paths in construction projects. Int. J. Proj. Manag. 2016, 34, 1183–1198. [Google Scholar] [CrossRef]
  44. Crispim, J.; Silva, L.H.; Rego, N. Project risk management practices: The organizational maturity influence. Int. J. Manag. Proj. Bus. 2019, 12, 187–210. [Google Scholar] [CrossRef]
  45. Josey, C.W.; England, K. Utilizing a project profile matrix to determine project management requirements. In Proceedings of the PMI® Global Congress, Orlando, FL, USA, 10–13 October 2009; Project Management Institute: Newtown Square, PA, USA, 2009. [Google Scholar]
  46. Murray-Webster, R.; Simon, P. Making Sense of Stakeholder Mapping. PM World Today 2006, 3, 5. Available online: http://skat.ihmc.us/rid=1JGD4CJZ4-F9CF0Y-1KM6/SEMINAL (accessed on 1 January 2020).
  47. EU Recommendation 2003/361, Global Industry Classification St. 1999. Available online: https://eur-lex.europa.eu/LexUriServ/LexUriServ.do?uri=OJ:L:2003:124:0036:0041:en:PDF (accessed on 1 January 2020).
  48. Surlan, N.; Cekic, Z.; Torbica, Z. Use of value management workshops and critical success factors in introducing local experience on the international construction projects. J. Civ. Eng. Manag. 2016, 22, 1021–1031. [Google Scholar] [CrossRef]
  49. de Araújo, F.L.P.; Marcelino-Sadaba, S.; Verbano, C. Successful implementation of project risk management in small and medium enterprises: A cross-case analysis. Int. J. Manag. Proj. Bus. 2021, 14, 1023–1045. [Google Scholar]
Figure 1. Key dimensions and gaps emerging from the SLR.
Sustainability 14 12117 g001
Figure 2. Empirical framework of analysis derived from the literature key dimensions.
Sustainability 14 12117 g002
Figure 3. The value systems of the respondents.
Sustainability 14 12117 g003
Figure 4. Project complexity.
Sustainability 14 12117 g004
Figure 5. Project stakeholders map.
Sustainability 14 12117 g005
Figure 6. Sharing of PRM economic value generated among stakeholders.
Sustainability 14 12117 g006
Figure 7. Distribution of the PRM intangible benefit.
Sustainability 14 12117 g007
Figure 8. Results obtained from PROValue © analysis.
Sustainability 14 12117 g008
Table 1. Project characteristics and respondents’ profiles.
Project Type & ObjectivesProject Size & RiskInterviews
Project
Type
Project
Objectives
Project Budget
(euro)
Team
Size
(persons)
Project Duration (months)Project Losses
(losses/budget)
Respondents
Role
Respondents
Seniority (years)
Interviews
(number, duration)
ExternalImproving the cost estimation process70,000.0058Low
(1.4%)
Project Manager2–52 (160 min)
CEO5–101 (45 min)
Table 2. Project risks analysis.
Risk TypesInitial Impact EvaluationImpact Evaluation
(after PRM)
Actual Impact on AlphaActual Impact on the
Client Company
Probability (%)Potential Impact (euro)Impact Evaluation (euro)Probability (%)Potential Impact (euro)Impact Evaluation (euro)Negative Impact (Losses)Positive Impact (Opportun.)Negative Impact (Losses)Positive Impact (Opportun.)
Strategic Risk70%10,000.007000.0010%10,000.001000.00-10,000.0010,000.00-
Operative Risk70%5000.003500.000%5000.00-1000.00---
Technical Risk10%70,000.007000.000%70,000.00-----
Total 17,500.00 1000.001000.0010,000.0010,000.00-
% on Project Budget 25.0% 1.4%1.4%14.3%14.3%
Publisher’s Note: MDPI stays neutral with regard to jurisdictional claims in published maps and institutional affiliations.

