Abstract
In this paper, on the basis of a theoretical analysis, we quantitatively explore the impact of urbanization on agricultural technical efficiency after measuring the agricultural technical efficiency and the urbanization level, from the perspective of different dimensions in 34 prefecture-level cities in Northeast China, using the SE-DEA model, entropy-TOPSIS method, and the panel regression model. The results show that, except for some cities that achieved technical efficiency in individual years, such as Yichun in 2012 (1.003), and Benxi in 2015 and 2016 (1.011 and 1.254, respectively), the overall level of agricultural technical efficiency in the Northeast Region is still relatively low. The level of overall urbanization in Liaoning was significantly higher than that in Heilongjiang and Jilin. The population urbanization and land urbanization levels of most cities were relatively high, but an obvious improvement trend was not observed. Some cities even appeared to undergo the phenomenon of “anti-urbanization”, and the economic urbanization showed an obvious characteristic of “high begins and low ends” in the Northeast. Moreover, except for the population urbanization, the overall urbanization, land urbanization, and economic urbanization all had a significant positive effect on the agricultural technical efficiency; the effect in Heilongjiang province was higher than that in Liaoning province, and Heilongjiang province showed an obvious catch-up trend. While enriching the research on urbanization and efficiency, this study provided political implications on strengthening the flow of factors between the urban and rural, improving the investment in technology and labor training, and improving the compensation mechanism.
1. Introduction
Farrell (1957) first proposed the concept of technical efficiency (TE) on the basis of the resource utilization coefficient, and systematically described the relationship between input and output [1]. Leibenstein (1966) established “technical efficiency” as the maximum economic output from the perspective of the output, namely the ideal output, under the specified input constraints, assuming that the production decision-making unit achieves the optimal allocation of production factors, and then the technical efficiency is the ratio between the actual output and the ideal output [2]. Subsequently, technical efficiency was applied to the field of agriculture, widely used to characterize agricultural production technology and the agricultural and rural modernization level [3,4]. Currently, a large number of studies have shown that agricultural technological progress and technical efficiency have become important driving factors in promoting improvements in agricultural production efficiency, and agricultural technical efficiency has become the main source of expanding economic output and realizing agricultural modernization under the circumstance of limited short-term technological progress [5,6,7].
Since the reform and opening-up, with the rapid development of China’s economy, the level of urbanization is also improving. By the end of 2020, the urbanization rate of China’s permanent population reached 63.89% [8]. This means that China has entered a stage of social development in which the modern urban population plays a dominant role. However, at the same time, the urbanization rate of the registered population in 2020 was only 45.40% [9]. Moreover, population urbanization has lagged far behind land urbanization for a long time in China. From 2000 to 2019, China’s urban built-up area expanded rapidly from 22,400 square kilometers to 60,900 square kilometers, an increase of 171.88%, with an average annual growth of 5.41% [10,11]. Meanwhile, the urban population increased by 24.38%, with an average annual growth rate of 1.22%, and the speed of the land urbanization was much higher than that of the population urbanization [12]. The unbalanced and inadequate urbanization has become a key factor restricting high-quality economic development in the future.
China’s urbanization plays an important role in absorbing surplus rural labor, making full use of the “demographic dividend”, promoting the free flow of urban and rural factors, improving the efficiency of production element allocation, increasing national income, reducing poverty, and promoting urban competitiveness and regional economic development [13,14]. However, urbanization cannot be separated from rural support. With the rapid progress of urbanization, the farmland has shrunk, the number of agricultural laborers has decreased, and the comparative price of agricultural products has declined; these factors arouse concerns regarding food sources for the Chinese population in the future [15,16]. In the coming period, China’s urbanization construction will be in the middle and late stages of rapid development; the transformation of the urban economic development system will be accelerated; and the flow of the population and other elements will become more diversified and complex [17]. Scholars are concerned about the effects that urbanization will have on agricultural and rural development [18,19,20]. Moreover, the 14th Five-Year Plan for National Economic and Social Development of the People’s Republic of China and the Outline of the 2035 Vision reaffirm that priority should be given to the development of agricultural and rural areas, that rural revitalization should be promoted in an all-around way, and that the modernization of agricultural and rural areas should be accelerated. In this context, promoting the coordinated development of urbanization, along with agricultural and rural modernization, has become an important issue in the construction of socialism with Chinese characteristics.
Under this background, analyzing the impact of urbanization on the agricultural technical efficiency is of great significance for exploring the development path of urbanization with Chinese characteristics, and for realizing the coordinated development of urbanization, along with agricultural and rural modernization. As for the measurement methods for agricultural technical efficiency, the Data Envelopment Analysis (DEA) model and Stochastic Frontier Analysis (SFA) model are the most commonly used [21]. Among them, the SFA uses a production function, which considers random errors and is more suitable for a large sample estimation, to evaluate the relative efficiency of DMUs [22]. In contrast, DEA is a non-parametric approach used to measure the efficiency of decision-making units (DMUs) of the same type, according to multiple inputs and multiple outputs. It uses a linear programming mathematical approach to evaluate the relative efficiency of the DMUs [23,24], and it can also reduce the subjective influence of ring-index weighting through automatic weighting, and it can clearly show the combinations of multiple inputs and multiple outputs [25]. However, the traditional DEA method has difficulty in comparing and evaluating multiple effective decision-making units, and it cannot explain cases where the efficiency value is greater than 1. Therefore, Andersen and Petersen (1993) proposed the Super-Efficiency Data Envelopment Analysis (SE-DEA) model, which solves the problem that the traditional DEA model faces, where it cannot perform an evaluation when multiple evaluation units are in the same production front [26], and, in such cases, the SE-DEA model is widely used [27,28].
At present, the impact of urbanization on agricultural technical efficiency is a hot topic in academia, and a large number of scholars have carried out relevant studies [29,30,31]. As for the calculation of the agricultural technical efficiency, few studies have solved the problem of further sorting when multiple decision units are simultaneously effective. As for the selection of the urbanization indicators, most studies simply use population urbanization for analysis, but, due to different urbanization patterns and levels, urbanization can be further divided into various dimensions, such as population urbanization, land urbanization, and economic urbanization; thus, the existing research lacks in-depth and comprehensive discussions about the specific dimensions. In addition, most of the existing studies focus on the eastern regions, which have relatively well-developed economies and high levels of urbanization, while few studies focus on the Northeast Region. However, as an important grain production base, it is of great significance to realize the coordinated development of urbanization and agricultural modernization in the Northeast Region in order to ensure stable grain yields and increase production.
Therefore, we selected the Northeast Region as a study area. We analyzed it from the perspective of four dimensions, namely, the overall urbanization, population urbanization, land urbanization, and economic urbanization, and we also conducted a regional heterogeneity analysis to explore the impact of urbanization on agricultural technical efficiency more comprehensively and systematically. Additionally, we selected the SE-DEA model to measure the agricultural technical efficiency, so as to solve the problem that production units cannot be further distinguished and ranked when they are at the same frontier. The research results are expected to provide a reference for promoting the coordinated development of urbanization, along with agricultural and rural modernization, in this region.
2. Theoretical Analysis
Urbanization will have an important impact on agricultural and rural development, as well as agricultural technical efficiency. The following is a preliminary theoretical analysis of the impact of urbanization on agricultural technical efficiency, based on the existing research results and social reality.
2.1. The Impact of Population Urbanization on Agricultural Technical Efficiency
In China’s agricultural labor force exists the phenomenon of “too dense” and “involution”, and the per capita labor productivity is quite low. With the improvement in the population urbanization, in which a large proportion of the agricultural surplus labor force was transferred to the cities, this phenomenon has been alleviated to some extent. The transfer of the surplus agricultural labor force has raised the income of households and the mechanization level of agricultural production [32]. The agricultural land of migrant workers can be appropriately distributed through a land transfer, and the agricultural technical efficiency can also be improved through large-scale and intensive management [33]. Additionally, the migration of laborers to cities for work has changed the rural population structure. As the living conditions and environment in urban areas are obviously higher than those in rural areas, most of the migrant labor force was made up of young and middle-aged people with a high cultural quality, and most of the people who stayed in the rural areas were women, children, and older adults, which led to aging and low-quality rural agricultural personnel, and even to the phenomenon of the land being abandoned, due to the main labor force of the rural families working outside. The new knowledge and technology of agricultural production were difficult to be widely spread and applied in rural areas, thus hindering the development of agriculture [24].
2.2. The Impact of Land Urbanization on Agricultural Technical Efficiency
China is one of the countries with the greatest shortage of cultivated land resources [6]. As an important input factor in agricultural production, land urbanization has had a remarkable impact on agricultural technical efficiency. In the process of land urbanization, agricultural farmland has been constantly transformed into urban construction land; although there is a policy linking the increase and decrease, the quality of the newly developed cultivated land cannot be guaranteed, and a large amount of high-quality and fertile land was occupied, resulting in a continuous decline in the agricultural output [34]. Moreover, other studies also point out that the process of land urbanization is conducive to the consolidation and development of barren land, and the reduction in land jumbled at the end of the production input factor, thereby promoting the intensive, large-scale, and efficient management of rural land, and improving the level of agricultural modernization [12,31,35].
2.3. The Impact of Economic Urbanization on Agricultural Technical Efficiency
With the development of urbanization and the continuous improvements in the economic level, capital, technology, and other factors, people will gather in rural areas, promoting the agricultural production level. Meanwhile, the vigorous development of secondary and tertiary industries, accompanied by the economic urbanization, has increased the government’s financial revenue, which has been conducive to improvements in the agricultural infrastructure and the promotion of agricultural development [36]. Additionally, after meeting the basic needs of the migrant workers, more non-agricultural income will be invested in land-intensive development and agricultural technology reform, further promoting the application and promotion of agricultural advanced production technology and improving agricultural technology efficiency. However, at the same time, we should also be aware of the development of secondary and tertiary industries replacing the role of the primary industries, as the gradual increase in the proportion of the secondary and tertiary industries has reduced the development space of the primary industries, thus hindering the process of agricultural modernization [37].
It can be seen from the above analysis that the urbanization process has complex and various impacts on agricultural technical efficiency, and it is hard to grasp the relationship between urbanization and agricultural technical efficiency when only relying on experience and existing research. In order to more accurately understand the impact of urbanization on agricultural technical efficiency, it is necessary to construct models for specific regions and carry out a quantitative analysis.
3. Materials and Methods
3.1. Study Area
The Northeast Region is located in the northeastern part of China, and it includes three provinces, namely, Heilongjiang, Jilin, and Liaoning, with a total area of 787,300 km2 (Figure 1) [38]. For a long time, the Northeast Region has played an important role in the national economy, and its urbanization level has always been in a leading position in China. However, since the 21st century, especially in recent years, the urbanization development speed and the economic development level in the Northeast Region has slowed markedly, and, although the urbanization rate is still higher than the national average, the disposable income of the urban residents is far below the national average; the quality of the urbanization significantly lagged behind the speed of the urbanization. Moreover, the grain output of the Northeast Region accounts for one-quarter of the total national output and one-third of the total commercial grain output, making it the “stabilizer” and “ballast stone” of China’s grain production [39]. In this context, promoting the quality of urbanization development and realizing the coordinated development of urbanization, along with agricultural and rural modernization, have become important for revitalizing the old industrial base in the Northeast Region and ensuring national food security.
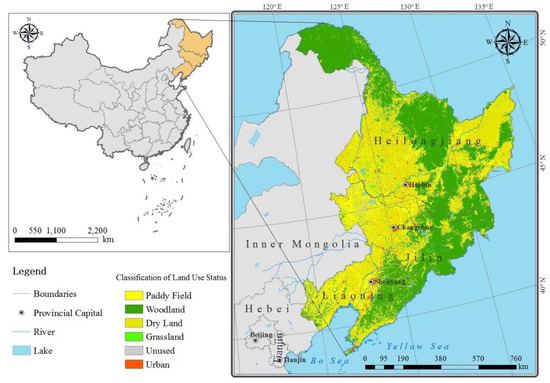
Figure 1.
Study area.
3.2. Methodology
On the basis of the theoretical analysis, this paper selected 34 prefecture-level cities in the Northeast Region as research objects to explore the impact of urbanization on agricultural technical efficiency. Among them, firstly, the SE-DEA model was used to calculate the agricultural technical efficiency, then the entropy-TOPSIS method was used to evaluate the urbanization level and, finally, the panel regression model was used to explore the impact of urbanization on the agricultural technical efficiency.
3.2.1. SE-DEA Model
Because the traditional DEA model cannot explain the differentiation and ordering problem when DMUs are at the same frontier, we selected the SE-DEA output model, oriented to constantly return to scale in order to calculate the agricultural technical efficiency of 34 prefecture-level cities in the Northeast Region. When using the SE-DEA model to evaluate the technical efficiency of DMUs, first, specific DMUs are excluded in the process of measuring, and for invalid DMUs, due to their production frontier remaining unchanged, their efficiency values and the calculated values of the traditional DEA model remain the same. However, for the effective DMUs, on the basis of their efficiency values and in proportion to the increase in investment, they will increase as the proportion of the super-efficiency value increases. Because their production frontiers are backwards, the measurement of the efficiency value is greater than the measurement of that using the traditional DEA model. The DMUs effective for the super-efficiency value are generally greater than 1, and the higher the super-efficiency value, the higher the level of efficiency. This solves the challenge of the traditional DEA model, where it has great difficulty in assessing the problems when it encounters multiple evaluation units in production on the same frontier, which can be shown as follows:
where represents the super-efficiency of the decision unit; represents an infinitely small value for the non-Archimedes geometry; m, s, and n represent the input variable dimension, the output variable dimension, and the region quantity, respectively; and represent the relaxation variables; and represent the input variable and output variable, respectively; and represents the weight coefficient. < 1 indicates that the decision unit does not achieve optimal efficiency, and > 1 indicates a more optimal efficiency.
3.2.2. Entropy-TOPSIS Method
In this paper, we selected the entropy-TOPSIS method to evaluate the overall urbanization level based on the indicators of the population urbanization, land urbanization, and economic urbanization. Firstly, all the indicators of urbanization are standardized:
Secondly, the information entropy and weight of each indicator are calculated:
Thirdly, the weighted normalized matrix can be obtained from the normalized matrix and the weights of each index:
Fourthly, the best and worst schemes in the scheme set are determined, and the distance between the evaluation object and the best and worst schemes is calculated:
Fifthly, the distance between the ith evaluation object and the maximum and minimum values is determined:
Finally, the normalized value of the overall urbanization level is obtained:
3.2.3. Panel Regression Model
On the basis of calculating the agricultural technical efficiency using the SE-DEA model and the urbanization level using the entropy-TOPSIS method, we needed to construct a regression model to quantitatively explore the impact of urbanization on agricultural technical efficiency. In this paper, we selected the panel regression model for this task, based on the existing research such as Liu et al. (2019), Shang et al. (2020), Zhao et al. (2022), and combined the actual situation in the Northeast Region [33,38,40]. We considered the regional differences between the cities and the different stages of the economic development process, combined with the results of the Hausman test. We finally constructed a panel regression model with fixed effects for the regression analysis.
where TEi,t represents the agricultural technical efficiency of the prefecture-level cities in the Northeast Region in different periods; represents the constant term; represents the urbanization level of the prefecture-level cities in the different periods; represents the controlling variables, which have an important impact on agricultural technical efficiency; Yeart represents the year dummy variable; represents the urban effect term; and represents the random disturbance term.
3.3. Variables
3.3.1. Core Explanatory Variable: Urbanization and Related Indicators
In a narrow sense, urbanization refers to a process whereby the population gradually becomes concentrated in cities. In this process, the conditions of different dimensions change with the acquisition of agricultural land and the occupation of secondary and tertiary industries by the primary industry, expanding the urbanization accordingly. However, population urbanization, land urbanization, and economic urbanization all reflect the people-centered, new-type urbanization development concept, the overall and coordinated development of the urban and rural areas. Generally, this concept assumes the following: the population urbanization is the core, land urbanization is the carrier, and economic urbanization is the external performance. This is why we specifically analyzed the impact of urbanization on agricultural technical efficiency from the perspective of the above three dimensions.
Therefore, this paper explores the impact of urbanization on agricultural technical efficiency from the perspective of four dimensions, namely, the overall urbanization, population urbanization, land urbanization, and economic urbanization. Moreover, with the reference to Liu et al. (2018), Zhu et al. (2019), Zhou et al. (2022), and combined with the actual situation of Northeast China, we constructed an evaluation index system of urbanization (Table 1) [32,41,42]. The population urbanization level (pop_urban) was measured using the permanent population urbanization rate to reflect the urban population structure; the land urbanization level (land_urban) was measured using the ratio of built-up area to total land area, and built-up area per capita, in order to reflect the situations of urban land expansion and land occupancy per capita, respectively; and the economic urbanization level (eco_urban) was measured using the urban economic density and urban economic structure to reflect the urban industrial agglomeration and industrial structure, respectively. Then, the weight of each index was determined, and the overall urbanization (over_urban) level was calculated accordingly. Among them, weight 1 represents the index weight in the calculation of the population urbanization, land urbanization, and economic urbanization, and weight 2 represents the index weight in the calculation of the overall urbanization. Finally, the overall urbanization levels of 34 prefecture-level cities in the Northeast Region were determined using the entropy-TOPSIS method.

Table 1.
The evaluation index system of urbanization.
3.3.2. Explained Variable: Agricultural Technical Efficiency and Indicator System
This paper further constructed an input–output index system of agricultural technical efficiency with the reference to Pei et al. (2019) and Zhu et al. (2022) and combined the actual situation of the agricultural production in the Northeast Region [43,44]. We considered that agricultural labor is the main force of agricultural production; land resources are an important basis for the development of agricultural activities; chemical fertilizers and agricultural machine power are important production elements in agricultural practice, and agricultural production is inseparable from the use of water resources. Therefore, as input indicators, we selected the number of employees in agriculture, forestry, husbandry, and fishery; the total sown area of the crops; the total power of the agricultural machinery; the effective irrigation area; and the amount of fertilizer applied. Moreover, we also selected the total output value of the agriculture, forestry, husbandry, and fishery industries, after removing the price factor, as the output indicator to reflect the agricultural production level (Table 2).
Table 2.
Agricultural technical efficiency input–output index system.
3.3.3. Controlling Variables
We also selected a series of controlling variables, which can affect the agricultural technical efficiency. The existing research shows that the crop planting structure, agricultural mechanization, financial support for agriculture, and the degree of openness will all have impacts on the agricultural technical efficiency [45,46]. Therefore, we specifically selected the proportion of grain crops in the total sown area of crops (stru), the ratio of the total power of the agricultural machinery to the total sown area of crops (mac), the level of financial support for agriculture (agr), and the agricultural FDI (fdi) as the controlling variables. Among them, the actual utilized FDI value of the prefecture-level cities was multiplied by the share of the agricultural output value of the prefecture-level cities in the total regional output value, as an approximate substitute index of the agricultural FDI [45].
3.4. Data Source
This study took 34 prefecture-level cities in the Northeast Region as research objects in the period from 2007 to 2019. All the relevant data were obtained from the China Regional Statistical Yearbook (2008–2020), China Urban Statistical Yearbook (2008–2020), China Urban and Rural Construction Statistical Yearbook (2008–2020), Heilongjiang Statistical Yearbook (2008–2020), Liaoning Statistical Yearbook (2008–2020), and Jilin Statistical Yearbook (2008–2020). There are differences in the statistical caliber of the built-up area and financial support for agriculture variables before and after 2008; thus, the time span of this paper was set as 2008–2019.
4. Results
4.1. Dynamic Changes in Agricultural Technical Efficiency in the Northeast Region
Table 3 shows the agricultural technical efficiency results of 34 prefecture-level cities in the Northeast Region from 2007 to 2019. Although the overall level of agricultural technical efficiency improved, it is still quite low; the average level in the Northeast Region from 2007 to 2019 was only 0.426. This may be due to the lagging development in recent years, difficulties in industrial transformation and upgrading, insufficient development of science and technology and mechanization levels, extensive production systems, and low resource utilization efficiency. Moreover, most cities have not achieved technical efficiency in recent years [47]. Among the cities in Liaoning province, Benxi has a relatively high level of agricultural technical efficiency, and it achieved technical efficiency in 2015 (1.011) and 2016 (1.254). Dalian also had a relatively high level of agricultural technical efficiency. The rank of efficiency value of Fuxin is always at the bottom, and an improvement trend is not obvious as time progresses, which indicates that the agricultural production has low efficiency and low output. Among the cities in Jilin province, Baishan and Liaoyuan achieved technical efficiency many times, but the other cities did not show an obvious improvement or deterioration trend in terms of efficiency value ranking. Among the cities in Heilongjiang province, only Yichun achieved technical efficiency in 2012 (1.003), but the rank of the other cities always have a low level, without obvious improvements.
Table 3.
Results of agricultural technical efficiency in the Northeast Region (2007–2019).
4.2. Dynamic Changes in Urbanization Process in the Northeast Region
Figure 2a shows the results of the overall urbanization in the Northeast Region. It can be seen that the overall urbanization level of Liaoning province is generally higher than that of Jilin province and Heilongjiang province, and the overall urbanization levels of Shenyang and Dalian are always in the leading positions among the whole Northeast Region. However, due to the stagnation of economic development in the Northeast Region, an obvious further upward trend of the overall urbanization level was not observed, and some cities (such as Shenyang, Dalian, Changchun, and Daqing), which originally had a relatively high level of overall urbanization, even appeared to undergo the phenomenon of “anti-urbanization”. Zhang et al. (2022) reached similar conclusions [46]. On the contrary, some cities (such as Dandong, Panjin, Jiamusi, and Harbin), which originally had a relatively low level of overall urbanization, show an improvement trend. This is mainly because these cities were less dependent on resource consumption in the process of development, and they were more likely to abandon the “burden” of traditional industries in the process of industrial transformation and upgrading. Therefore, the advantage of development is highlighted [48].
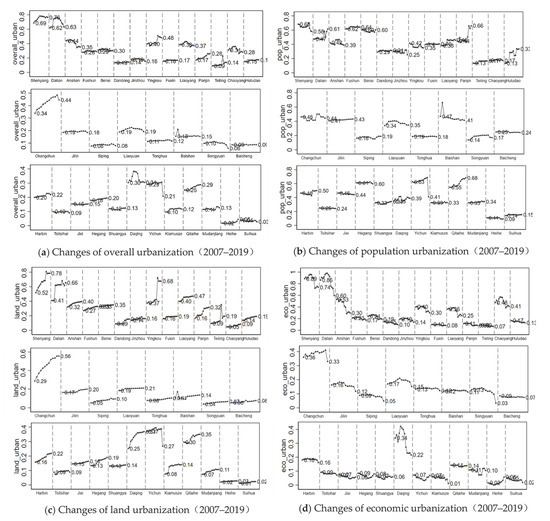
Figure 2.
Changes in urbanization process in the Northeast Region.
Figure 2b–d shows the results of the population urbanization, land urbanization, and economic urbanization, respectively. From the results of the population urbanization, it can be seen that, except for a few cities, such as Tieling, Siping, and Qiqihar, most cities are at a relatively high level, but an obvious further upward trend could not be observed. This is mainly due to the large outflow of the labor force caused by the lagging economic development, and the phenomena of the citizenization of farmers and the outflow of citizens, which occurred at the same time. From the results of the land urbanization, it can be observed that there is a rise in the overall trend and that there are great differences among the regions. The cities such as Shenyang, Dalian, Yingkou, Changchun, and Daqing show an obvious upward trend; this is related to the level of economic development, which brought about the agglomeration of industries and population, inevitably leading to the expansion of the production and living space. From the results of the economic urbanization, an obvious characteristic of “high begins and low ends” was observed; the level of economic urbanization in most cities decreases year by year. This is mainly due to long-standing problems, such as lagging development, an unreasonable industrial structure, excess capacity, and weak emerging technology industries, which has led to the gradual loss of the advantages that resulted from the development [49].
4.3. The Impact of Urbanization on Agricultural Technical Efficiency
- (1)
- Stationarity test.
In order to avoid pseudo-regression, we first tested the stationarity of each variable sequence (Table 4). It was found that, at a significance level of 5%, all the variable sequences passed the stationarity test, and there was no unit root, so a regression analysis could be performed.
Table 4.
Stationarity test results.
- (2)
- Baseline regression results.
The results of the impact of urbanization on the agricultural technical efficiency are shown in Table 5. On the whole, the model fitting effect was good, and the independent variables have good explanatory levels for the dependent variables. Among them, columns (1), (3), (5), and (7) present the parameter estimation results, with only the fixed year effect and urban effect, and columns (2), (4), (6), and (8) present the parameter estimation results of the further-controlling key variables.
Table 5.
Baseline regression results.
Columns (1) and (2) show that overall urbanization had a significant effect on agricultural technical efficiency; that is, a higher urbanization level in the Northeast Region further improved agricultural technical efficiency. The basic forms of urbanization were spatial migration and the agglomeration of various production elements, which were mainly driven by the economic structure, especially the transformation of industrial structure from being agriculturally oriented to being focused on industrialization, the modern service industries, and the intelligent industries. This process was bound to be accompanied by great changes in the economic patterns, technological levels, and lifestyles. Moreover, the development of the urban areas will have a driving effect on the rural areas. The flow of production elements between the urban and rural areas, such as land, technology, and money, will inevitably improve the level of agricultural production technology and technical efficiency [14].
Columns (3) and (4) show that population urbanization had negative effects on agricultural technical efficiency. As for the impact of land urbanization on agricultural technical efficiency, there is a big debate in the existing research; some conclusions are positive [18,24,32], while others are negative [33,50]. The reason for the negative effect in this paper may be that, in recent years, there has always been a net outflow of the population in the Northeast Region, with a large number of young people and high-quality laborers leaving, while the laborers remaining in the rural areas were mostly children and older adults. The low-quality labor personnel led to a shortage in technology improvement and new technology applications, which hindered the promotion and modernization of the agricultural technology levels [24].
Columns (5) and (6) show that land urbanization had a positive effect on agricultural technical efficiency. This is mainly due to the fact that agricultural production in the Northeast Region is mainly concentrated in the black soil area, which belongs to the arable land red line demarcated by the state, and it is difficult for the expansion of urbanization to encroach on fertile farmland. Therefore, the land urbanization in the Northeast Region mostly occupied barren or low-quality farmland, avoiding the redundancy and inefficiency of agricultural production to a certain extent and, accordingly, having a positive effect on agricultural technical efficiency [38].
Columns (7) and (8) show that economic urbanization also had a positive effect on agricultural technical efficiency. This is mainly because of the radiation and driving effects of urban economic development on agriculture and rural areas. Moreover, secondary and tertiary industries have advantages over agricultural industries in profits and taxes. An increase in fiscal taxes gives governments the possibility to invest more resources into the agricultural infrastructure and agricultural science and technology, thus improving agricultural technical efficiency [51].
- (3)
- Regression Analysis Results by Region.
In order to explore the regional heterogeneity, this study further conducted a regression analysis on Liaoning province, Jilin province, and Heilongjiang province (Table 6). On the whole, there was no significant difference between the results of the regional regression and baseline regression. Overall urbanization, land urbanization, and economic urbanization all had positive effects on agricultural technical efficiency, while population urbanization hindered improvements in agricultural technical efficiency.
Table 6.
Regression analysis results by region.
Column (1) shows that the effect coefficient of the overall urbanization on agricultural technical efficiency in Heilongjiang province (0.280) was higher than that in Liaoning province (0.112). This indicates that urbanization in Heilongjiang province had a better effect on agricultural technology improvement than that in Liaoning province. In addition, combined with the results in Figure 2, we found that Liaoning province originally had a high level of urbanization, but an obvious further upward trend could not be observed in recent years. Heilongjiang province had an obvious catch-up trend, although its early level was relatively low. Jilin province was relatively stable.
Column (2) shows that the population urbanization in Heilongjiang province (−0.880) had a more negative effect on agricultural technical efficiency than that in Liaoning province (−0.321). The reason may be that the problem of brain drain in Heilongjiang province is more serious. Although the registered population increased, the actual number of urban people employed did not significantly increase, and a large number of high-quality laborers flowed to the economically developed regions, resulting in nominal urbanization.
Column (3) shows that the land urbanization in Heilongjiang province (0.482) had a better effect on agricultural technology improvement than that in Liaoning province (0.121). This may be because the land urbanization level of Heilongjiang province was at a lower level than that of Liaoning province, and the agricultural economic spillover effect brought by adding one unit of urban construction land was greater, thus promoting agricultural technical efficiency more significantly [33].
Column (4) shows that there was not a big difference in the effect of economic urbanization on agricultural technical efficiency between Liaoning province (0.179) and Heilongjiang province (0.112). This indicates that the radiation and driving effects of economic urbanization on these two provinces are quite similar.
- (4)
- Robustness test results.
In order to further prove the reliability and validity of the results, we conducted robustness tests in the following ways:
- ➀
- Reduced the sample range.
We reduced the sample range to 2007–2015 and substituted the data into the baseline regression model. The results show that the regression coefficient passed the significance test at a level of 1%, and the results in Table 7 are completely consistent with those in Table 5, proving the reliability and validity of the results, to some extent.
Table 7.
Robustness test results 1.
- ➁
- Delayed the explanatory variable by one stage.
We considered that the urbanization level may have a longer time-delay effect on the adjustment of agricultural technical efficiency and that there may be a two-way causal relationship between urbanization and agricultural technical efficiency. Therefore, we replaced the current urbanization variable with the one lagging a period behind and re-estimated the parameters (Table 8). The results are also consistent with those in Table 5, further proving the reliability and validity of the results.
Table 8.
Robustness test results 2.
5. Discussion
As can be seen from the results, on the whole, urbanization has had a significant positive effect on agricultural technical efficiency, indicating that urbanization plays a positive role in promoting agricultural and rural modernization, to some extent, and the impacts of different dimensions are sometimes intertwined.
On the one hand, industrial expansion and functional improvement, accompanied by an accelerated urbanization process, can help absorb more surplus rural labor and create conditions for moderate-scale operations and the professional development of agriculture [13]. Improvements in agricultural capital (land) and the labor ratio can promote agricultural technological progress and improve technological (scale) efficiency. Moreover, urbanization and the development of secondary and tertiary industries have enhanced the financial strength of local governments, provided financial support for the construction of rural infrastructure, improved public services, and helped optimize the external environment for agricultural production and residents’ lives, thereby promoting high-quality agricultural development [52]. However, it is worth noting that, as the urbanization level further improves, especially land urbanization, the urban expansion occupying farmland will still be an important factor that threatens national food security. With this background, we should strictly abide by the red line of 1.8 billion mu of farmland, guarantee the amount of basic farmland, and also promote the improvement of agricultural production technology and ensure the supply of agricultural products by increasing the yield per unit area.
On the other hand, the spillover effect of knowledge and technology, accompanied by the accelerated urbanization process, improves the levels of agricultural technology and management; improves the quality of farmers, and provides the dynamic support to technology, management, and talent for the upgrading of the agricultural industrial structure [53]. At the same time, the rapid development of agricultural production equipment or agricultural elements of production in the process of urbanization, through market mechanisms and policies in order to guide the agglomeration and allocation of advanced production elements, such as talent, equipment, technology, and management, to agricultural or rural areas, can effectively improve the technical and management content of agriculture, increase the agricultural labor productivity and land output rate, and promote agricultural technological progress and technological efficiency improvements [54]. Additionally, the urbanization process, along with the increase in the urban population and improvements in living standards, results in urban residents requiring high-quality agricultural products; in particular, it increases the demand for rural tourism, leisure, and vacations. This will promote the development of ecological agriculture and tourism agriculture and will cause agricultural production to be guided toward a more functional evolution direction, thus driving the adjustment of the agricultural structure and industrial structure, as well as promoting the modernization of agriculture and rural development, to a certain extent. However, the long-standing urban–rural dual economic structure in China has hindered the smooth flow of labor, capital, technology, and other factors between the urban and rural, to some extent, and restricted the process of agricultural and rural modernization.
Additionally, from the results of the regional heterogeneity analysis, the impact of the urbanization level on agricultural technical efficiency in Heilongjiang Province is higher than that in Liaoning Province. As for Liaoning Province, although the urbanization level has been slow in recent years, it has already reached a high level, and, what should be considered in the future, is how to realize the full and balanced development of urbanization. As for Heilongjiang Province, although there is an obvious catch-up effect, as the ballast stone of national food security, special attention should be paid to prevent the problem of converting farmland into non-grain production in the process of urbanization. As for the whole Northeast Region, it has been confronted with the problems of stagnant development and brain drain in recent years; and as the main grain-production base, it has been burdened with greater pressures of grain export and resource consumption, and has made great contributions and sacrifices to ensure the national food security [8]. In the future, from the perspective of national macro-control, we should guide the flow of labor, technology, capital, and other production factors to the Northeast Region through policy means and promote the coordinated development of urbanization and the agricultural and rural modernization, to realize high-quality development in the Northeast Region while ensuring food security.
6. Conclusions
In this paper, based on the measurement of the agricultural technical efficiency and urbanization level, we explore the impact of urbanization on the agricultural technical efficiency in 34 prefecture-level cities in Northeast China from the perspective of overall urbanization, population urbanization, land urbanization, economic urbanization, and we also conducted a regional heterogeneity analysis. We found that, from the results of the agricultural technical efficiency, except for some cities that achieved technical efficiency in individual years, such as Yichun in 2012 (1.003), and Benxi in 2015 and 2016 (1.011 and 1.254, respectively), the overall level of agricultural technical efficiency in the Northeast Region was still relatively low. From the results of urbanization, the level of overall urbanization in Liaoning was significantly higher than that in Heilongjiang and Jilin. The population urbanization and land urbanization levels of most cities were relatively high, but an obvious further improvement trend was not observed; some cities even appeared to undergo the phenomenon of “anti-urbanization”. Economic urbanization showed an obvious characteristic of “high begins and low ends” in the northeast. From the results of the impact of urbanization on agricultural technical efficiency, except for population urbanization, overall urbanization, land urbanization, and economic urbanization, all had a significant positive effect on the agricultural technical efficiency. Moreover, the effect on Heilongjiang was higher than that on Liaoning province, and Heilongjiang province showed an obvious catch-up trend. Overall, this paper explores the impact of urbanization on agricultural technical efficiency more comprehensively and systematically, and the conclusions have more reference significance for promoting the coordinated development of urbanization, along with agricultural and rural modernization in the Northeast Region.
Based on this, the political implications of this research include the following aspects: First, the reform of the land system, household registration system, and social security system should be accelerated, and the circulation of production factors such as labor should be smoothed. The threshold for urban residency should be lowered; the urbanization rate of the registered resident population should be raised; and the orderly transformation of agricultural laborers into urban citizens should be realized. Second, increasing the investment in science and technology, improving the level of coordinated development of industry, universities and research institutes, strengthening the application of scientific research results, and promoting the modernization of agriculture and rural areas will have a positive effect. Meanwhile, strengthening vocational training for the agricultural labor force, especially the low-skilled labor force, and improving its overall quality and employability is essential. Third, sticking to the red line of cultivated land, preventing the conversion of farmland into non-grain or non-agricultural land, strengthening the government macro-control to help major grain-producing regions, and improving the compensation mechanism for major grain-producing regions from major consumption regions are necessary.
Author Contributions
Conceptualization, Z.Z. and P.P.; methodology, P.P.; writing—original draft preparation, Z.Z., J.W. and H.L.; writing—review and editing, Z.Z.; supervision, F.Z.; project administration, Z.Z. All authors have read and agreed to the published version of the manuscript.
Funding
This study was financially supported by the Youth Project of Liaoning Provincial Philosophy, the Social Science Planning Fund (L21CJY012), and the Commissioned Project of Young Talents Training Object of Philosophy and Social Sciences in Liaoning Province in 2022 (2022lslqnrcwtkt-34).
Conflicts of Interest
The authors declare no conflict of interest.
References
- Farrell, M.J. The measurement of productive efficiency. J. R. Stat. Soc. Ser. A 1957, 120, 253–281. [Google Scholar] [CrossRef]
- Leibenstein, H. Allocative efficiency vs. “X-efficiency”. Am. Econ. Rev. 1966, 56, 392–415. [Google Scholar]
- Mwalupaso, G.E.; Wang, S.; Rahman, S.; Alavo, E.J.P.; Tian, X. Agricultural informatization and technical efficiency in maize production in Zambia. Sustainability 2019, 11, 2451. [Google Scholar] [CrossRef]
- Adom, P.K.; Adams, S. Decomposition of technical efficiency in agricultural production in Africa into transient and persistent technical efficiency under heterogeneous technologies. World Dev. 2020, 129, 104907. [Google Scholar] [CrossRef]
- Huang, W.; Bruemmer, B.; Huntsinger, L. Technical efficiency and the impact of grassland use right leasing on livestock grazing on the Qinghai-Tibetan Plateau. Land Use Policy 2017, 64, 342–352. [Google Scholar] [CrossRef]
- Deng, X.; Gibson, J. Improving eco-efficiency for the sustainable agricultural production: A case study in Shandong, China. Technol. Forecast. Soc. Chang. 2019, 144, 394–400. [Google Scholar] [CrossRef]
- Liu, D.; Zhu, X.; Wang, Y. China’s agricultural green total factor productivity based on carbon emission: An analysis of evolution trend and influencing factors. J. Clean. Prod. 2021, 278, 123692. [Google Scholar] [CrossRef]
- Liu, Y.; Zhou, Y. Reflections on China’s food security and land use policy under rapid urbanization. Land Use Policy 2021, 109, 105699. [Google Scholar] [CrossRef]
- Zhou, J.; Yu, X.; Jin, X.; Mao, N. Government Competition, Land Supply Structure and Semi-Urbanization in China. Land 2021, 10, 1371. [Google Scholar] [CrossRef]
- Li, J.; Sun, Z. Does the transfer of state-owned land-use rights promote or restrict urban development? Land Use Policy 2021, 100, 104945. [Google Scholar] [CrossRef]
- Hong, T.; Yu, N.; Mao, Z.; Zhang, S. Government-driven urbanisation and its impact on regional economic growth in China. Cities 2021, 117, 103299. [Google Scholar] [CrossRef]
- Ji, Y.; Guo, X.; Zhong, S.; Wu, L. Land financialization, uncoordinated development of population urbanization and land urbanization, and economic growth: Evidence from China. Land. 2020, 9, 481. [Google Scholar] [CrossRef]
- Lu, X.; Shi, Z.; Li, J.; Dong, J.; Song, M.; Hou, J. Research on the Impact of Factor Flow on Urban Land Use Efficiency from the Perspective of Urbanization. Land 2022, 11, 389. [Google Scholar] [CrossRef]
- Cai, F. The great exodus: How agricultural surplus laborers have been transferred and reallocated in China’s reform period? China Agric. Econ. Rev. 2018, 10, 0178. [Google Scholar] [CrossRef]
- Liu, H.; Zhou, Y. Urbanization, land use behavior and land quality in rural china: An analysis based on pressure-response-impact framework and sem approach. Int. J. Environ. Res. Public Health 2018, 15, 2621. [Google Scholar] [CrossRef]
- Zhong, C.; Hu, R.; Wang, M.; Xue, W.; He, L. The impact of urbanization on urban agriculture: Evidence from China. J. Clean. Prod. 2020, 276, 122686. [Google Scholar] [CrossRef]
- Fang, C.; Cui, X.; Li, G.; Bao, C.; Wang, Z.; Ma, H.; Sun, S.; Liu, H.; Luo, K.; Ren, Y. Modeling regional sustainable development scenarios using the Urbanization and Eco-environment Coupler: Case study of Beijing-Tianjin-Hebei urban agglomeration, China. Sci. Total Environ. 2019, 689, 820–830. [Google Scholar] [CrossRef]
- Feng, W.; Liu, Y.; Qu, L. Effect of land-centered urbanization on rural development: A regional analysis in China. Land Use Policy 2019, 87, 104072. [Google Scholar] [CrossRef]
- Li, Y.; Jia, L.; Wu, W.; Yan, J.; Liu, Y. Urbanization for rural sustainability–Rethinking China’s urbanization strategy. J. Clean. Prod. 2018, 178, 580–586. [Google Scholar] [CrossRef]
- Zhang, R.; Jiang, G.; Zhang, Q. Does urbanization always lead to rural hollowing? Assessing the spatio-temporal variations in this relationship at the county level in China 2000–2015. J. Clean. Prod. 2019, 220, 9–22. [Google Scholar] [CrossRef]
- Laha, A.; Kuri, P.K. Measurement of allocative efficiency in agriculture and its determinants: Evidence from rural West Bengal, India. Int. J. Agric. Res. 2011, 6, 377–388. [Google Scholar] [CrossRef][Green Version]
- Zhao, Z.; Bai, Y.; Wang, G.; Chen, J.; Yu, J.; Liu, W. Land eco-efficiency for new-type urbanization in the Beijing-Tianjin-Hebei Region. Technol. Forecast. Soc. 2018, 137, 19–26. [Google Scholar] [CrossRef]
- Lu, W.; Sarkar, A.; Hou, M.; Liu, W.; Guo, X.; Zhao, K.; Zhao, M. The Impacts of Urbanization to Improve Agriculture Water Use Efficiency—An Empirical Analysis Based on Spatial Perspective of Panel Data of 30 Provinces of China. Land 2022, 11, 80. [Google Scholar] [CrossRef]
- Zhao, H.; Zhai, X.; Guo, L.; Liu, K.; Huang, D.; Yang, Y.; Li, J.; Xie, S.; Zhang, C.; Tang, S.; et al. Assessing the efficiency and sustainability of wheat production systems in different climate zones in China using emergy analysis. J. Clean. Prod. 2019, 235, 724–732. [Google Scholar] [CrossRef]
- Chen, N.; Qin, F.; Zhai, Y.; Cao, H.; Zhang, R.; Cao, F. Evaluation of coordinated development of forestry management efficiency and forest ecological security: A spatiotemporal empirical study based on China’s provinces. J. Clean. Prod. 2020, 260, 121042. [Google Scholar] [CrossRef]
- Andersen, P.; Petersen, N.C. A procedure for ranking efficient units in data envelopment analysis. Manag. Sci. 1993, 39, 1261–1264. [Google Scholar] [CrossRef]
- Shi, C.; Li, L.; Chiu, Y.H.; Pang, Q.; Zeng, X. Spatial differentiation of agricultural water resource utilization efficiency in the Yangtze River Economic Belt under changing environment. J. Clean. Prod. 2022, 346, 131200. [Google Scholar] [CrossRef]
- Zhang, F.; Xiao, Y.; Gao, L.; Ma, D.; Su, R.; Yang, Q. How agricultural water use efficiency varies in China—A spatial-temporal analysis considering unexpected outputs. Agric. Water Manag. 2022, 260, 107297. [Google Scholar] [CrossRef]
- Liu, Y. Introduction to land use and rural sustainability in China. Land Use Policy 2018, 74, 1–4. [Google Scholar] [CrossRef]
- Yuan, J.; Lu, Y.; Ferrier, R.C.; Liu, Z.; Su, H.; Meng, J.; Song, S.; Jenkins, A. Urbanization, rural development and environmental health in China. Environ. Dev. 2018, 28, 101–110. [Google Scholar] [CrossRef]
- Hou, X.; Liu, J.; Zhang, D.; Zhao, M.; Xia, C. Impact of urbanization on the eco-efficiency of cultivated land utilization: A case study on the Yangtze River Economic Belt, China. J. Clean. Prod. 2019, 238, 117916. [Google Scholar] [CrossRef]
- Zhou, Y.; Kong, Y.; Wang, H.; Luo, F. The impact of population urbanization lag on eco-efficiency: A panel quantile approach. J. Clean. Prod. 2020, 244, 118664. [Google Scholar] [CrossRef]
- Shang, J.; Ji, X.Q.; Chen, X.M. Study on the impact of China’s urbanization on agricultural ecological efficiency: Based on panel data of 13 major grain-producing regions in China from 2009 to 2018. Chin. J. Eco-Agric. 2020, 28, 1265–1276. [Google Scholar]
- Tang, M.; Li, Z.; Hu, F.; Wu, B. How does land urbanization promote urban eco-efficiency? The mediating effect of industrial structure advancement. J. Clean. Prod. 2022, 272, 122798. [Google Scholar] [CrossRef]
- Koroso, N.H.; Lengoiboni, M.; Zevenbergen, J.A. Urbanization and urban land use efficiency: Evidence from regional and Addis Ababa satellite cities, Ethiopia. Habitat Int. 2021, 117, 102437. [Google Scholar] [CrossRef]
- Ding, X.; Cai, Z.; Fu, Z. Does the new-type urbanization construction improve the efficiency of agricultural green water utilization in the Yangtze River Economic Belt? Environ. Sci. Pollut. Res. 2021, 28, 64103–64112. [Google Scholar] [CrossRef]
- Ren, Y.; Li, H.; Shen, L.; Zhang, Y.; Chen, Y.; Wang, J. What is the efficiency of fast urbanization? A China study. Sustainability 2018, 10, 3180. [Google Scholar] [CrossRef]
- Zhao, Z.; Deng, X.; Zhang, F.; Li, Z.; Shi, W.; Sun, Z.; Zhang, X. Scenario Analysis of Livestock Carrying Capacity Risk in Farmland from the Perspective of Planting and Breeding Balance in Northeast China. Land 2022, 11, 362. [Google Scholar] [CrossRef]
- Song, G.; Zhang, H. Cultivated land use layout adjustment based on crop planting suitability: A case study of typical counties in Northeast China. Land 2021, 10, 107. [Google Scholar] [CrossRef]
- Liu, Y.; Yan, B.; Wang, Y.; Zhou, Y. Will land transfer always increase technical efficiency in China?—A land cost perspective. Land Use Policy 2019, 82, 414–421. [Google Scholar] [CrossRef]
- Zhu, W.; Wang, M.; Zhang, B. The effects of urbanization on PM2.5 concentrations in China’s Yangtze River Economic Belt: New evidence from spatial econometric analysis. J. Clean. Prod. 2019, 239, 118065. [Google Scholar] [CrossRef]
- Liu, Z.; Yang, D.; Wen, T. Agricultural production mode transformation and production efficiency: A labor division and cooperation lens. China Agric. Econ. Rev. 2018, 11, 160–179. [Google Scholar] [CrossRef]
- Pei, Y.; Zhu, Y.; Liu, S.; Wang, X.; Cao, J. Environmental regulation and carbon emission: The mediation effect of technical efficiency. J. Clean. Prod. 2019, 236, 117599. [Google Scholar] [CrossRef]
- Zhu, Y.; Zhang, Y.; Piao, H. Does agricultural mechanization improve the green total factor productivity of China’s planting industry? Energies 2022, 15, 940. [Google Scholar] [CrossRef]
- Wang, Y.; Xie, L.; Zhang, Y.; Wang, C.; Yu, K. Does FDI promote or inhibit the high-quality development of agriculture in China? An agricultural GTFP perspective. Sustainability 2019, 11, 4620. [Google Scholar] [CrossRef]
- Zhang, X.; Wang, J.; Song, W.; Wang, F.; Gao, X.; Liu, L.; Dong, K.; Yang, D. Decoupling analysis between rural population change and rural construction land changes in China. Land 2022, 11, 231. [Google Scholar] [CrossRef]
- Ren, W.; Xue, B.; Yang, J.; Lu, C. Effects of the Northeast China revitalization strategy on regional economic growth and social development. Chin. Geogr. Sci. 2020, 30, 791–809. [Google Scholar] [CrossRef]
- Guo, Y.; Tong, L.; Mei, L. The effect of industrial agglomeration on green development efficiency in Northeast China since the revitalization. J. Clean. Prod. 2020, 258, 120584. [Google Scholar] [CrossRef]
- Ma, Z.; Li, C.; Zhang, J. Understanding urban shrinkage from a regional perspective: Case study of Northeast China. J. Urban Plan. Dev. 2020, 146, 05020025. [Google Scholar] [CrossRef]
- Ranagalage, M.; Murayama, Y.; Dissanayake, D.M.S.L.B.; Simwanda, M. The impacts of landscape changes on annual mean land surface temperature in the tropical mountain city of Sri Lanka: A case study of Nuwara Eliya (1996–2017). Sustainability 2019, 11, 5517. [Google Scholar] [CrossRef]
- Lele, U.; Goswami, S. The fourth industrial revolution, agricultural and rural innovation, and implications for public policy and investments: A case of India. Agric. Econ. 2017, 48, 87–100. [Google Scholar] [CrossRef]
- Chen, M.; Ye, C.; Lu, D.; Sui, Y.; Guo, S. Cognition and construction of the theoretical connotations of new urbanization with Chinese characteristics. J. Geogr. Sci. 2019, 29, 1681–1698. [Google Scholar] [CrossRef]
- Guan, X.; Wei, H.; Lu, S.; Dai, Q.; Su, H. Assessment on the urbanization strategy in China: Achievements, challenges and reflections. Habitat Int. 2018, 71, 97–109. [Google Scholar] [CrossRef]
- Ma, L.; Long, H.; Zhang, Y.; Tu, S.; Ge, D.; Tu, X. Agricultural labor changes and agricultural economic development in China and their implications for rural vitalization. J. Geogr. Sci. 2019, 29, 163–179. [Google Scholar] [CrossRef]


Publisher’s Note: MDPI stays neutral with regard to jurisdictional claims in published maps and institutional affiliations. |
© 2022 by the authors. Licensee MDPI, Basel, Switzerland. This article is an open access article distributed under the terms and conditions of the Creative Commons Attribution (CC BY) license (https://creativecommons.org/licenses/by/4.0/).