Article

Chemical Characterization, Source Identification, and Health Risk Assessment of Atmospheric Fine Particulate Matter in Winter in Hangzhou Bay

1
Zhejiang Provincial Key Laboratory of Organic Pollution Process and Control, College of Environmental and Resource Sciences, Zhejiang University, Hangzhou 310058, China
2
State Environmental Protection Key Laboratory of Formation and Prevention of Urban Air Pollution Complex, Shanghai Academy of Environment Sciences, Shanghai 200233, China
3
Department of Environment, Yangtze Delta Region Institute of Tsinghua University, Jiaxing 314006, China
4
Shanghai Key Laboratory of Atmospheric Particle Pollution and Prevention (LAP3), Fudan University, Shanghai 200438, China
5
School of Environmental and Geographical Sciences, Shanghai Normal University, Shanghai 200234, China
6
Hangzhou PuYu Technology Development Co., Ltd., Hangzhou 311305, China
7
Jiaxing Ecological and Environmental Monitoring Center of Zhejiang Province, Jiaxing 314001, China
*
Author to whom correspondence should be addressed.
Sustainability 2022, 14(19), 12175; https://doi.org/10.3390/su141912175
Submission received: 6 August 2022 / Revised: 17 September 2022 / Accepted: 21 September 2022 / Published: 26 September 2022
(This article belongs to the Special Issue Aerosols and Air Pollution)

Abstract

:
PM2.5 is an important pollutant which affects air quality and human health. In this study, chemical components (water-soluble inorganic ions, organic carbons (OC), elemental carbons (EC), and elemental metals) and health effects were analyzed in wintertime in a suburban area in Hangzhou Bay. OC and SNA (sulfate, nitrate, and ammonium) contributed 76.2% to local PM2.5. NH4+ existed mainly in the form of (NH4)2SO4 and NH4NO3. Seven sources were resolved from PMF analysis, namely secondary inorganic aerosol (31.8%), vehicle exhaust (19.5%), industry mixed with coal combustion (16.3%), crustal dust (9.5%), biomass burning (9.4%), sea salt (8.7%), and the leather industry (4.8%). Potential source contribution function (PSCF) and concentration weighted trajectory (CWT) analysis were applied to study regional transport in this region. Secondary inorganic formation was enhanced from the air plume from the northwest, especially from north Jiangsu Province. The results of the health risk assessment of associated metals indicated the higher potential of Cr and Mn to cause noncarcinogenic effects in children. A significant carcinogenic risk was observed for all people of Cr emitted from the leather industry. Our results showed the chemical characterization and sources of PM2.5 in a suburban region, the health effects of which should be addressed in future policies to safeguard public health, especially in the leather industry.

1. Introduction

Recently, China has developed rapidly in its economics and urbanization, leading to associated air pollution. PM2.5 (particles with aerodynamic diameter no more than 2.5 μm) pollution has attracted more focus due to its important influences on haze formation, climate change, human health, and economic loss [1,2,3]. Thanks to the implementation of the Air Pollution Prevention and Control Action Plan in 2013 and the Blue-Sky Defense War in 2018, in terms of energy construction adjustment and optimization, the national annual PM2.5 concentration declined from 72 μg/m3 in 2013 to 30 μg/m3 in 2021 (data from Ministry of Ecology and Environment of the People’s Republic of China, https://www.mee.gov.cn/hjzl/sthjzk/ (accessed on 27 May 2014)). However, it is still much higher than the newly published guidelines (5 μg/m3) for annual PM2.5 concentration from the WHO in 2021 (https://www.who.int/publications/i/item/9789240034433 (accessed on 27 May 2022)).
PM2.5 originates from various sources by primary emissions and secondary formation, such as coal combustion, vehicle emissions, crustal dust, industry, and ship emissions [4,5]. With the objective of controlling air pollution, source apportionment is widely performed to resolve the potential sources of air pollutants using the chemical mass balance model (CMB) and positive matrix factorization (PMF) [6,7,8]. However, limited examples in the literature have investigated the source-associated health risks of elements in PM2.5. Toxic heavy metals and organics (e.g., PAHs) have become important contents increasing the health risks of PM2.5 [9,10,11]. Previous studies indicate that PM2.5-bound heavy metals can cause oxidative DNA damage [12]. Thus, field campaigns, either long-term or short-term, are performed to study the composition, spatiotemporal variation, and potential emission sources, as well as to evaluate the health risks of PM2.5-associated heavy metals [13,14,15,16].
The Yangtze River Delta region (YRD) is one of the highest industrialized and urbanized regions in China, while most of the studies on atmospheric chemistry are performed in Shanghai or Jiangsu Province [17,18,19,20]. As another fast-developing province in YRD, Zhejiang province attracts less attention than the above provinces, and the campaigns are mainly conducted in urban areas, such as Hangzhou and Ningbo [21,22,23,24,25]. Sources extracted from PMF analysis indicated that secondary formation and vehicle emissions were the top two factors contributing to the local PM2.5 pollution [25]. However, with the rapid urbanization and industrialization of the suburban areas and new rural construction, air pollution and its health effects on residents in suburban and rural regions in Zhejiang Province should also receive attention [26,27].
In this study, PM2.5 was collected from a suburban area near Hangzhou City, the capital of Zhejiang province in wintertime. The main purposes of this work include: (1) to study the compositions and pollution characteristics of PM2.5; (2) to determine the main emission sources and originated regions of PM2.5; and (3) to evaluate the noncarcinogenic and carcinogenic health risks of heavy metals and the source-associated health risks.

2. Materials and Methods

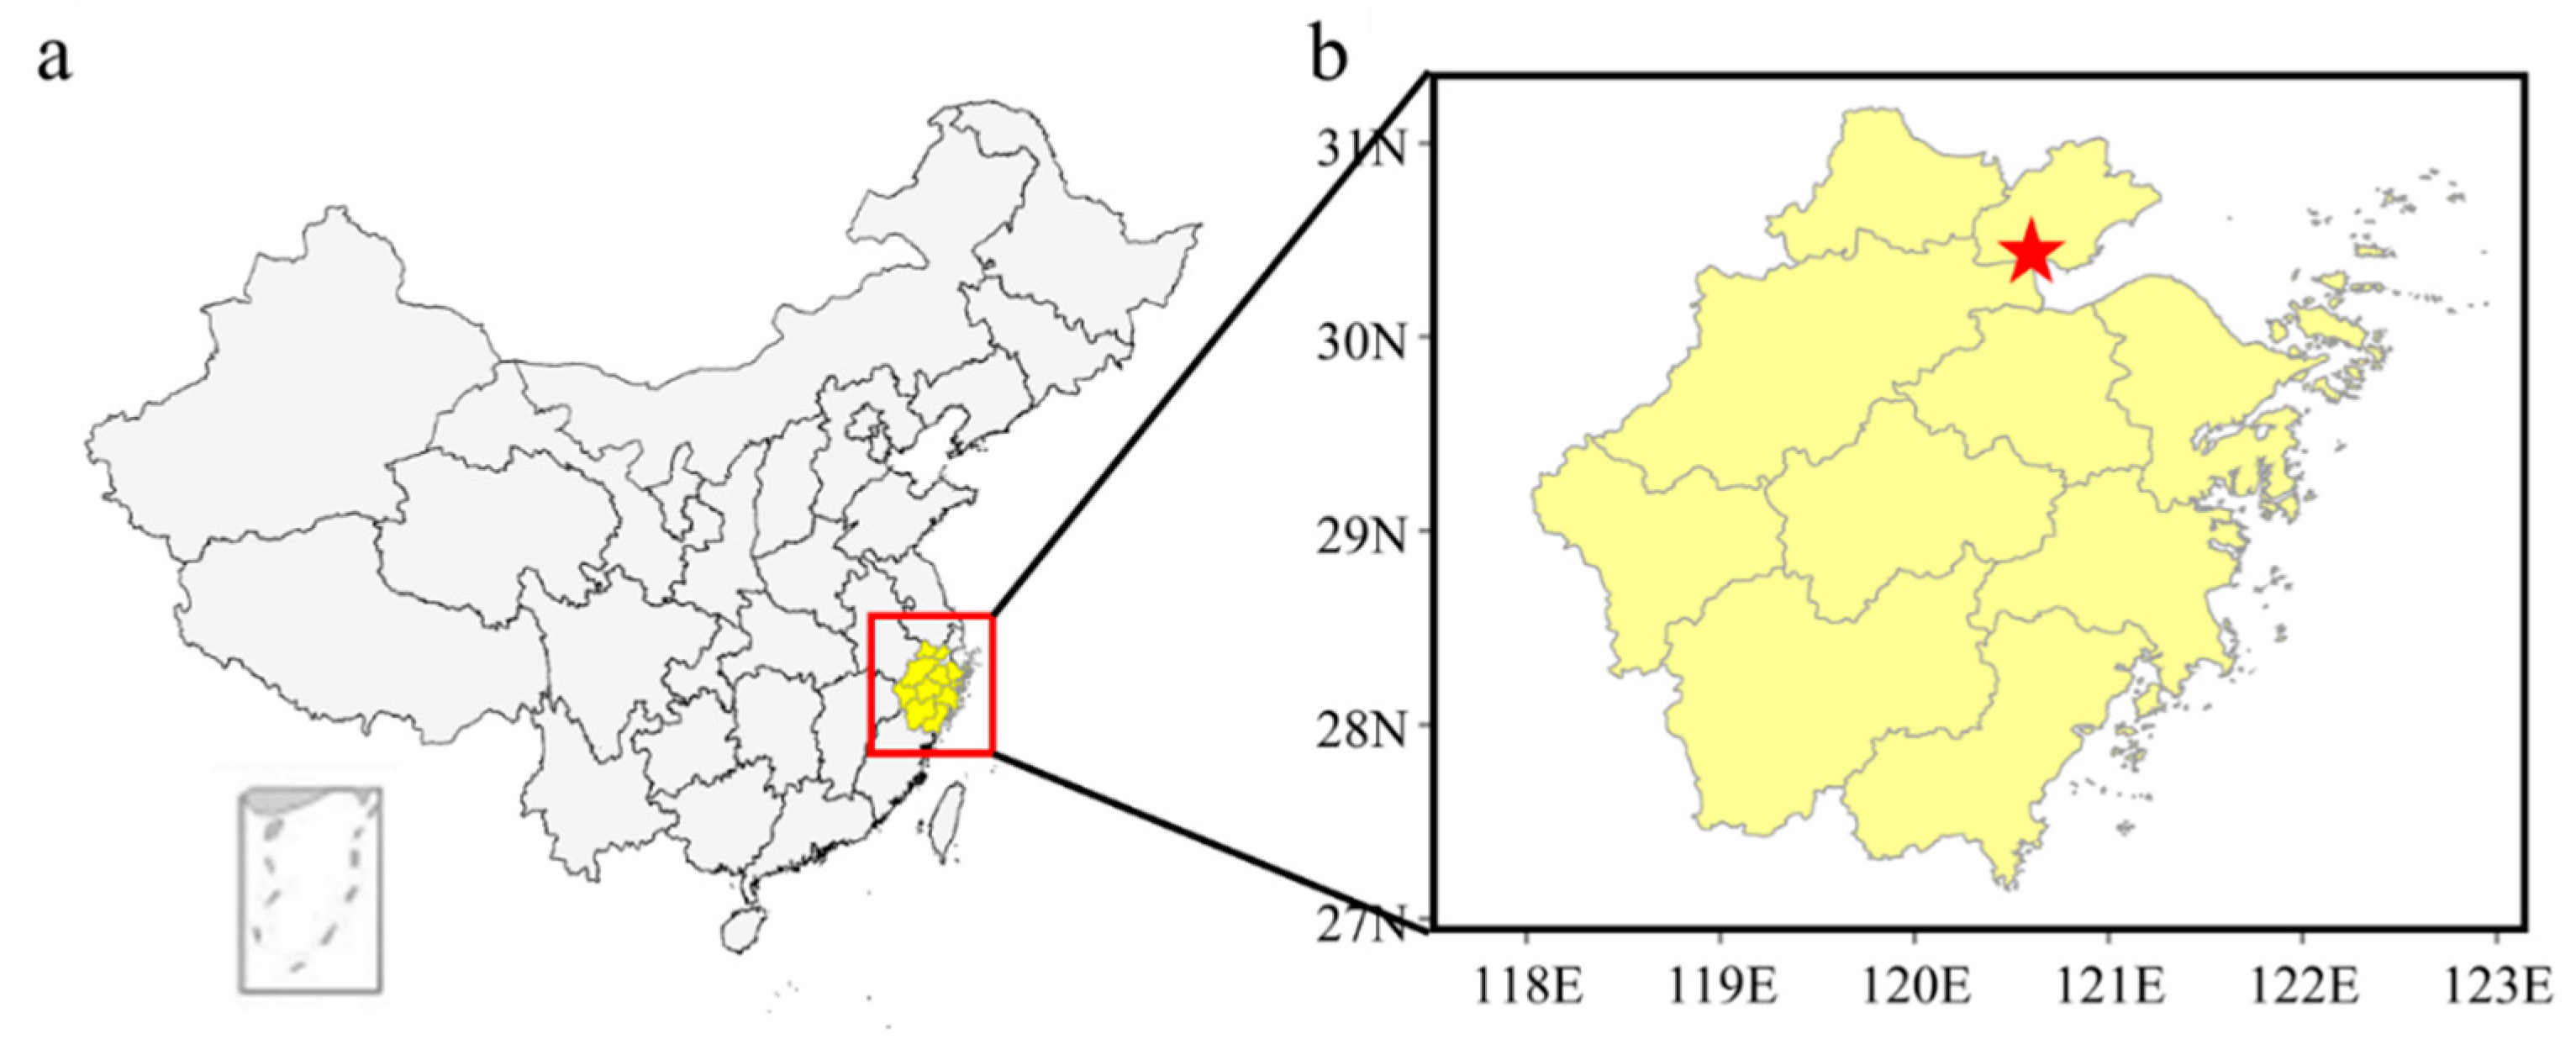
2.1. Site Description

The sampling site was chosen at Haining County (30.46° N, 120.51° E), which is located in Jiaxing City, Zhejiang Province (Figure 1). Haining is a satellite city of Hangzhou, the capital of Zhejiang Province. The surroundings near the sampling site included some restaurants, residential districts, and industries. There was a main street about 200 m west of the sampling site, so traffic emissions may be important for this site. Thus, it could represent the characteristics of the PM2.5 pollution at Haining County. Due to the relatively heavy PM2.5 pollution in wintertime, especially in December (Figures S1 and S2 and Table 1), the field campaign was conducted in winter, from 14 December 2019 to 4 January 2020, across weekdays as well as weekends. The starting sampling time was 0:00, 6:00, 12:00, and 18:00, respectively, and the sampling period lasted 5 h for each sample. A total of 53 samples and 2 blank samples were collected during the campaign.

2.2. Component Analysis

2.2.1. Weighing Procedure and PM2.5 Sampling

The quartz filters were baked in the oven at 450 °C for 4 h to remove the organic residuals on the filters. After pretreatment, the filters were balanced in an automatic constant temperature (25 ± 5 °C) and humidity (50 ± 5%) precision weighing system (CR-E, Weizhizhao Co., Ltd., Hangzhou, China) for 48 h and then weighed by an electronic balance (EX-1025a, Lester Scientific Instruments Co., Ltd., Xiamen, China) with high accuracy (10 μg). Every filter was required to be weighed at least twice to keep the difference smaller than 15 μg. After weighing, all of the filters were stored in a refrigerator at −20 °C.
The PM2.5 sampler (PMS-200A, Concentrating Light Technology (Hangzhou) Co., Ltd., Hangzhou, China) was installed on the top of a 5-floor building, which was about 20 m above the ground. The sampling site was 7 km away from the Qiantang River, which flows into the East China Sea. The sampling flow rate for PM2.5 was 16.67 L/min. All of the sampled filters were stored in a refrigerator at −20 °C to avoid contamination and volatilization.

2.2.2. OC and EC Analysis

Organic carbon (OC) and elemental carbon (EC) in PM2.5 were measured using a thermal/optical carbon analyzer (DRI Model 2001, Atmoslytic Inc., Calabasas, CA, USA) following the IMPROVE (Interagency Monitoring of Protected Visual Environments) protocol. Before the measurement, firstly, the residual organics left in the instrument were cleaned by running the BAKEOVEN procedure. A 0.52 cm2 quartz filter cut from the whole sampled filter was placed in a quartz vessel and proceeded with different temperature programs when measuring OC and EC. Briefly, when detecting OC, the samples were exposed to helium (He) and the temperature was increased to 140 °C, 280 °C, 480 °C. and 580 °C periodically. When it came to EC determination, the carrier gas was He mixed with 2% O2 and the samples were gradually heated from 580 °C, to 740 °C, to 840 °C. OC and EC were oxidized to CO2 in a MnO2 oven firstly, and then in the presence of Ni and H2, CO2 was reduced to CH4 in a reduction furnace. The cutting point of OC/EC was determined by measuring the reflectivity and transmittance of the filter using a laser signal at 633 nm wavelength [28]. IMPROVE defined the OC as the OC1 + OC2 + OC3 + OC4 + OPC, and the EC as the EC1 + EC2 + EC3 − OPC. During the analysis, blank samples were tested for removing the interferences. The instrument was calibrated by using sucrose solution before and after the measurement. The detection limit of the OC/EC analyzer was 0.2 μgC/cm2, 0.82 μgC/cm2 and 0.93 μgC/cm2 for TOC (total organic carbon), TEC (total elemental carbon), and TC (total carbon), respectively.

2.2.3. WSIIs Analysis

A quarter of the sampled filters were cut into small pieces by a ceramic scissor for water-soluble inorganic ion (WSII) analysis. The pieces were soaked in 25 mL deionized water (18.2 MΩcm; Millipore, MA, USA) in a centrifuge tube and extracted for 30 min twice in an ultrasonic bath with ice to keep room temperature. Then, the extracted solutions were filtered by a 0.22 μm microporous membrane to remove impurities and stocked at 4 °C in the refrigerator for further analysis [29]. The concentration of WSIIs in PM2.5 samples was determined by ion chromatography (ICS-900, Thermo Fisher, Waltham, MA, USA). Anion species (SO42−, NO3−, and Cl) were detected with a Metrosep A5-25 separator column, and cation ions (K+, Ca2+, Na+, Mg2+, and NH4+) were measured with a Metrosep C2-250 separator column. The mobile phase of the ion chromatography was 20 mmol of methanesulfonic acid (MSA). The detection limit of each inorganic ion was calculated as 3 times the standard deviation of the determination process of low concentration standard sample (Table S1). When conducting the sample testing, a standard sample was added among every 10 samples to check the stability of the instrument.

2.2.4. Heavy Metal Analysis

The heavy metals in PM2.5 were detected by an inductively coupled plasma mass spectrometer (ICP-MS, Agilent 7700, USA). A quarter of the sampled filters were cut into small pieces and stored in the digestion tank for further analysis. The pieces were immersed in 10.0 mL of a HNO3-HCl mixture solution and proceeded in an automatic graphite digestion instrument (Thomas Cain, DEENA II, USA) for digestion. The digestion lasted for 15 min at a temperature of 200 °C. After cooling, the extraction was diluted to 50 mL with deionized water [30]. A total of 13 elements (Al, V, Cr, Mn, Fe, Cu, Zn, As, Mo, Cd, Sb, Ba, Pb) were analyzed, since the other elements were under the detection limit of ICP-MS. The detection limit was within the range of 0.1–0.5 ppt and the sensitivity of the instrument was 10−7–5 × 10⁻⁷.

2.3. Data Analysis

2.3.1. PMF

EPA PMF 5.0 was used in this study to resolve the possible emission source in this area. After checking the data (WSIIs, OC, EC, and metals) obtained from the offline instruments, a total of 27 chemical components were input as parameters, including OC (OC1, OC2, OC3, OC4), EC (EC1, EC2), WSIIs (NO3, SO42−, Cl, NH4+, K+, Mg2+, Ca2+, Na+), and 13 elements (Al, V, Cr, Mn, Fe, Cu, Zn, As, Mo, Cd, Sb, Ba, Pb). The uncertainty calculation in this study follows the equation as follows [31]:
Unc = { 5 6 D L ,       c < D L ( E r r o r   F r a c t i o n × c o n c e n t r a t i o n ) 2 + ( 0.5 × D L ) 2 ,       c > D L
Error fraction was 10% in this study, and the DL was the detection limit of each species. Seven reasonable factors were selected after several attempts.

2.3.2. Backward Trajectory and Clustering

The backward trajectory analysis was conducted using Meteoinfo software. In this study, 48 h backward trajectory with 6 h interval was generated. The spatial resolution was 0.5° × 0.5°. The meteorological data were downloaded from the Global Data Assimilation System (GDAS) of the National Center for Environmental Prediction (https://www.ready.noaa.gov/archives.php (accessed on 4 January 2022)). The arrival height of clusters was set to 500 m for the long-range transport study [32,33]. Then, the clustering analysis was conducted based on the trajectories using Meteoinfo software.

2.3.3. PSCF and CWT Analysis

In order to analyze the regional transport of different sources, potential source contribution function (PSCF) and concentration weighted trajectory (CWT) analyses were applied to the potential emission sources resolved from PMF analysis. Briefly, the PSCF and CWT values in the ijth cell were defined as below:
P S C F i j = m i j / n i j
C W T i j = l 1 M C l T i j l / l = 1 M T i j l
where nij was the total number of trajectory endpoints which fell into the ijth cell and mij was the number of polluted trajectory endpoints in the same cell whose concentration was higher than the threshold criterion. M was the total number of trajectory l. Cl was the measured concentration of different species of trajectory l. Tij was the duration that trajectory l stayed in the ijth cell. The critical value in this study was set as the mean concentration of each source factor or species. To minimize the uncertainty of values smaller than 3 times nij, a weight function Wij was applied to PSCF and CWT analysis, and the calculation equation was as follows [34]:
W i j = { 1.00 n i j > 3 n A v e 0.70 3 n A v e > n i j > n A v e 0.42 n A v e > n i j > 0.5 n A v e 0.17 0.5 n A v e > n i j > 0 }

2.4. Health Risk Assessment Methods

The respiratory health risk assessment of heavy metals (e.g., As, Cr, Mn, Cu, Cd, Pb and Zn) were studied using the hazard quotient (HQ) and the lifetime cancer risk model proposed by the United States National Environmental Protection Agency (US EPA). First, the average daily inhalation exposure doses of each compound were calculated as the following equations:
( L ) ADD = C × IRi × EF × ED BW × AT
where ADD and LADD represented daily exposure dose of noncarcinogenic and carcinogenic heavy metals (mg kg−1 d−1), respectively (Table S2). C was the upper limit of the 95% confidence interval for the mean concentration of heavy metals in PM2.5 (mg/m3) [35], which was calculated by SPSS software. The rest of the detailed parameters used in the model are explained in Table 2.
The health risks caused by heavy metals could be divided into noncarcinogens and carcinogens. The noncarcinogenic risk hazard quotient (HQ) and carcinogenic risk (CR) for heavy metals were calculated as the following equations:
HQ = ADD R f D
CR = LADD SF
where RfD was the reference dose of each PM2.5-bound heavy metal (Table S3) and SF was the carcinogenic slope factor. If HQ was smaller than 1, it indicated that the noncarcinogenic risk could be negligible; if HQ was above 1, then it meant that there was a noncarcinogenic risk. When CR was larger than 10 × 10−6, it implied that there was a carcinogenic risk; if CR was between 10 × 10−6 and 10 × 10−4, the carcinogenic risk was within the scope (Table S4). It should receive more attention if CR was larger than 10 × 10−4 [30].

3. Results and Discussion

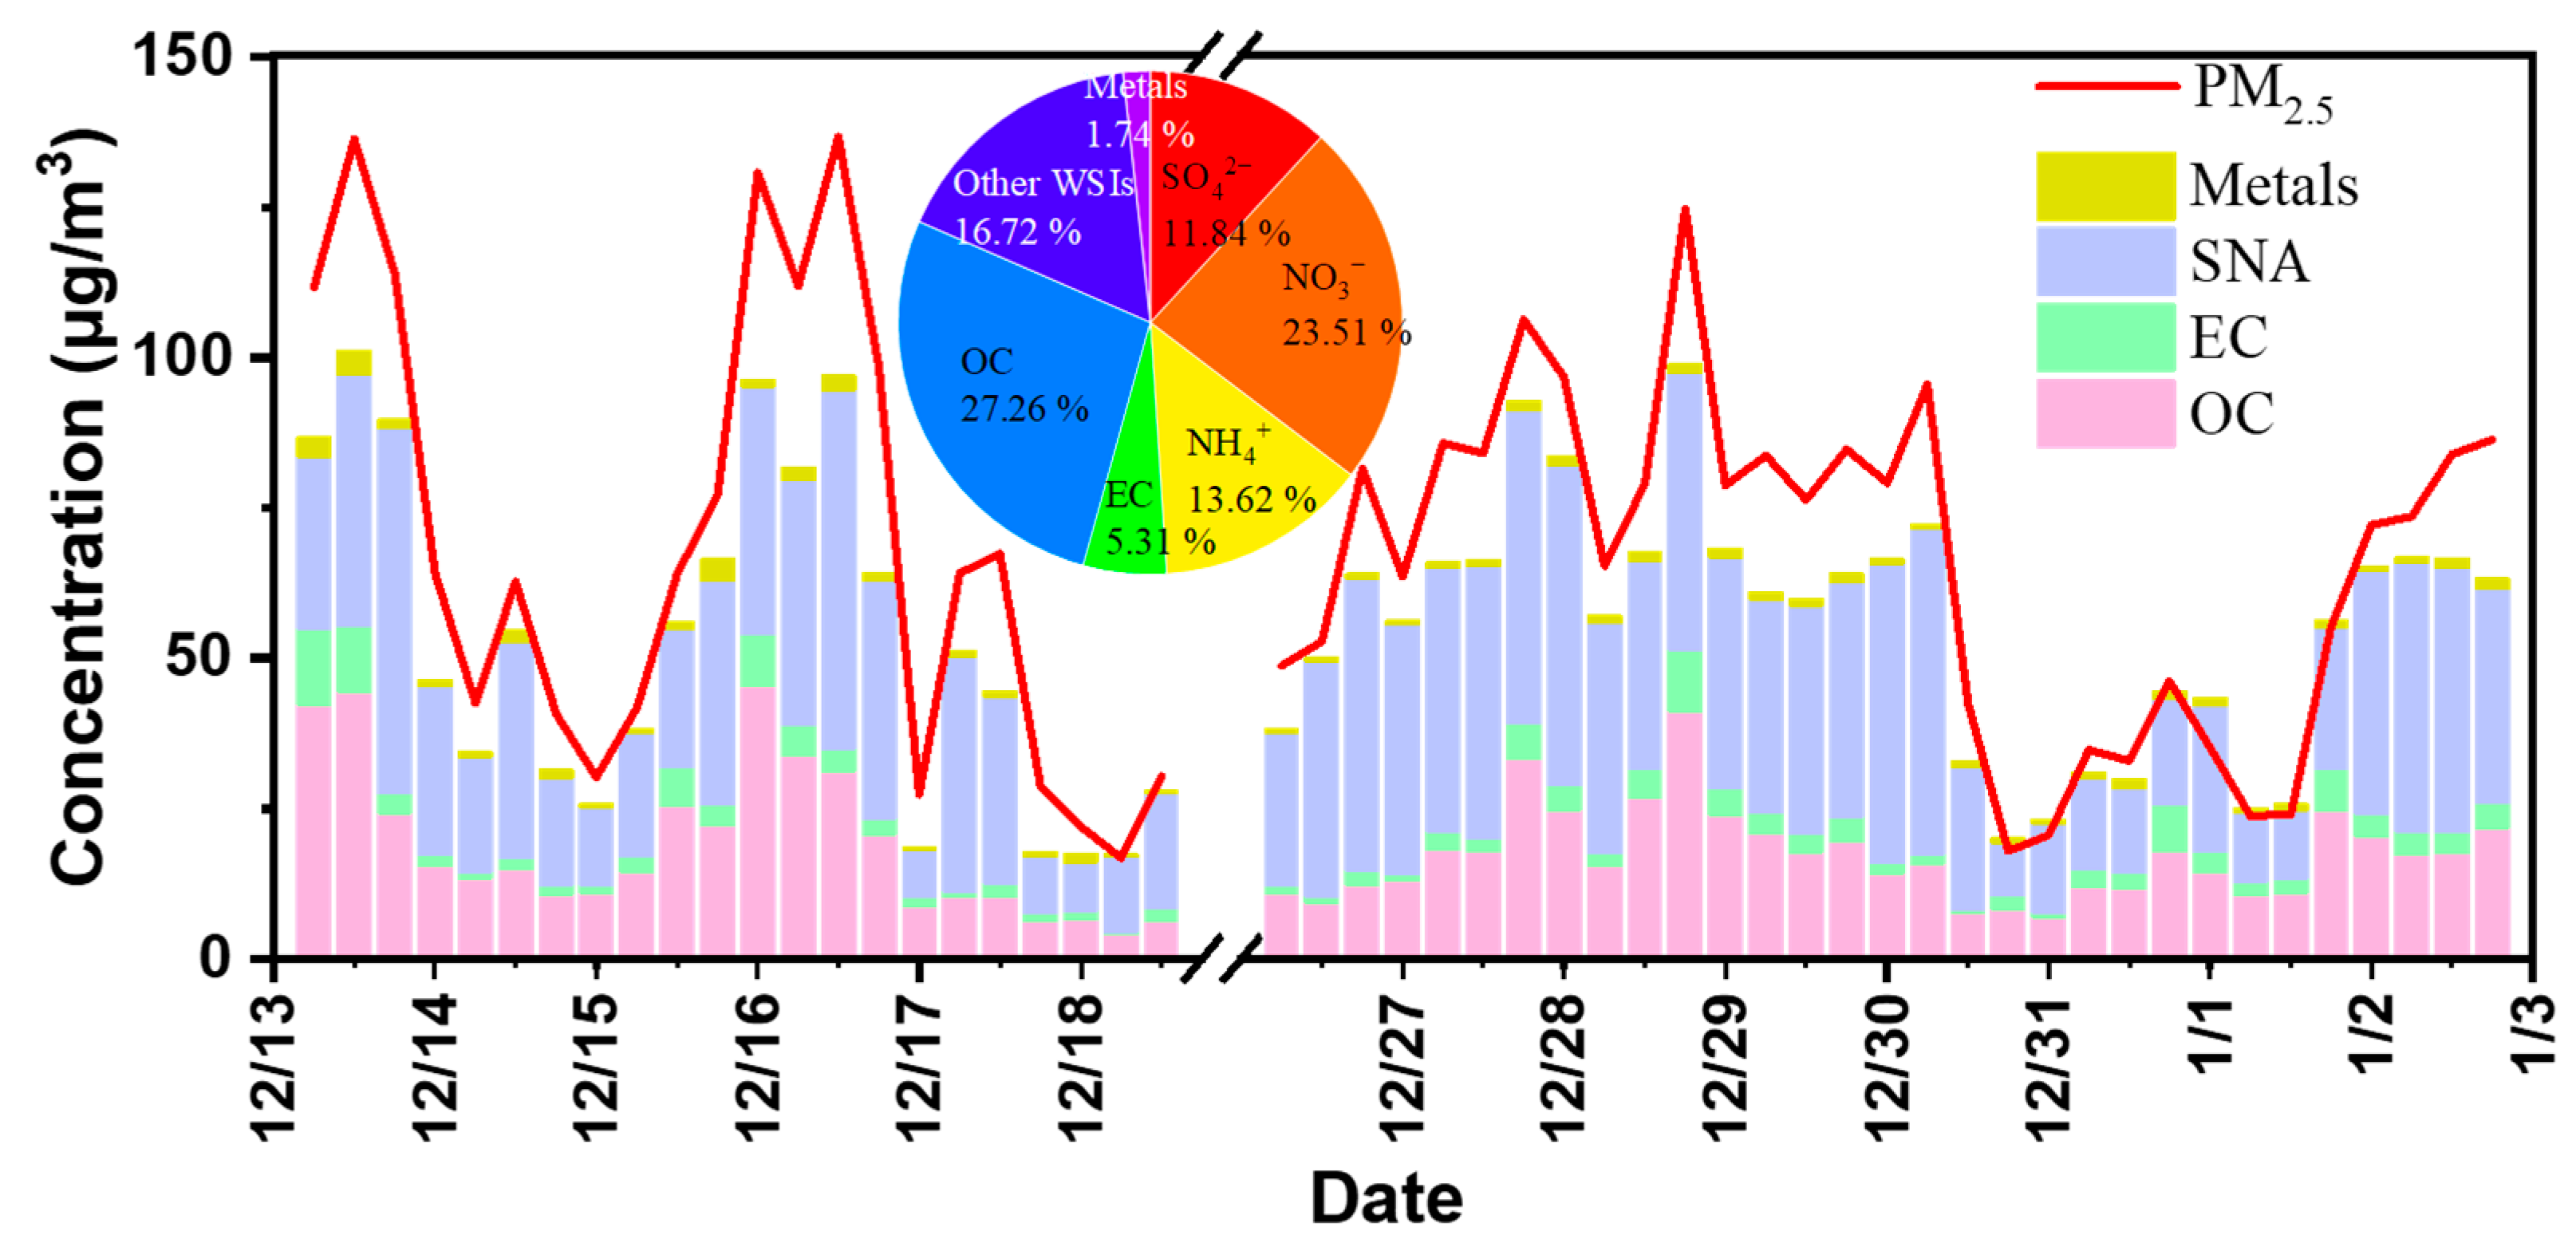
3.1. Overview of PM2.5

Time series of PM2.5 and related components at Haining are displayed in Figure 2 and Table S4. The PM2.5 concentration in this suburban area ranged from 16.8 to 136.8 μg/m3, and the mean concentration was 67.13 ± 32.76 μg/m3. Such a level of PM2.5 was almost twice as high as the Chinese National Ambient Air Quality Standard (NAAQS) of PM2.5 (35 μg/m3) and more than ten times as the newly established guideline for PM2.5 (5 μg/m3) from the WHO in 2021. Compared with cities nearby and nationwide, it was lower than Jiaxing City (83.13 μg/m3) [38] and Shanghai (70.92 μg/m3) [39], but higher than Beijing (55.7 μg/m3) [40] and Hangzhou (60.1 μg/m3) [41] in wintertime. Such a phenomenon implied the PM2.5 pollution in YRD region still needed more attention.
The composition distribution and concentration of the main components are shown in Figure 2. The largest contributor was OC (17.73 ± 10.09 μg/m3), making up ~30% of PM2.5. EC concentration was 3.45 ± 2.65 μg/m3 with a proportion of 5.4% in PM2.5. The carbonaceous components were regarded as important contributors in PM2.5 and the ratio of OC versus EC was often applied to determine the potential sources [42]. Previous studies suggested an existence of secondary organic aerosol (SOA) when the OC/EC ratio was above 2 [38]. The OC/EC ratio at Haining was from 2.27 to 16.47, with an average ratio of 6.10. The higher OC/EC ratio indicated the higher secondary formation due to the stable atmosphere and low temperature in winter [43].
Then, it was followed by water-soluble inorganic compounds SNA (NO3: 15.29 ± 7.44 μg/m3, NH4+: 8.86 ± 5.04 μg/m3, and SO42−: 7.70 ± 2.86 μg/m3), accounting for almost 50% of the total PM2.5 mass concentration. The large proportion of SNA indicated that the secondary inorganic formation of anthropogenic pollutants affected the local area intensely. The correlation coefficients of these water-soluble ions were then analyzed for their formation. The correlation coefficient (R2) between NH4+ and SO42− and NO3 were 0.76 and 0.80, respectively. For further determination of the substances, the observed data were compared with the calculated data for NH4+ (Figure 3) [44]. The calculation of NH4+ was as below:
NH4+ = 0.375 (SO42−) + 0.29 (NO3)
NH4+ = 0.1875 (SO42−) + 0.29 (NO3)
When the NH4+ was in the form of (NH4)2SO4 and NH4NO3, the estimation followed Equation (7), while if the NH4+ existed in the form of NH4HSO4 and NH4NO3, the calculation was as in Equation (8). The correlation coefficient between NH4+ and SO42− was higher in the form of (NH4)2SO4 and NH4NO3 (0.94) than NH4HSO4 and NH4NO3 (0.91). Moreover, the gradient of (NH4)2SO4 and NH4NO3 was closer to 1. Thus, the NH4+ during the period mainly existed as (NH4)2SO4 and NH4NO3.

3.2. Sources and Regional Transport of PM2.5

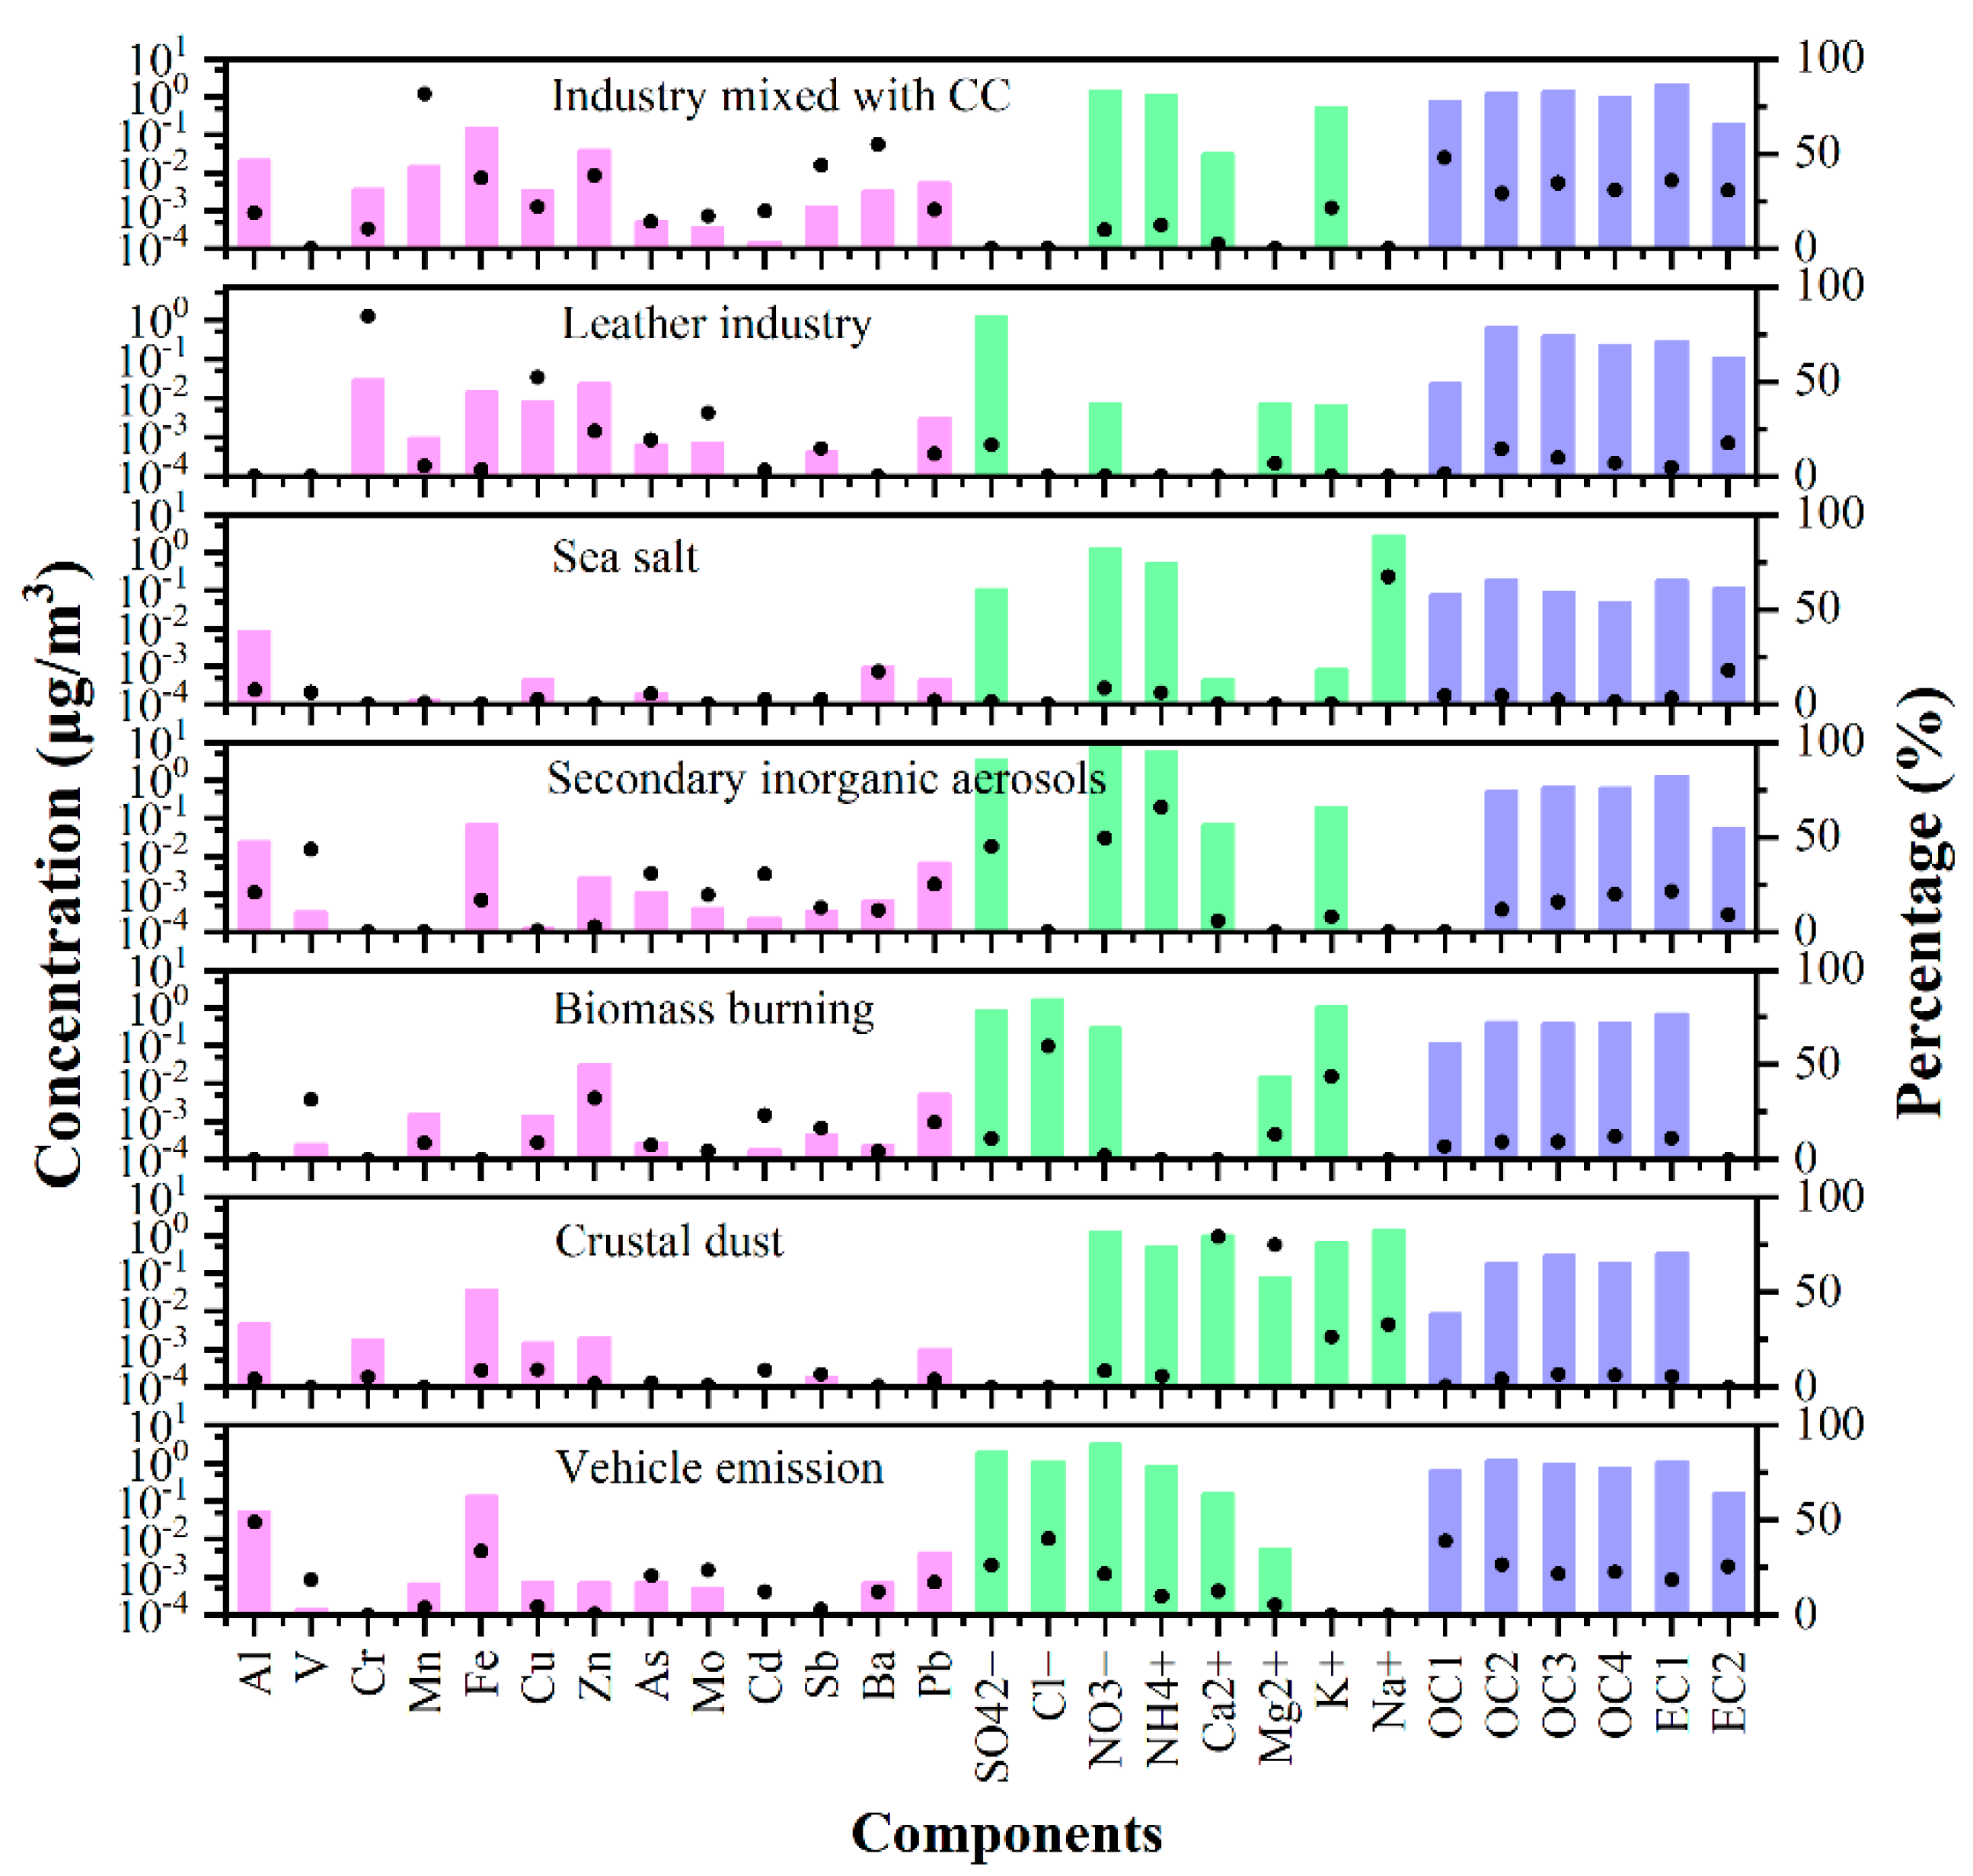
3.2.1. Source Apportionment

In order to investigate the potential emission sources of PM2.5, PMF 5.0 was applied to perform source apportionment in this study. Finally, seven factors were extracted from the PMF receptor model (Figure 4).
Factor 1 was identified as industry mixed with coal combustion with high loadings of OC, EC, Mn, Fe, Zn, Ba, and Pb. Moreover, heavy metals such as Fe, Mn, Zn, and Pb were regarded as tracers for the iron and steel industry [45,46]. Industry mixed with coal combustion contributed 16.3% to PM2.5.
Factor 2 was attributed to the leather industry with a relatively high contribution of Cr (84.5%). Haining is famous for its leather tanning industry. Cr is released during the leather production process [47,48]. The leather industry contributed 4.8% to the total PM2.5.
Factor 3 had a higher loading of Na+ (67.2%), which was regarded as sea salt [49,50]. Haining county is located in the estuary of Qiantang River. The sampling site was about 7 km away from Qiantang River. Thus, it could be easily influenced by the air mass from the East China Sea. Na+ is commonly found near the sea, mainly from the sea waves and evaporation [35]. Sea salt had a contribution of 8.7% to PM2.5 mass concentration.
Factor 4 was attributed to secondary inorganic aerosols (SIAs) with higher mass contribution of SO42−, NO3 and NH4+. SIAs were contributed by high loadings of NO3, SO42− and NH4+. We discussed the existent form of NH4+ above. Secondary oxidation of SO2 and NO2 could form SO42− and NO3 [51]. Secondary inorganic aerosols were the largest contributor by accounting for 31.8% to the PM2.5.
Factor 5 was treated as biomass burning with high proportion of K+ and Cl [52]. Recently the Chinese government has strictly forbidden biomass burning outdoors, while straw burning is still used for residential cooking in the suburban area at Haining County. Thus, this phenomenon could affect areas nearby via regional transport. From PSCF and CWT analyses, biomass burning was mainly affected by air parcels from western areas, namely south Anhui, south Jiangsu, and north Zhejiang provinces by contributing up to, or more than, 20 μg/m3 of PM2.5 (Figure 5). Biomass burning contributed 9.3% to the local PM2.5 at Haining.
Factor 6 was apportioned for crustal dust, which was mainly contributed by Ca2+ (79.1%) and Mg2+ (74.8%). These two ions were regarded as tracers for crustal dust from mixing with loess, floating dust, man-made construction dust, sand dust, and suspended floating dust [53]. In recent years, Zhejiang province has developed rapidly, with its new rural construction leading to the construction dust. Crustal dust contributed 9.5% to the total PM2.5.
Factor 7 was regarded as vehicle emissions with the higher loading of Fe, OC, EC, SO42−, NO3, and Cl. Fe was mainly from the wear of tires and metal parts [54]. Studies have confirmed the large fraction of OC and EC in vehicle exhaust [55,56]. Good correlation (R2 = 0.78) between OC and EC in factor 7 also indicated that the OC and EC were mainly from the same emission source; (here in this study it was from vehicle emissions) (Figure S3). Vehicle emission was the second dominant source, accounting for 19.5% of the PM2.5.

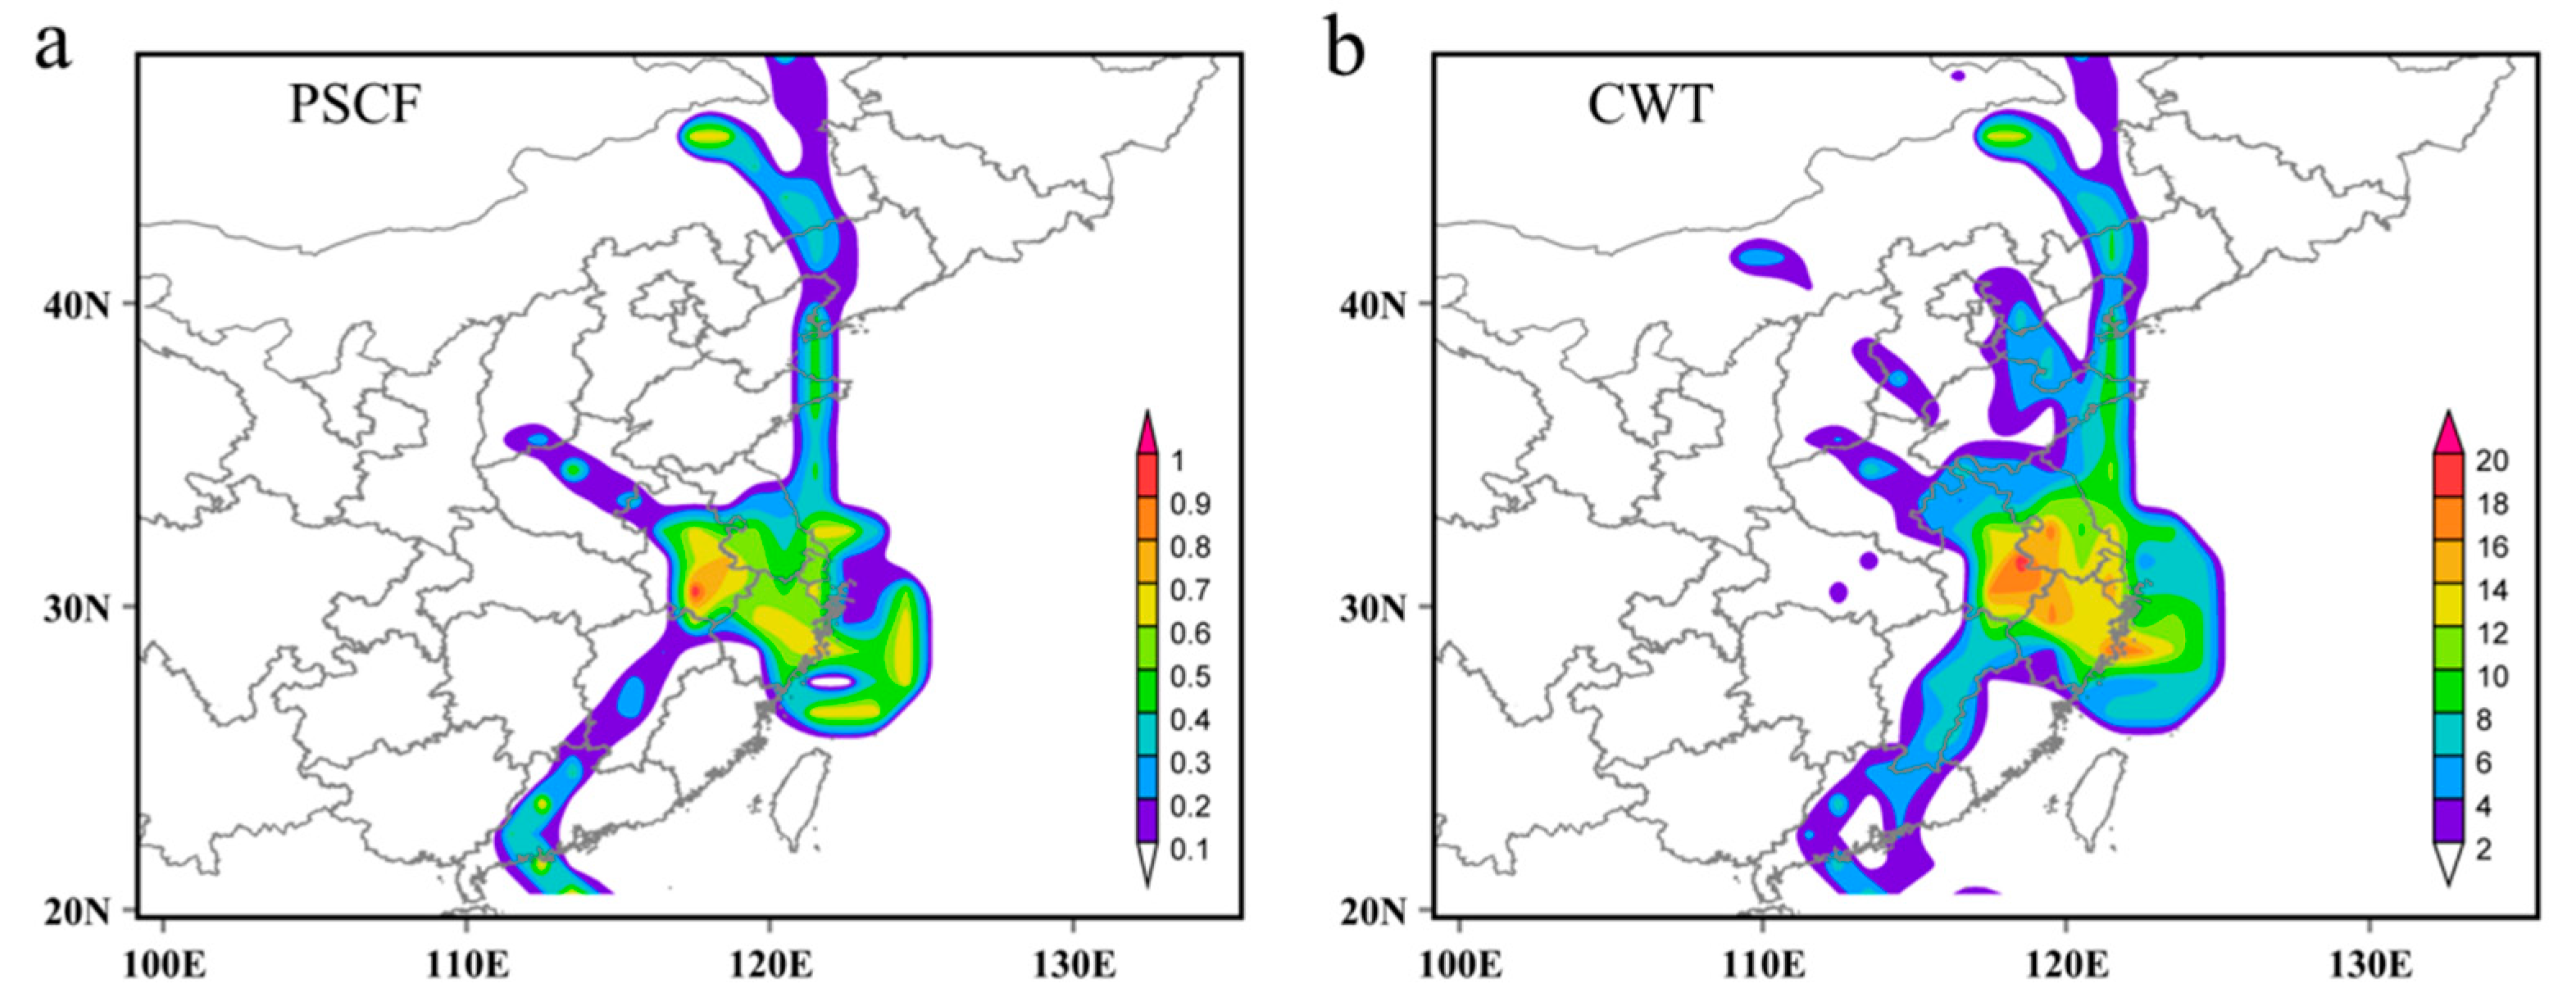
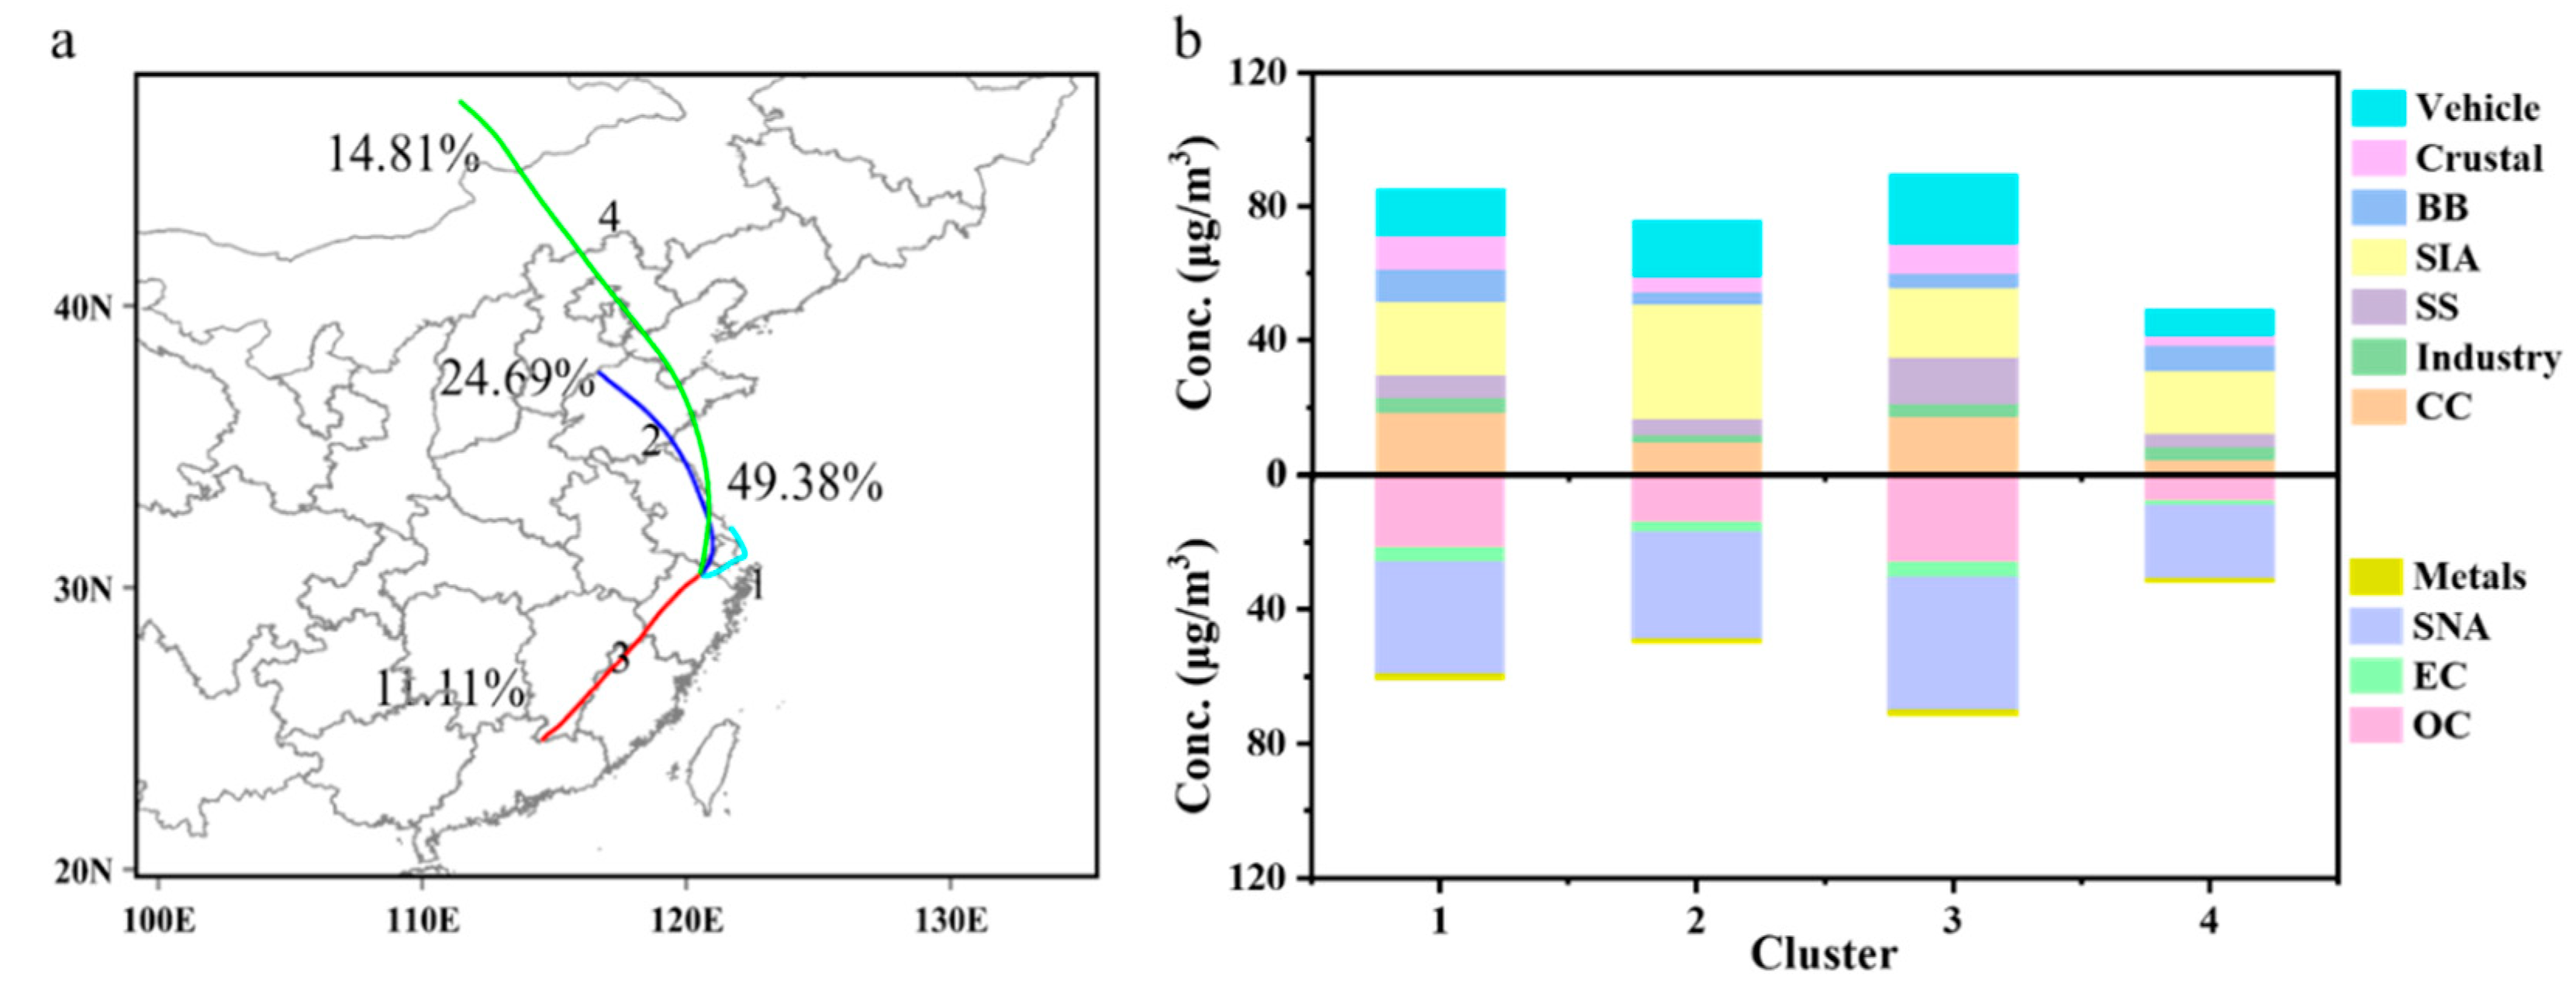
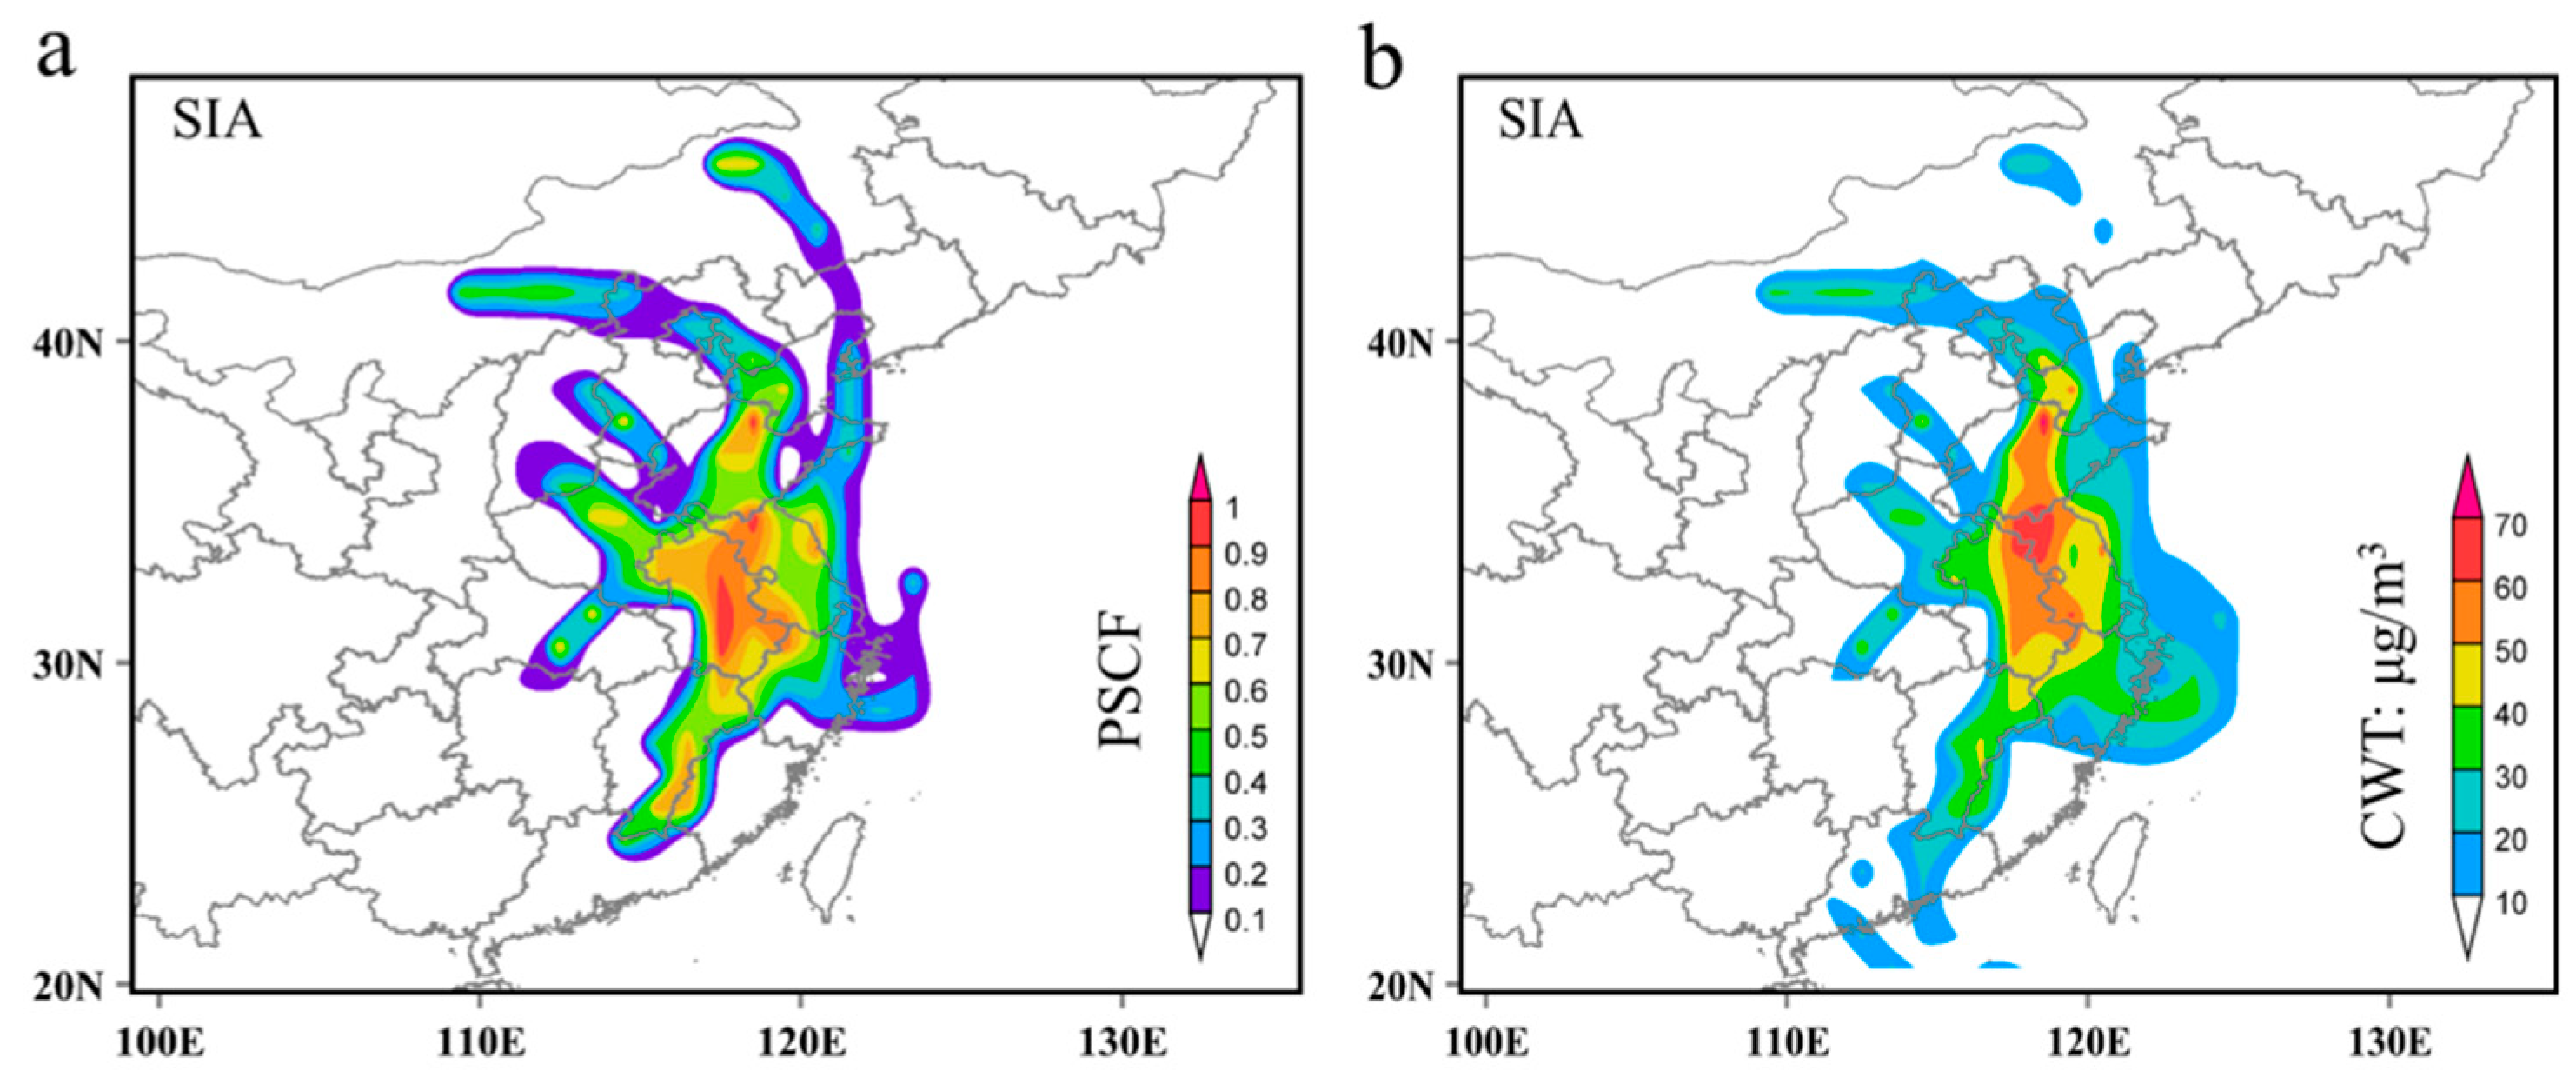
3.2.2. Back Trajectory Cluster and Regional Transport

Figure 6 shows the backward trajectory clustering result of PM2.5 during the whole field campaign, since the whole period was experiencing heavy pollution. In total, 4 clusters were resolved from clustering (Figure 6a).
Cluster 1 originated from south Jiangsu province, travelled across the East China Sea and Shanghai, and arrived at Haining, which contributed almost fifty percent of all the trajectories. Traffic and industrial activities both contributed highly to SNA and OC in Cluster 1 (Figure 6b). Lower PM2.5 concentration (75.80 μg/m3) but higher SNA contribution (53.6%) was tightly related to air masses from Cluster 2. High PSCF and CWT value regions of secondary inorganic aerosols concentrated in eastern Anhui and western Jiangsu province indicated a higher secondary inorganic formation in these areas (Figure 7). A portion of air masses (Cluster 3) travelled from Guangdong and Fujian provinces, containing higher PM2.5 concentration (92.3 μg/m3). Cluster 3 contributed 11.11% to the total air trajectories. Long-range transport was resolved as shown in Cluster 4. Cluster 4, which originated from Mongolia, transported across several provinces and sections of the ocean in north and east China. Due to the clean air mass via the China Sea, Cluster 4 had the lowest PM2.5 loading (39.8 μg/m3).

3.3. Health Risk Assessment

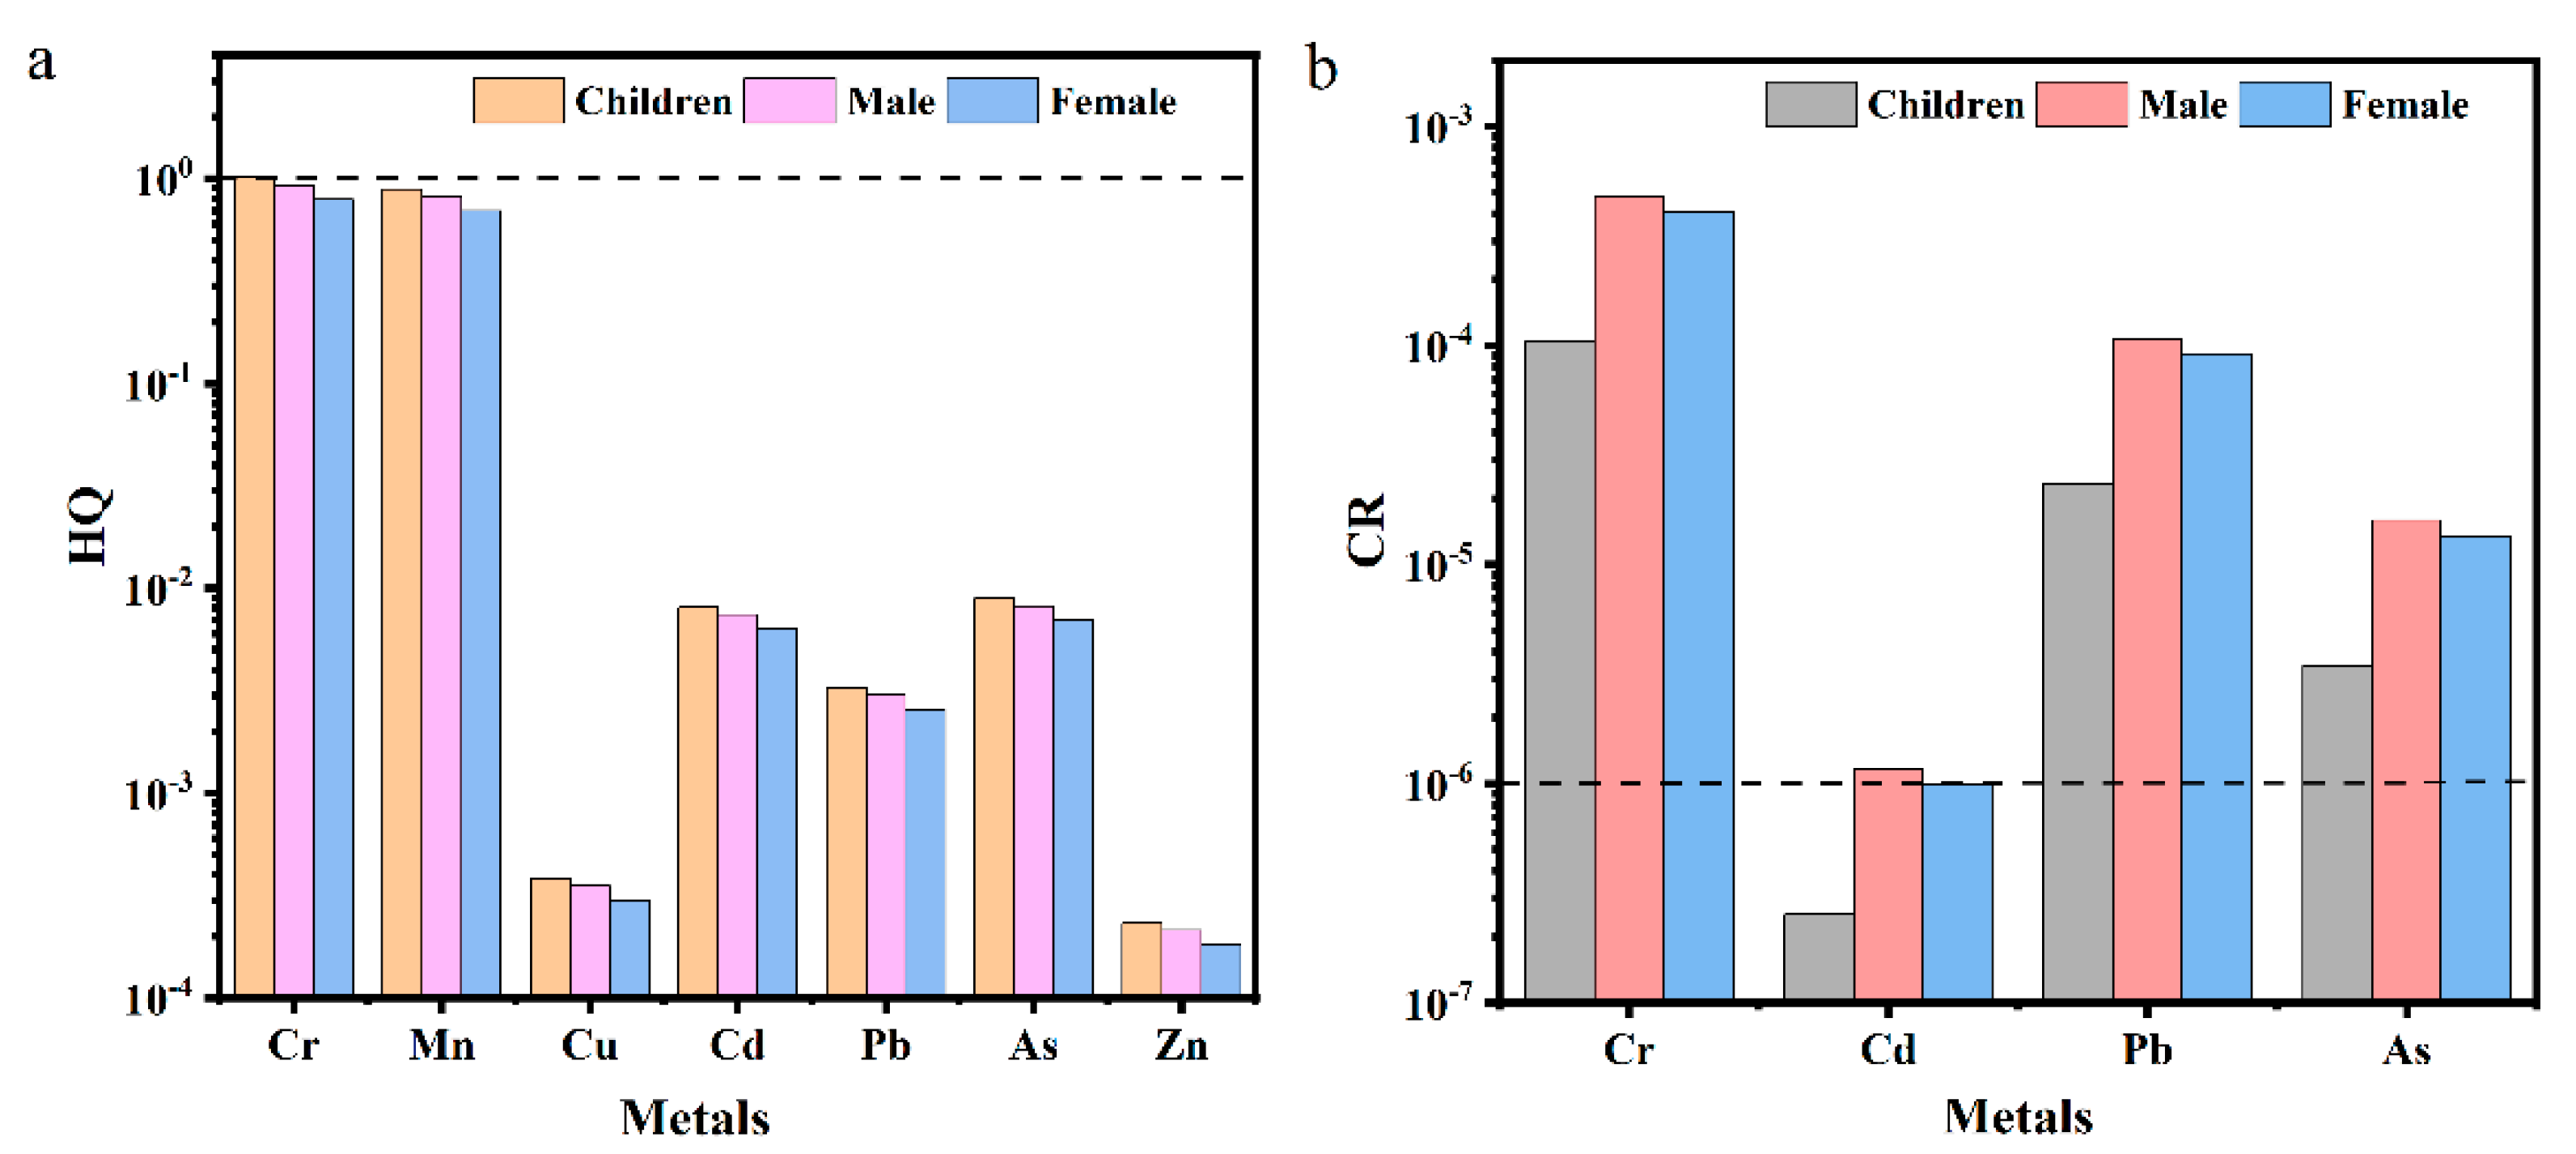
3.3.1. Health Risk Assessment

The noncarcinogenic risk (HQ) of PM2.5-bound heavy metals is described in Figure 8. The HQ of the metals at Haining ranged from 1.8 × 10⁻⁴ to 7.8 × 10⁻¹, 2.1 × 10⁻⁴ to 9.3 × 10⁻¹, and 2.3 × 10⁻⁴ to 1.0 for adult females, adult males, and children, respectively. The highest contributor was Cr, accounting for 52% of the total HQ, followed by Mn (46%), As, Cd, Pb, Cu, and Zn for different populations. The HQ results from PM2.5-bound heavy metals indicated that emission control should receive attention in the local leather industry. Carcinogenic risk (CR) in Figure 8b shows extremely high risk of PM2.5 at Haining. The CR values of metals (Cr, Pb, and As) all exceeded 10E-6, and the concentration posed risk to all of the populations. The most toxic metal was Cr, followed by Pb, As, and Cd, respectively. Such an extremely high risk indicated a strict control policy should be raised and implemented in this area to protect human health. For different populations, it seemed that the risk for adult males was the highest, then females and children for all the carcinogenic metals. According to newly published data from the Annual Report of Zhejiang Cancer Registry in 2021, the incidence of cancer was 3.9‰ and 3.5‰ in 2019 in Zhejiang province and Haining county, respectively [57].

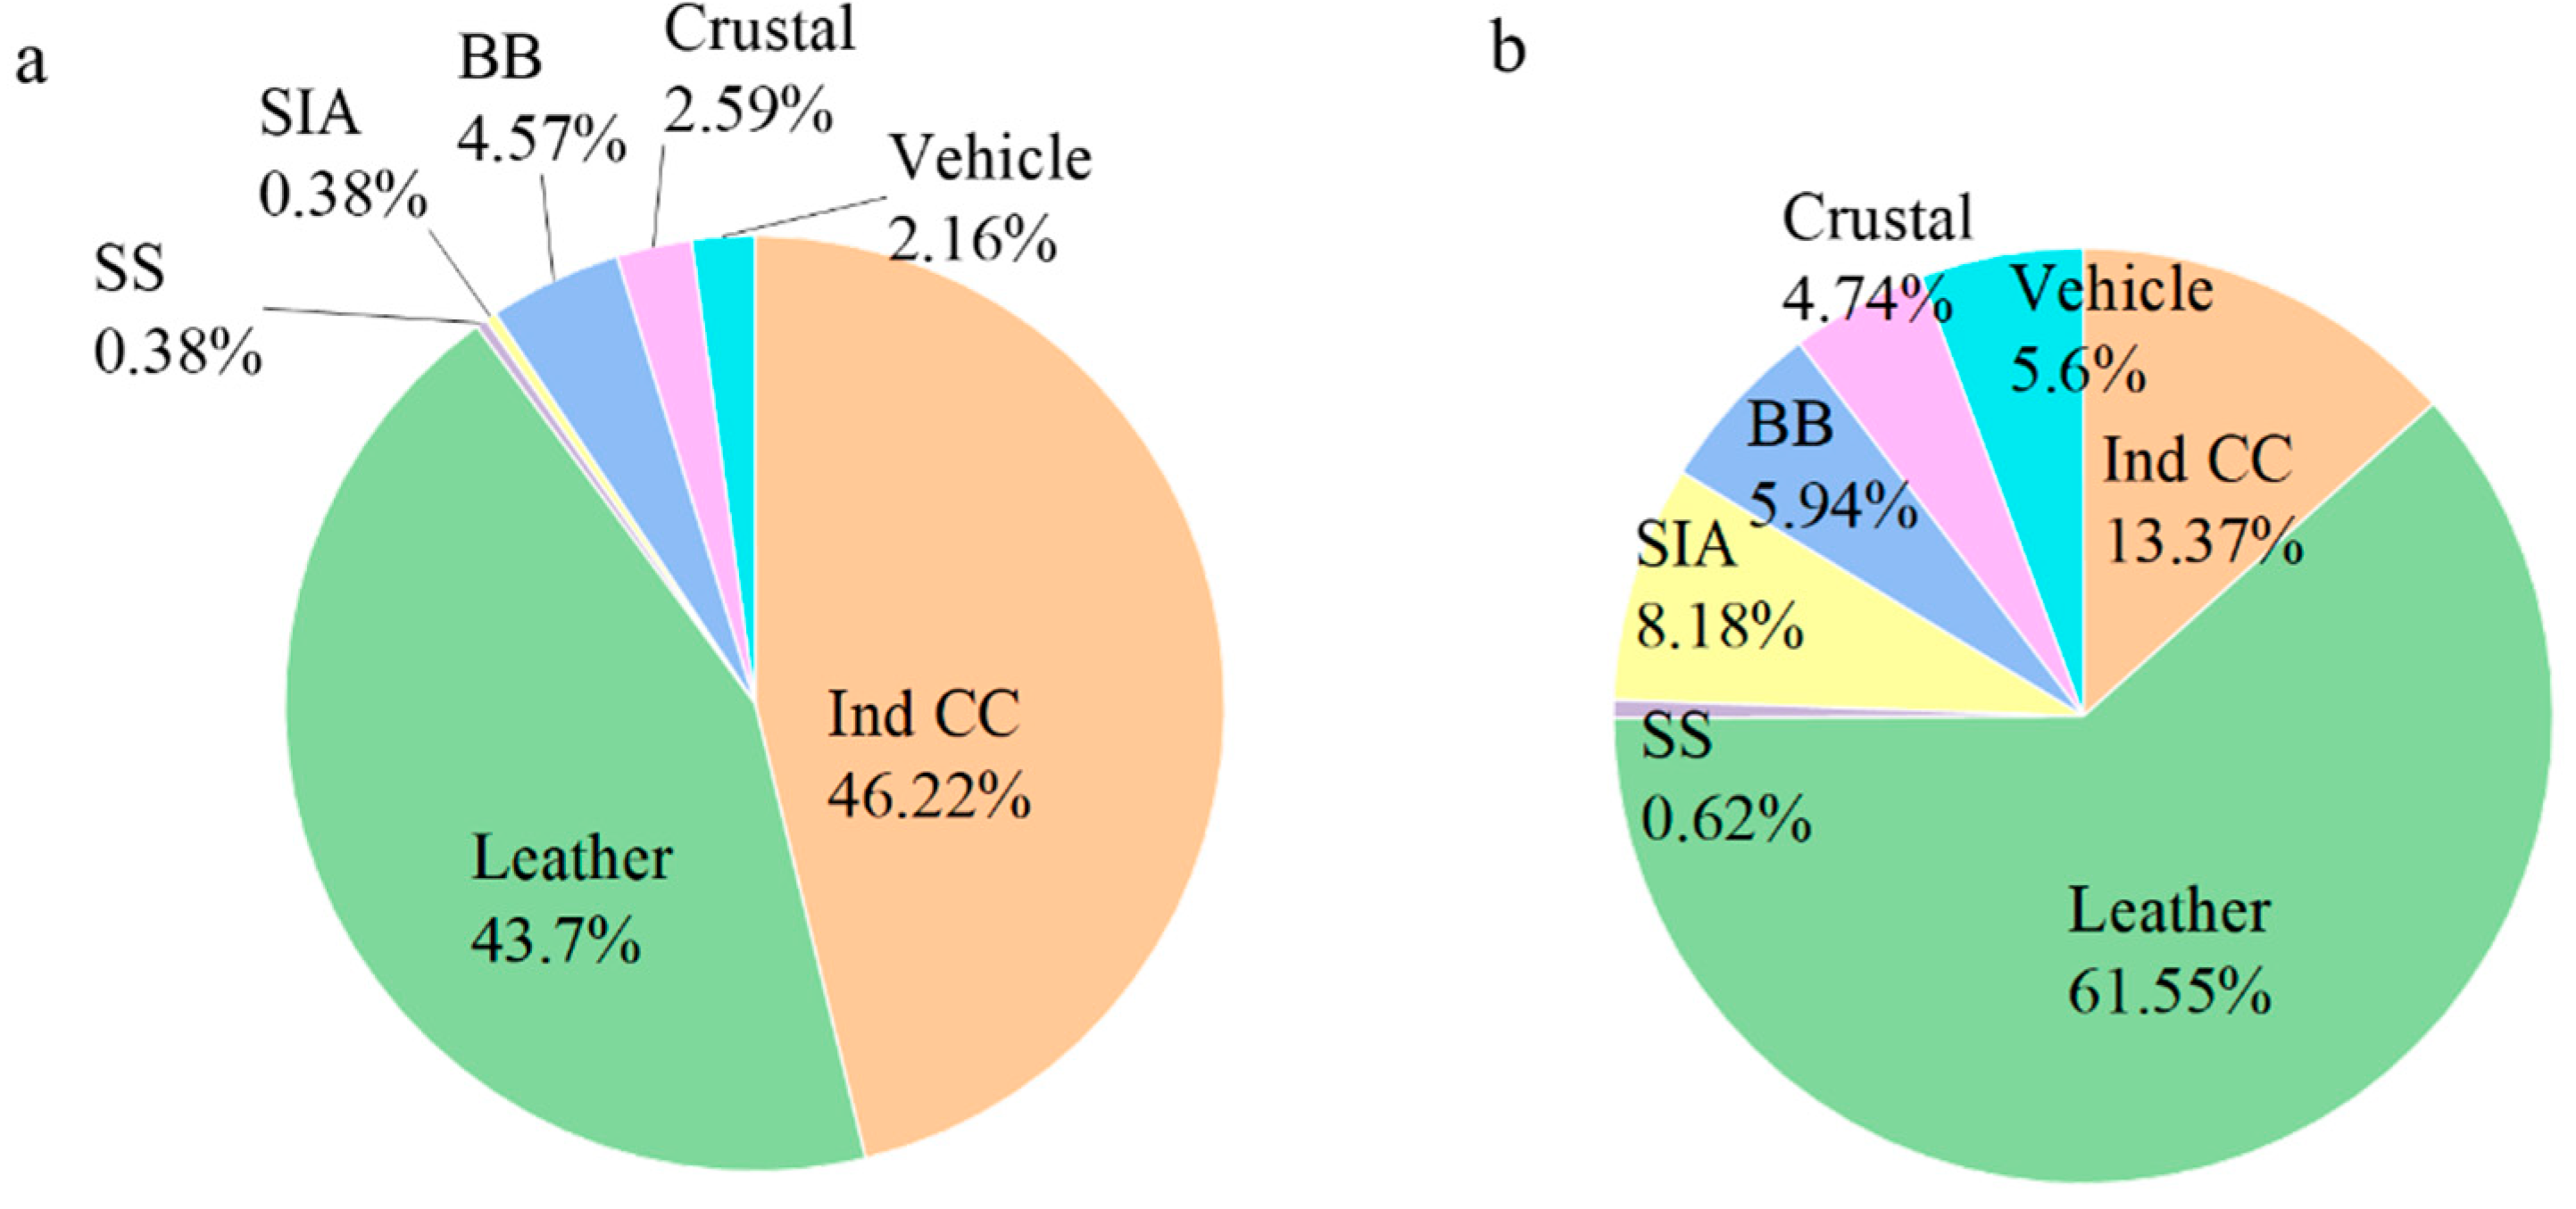
3.3.2. Health Risk Associated with Sources

As the components of PM2.5 were quite different from every source, so were the health risks caused by each source. Therefore, health risks associated with sources was analyzed to investigate the health risks of each source to the local residents. Industry mixed with coal combustion and the leather industry posed high noncarcinogenic risk to all population by a sum proportion of ~90% of the total noncarcinogenic risk (Figure 9a). The leather industry showed a remarkable carcinogenic risk, occupying 61.5% of the total source carcinogenic risk (Figure 9b), and the rest of the other sources had a small contribution. As mentioned above, the leather industry produces Cr during the leather tanning process, which is a human carcinogen. Despite the small contribution of the leather industry (4.8%) to the PM2.5 mass concentration, its lifetime carcinogenic risk turned out to be the highest. Such a phenomenon indicated that the emission reduction policy should also consider the health risks of the compounds in different sources. Additionally, the health risks of the air pollution resulted from a combination of sources and the chemical components’ toxicity in each source.

4. Conclusions

In this study, PM2.5 and its related chemical components were comprehensively explored at a suburban site in Jiaxing City from December 2019 to January 2020 before the COVID-19 shutdown. Chemical composition analysis indicated the secondary formation of both organics and inorganics were important at the sampling site. Strengthened emission reduction control of major gaseous precursor pollutants such as SO2, NOx and VOCs were of great significance for PM2.5 pollution prevention and control in Jiaxing City. PMF analysis was applied to resolve emission sources of PM2.5. Seven sources were resolved for PM2.5 in this suburban area, namely industry mixed with coal combustion (16.3%), the leather industry (4.8%), sea salt (8.7%), secondary inorganic aerosols (31.8%), biomass burning (9.4%), crustal dust (9.5%) and vehicle emissions (19.5%), respectively. Backward trajectory clustering, PSCF, and CWT results implied the regional joint prevention strategies among provinces should be paying attention to PM2.5 reduction. The health risk assessment results showed a higher health risk of PM2.5-bound Cr for all the populations from the leather industry. Such a phenomenon indicated that the smaller contributor to PM2.5 might be the larger health risk source. The leather industry should be given the most attention to control the health risks of PM2.5 in the city.

Supplementary Materials

The following supporting information can be downloaded at https://www.mdpi.com/article/10.3390/su141912175/s1, Figure S1: The seasonal variation of PM2.5 at Haining from 2019 to 2020; Figure S2: The monthly trends of PM2.5 at Haining from 2019 to 2020; Figure S3: The correlation coefficient of OC and EC in PM2.5; Table S1: The detection limit (DL) of ICS-900; Table S2: The exposure dose of carcinogenic and non-carcinogenic heavy metals; Table S3: Carcinogenic and non-carcinogenic risk calculation parameters and their values of heavy metals; Table S4: Concentrations of compositions in PM2.5; Table S5: The noncarcinogenic risk and carcinogenic risk of PM2.5-bound heavy metals with different populations heavy metals.

Author Contributions

Conceptualization, F.Z.; methodology, F.Z., X.P. and L.Y.; software, X.P.; validation, F.Z. and M.W.; formal analysis, X.P., Y.F. and W.J.; investigation, W.J.; resources, F.Z. and M.W.; data curation, F.Z., J.Z. and C.Z.; writing—original draft preparation, F.Z. and X.P.; writing—review and editing, F.Z. and L.Y.; visualization, F.Z. and L.Y.; supervision, F.Z.; project administration, F.Z.; funding acquisition, F.Z. and M.W. All authors have read and agreed to the published version of the manuscript.

Funding

This work was financially supported by the National Natural Science Foundation of China (91844301) and the State Environmental Protection Key Laboratory of Formation and Prevention of Urban Air Pollution Complex (No. CX2020080581). Lan Yao thanks the financial support from the Opening Project of Shanghai Key Laboratory of Atmospheric Particle Pollution and Prevention (LAP3) (No. FDLAP20007) and the National Natural Science Foundation of China (No. 42005089).

Institutional Review Board Statement

Not applicable.

Informed Consent Statement

Not applicable.

Data Availability Statement

Not applicable.

Conflicts of Interest

The authors declare no conflict of interest.

References

  1. Charlson, R.J.; Lovelock, J.E.; Andreae, M.O.; Warren, S.G. Oceanic phytoplankton, atmospheric sulphur, cloud albedo and climate. Nature 1987, 326, 655–661. [Google Scholar] [CrossRef]
  2. Chuang, M.-T.; Chen, Y.-C.; Lee, C.-T.; Cheng, C.-H.; Tsai, Y.-J.; Chang, S.-Y.; Su, Z.-S. Apportionment of the sources of high fine particulate matter concentration events in a developing aerotropolis in Taoyuan, Taiwan. Environ. Pollut. 2016, 214, 273–281. [Google Scholar] [CrossRef] [PubMed]
  3. Yao, L.; Yang, L.X.; Yuan, Q.; Yan, C.; Dong, C.; Meng, C.P.; Sui, X.; Yang, F.; Lu, Y.L.; Wang, W.X. Sources apportionment of PM 2.5 in a background site in the North China Plain. Sci. Total Environ. 2016, 541, 590–598. [Google Scholar] [CrossRef] [PubMed]
  4. Huang, X.F.; Yun, H.; Gong, Z.H.; Li, X.; He, L.; Zhang, Y.H.; Hu, M. Source apportionment and secondary organic aerosol estimation of PM2.5 in an urban atmosphere in China. Sci. China Earth Sci. 2014, 57, 1352–1362. [Google Scholar] [CrossRef]
  5. Yuan, C.-S.; Wong, K.-W.; Tseng, Y.-L.; Ceng, J.-H.; Lee, C.-E.; Lin, C. Chemical significance and source apportionment of fine particles (PM2.5) in an industrial port area in East Asia. Atmos. Pollut. Res. 2022, 13, 101349. [Google Scholar] [CrossRef]
  6. Chang, Y.; Huang, K.; Xie, M.; Deng, C.; Zou, Z.; Liu, S.; Zhang, Y. First long-term and near real-time measurement of trace elements in China’s urban atmosphere: Temporal variability, source apportionment and precipitation effect. Atmos. Chem. Phys. 2018, 18, 11793–11812. [Google Scholar] [CrossRef]
  7. Zhang, X.Y.; Ji, G.X.; Peng, X.W.; Kong, L.Y.; Zhao, X.; Ying, R.R.; Yin, W.J.; Xu, T.; Cheng, J.; Wang, L. Characteristics of the chemical composition and source apportionment of PM2.5 for a one-year period in Wuhan, China. J. Atmos. Chem. 2022, 79, 101–115. [Google Scholar] [CrossRef]
  8. Lv, L.L.; Wei, P.; Hu, J.N.; Chen, Y.J.; Shi, Y.P. Source apportionment and regional transport of PM2.5 during haze episodes in Beijing combined with multiple models. Atmos. Res. 2021, 266, 105957. [Google Scholar] [CrossRef]
  9. Li, X.; Yan, C.Q.; Wang, C.Y.; Ma, J.J.; Li, W.X.; Liu, J.Y.; Liu, Y. PM2.5-bound elements in Hebei Province, China: Pollution levels, source apportionment and health risks. Sci. Total Environ. 2022, 806, 150440. [Google Scholar] [CrossRef]
  10. Xie, J.W.; Jin, L.; Cui, J.L.; Luo, X.S.; Li, J.; Zhang, G.; Li, X.D. Health risk-oriented source apportionment of PM2.5-associated trace metals. Environ. Pollut. 2020, 262, 114655. [Google Scholar] [CrossRef]
  11. Ma, L.X.; Li, B.; Liu, Y.P.; Sun, X.Z.; Fu, D.L.; Sun, S.J.; Thapa, S.; Geng, J.L.; Qi, H.; Zhang, A.P.; et al. Characterization, sources and risk assessment of PM2.5-bound polycyclic aromatic hydrocarbons (PAHs) and nitrated PAHs (NPAHs) in Harbin, a cold city in Northern China. J. Clean. Prod. 2020, 264, 121673. [Google Scholar] [CrossRef]
  12. Lu, S.L.; Yao, Z.K.; Chen, X.H.; Wu, M.H.; Sheng, G.Y.; Fu, J.M.; Paul, D. The relationship between physicochemical characterization and the potential toxicity of fine particulates (PM2.5) in Shanghai atmosphere. Atmos. Environ. 2008, 42, 7205–7214. [Google Scholar]
  13. Wang, X.F.; He, S.L.; Chen, S.C.; Zhang, Y.L.; Wang, A.H.; Luo, J.B.; Ye, X.L.; Mo, Z.; Wu, L.Z.; Xu, P.W.; et al. Spatiotemporal Characteristics and Health Risk Assessment of Heavy Metals in PM2.5 in Zhejiang Province. Int. J. Environ. Res. Public Health 2018, 15, 583. [Google Scholar] [CrossRef] [PubMed]
  14. Liu, P.P.; Lei, Y.L.; Ren, H.R.; Gao, J.J.; Xu, H.M.; Shen, Z.X.; Zhang, Q.; Zheng, C.L.; Liu, H.X.; Zhang, R.J.; et al. Seasonal Variation and Health Risk Assessment of Heavy Metals in PM2.5 during Winter and Summer over Xi’an, China. Atmosphere 2017, 8, 91. [Google Scholar] [CrossRef]
  15. Ge, D.F.; Nie, W.; Sun, P.; Liu, Y.L.; Wang, T.Y.; Wang, J.B.; Wang, J.P.; Wang, L.; Zhu, C.J.; Wang, R.X.; et al. Characterization of particulate organic nitrates in the Yangtze River Delta, East China, using the time-of-flight aerosol chemical speciation monitor. Atmos. Environ. 2022, 272, 118927. [Google Scholar] [CrossRef]
  16. Wong, Y.K.; Liu, K.M.; Yeung, C.; Leung, K.K.M.; Yu, J.Z. Measurement report: Characterization and source apportionment of coarse particulate matter in Hong Kong: Insights into the constituents of unidentified mass and source origins in a coastal city in southern China. Atmos. Chem. Phys. 2022, 22, 5017–5031. [Google Scholar] [CrossRef]
  17. Feng, X.X.; Feng, Y.L.; Chen, Y.J.; Cai, J.J.; Li, Q.; Chen, J.M. Source apportionment of PM2.5 during haze episodes in Shanghai by the PMF model with PAHs. J. Clean. Prod. 2021, 330, 129850. [Google Scholar] [CrossRef]
  18. Jia, J.P.; Deng, L.; Bi, C.J.; Jin, X.P.; Zeng, Y.S.; Chen, Z.L. Seasonal variations, gas-PM2.5 partitioning and long-distance input of PM2.5-bound and gas-phase polycyclic aromatic hydrocarbons in Shanghai, China. Atmos. Environ. 2021, 252, 118335. [Google Scholar] [CrossRef]
  19. Zhong, Y.; Chen, J.W.; Zhao, Q.B.; Zhang, N.; Feng, J.L.; Fu, Q.Y. Temporal trends of the concentration and sources of secondary organic aerosols in PM2.5 in Shanghai during 2012 and 2018. Atmos. Environ. 2021, 261, 118596. [Google Scholar] [CrossRef]
  20. Huang, D.D.; Zhu, S.H.; An, J.Y.; Wang, Q.Q.; Qiao, L.P.; Zhou, M.; He, X.; Ma, Y.G.; Sun, Y.L.; Huang, C.; et al. Comparative Assessment of Cooking Emission Contributions to Urban Organic Aerosol Using Online Molecular Tracers and Aerosol Mass Spectrometry Measurements. Environ. Sci. Technol. 2021, 55, 14526–14535. [Google Scholar] [CrossRef]
  21. Niu, Y.W.; Li, X.L.; Qi, B.; Du, R.G. Variation in the concentrations of atmospheric PM2.5 and its main chemical components in an eastern China city (Hangzhou) since the release of the Air Pollution Prevention and Control Action Plan in 2013. Air Qual. Atmos. Health 2021, 15, 321–337. [Google Scholar] [CrossRef]
  22. Xiong, C.; Yu, S.C.; Chen, X.; Li, Z.; Zhang, Y.B.; Li, M.Y.; Liu, W.P.; Li, P.F.; Seinfeld, J.H. Dominant Contributions of Secondary Aerosols and Vehicle Emissions to Water-Soluble Inorganic Ions of PM2.5 in an Urban Site in the Metropolitan Hangzhou, China. Atmosphere 2021, 12, 1529. [Google Scholar] [CrossRef]
  23. Liu, L.; Zhang, J.; Du, R.G.; Teng, X.M.; Hu, R.; Yuan, Q.; Tang, S.S.; Ren, C.H.; Huang, X.; Xu, L.; et al. Chemistry of Atmospheric Fine Particles During the COVID-19 Pandemic in a Megacity of Eastern China. Geophys. Res. Lett. 2021, 48, 2020GL091611. [Google Scholar] [CrossRef] [PubMed]
  24. Yuan, Q.; Qi, B.; Hu, D.Y.; Wang, J.J.; Zhang, J.; Yang, H.Q.; Zhang, S.S.; Liu, L.; Xu, L.; Li, W.J. Spatiotemporal variations and reduction of air pollutants during the COVID-19 pandemic in a megacity of Yangtze River Delta in China. Sci. Total Environ. 2020, 751, 141820. [Google Scholar] [CrossRef] [PubMed]
  25. Li, M.; Hu, M.; Guo, Q.; Tan, T.; Du, B.; Huang, X.; He, L.; Guo, S.; Wang, W.; Fan, Y.; et al. Seasonal Source Apportionment of PM2.5 in Ningbo, a Coastal City in Southeast China. Aerosol Air Qual. Res. 2018, 18, 2741–2752. [Google Scholar] [CrossRef]
  26. Xu, J.-S.; Xu, M.; Snape, C.; He, J.; Behera, S.N.; Xu, H.-H.; Ji, D.-S.; Wang, C.; Yu, H.; Xiao, H.; et al. Temporal and spatial variation in major ion chemistry and source identification of secondary inorganic aerosols in Northern Zhejiang Province, China. Chemosphere 2017, 179, 316–330. [Google Scholar] [CrossRef] [PubMed]
  27. Wang, H.; Zhu, B.; Shen, L.; Xu, H.; An, J.; Xue, G.; Cao, J. Water-soluble ions in atmospheric aerosols measured in five sites in the Yangtze River Delta, China: Size-fractionated, seasonal variations and sources. Atmos. Environ. 2015, 123, 370–379. [Google Scholar] [CrossRef]
  28. Chow, J.C.; Watson, J.G.; Chen, L.-W.A.; Chang, M.O.; Robinson, N.F.; Trimble, D.; Kohl, S. The IMPROVE_A Temperature Protocol for Thermal/Optical Carbon Analysis: Maintaining Consistency with a Long-Term Database. J. Air Waste Manag. Assoc. 2007, 57, 1014–1023. [Google Scholar] [CrossRef]
  29. Wang, X.; Wang, W.; Yang, L.; Gao, X.; Nie, W.; Yu, Y.; Xu, P.; Zhou, Y.; Wang, Z. The secondary formation of inorganic aerosols in the droplet mode through heterogeneous aqueous reactions under haze conditions. Atmos. Environ. 2012, 63, 68–76. [Google Scholar] [CrossRef]
  30. Han, X.Y.; Li, S.; Li, Z.Z.; Pang, X.C.; Bao, Y.Z.; Shi, J.W.; Ning, P. Concentrations, Source Characteristics, and Health Risk Assessment of Toxic Heavy Metals in PM2.5 in a Plateau City (Kunming) in Southwest China. Int. J. Environ. Res. Public Health 2021, 18, 11004. [Google Scholar] [CrossRef]
  31. Zhu, Y.; Yang, L.; Kawamura, K.; Chen, J.; Ono, K.; Wang, X.; Xue, L.; Wang, W. Contributions and source identification of biogenic and anthropogenic hydrocarbons to secondary organic aerosols at Mt. Tai in 2014. Environ. Pollut. 2017, 220, 863–872. [Google Scholar] [CrossRef] [PubMed]
  32. Yang, W.; Wang, G.; Bi, C. Analysis of Long-Range Transport Effects on PM2.5 during a Short Severe Haze in Beijing, China. Aerosol Air Qual. Res. 2017, 17, 1610–1622. [Google Scholar] [CrossRef]
  33. Kassomenos, P.; Vardoulakis, S.; Borge, R.; Lumbreras, J.; Papaloukas, C.; Karakitsios, S. Comparison of statistical clustering techniques for the classification of modelled atmospheric trajectories. Theor. Appl. Climatol 2010, 102, 1–12. [Google Scholar] [CrossRef]
  34. Polissar, A.V.; Hopke, P.K.; Paatero, P. Atmospheric aerosol over Alaska—2. Elemental composition and sources. J. Geophys. Res. Atmos. 1998, 103, 19045–19057. [Google Scholar] [CrossRef]
  35. Zhang, J.; Zhou, X.; Wang, Z.; Yang, L.; Wang, J.; Wang, W. Trace elements in PM2.5 in Shandong Province: Source identification and health risk assessment. Sci. Total Environ. 2018, 621, 558–577. [Google Scholar] [CrossRef]
  36. Zhang, J.; Wei, E.; Wu, L.; Fang, X.; Li, F.; Yang, Z.; Wang, T.; Mao, H. Elemental Composition and Health Risk Assessment of PM10 and PM2.5 in the Roadside Microenvironment in Tianjin, China. Aerosol Air Qual. Res. 2018, 18, 1817–1827. [Google Scholar] [CrossRef]
  37. Cao, S.; Duan, X.; Zhao, X.; Ma, J.; Dong, T.; Huang, N.; Sun, C.; He, B.; Wei, F. Health risks from the exposure of children to As, Se, Pb and other heavy metals near the largest coking plant in China. Sci. Total Environ. 2014, 472, 1001–1009. [Google Scholar] [CrossRef]
  38. Xiong, C.; Zhang, Y.; Yan, J.; Yang, X.; Wang, Q.; Tu, R.; He, Y. Chemical composition characteristics and source analysis of PM2.5 in Jiaxing, China: Insights into the effect of COVID-19 outbreak. Environ. Technol. 2021, 1–29. [Google Scholar] [CrossRef]
  39. Ou, J.; Hu, Q.; Liu, H.; Xu, S.; Wang, Z.; Ji, X.; Wang, X.; Xie, Z.; Kang, H. Exploring the impact of new particle formation events on PM2.5 pollution during winter in the Yangtze River Delta, China. J. Environ. Sci. 2021, 111, 75–83. [Google Scholar] [CrossRef]
  40. Park, J.; Kim, H.; Kim, Y.; Heo, J.; Kim, S.-W.; Jeon, K.; Yi, S.-M.; Hopke, P.K. Source apportionment of PM2.5 in Seoul, South Korea and Beijing, China using dispersion normalized PMF. Sci. Total Environ. 2022, 833, 155056. [Google Scholar] [CrossRef]
  41. Yang, H.M.; Wang, J.F.; Chen, M.D.; Nie, D.Y.; Shen, F.Z.; Lei, Y.L.; Ge, P.X.; Gu, T.; Gai, X.Y.; Huang, X.P.; et al. Chemical characteristics, sources and evolution processes of fine particles in Lin’an, Yangtze River Delta, China. Chemosphere 2020, 254, 126851. [Google Scholar] [CrossRef] [PubMed]
  42. He, Q.; Guo, W.; Zhang, G.; Yan, Y.; Chen, L. Characteristics and Seasonal Variations of Carbonaceous Species in PM2.5 in Taiyuan, China. Atmosphere 2015, 6, 850–862. [Google Scholar] [CrossRef]
  43. Duan, J.; Tan, J.; Cheng, D.; Bi, X.; Deng, W.; Sheng, G.; Fu, J.; Wong, M. Sources and characteristics of carbonaceous aerosol in two largest cities in Pearl River Delta Region, China. Atmos. Environ. 2007, 41, 2895–2903. [Google Scholar] [CrossRef]
  44. Kang, C.-M.; Lee, H.S.; Kang, B.-W.; Lee, S.-K.; Sunwoo, Y. Chemical characteristics of acidic gas pollutants and PM2.5 species during hazy episodes in Seoul, South Korea. Atmos. Environ. 2004, 38, 4749–4760. [Google Scholar] [CrossRef]
  45. Zhu, C.; Tian, H.; Hao, Y.; Gao, J.; Hao, J.; Wang, Y.; Hua, S.; Wang, K.; Liu, H. A high-resolution emission inventory of anthropogenic trace elements in Beijing-Tianjin-Hebei (BTH) region of China. Atmos. Environ. 2018, 191, 452–462. [Google Scholar] [CrossRef]
  46. Liu, J.; Chen, Y.; Chao, S.; Cao, H.; Zhang, A.; Yang, Y. Emission control priority of PM2.5-bound heavy metals in different seasons: A comprehensive analysis from health risk perspective. Sci. Total Environ. 2018, 644, 20–30. [Google Scholar] [CrossRef]
  47. Hedberg, Y.S.; Erfani, B.; Matura, M.; Lidén, C. Chromium(III) release from chromium-tanned leather elicits allergic contact dermatitis: A use test study. Contact Dermat. 2018, 78, 307–314. [Google Scholar] [CrossRef]
  48. Hedberg, Y.S.; Lidén, C.; Wallinder, I.O. Correlation between bulk- and surface chemistry of Cr-tanned leather and the release of Cr(III) and Cr(VI). J. Hazard. Mater. 2014, 280, 654–661. [Google Scholar] [CrossRef]
  49. Wu, S.-P.; Cai, M.-J.; Xu, C.; Zhang, N.; Zhou, J.-B.; Yan, J.-P.; Schwab, J.J.; Yuan, C.-S. Chemical nature of PM2.5 and PM10 in the coastal urban Xiamen, China: Insights into the impacts of shipping emissions and health risk. Atmos. Environ. 2020, 227, 117383. [Google Scholar] [CrossRef]
  50. Guo, Q.Y.; Li, L.M.; Zhao, X.Y.; Yin, B.H.; Liu, Y.Y.; Wang, X.L.; Yang, W.; Geng, C.M.; Wang, X.H.; Bai, Z.P. Source Apportionment and Health Risk Assessment of Metal Elements in PM2.5 in Central Liaoning’s Urban Agglomeration. Atmosphere 2021, 12, 667. [Google Scholar] [CrossRef]
  51. Liu, P.; Ye, C.; Xue, C.; Zhang, C.; Mu, Y.; Sun, X. Formation mechanisms of atmospheric nitrate and sulfate during the winter haze pollution periods in Beijing: Gas-phase, heterogeneous and aqueous-phase chemistry. Atmos. Chem. Phys. 2020, 20, 4153–4165. [Google Scholar] [CrossRef] [Green Version]
  52. Cachier, H.; Ducret, J. Influence of biomass burning on equatorial African rains. Nature 1991, 352, 228–230. [Google Scholar] [CrossRef]
  53. Liu, Y.; Zheng, M.; Yu, M.; Cai, X.; Du, H.; Li, J.; Zhou, T.; Yan, C.; Wang, X.; Shi, Z.; et al. High-time-resolution source apportionment of PM2.5 in Beijing with multiple models. Atmos. Chem. Phys. 2019, 19, 6595–6609. [Google Scholar] [CrossRef]
  54. Zhao, S.; Tian, H.; Luo, L.; Liu, H.; Wu, B.; Liu, S.; Bai, X.; Liu, W.; Liu, X.; Wu, Y.; et al. Temporal variation characteristics and source apportionment of metal elements in PM2.5 in urban Beijing during 2018–2019. Environ. Pollut. 2020, 268, 115856. [Google Scholar] [CrossRef]
  55. Park, E.H.; Heo, J.; Kim, H.; Yi, S.-M. Long term trends of chemical constituents and source contributions of PM2.5 in Seoul. Chemosphere 2020, 251, 126371. [Google Scholar] [CrossRef]
  56. Tao, J.; Zhang, L.; Cao, J.; Zhong, L.; Chen, D.; Yang, Y.; Chen, D.; Chen, L.; Zhang, Z.; Wu, Y.; et al. Source apportionment of PM2.5 at urban and suburban areas of the Pearl River Delta region, south China—With emphasis on ship emissions. Sci. Total Environ. 2016, 574, 1559–1570. [Google Scholar] [CrossRef]
  57. Cheng, X.; Chen, M.; Du, L. Zhejiang Cancer Registry Annual Report 2019; Tsinghua University: Beijing, China, 2021. [Google Scholar]
Figure 1. Sampling site location of the field campaign. (a) Location of Zhejiang Province in China; (b) the sample site location in Zhejiang Province, where the red star represents the sampling site.
Sustainability 14 12175 g001
Figure 2. Temporal variations of compositions in PM2.5 and the proportions to PM2.5.
Sustainability 14 12175 g002
Figure 3. Correlation coefficient between calculated and measured NH4+.
Sustainability 14 12175 g003
Figure 4. Seven sources resolved of VOCs from the PMF model.
Sustainability 14 12175 g004
Figure 5. The potential source region of biomass burning at Haining, Jiaxing city. (a) PSCF analysis and (b) CWT analysis of biomass burning.
Sustainability 14 12175 g005
Figure 6. The back trajectory cluster analysis (a) and concentration of compositions and sources in clusters (b).
Sustainability 14 12175 g006
Figure 7. PSCF (a) and CWT (b) analysis of secondary inorganic aerosol during the episode.
Sustainability 14 12175 g007
Figure 8. (a) Noncarcinogenic risk (HQ) and (b) carcinogenic risk (CR) by exposure of heavy metals to different populations at Haining.
Sustainability 14 12175 g008
Figure 9. Risk-oriented source apportionment of PM2.5-bound metals at Haining: (a) noncarcinogenic risk and (b) carcinogenic risk.
Sustainability 14 12175 g009
Table 1. The weather conditions and PM2.5 concentrations of sampling site in 2019. Abbreviation: WS for wind speed.
SeasonPM2.5 (µg/m3)T (°C)RH (%)WS (m/s)
Spring44.6717.6953.082.15
Summer23.9127.8457.392.38
Autumn40.6020.3054.341.91
Winter60.367.5559.751.81
Table 2. Calculation parameters and values of daily average respiratory exposure to heavy metals.
ParametersUnitsValuesRefs.
ChildrenAdult MaleAdult Female
C, metal concentrationmg/m395%ulc95%ulc95%ulc[36]
IRi, air inhalationm3/d519.214.17[9]
EF, exposure frequencyd/a365365365[9]
ED, exposure yearsa63030[9]
BW, body weightkg1562.754.4[9]
AT, average exposure times (noncarcinogenic)d219010,95010,950[37]
AT, average exposure times (carcinogenic)d25,55025,55025,550[37]
Publisher’s Note: MDPI stays neutral with regard to jurisdictional claims in published maps and institutional affiliations.

