
Aeroelastic Experimental Investigation of Hyperbolic Paraboloid Membrane Structures in Normal and Typhoon Winds

Abstract
:1. Introduction
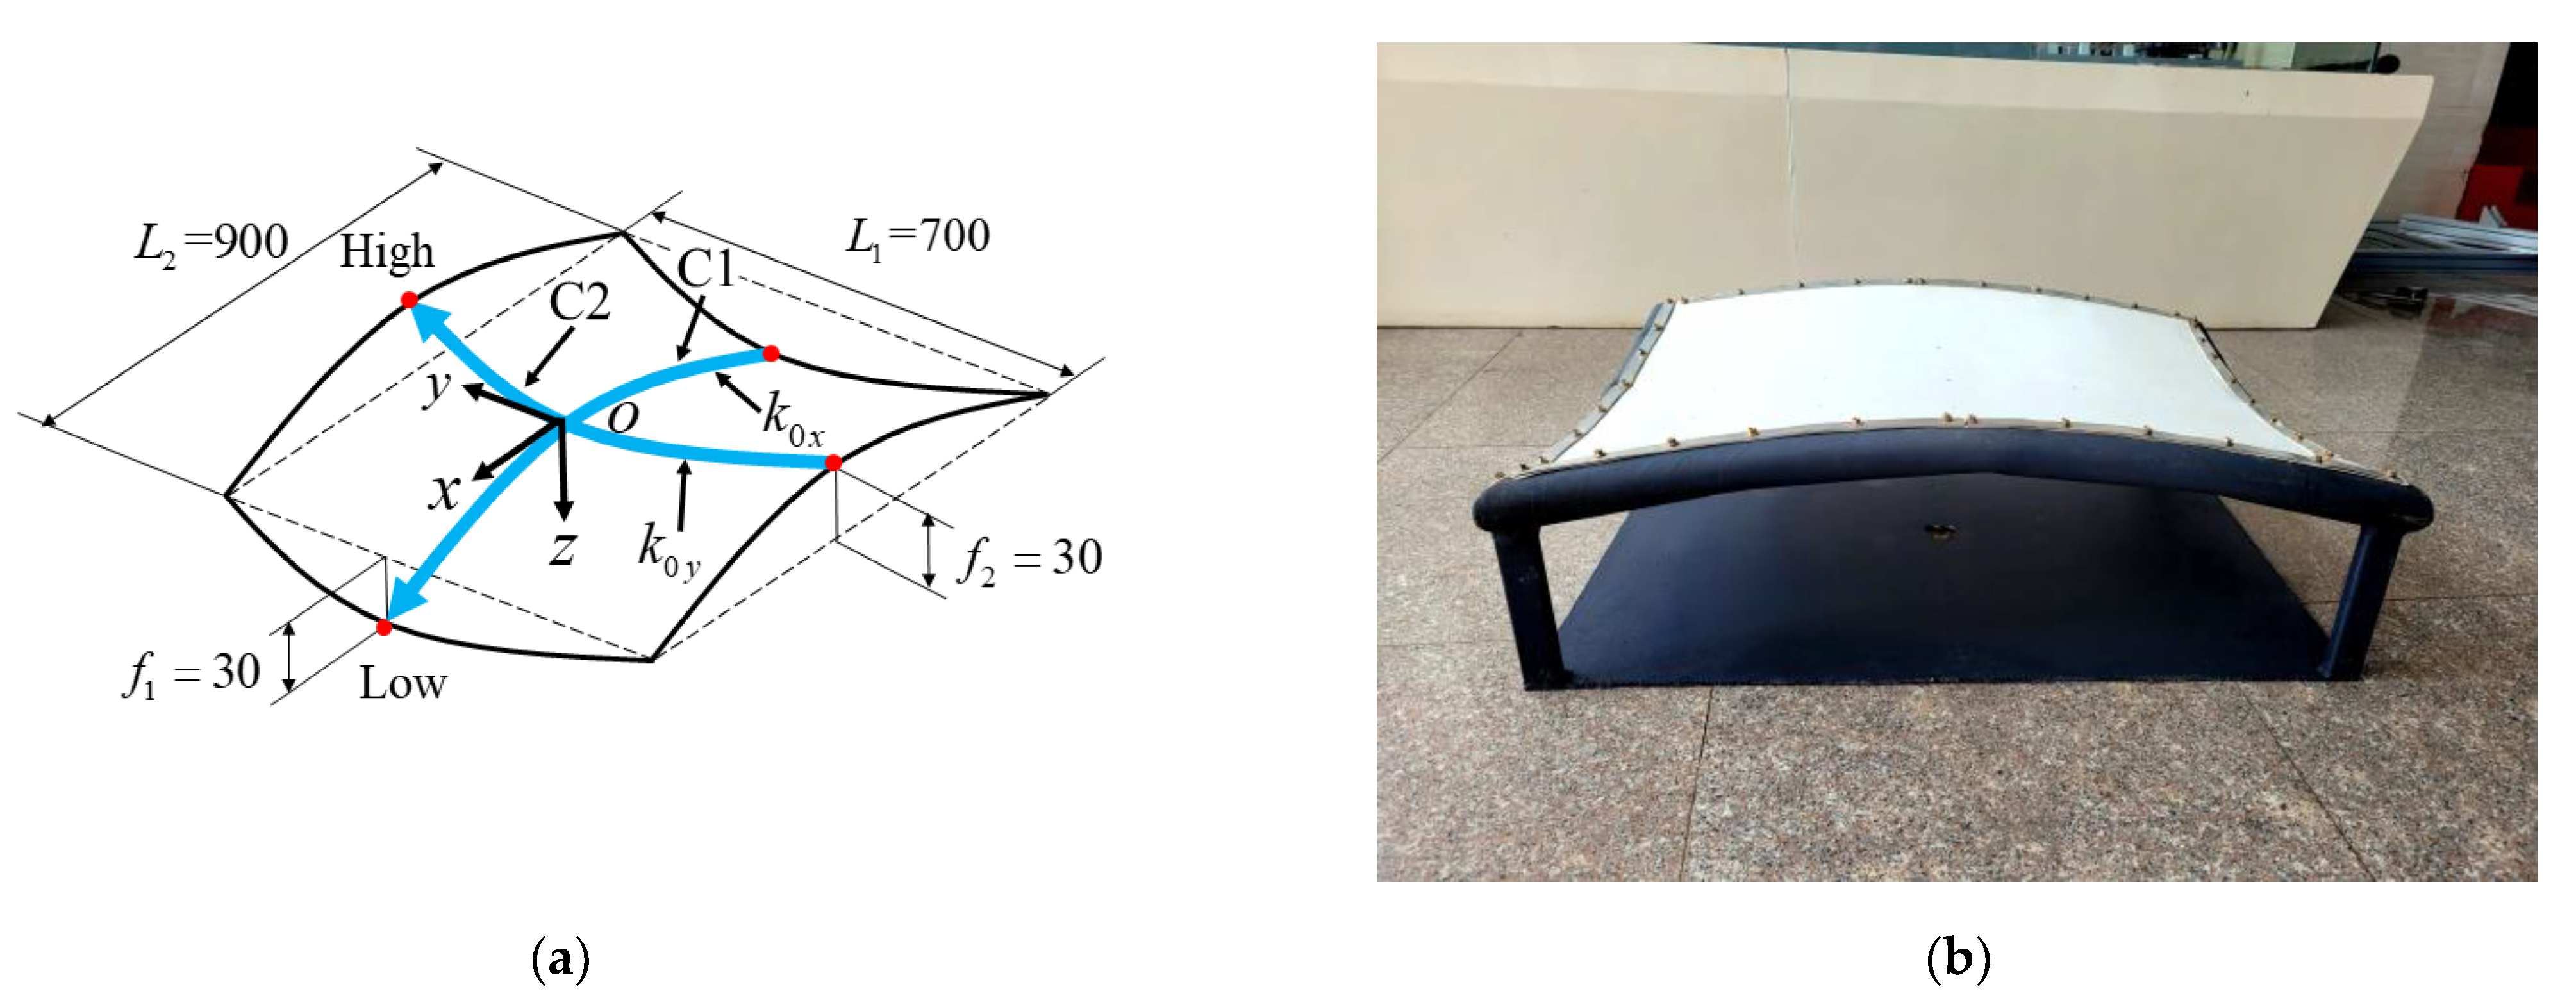
2. Introduction of Hyperbolic Paraboloid Membrane Structure Models
3. Aeroelastic Wind Tunnel Tests
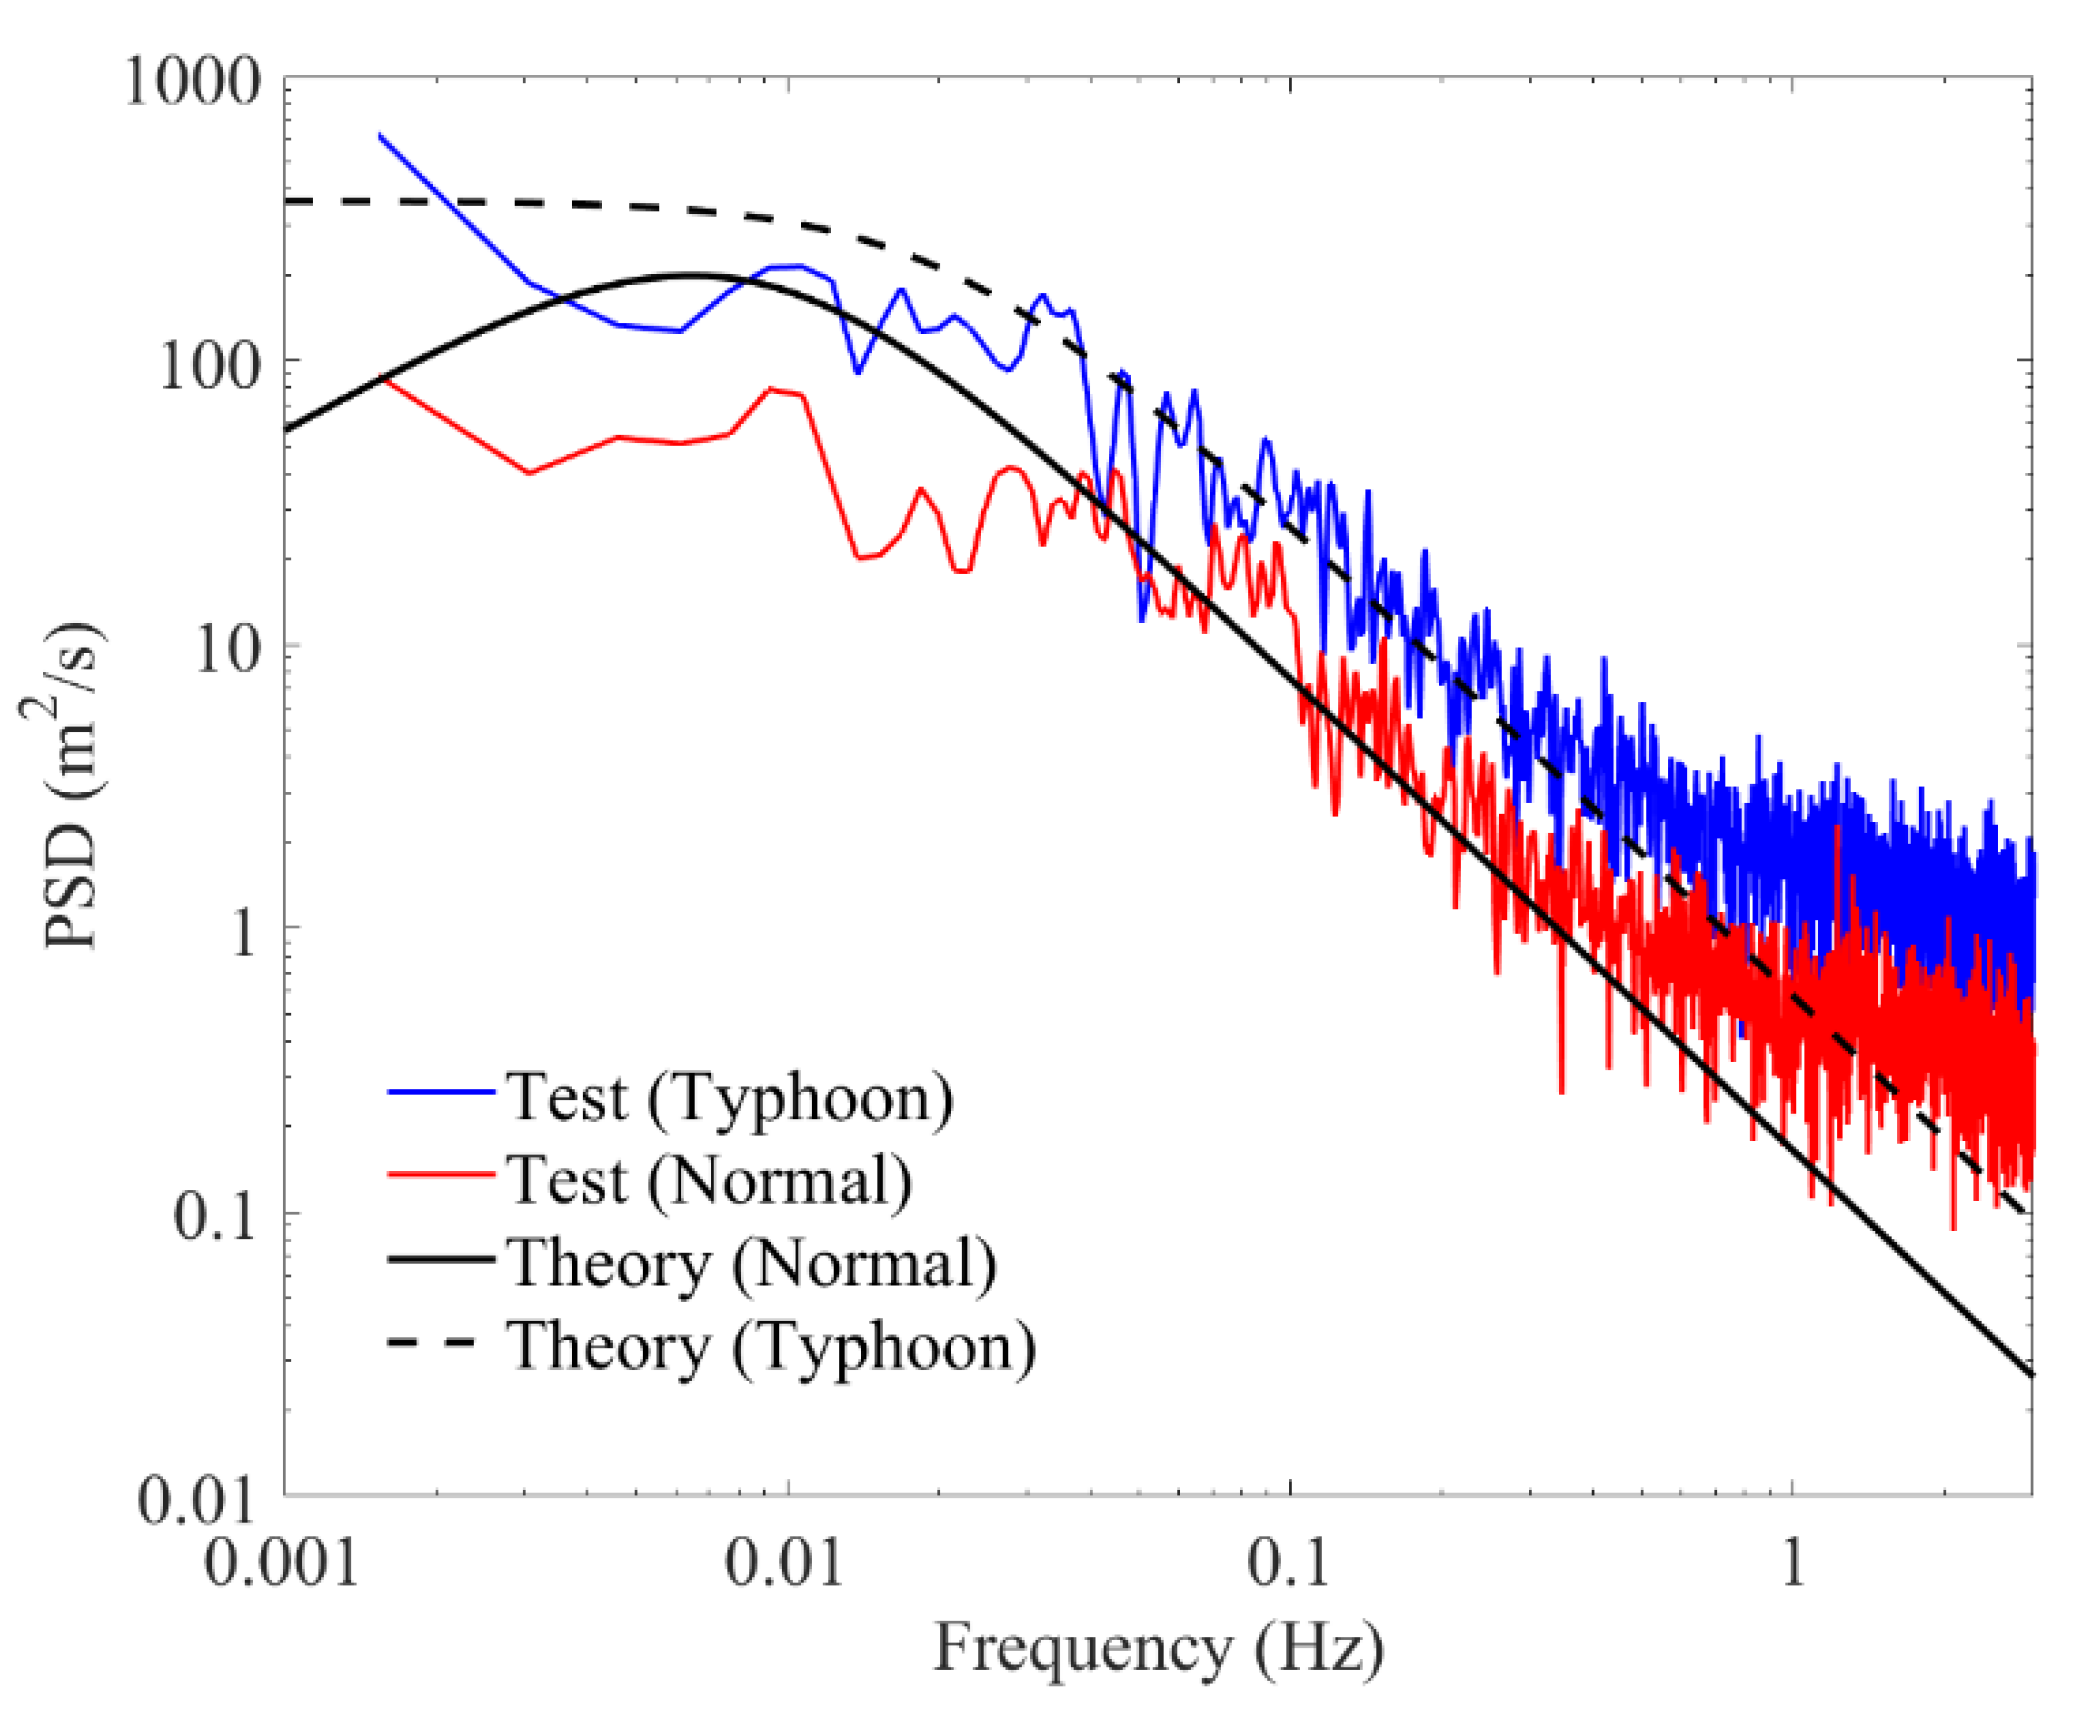
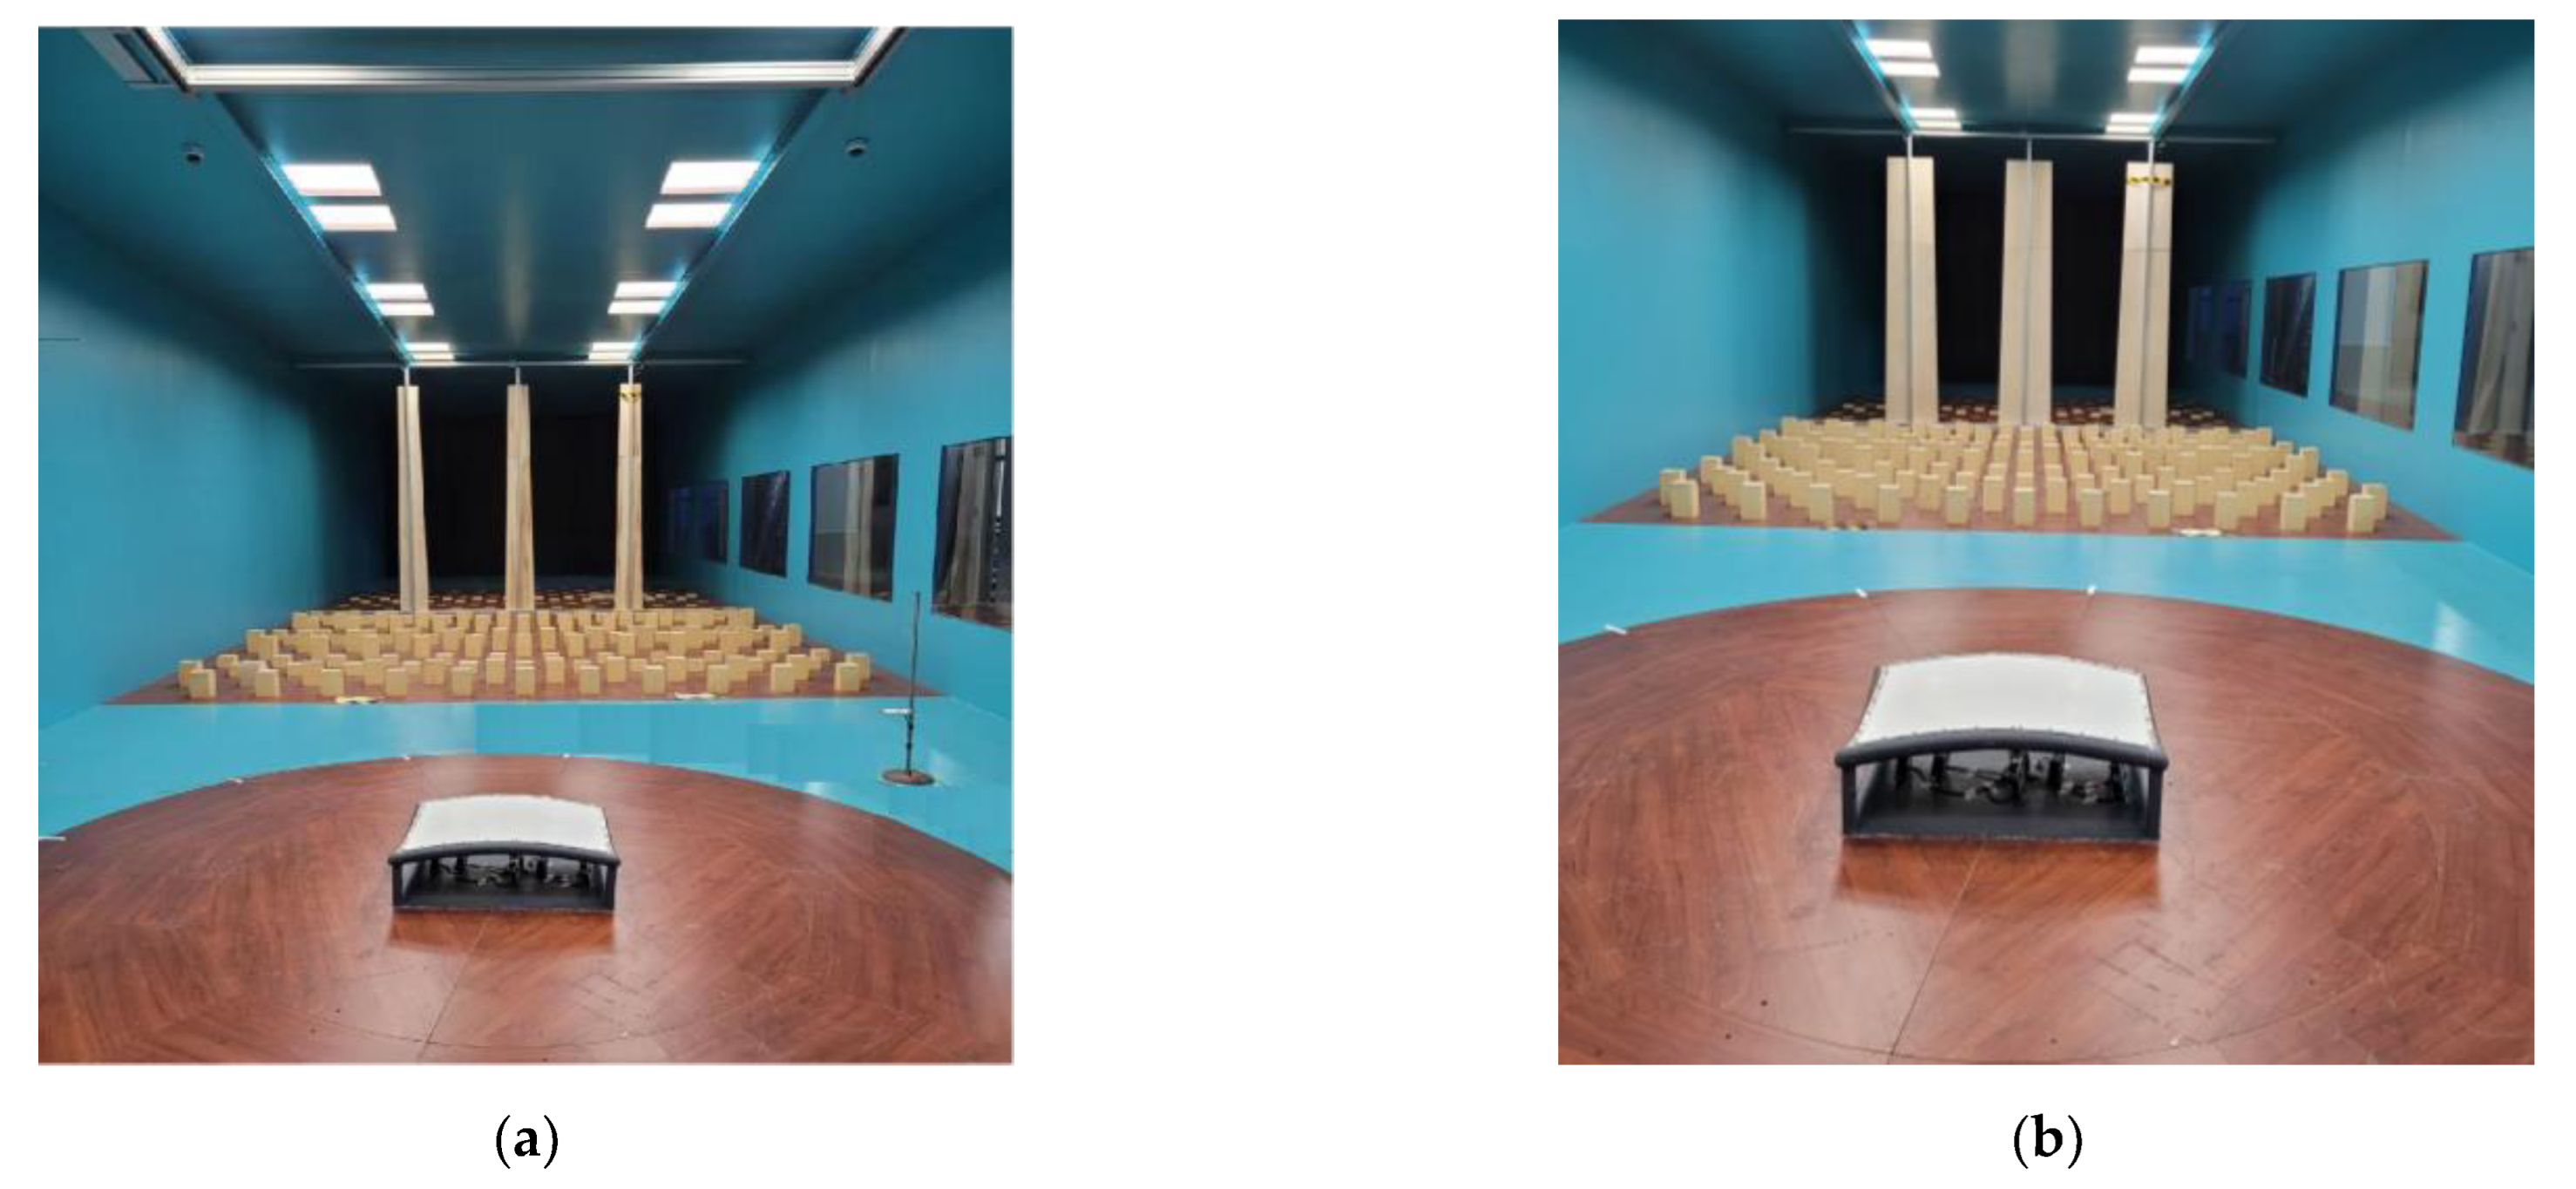
3.1. Simulation of Wind Fields
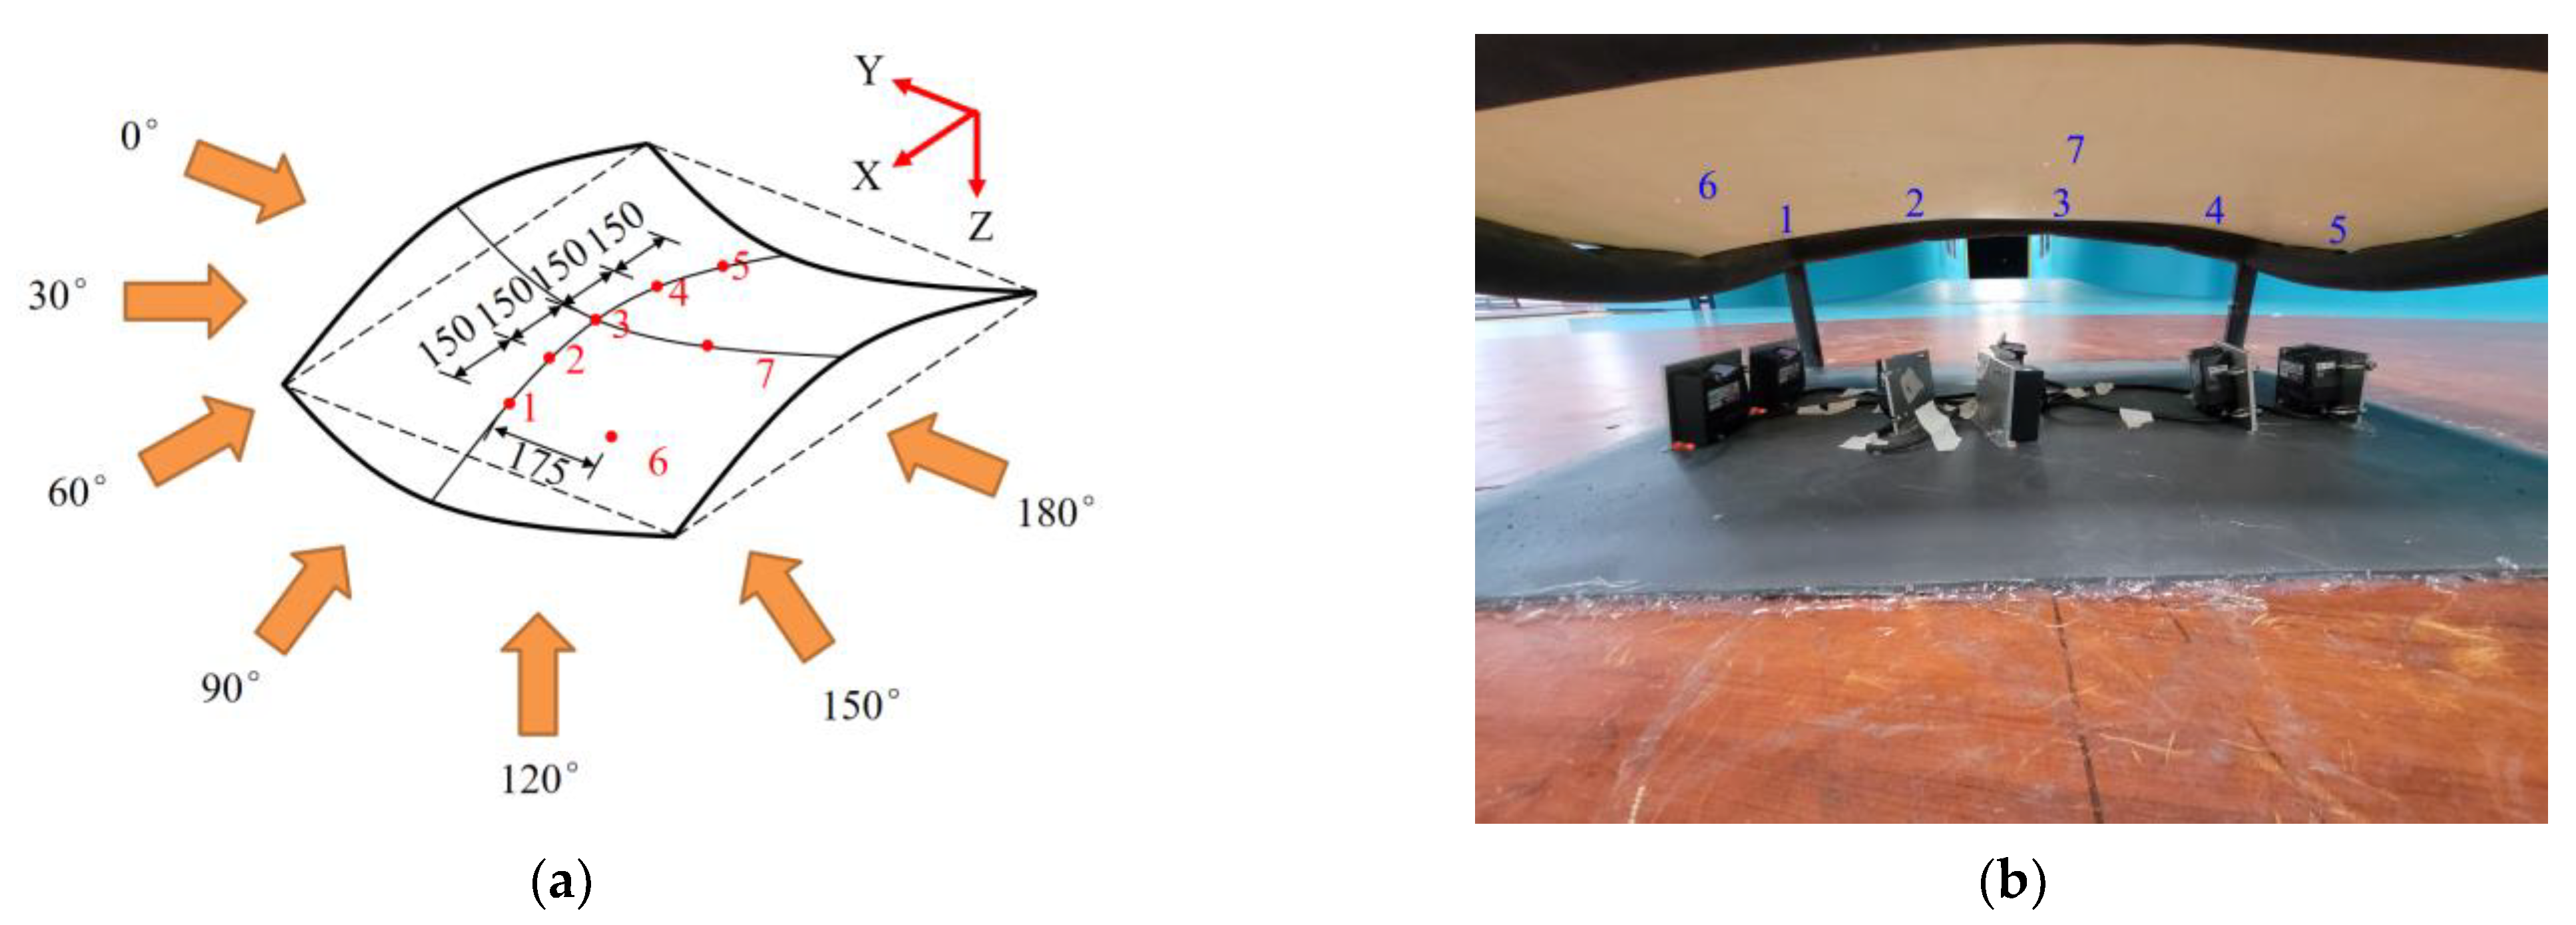
3.2. Arrangement of Measurement Points
3.3. Test Cases
4. Test Result and Analysis
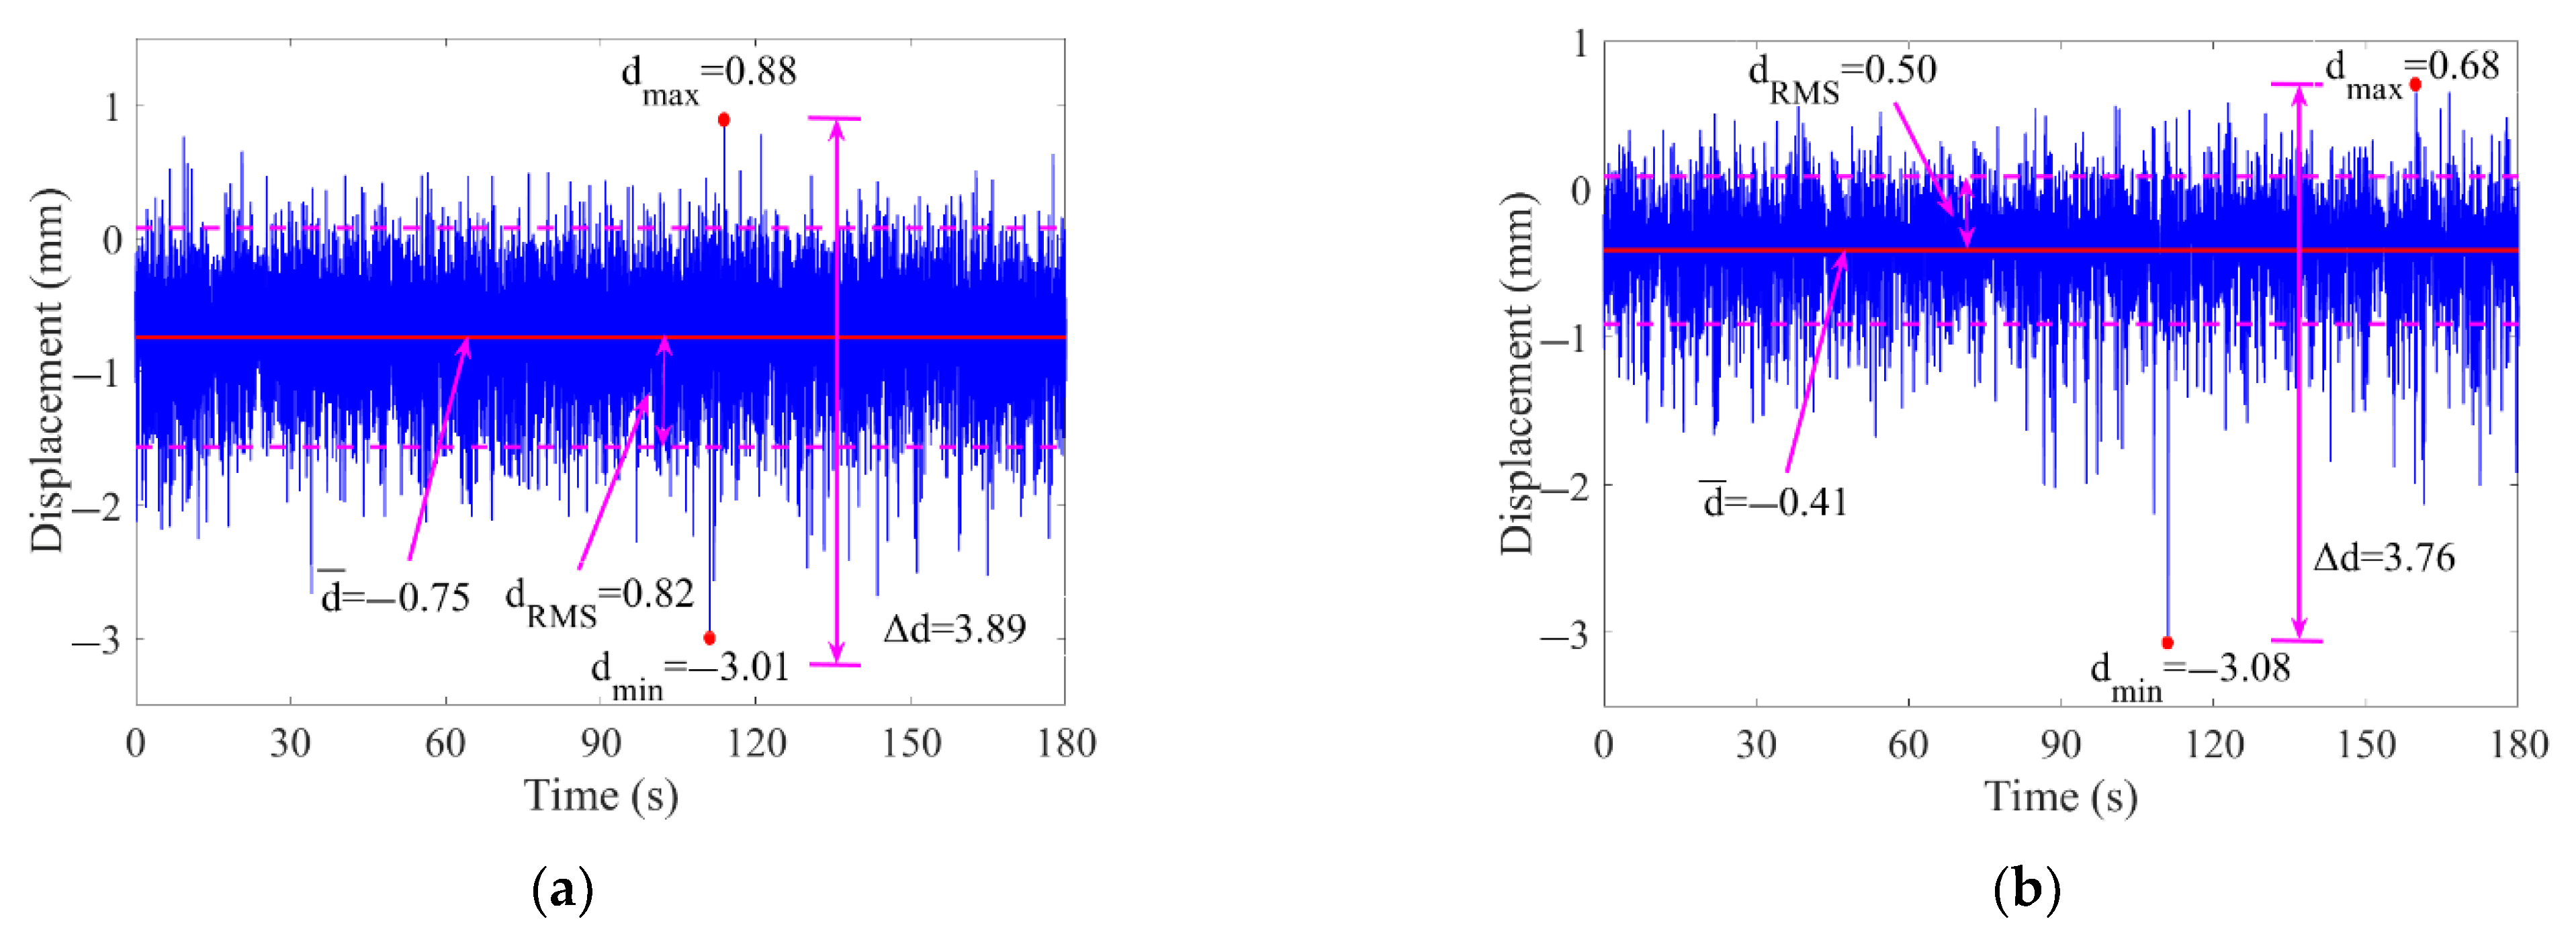
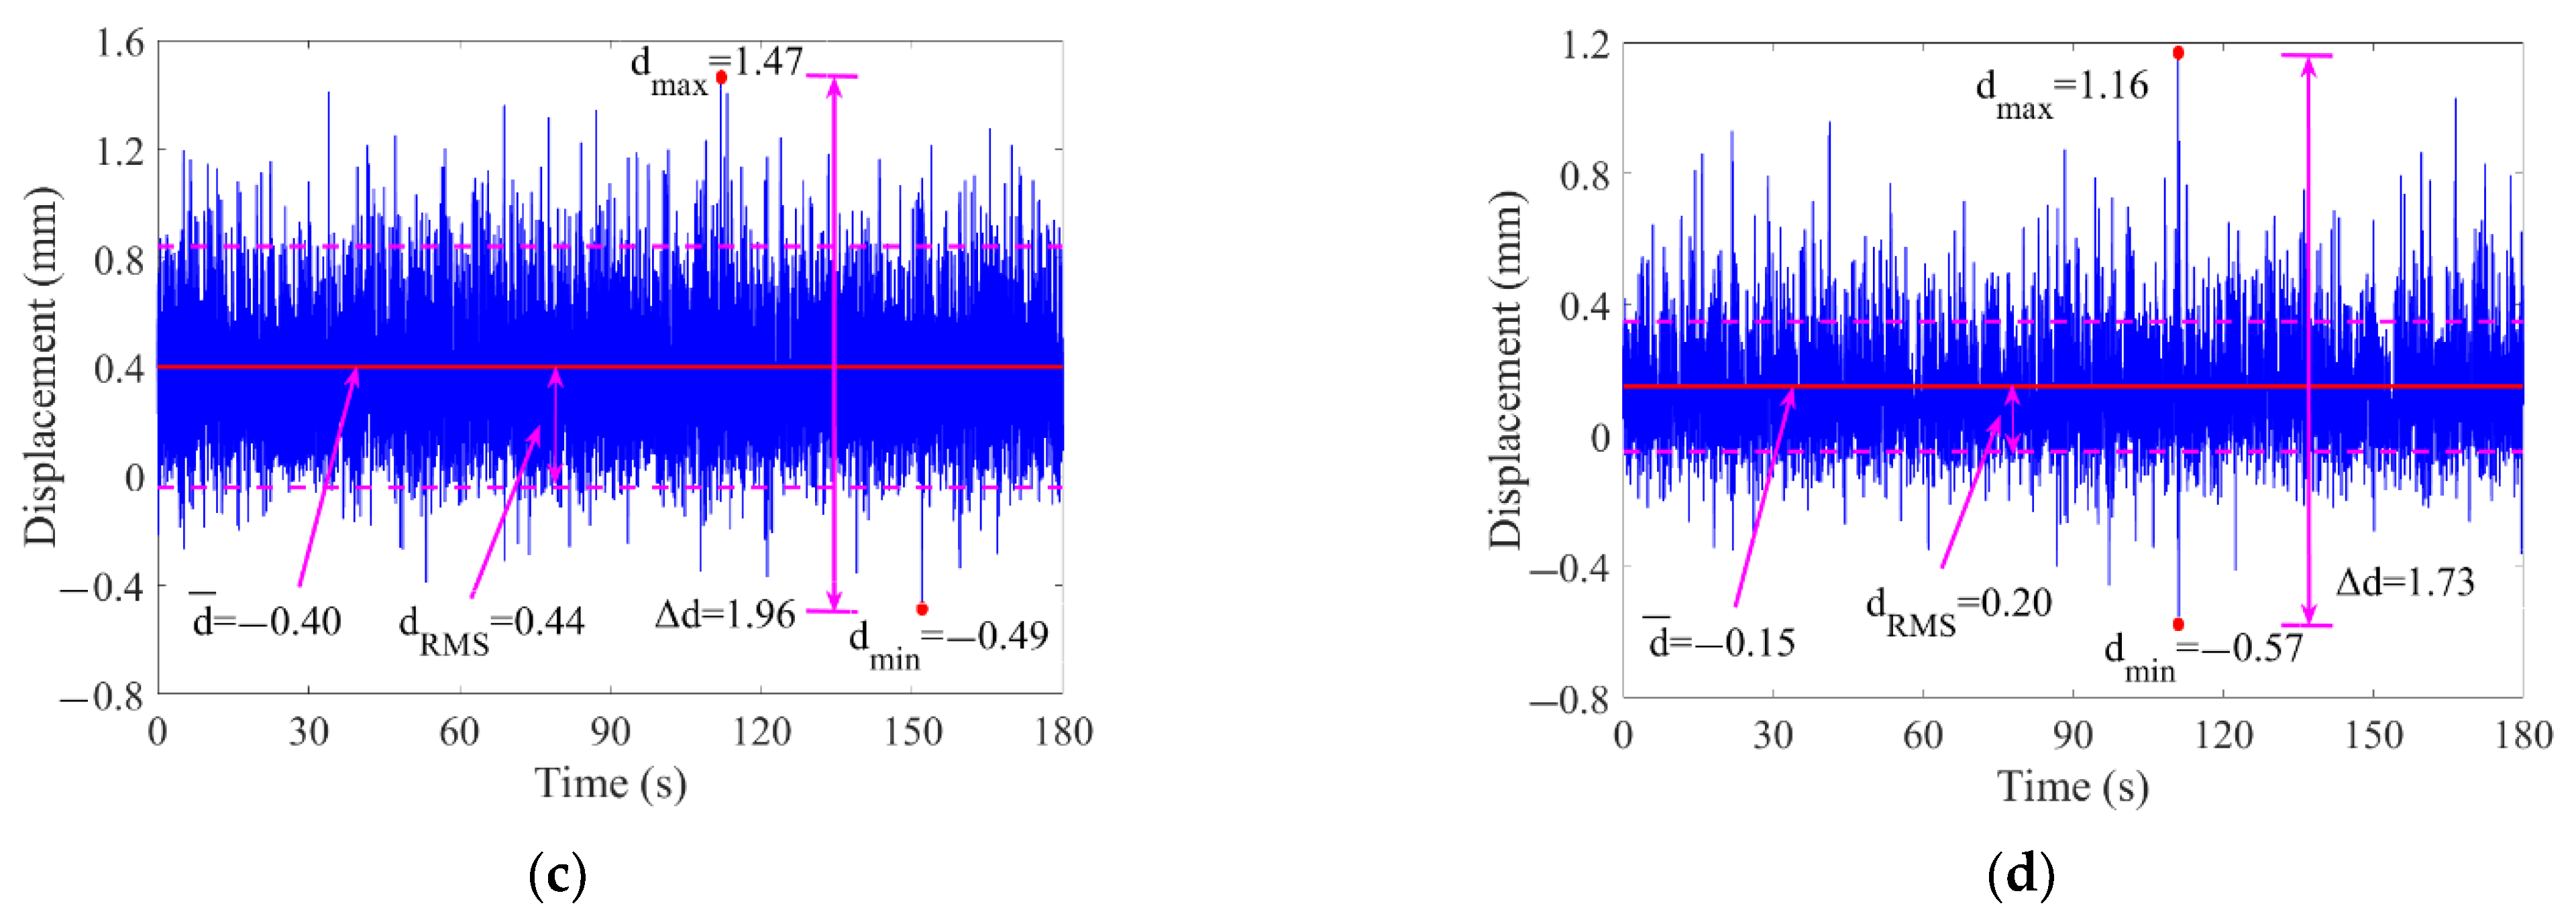
4.1. Displacement Time-History Response
4.2. Statistical Characteristics of Displacement
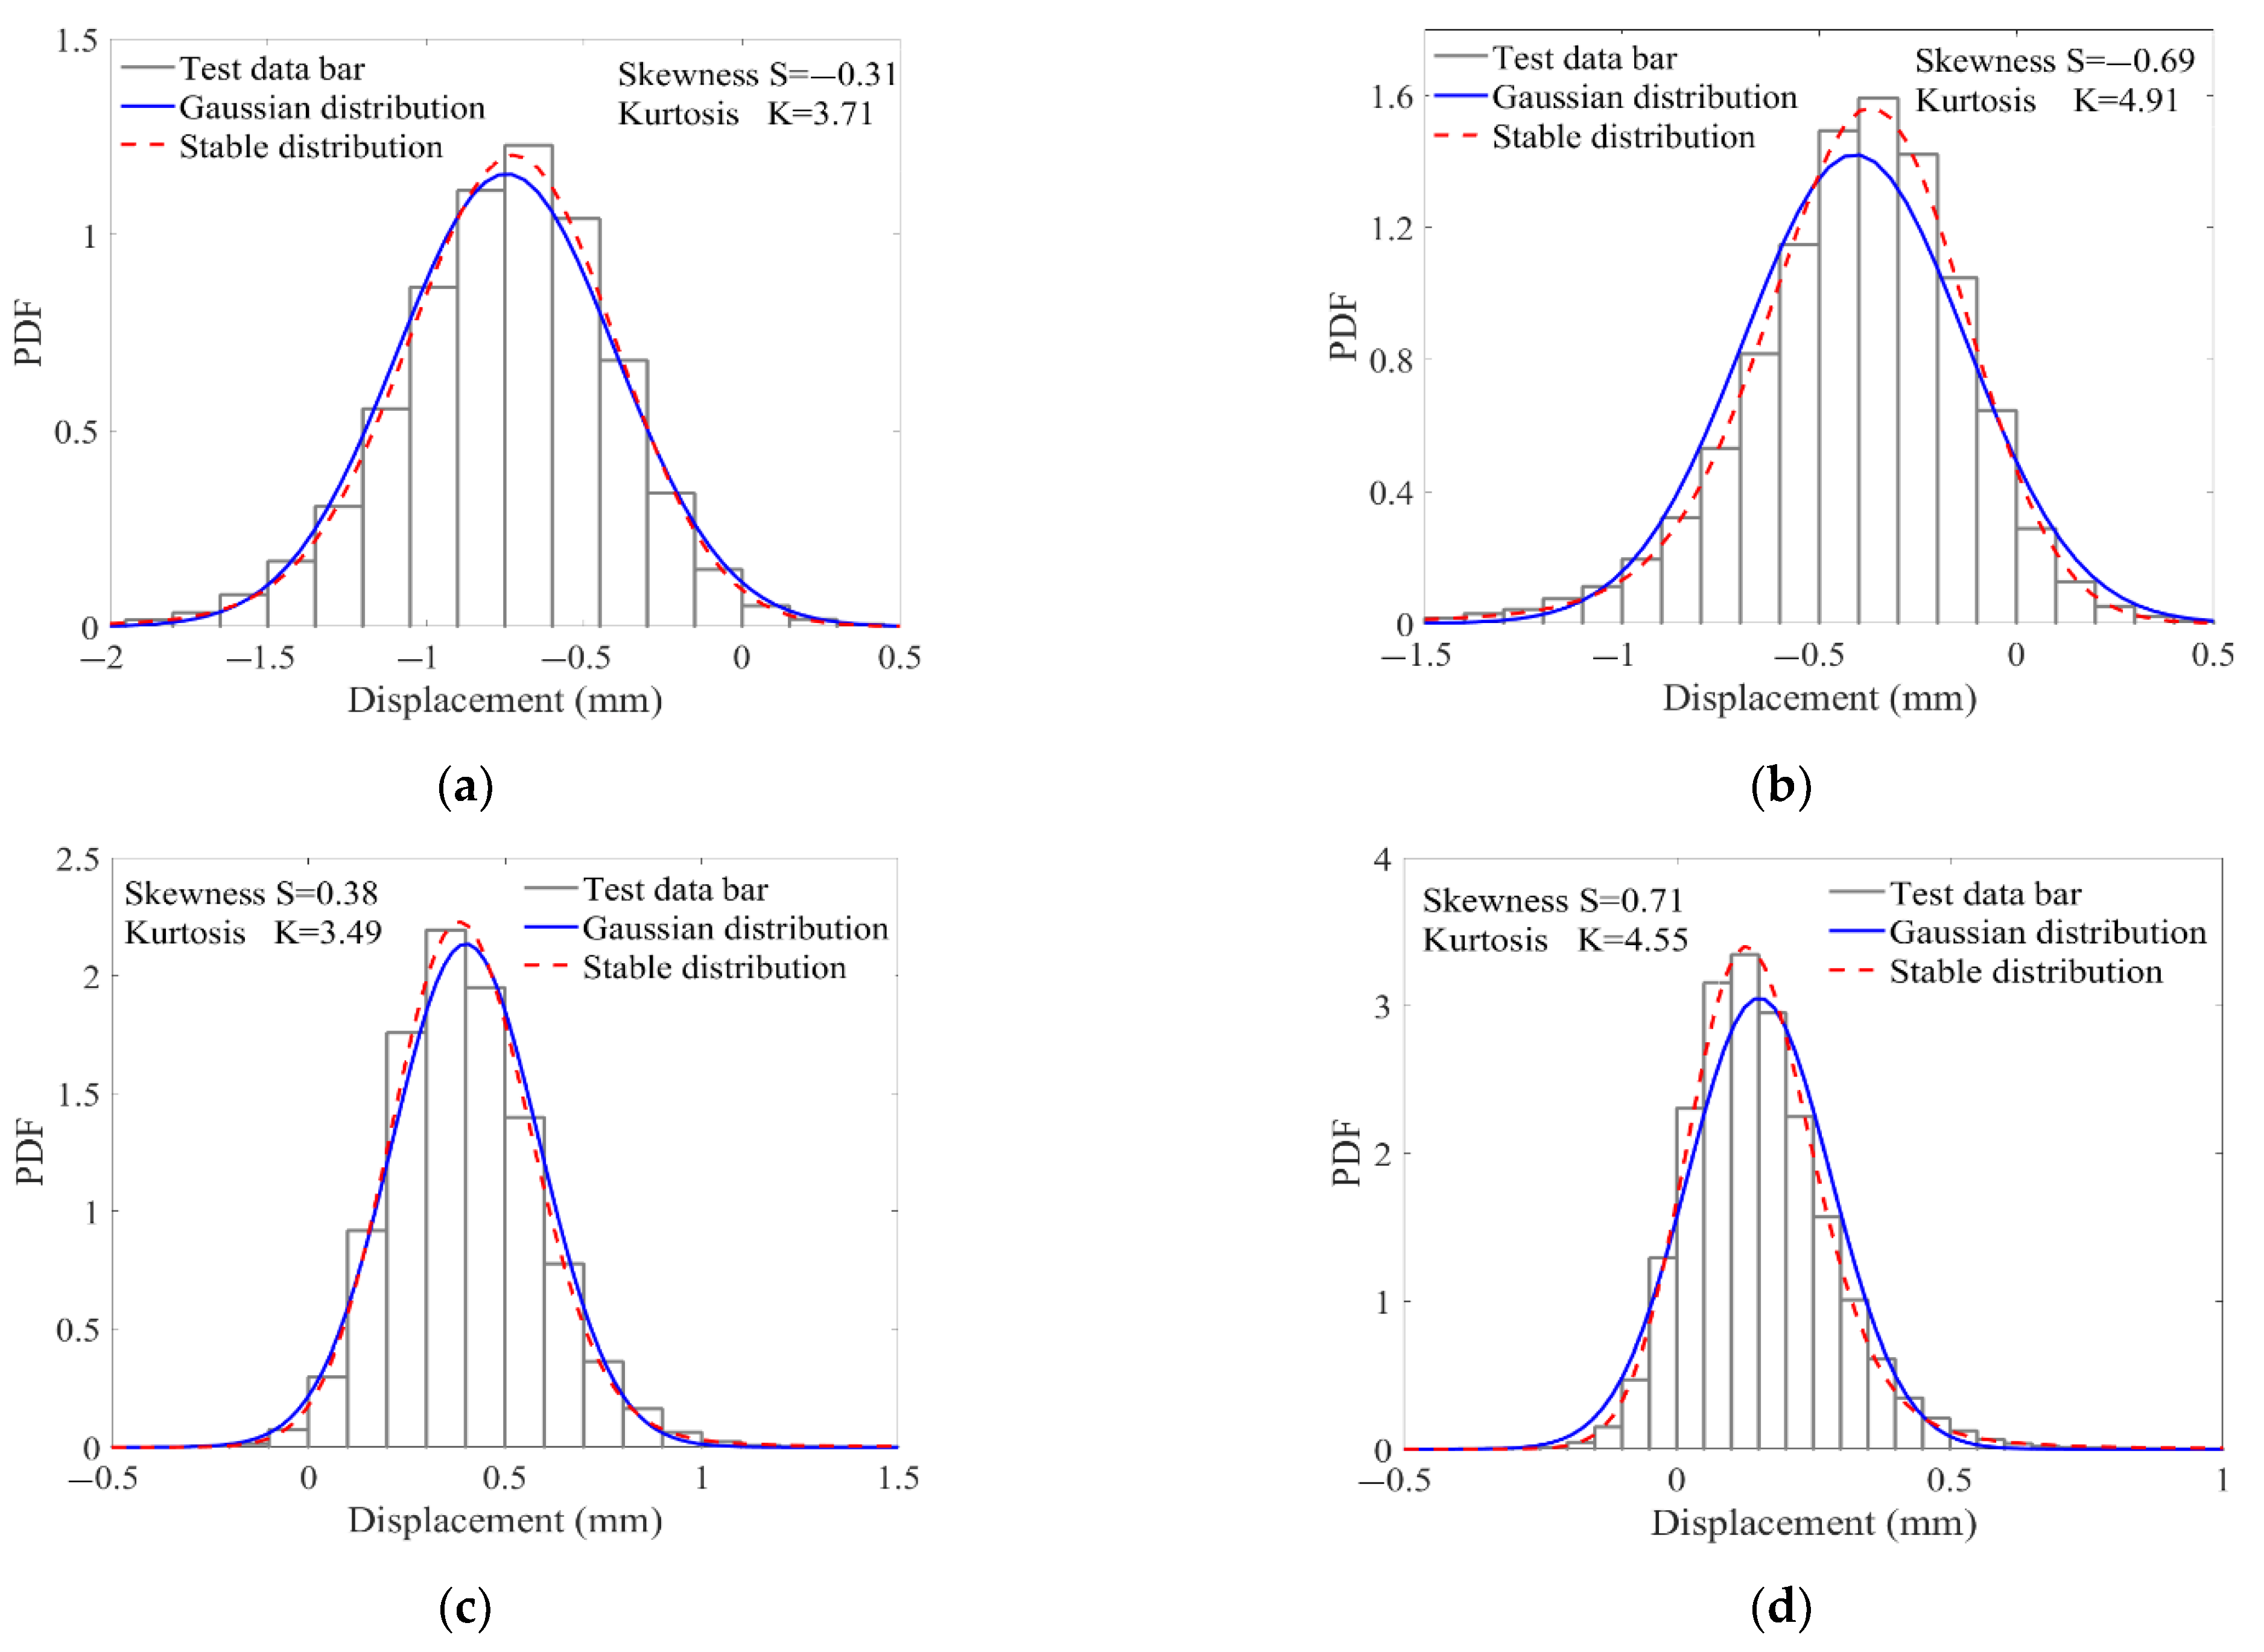
4.2.1. Probability Distribution Characteristics of Displacement
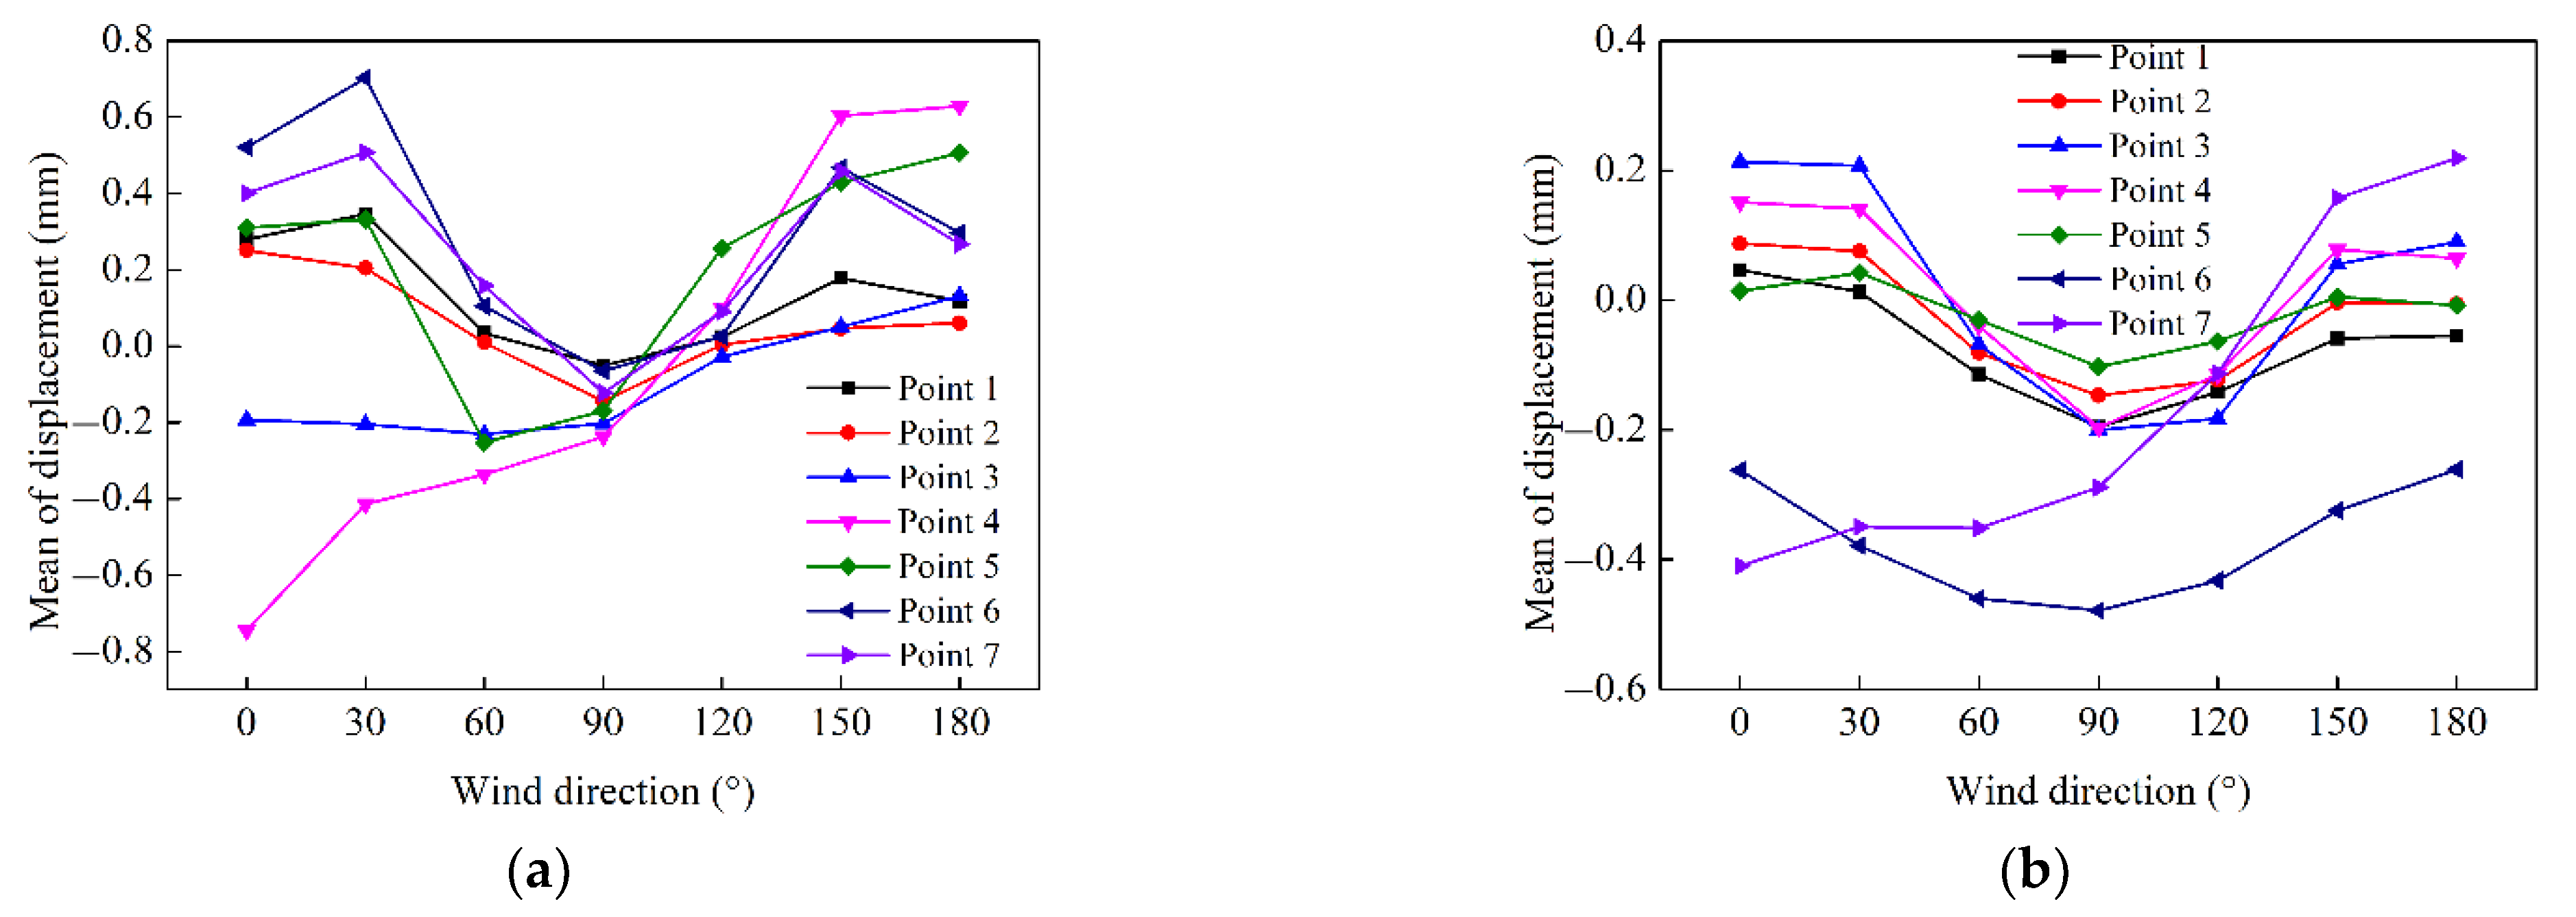
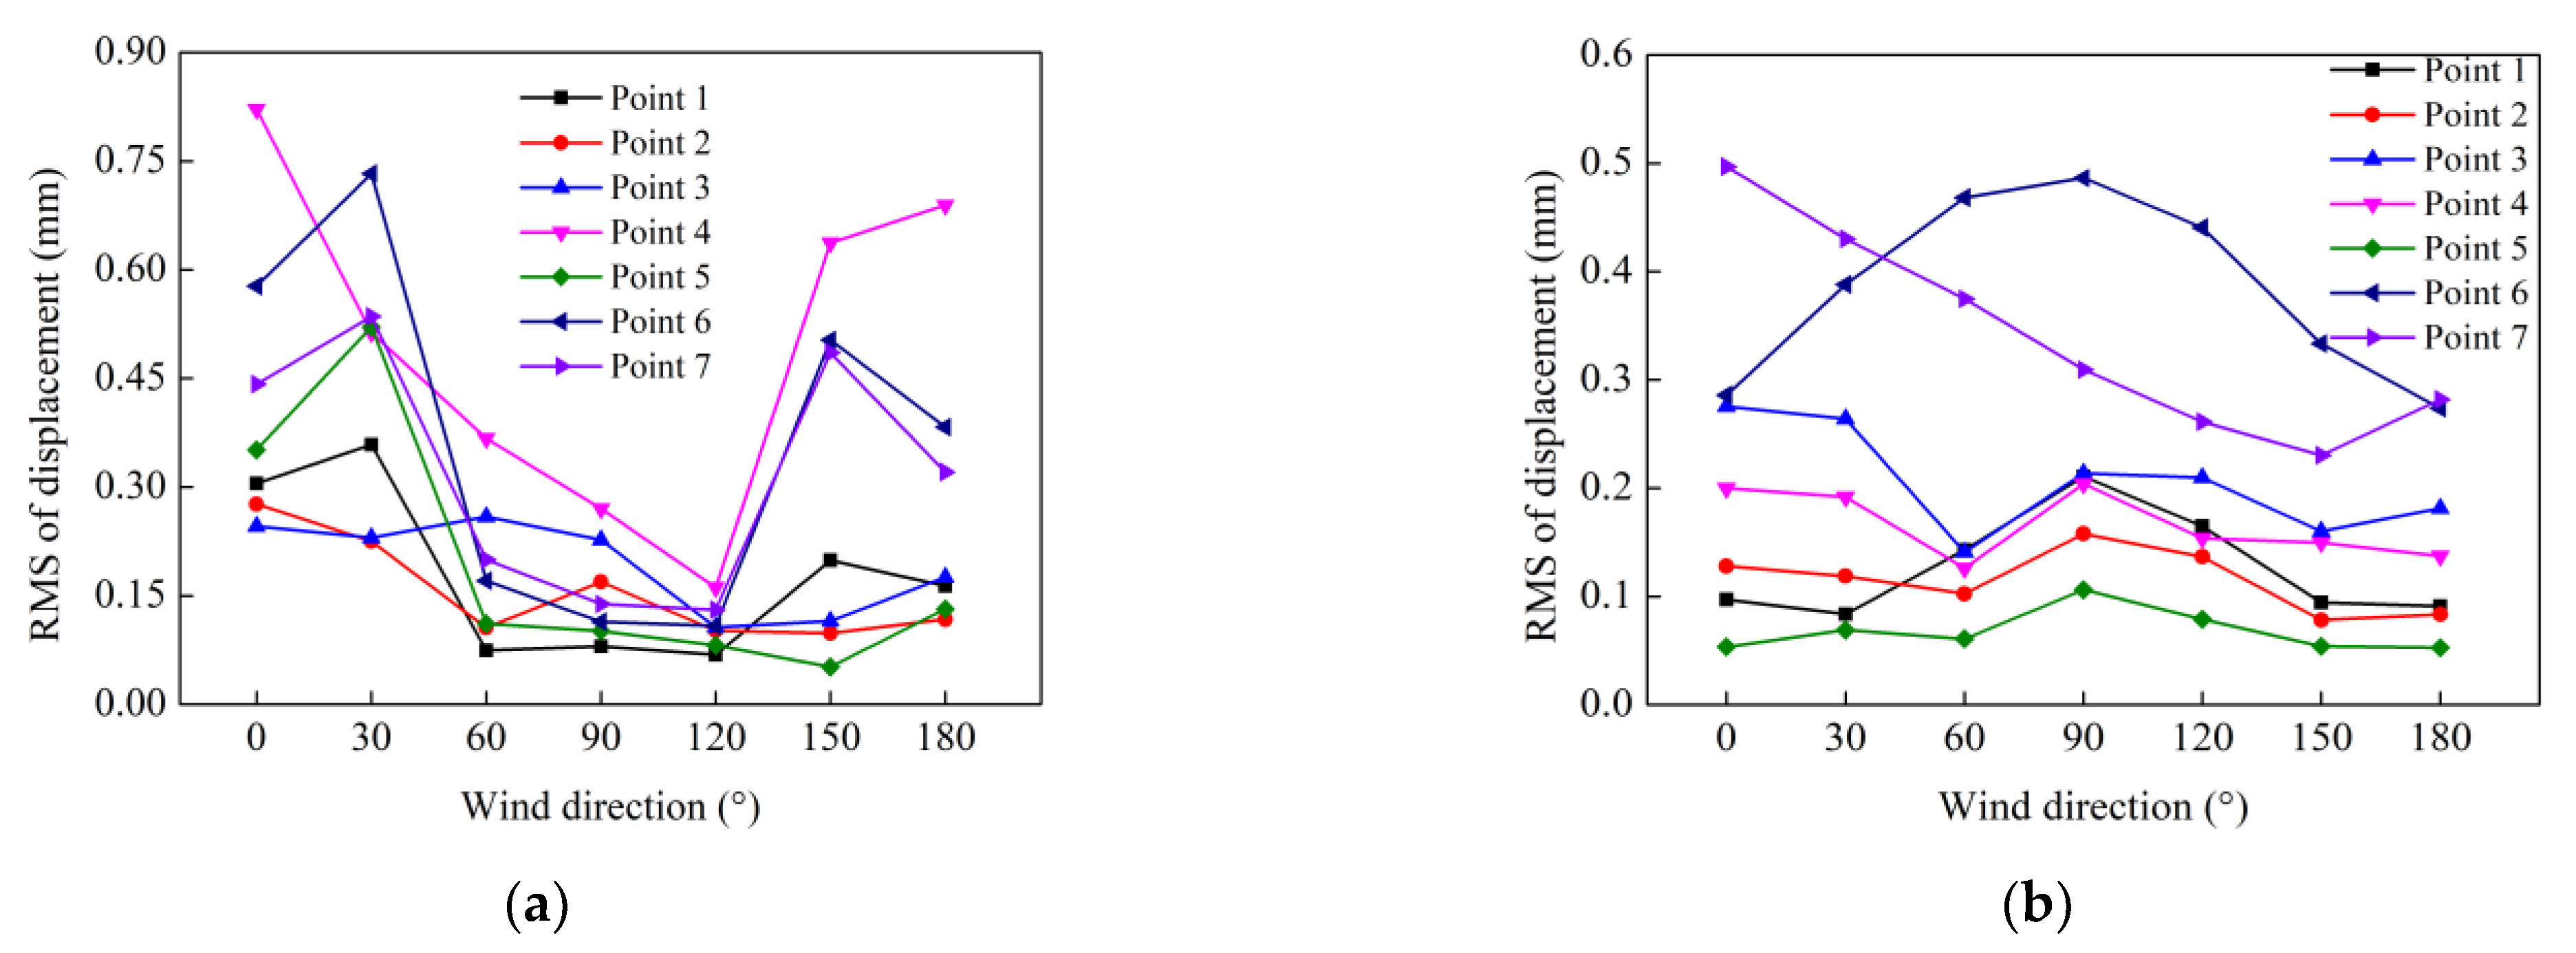
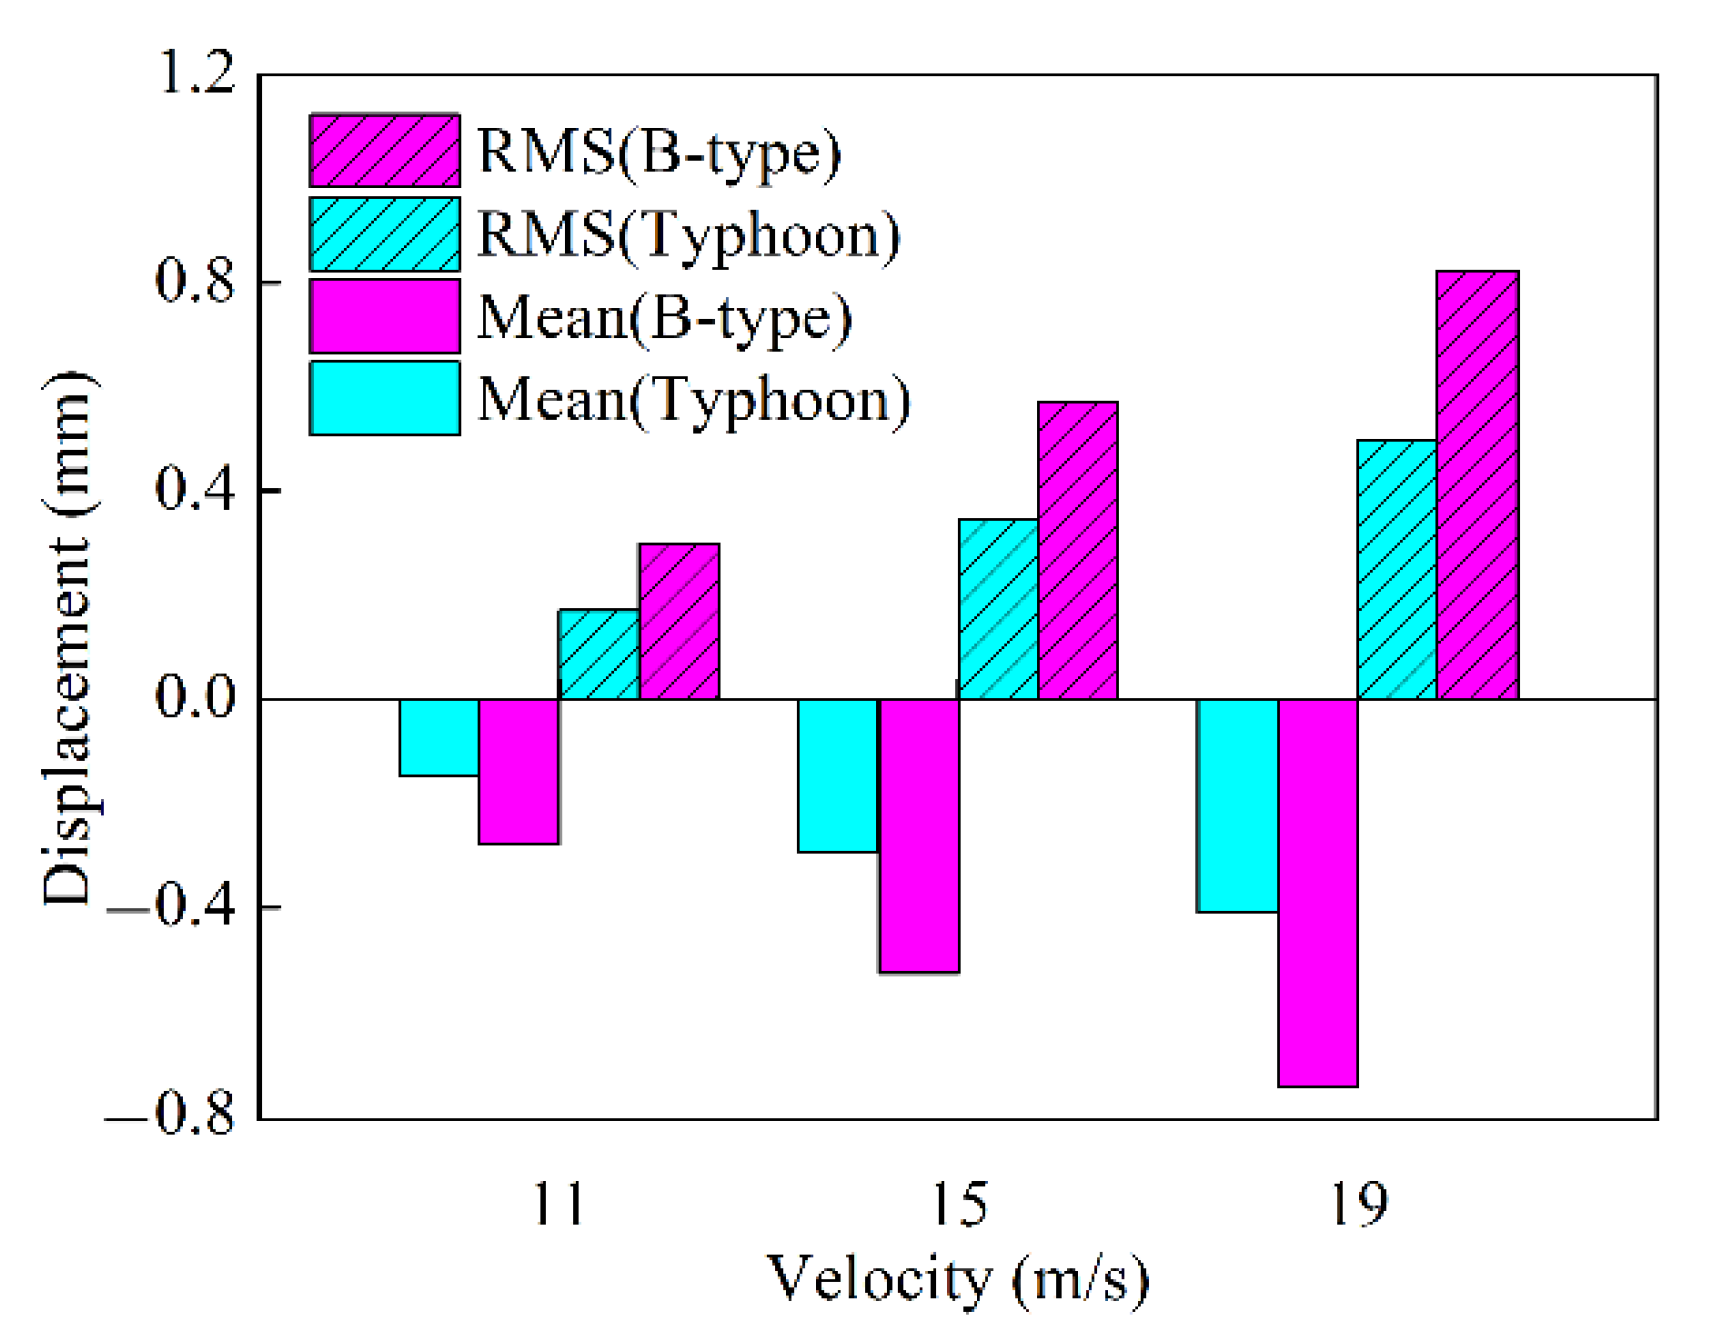
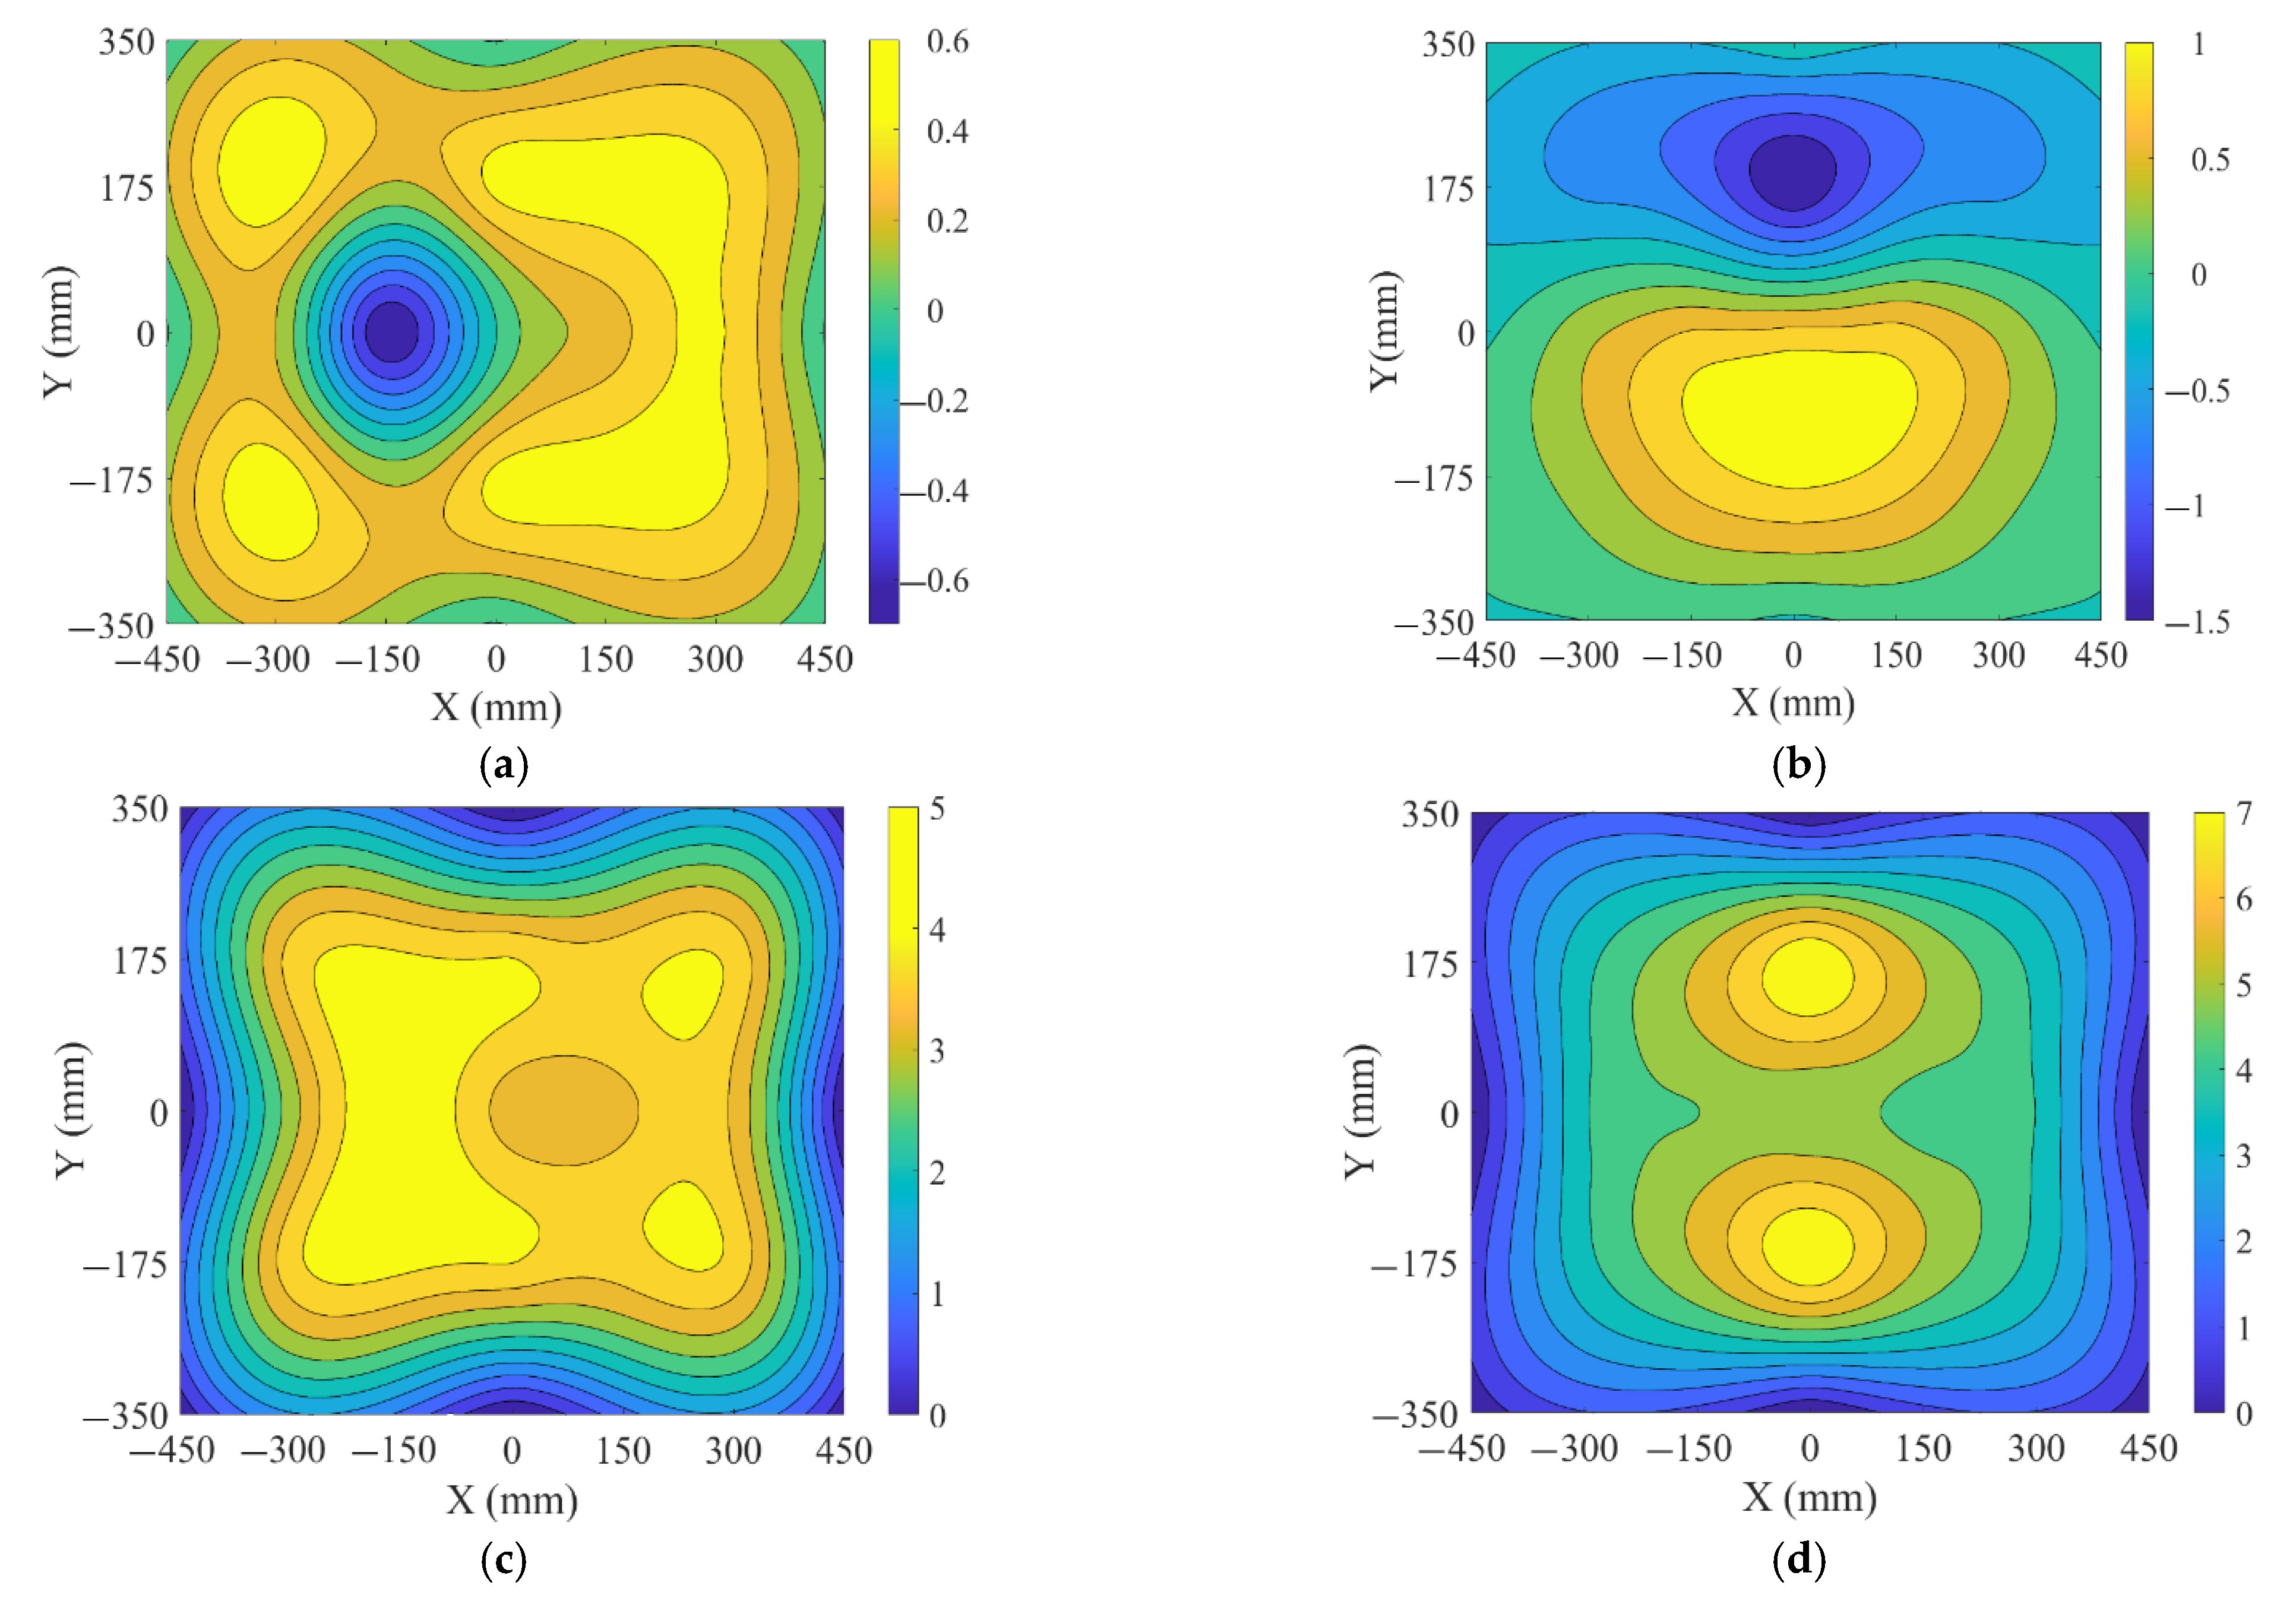
4.2.2. Mean and RMS Results
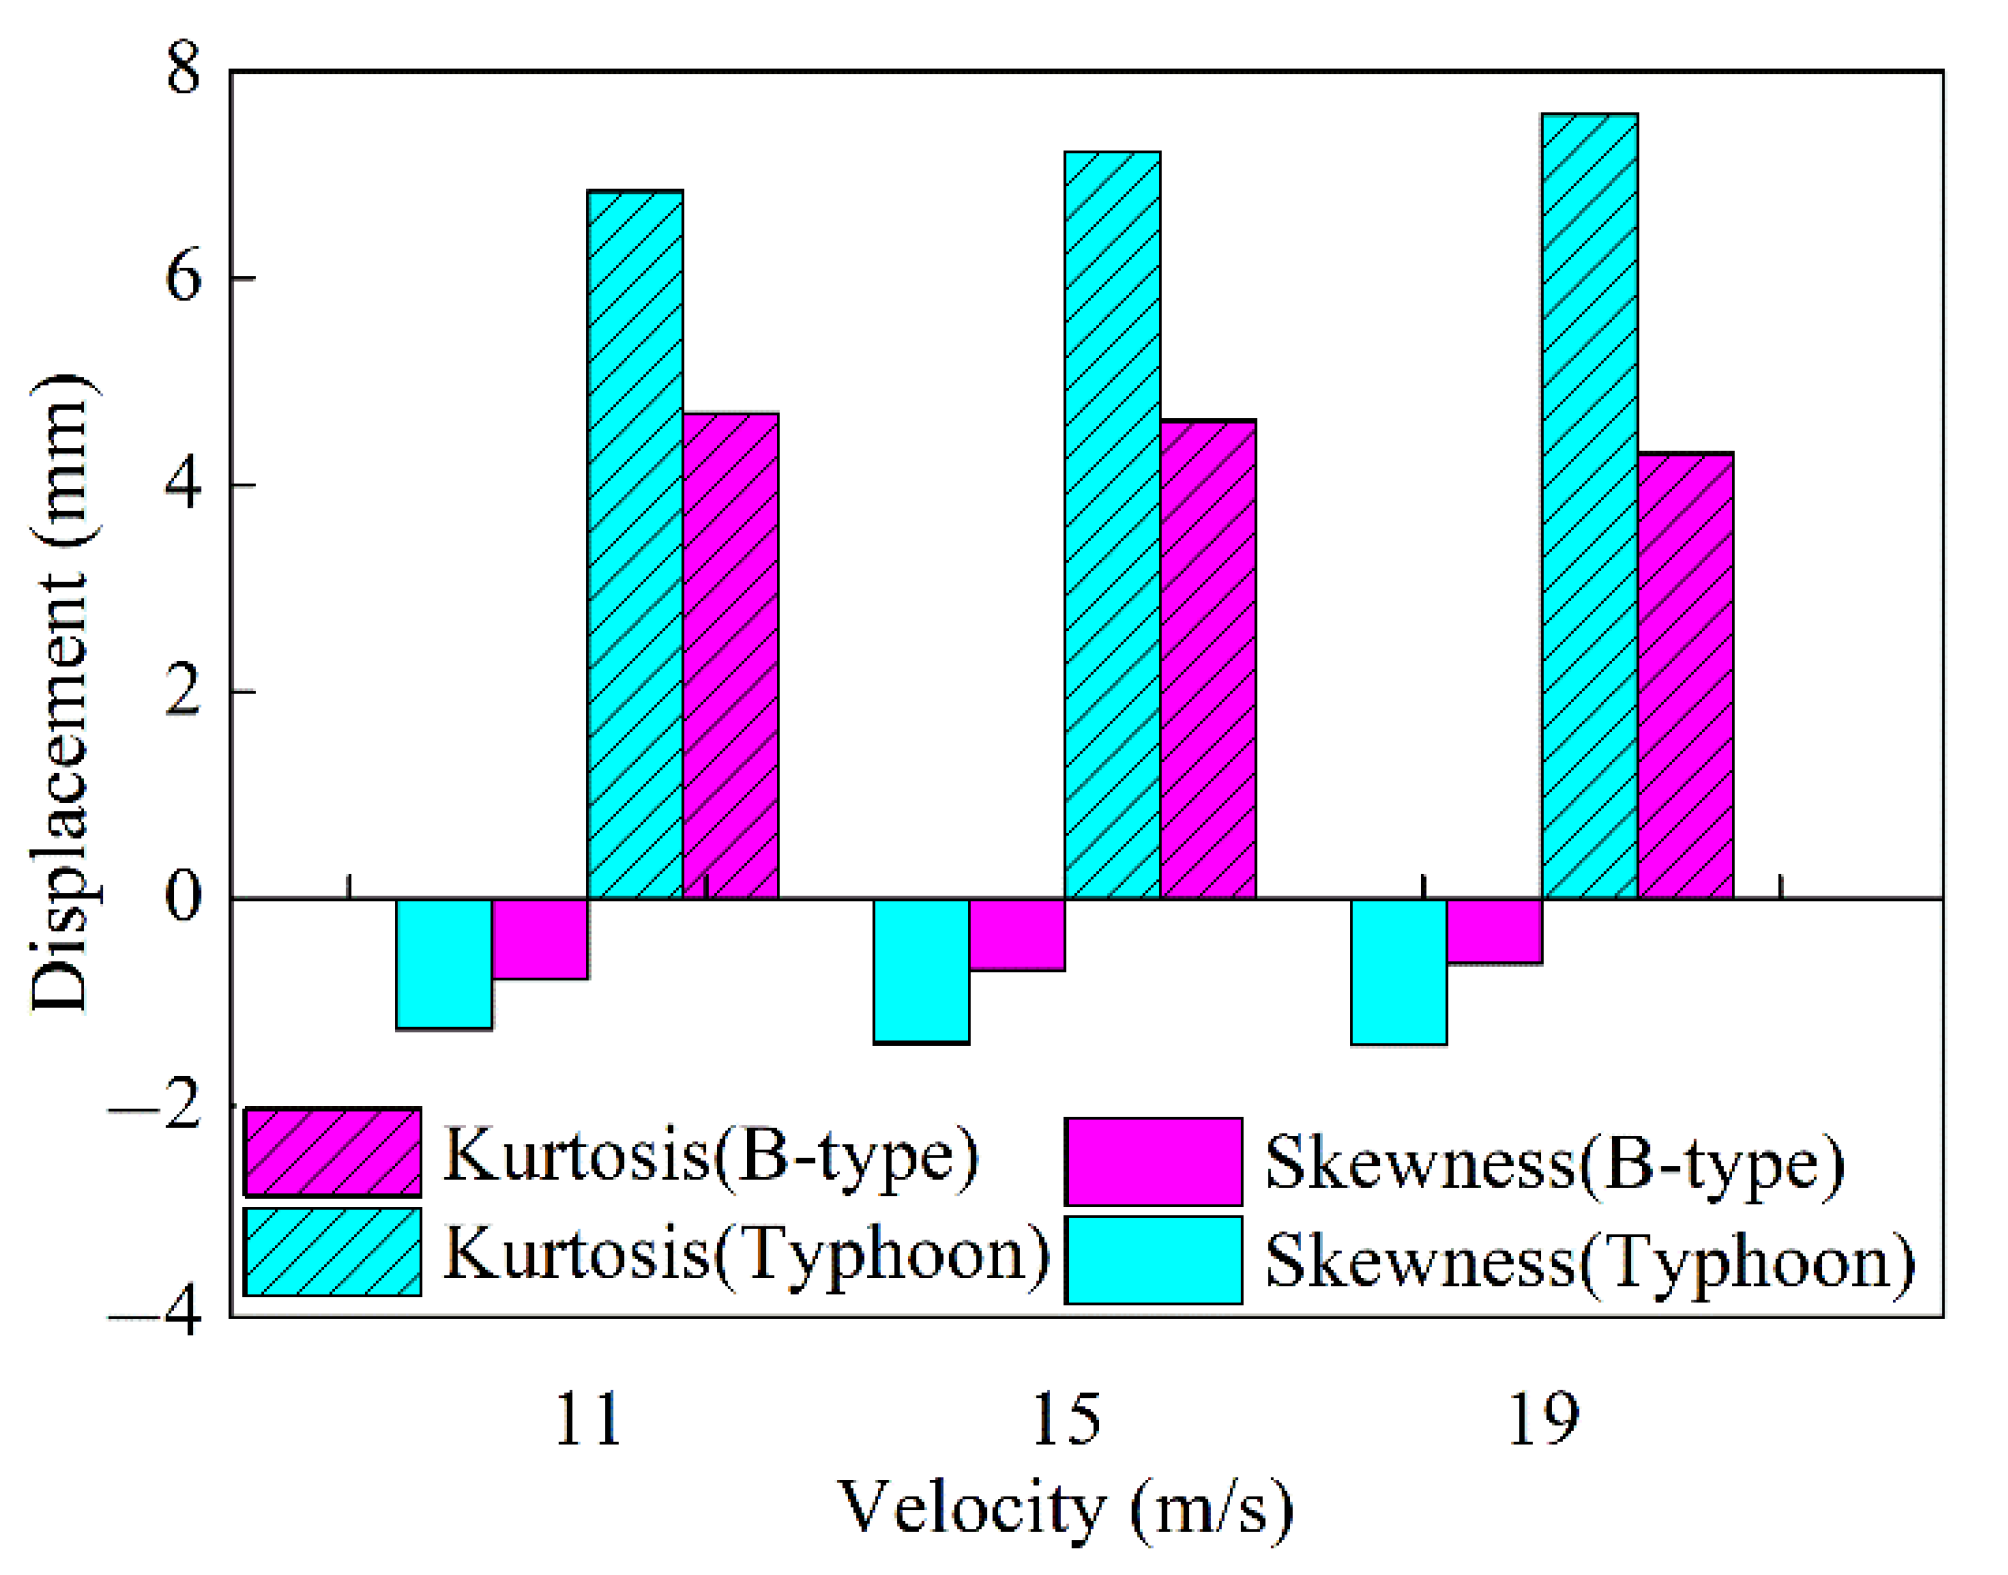
4.2.3. Skewness and Kurtosis Results
4.3. Structural Dynamic Characteristics
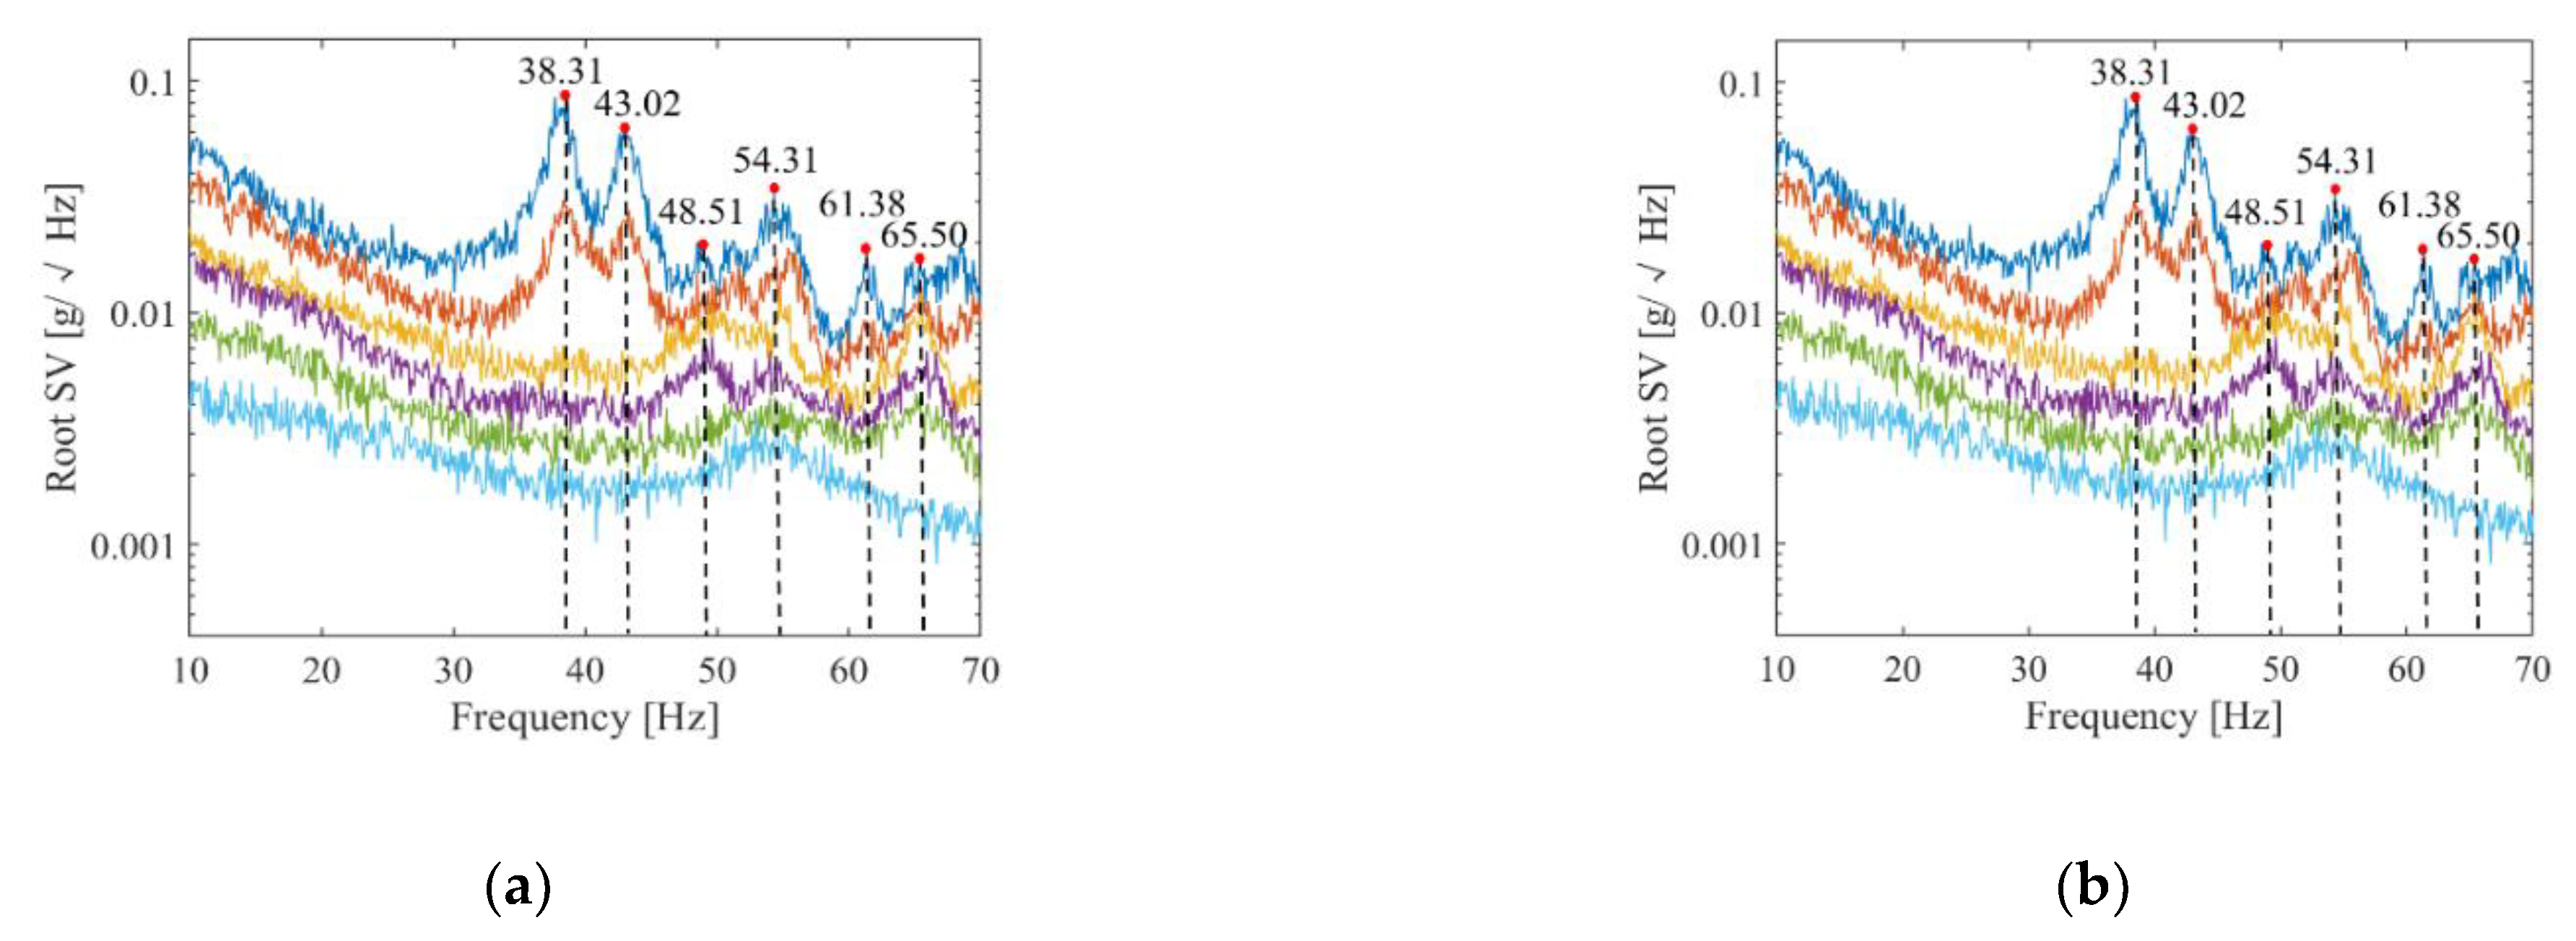
4.3.1. Frequency
4.3.2. Mode Shape
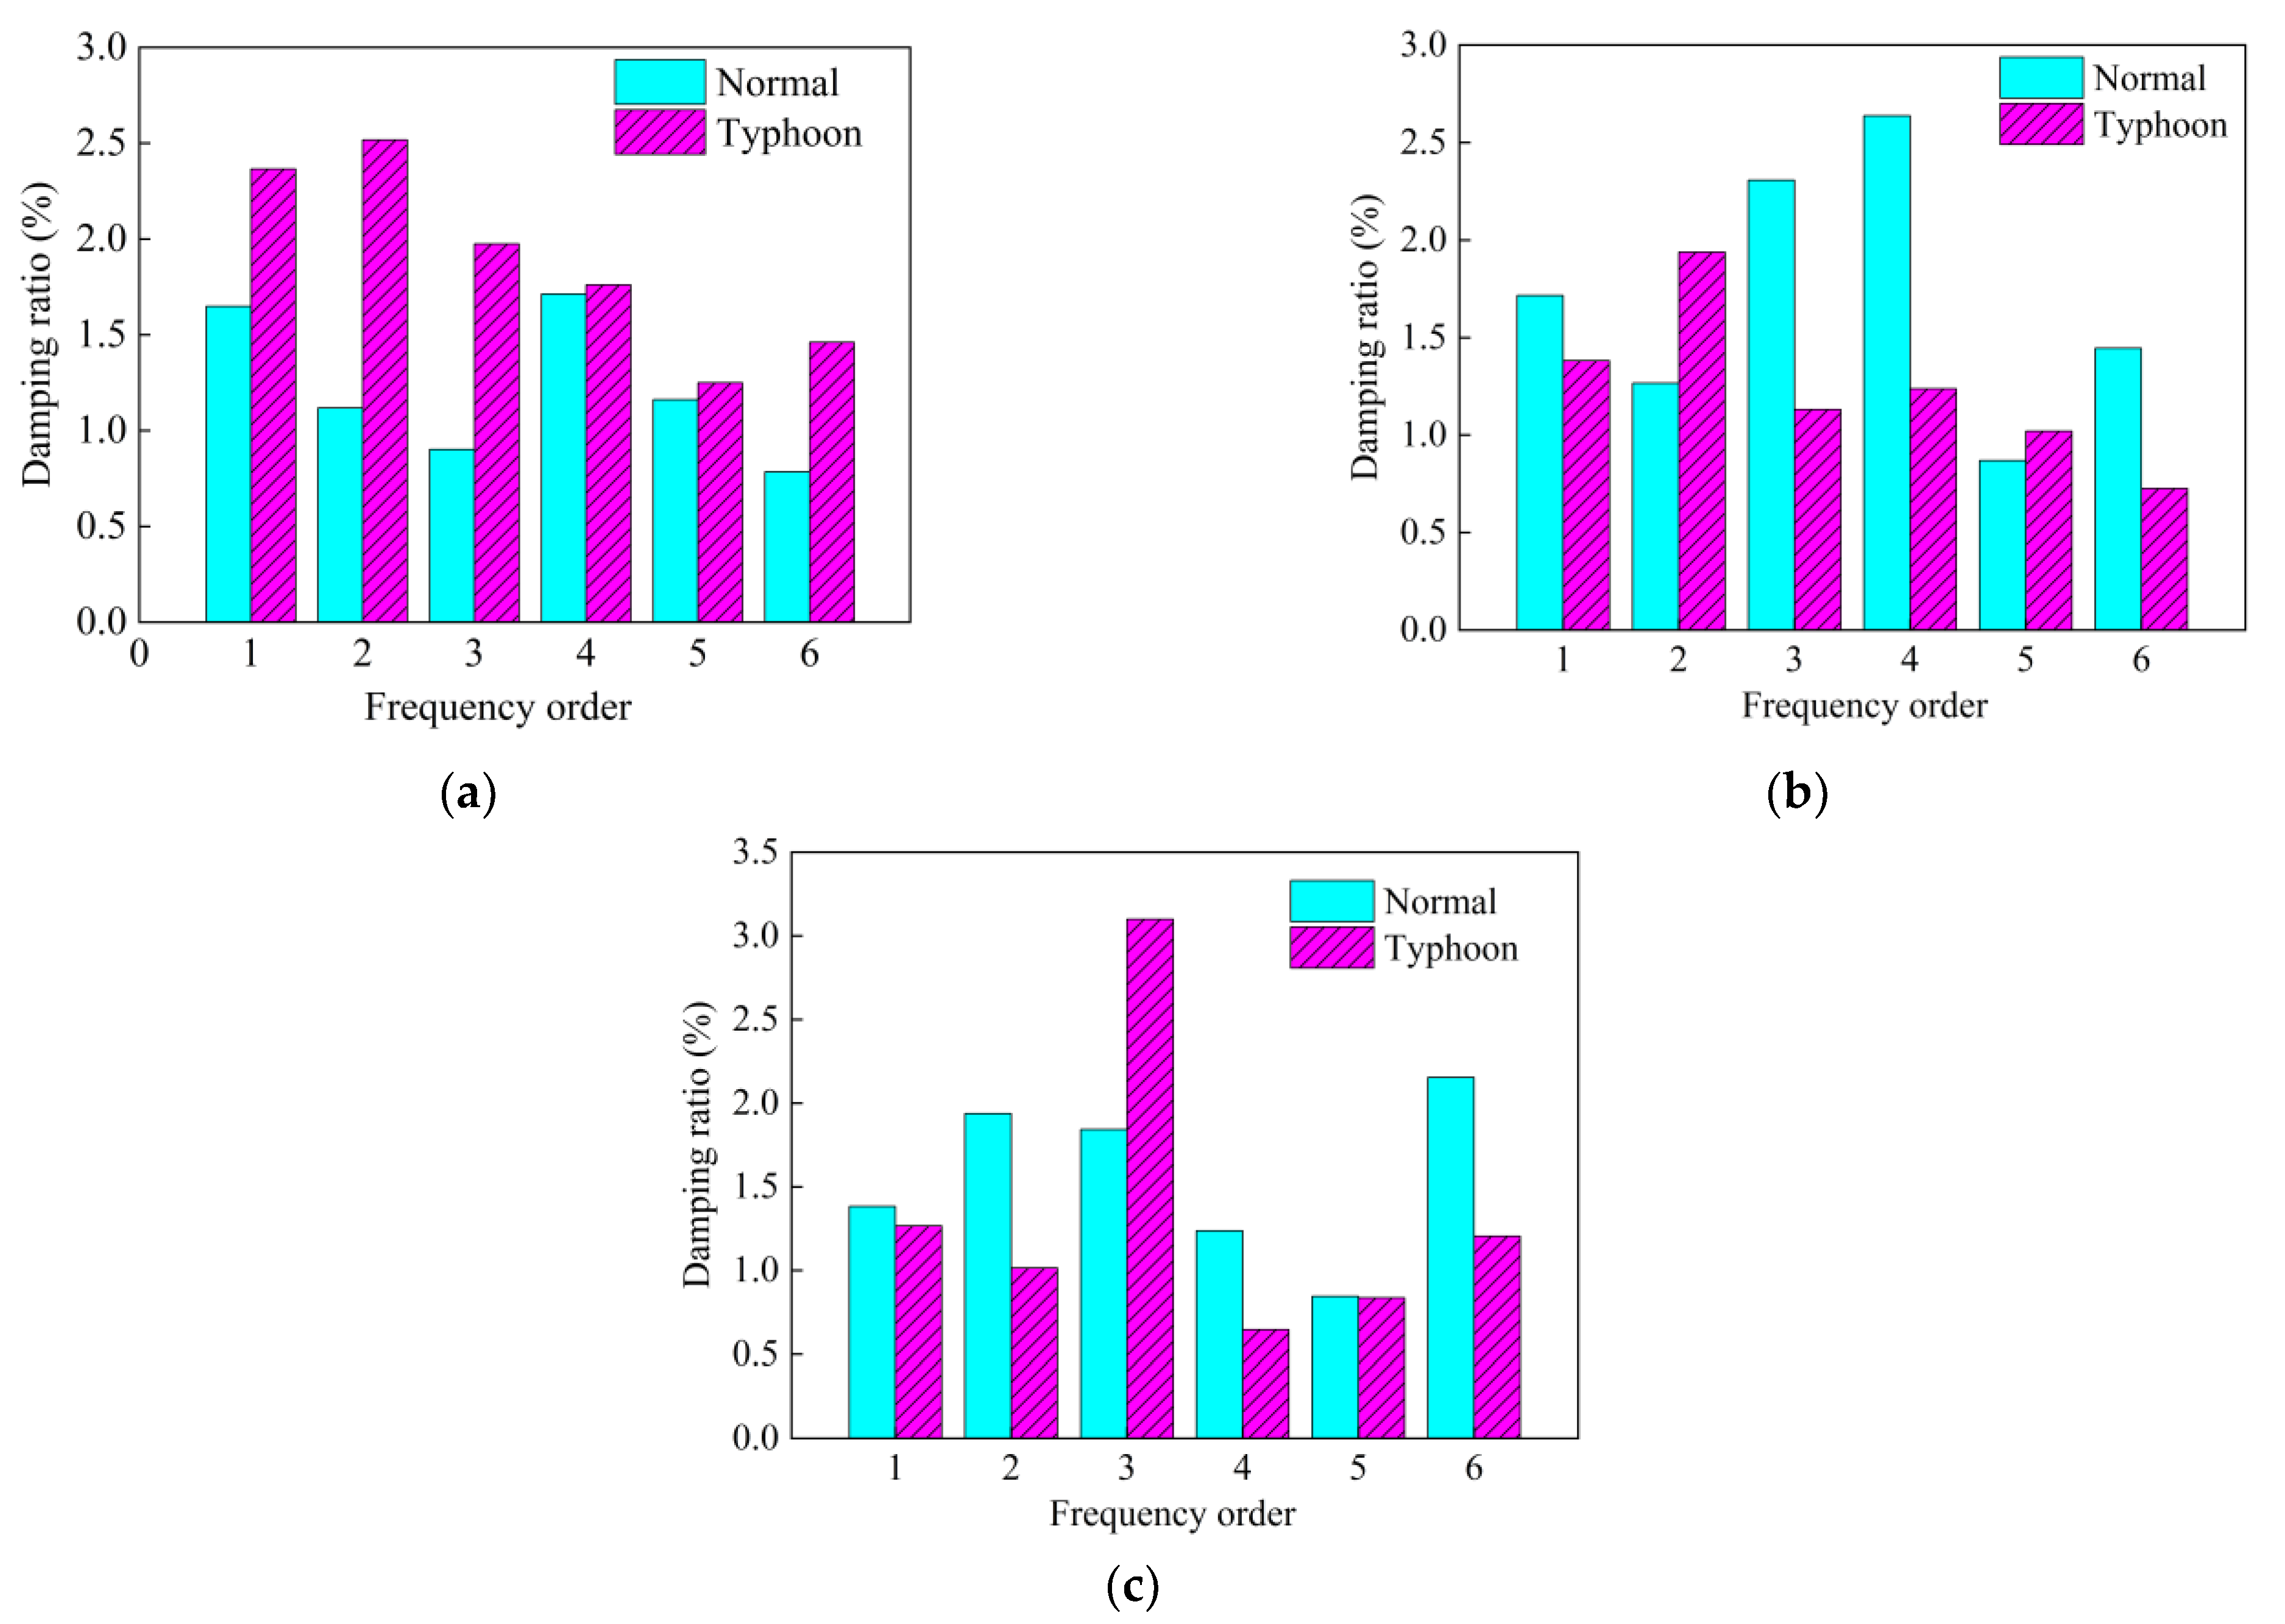
4.3.3. Damping Ratio
5. Conclusions
- The increase of turbulence intensity leads to an obvious reduction of mean, RMS, maximum, and peak-to-peak deformations, within the range of 11.73–62.50%. However, there is a rapid growth in maximum deformations, up to a 16.33% increase. The suction influence of typhoons on the membrane structure should be emphasized in the wind-resistance design. Both mean and RMS deformations exhibit a roughly linear increasing trend varying with the increasing wind velocity.
- The non-Gaussian characteristics of displacement are determined mostly by the turbulence intensity, rather than the wind velocity. The skewness and kurtosis distributed over the membrane surface in typhoons are almost twice those in normal winds, which should be considered in the reliability-based design of membrane structure in typhoons.
- The increasing turbulence intensity results in larger amplitude ratios in higher mode shapes, and a two-fold increase of damping ratios at low-level wind velocity cases. However, there is an obvious reduction of damping ratios at high-level wind velocity in typhoons, which is consistent with the decrease of overall vibration amplitude and reveals the amplitude-dependent characteristics of damping ratios.
Author Contributions
Funding
Institutional Review Board Statement
Informed Consent Statement
Data Availability Statement
Conflicts of Interest
References
- Li, D.; Zheng, Z.L.; Tian, Y.; Sun, J.Y.; He, X.T.; Lu, Y. Stochastic nonlinear vibration and reliability of orthotropic membrane structure under impact load. Thin Wall. Struct. 2017, 119, 247–255. [Google Scholar] [CrossRef]
- Łątka, J.F.; Święciak, M. The observe/reverse pavilion: An example of a form-finding design of temporary, low-cost, and eco-friendly structure. Buildings 2021, 11, 226. [Google Scholar] [CrossRef]
- Shao, M.Y.; Qing, J.J.; Wu, J.M. Bifurcation and chaos of the traveling membrane on oblique supports subjected to external excitation. J. Mech. Sci. Technol. 2020, 34, 4513–4523. [Google Scholar] [CrossRef]
- Yang, Q.S.; Gao, R.; Bai, F.; Li, T.; Tamura, Y. Damage to buildings and structures due to recent devastating wind hazards in East Asia. Nat. Hazards 2018, 92, 1321–1353. [Google Scholar] [CrossRef]
- Carlos, M.G.; Robert, C.; William, A.J. Performance of Physical Structures in Hurricane Katrina and Hurricane Rita: A Reconnaissance Report; National Institute of Standard and Technology: Gaithersburg, MA, USA, 2006. [Google Scholar]
- Naudascher, E.; Rockwell, D. Flow-Induced Vibrations: An Engineering Guide; Dover Publications: New York, NY, USA, 2012. [Google Scholar]
- Paidoussis, M.P. Fluid-Structure Interactions: Slender Structures and Axial Flow; Academic Press: San Diego, CA, USA, 1998. [Google Scholar]
- Yu, Y.L.; Liu, Y.Z. Flapping dynamics of a piezoelectric membrane behind a circular cylinder. J. Fluids Struct. 2015, 55, 347–363. [Google Scholar] [CrossRef]
- Yu, Y.L.; Liu, Y.Z.; Amandolese, X. A review on fluid-induced flag vibrations. Appl. Mech. Rev. 2019, 71, 10801. [Google Scholar] [CrossRef]
- Schwarze, R. Experimental and numerical modeling of fluid flow. Appl. Sci. 2022, 12, 9042. [Google Scholar] [CrossRef]
- Zisis, T.; Vasilopoulos, K.; Sarris, I. Numerical simulation of a fire accident in a longitudinally ventilated railway tunnel and tenability analysis. Appl. Sci. 2022, 12, 5667. [Google Scholar] [CrossRef]
- Pavlidis, C.L.; Palampigik, A.V.; Vasilopoulos, K.; Lekakis, I.C.; Sarris, I.E. Air flow study around isolated cubical building in the city of Athens under various climate conditions. Appl. Sci. 2022, 12, 3410. [Google Scholar] [CrossRef]
- Zaboli, M.; Mousavi Ajarostaghi, S.S.; Saedodin, S.; Saffari Pour, M. Thermal performance enhancement using absorber tube with inner helical axial fins in a parabolic trough solar collector. Appl. Sci. 2021, 11, 7423. [Google Scholar] [CrossRef]
- Bano, T.; Hegner, F.; Heinrich, M.; Schwarze, R. Investigation of fluid-structure interaction induced bending for elastic flaps in a cross flow. Appl. Sci. 2020, 10, 6177. [Google Scholar] [CrossRef]
- Seo, Y.B.; Paramanantham, S.S.; Bak, J.Y.; Yun, B.; Park, W.G. CFD analysis of subcooled flow boiling in 4 × 4 rod bundle. Appl. Sci. 2020, 10, 4559. [Google Scholar] [CrossRef]
- Ciappi, L.; Stebel, M.; Smolka, J.; Cappietti, L.; Manfrida, G. Analytical and computational fluid dynamics models of wells turbines for oscillating water column systems. J. Energy Resour. Technol. 2022, 44, 050903. [Google Scholar] [CrossRef]
- Uematsu, Y.; Uchiyama, K. Aeroelastic behavior of an H.P. shaped suspended roof. In Proceedings of the IASS Annual Symposium: Shells, Membrane and Space Frames, Osaka, Japan, 15–19 September 1986. [Google Scholar]
- Wu, Y.; Yang, Q.S.; Shen, S.Z. Wind tunnel tests on aeroelastic effect of wind-induced vibration of tension structures. Eng. Mech. 2008, 25, 8–15. [Google Scholar]
- Zorrilla, R.; Rossi, R.; Wÿchner, R.; Oñate, E. An embedded Finite Element framework for the resolution of strongly coupled Fluid-Structure Interaction problems. Application to volumetric and membrane-like structures. Comput. Methods Appl. Mech. Eng. 2020, 368, 113179. [Google Scholar] [CrossRef]
- Yang, Q.S.; Wu, Y.; Zhu, W.L. Experimental study on interaction between membrane structures and wind environment. Earthq. Eng. Eng. Vib. 2010, 9, 523–532. [Google Scholar] [CrossRef]
- Daw, D.J.; Davenport, A.G. Aerodynamic damping and stiffness of a semi-circular roof in turbulent wind. J. Wind. Eng. Ind. Aerodyn. 1989, 32, 83–92. [Google Scholar] [CrossRef]
- Colliers, J.; Degroote, J.; Mollaert, M.; Laet, L.D. Mean pressure coefficient distributions over hyperbolic paraboloid roof and canopy structures with different shape parameters in a uniform flow with very small turbulence. Eng. Struct. 2020, 205, 110043. [Google Scholar] [CrossRef]
- Fang, G.S.; Zhao, L.; Cao, S.Y.; Ge, Y.J.; Pang, W.C. A novel analytical model for wind field simulation under typhoon boundary layer considering multi-field correlation and height-dependency. J. Wind Eng. Ind. Aerodyn. 2018, 175, 77–89. [Google Scholar] [CrossRef]
- Li, L.; Zhou, Y.; Wang, H.; Zhou, H.; He, X.; Wu, T. An analytical framework for the investigation of tropical cyclone wind characteristics over different measurement conditions. Appl. Sci. 2019, 9, 5385. [Google Scholar] [CrossRef]
- Fernández-Cabán, P.L.; Masters, F.J. Effects of freestream turbulence on the pressure acting on a low-rise building roof in the separated flow region. Front. Built Environ. 2018, 4, 17. [Google Scholar] [CrossRef]
- Liu, M.; Chen, X.Z.; Yang, Q.S. Characteristics of dynamic pressures on a saddle type roof in various boundary layer flows. J. Wind Eng. Ind. Aerodyn. 2016, 150, 1–14. [Google Scholar] [CrossRef]
- Rizzo, F.; D’Asdia, P.; Lazzari, M.; Procino, L. Wind action evaluation on tension roofs of hyperbolic paraboloid shape. Eng. Struct. 2011, 33, 445–461. [Google Scholar] [CrossRef]
- Liu, C.J.; Pan, R.J.; Deng, X.W.; Xie, H.B.; Liu, J.; Wang, X. Random vibration and structural reliability of composite hyperbolic-parabolic membrane structures under wind load. Thin Wall. Struct. 2022, 180, 109878. [Google Scholar] [CrossRef]
- Rizzo, F.; Kopp, G.A.; Giaccu, G.F. Investigation of wind-induced dynamics of a cable net roof with aeroelastic wind tunnel tests. Eng. Struct. 2021, 229, 111569. [Google Scholar] [CrossRef]
- National Standards Committee. Load Code for the Design of Building Structures. In China National Standard (CNS); National Standards Committee: Beijing, China, 2012. [Google Scholar]
- He, J.Y.; He, Y.C.; Li, Q.S.; Chan, P.W.; Zhang, L.; Yang, H.L.; Li, L. Observational study of wind characteristics, wind speed and turbulence profiles during Super Typhoon Mangkhut. J. Wind Eng. Ind. Aerodyn. 2020, 206, 104362. [Google Scholar] [CrossRef]
- Sharma, R.N.; Richards, P.J. A re-examination of the characteristics of tropical cyclone winds. J. Wind Eng. Ind. Aerodyn. 1999, 83, 21–33. [Google Scholar] [CrossRef]
- Fang, G.S.; Zhao, L.; Chen, X.; Cao, J.X.; Cao, S.Y.; Ge, Y.J. Normal and typhoon wind loadings on a large cooling tower: A comparative study. J. Fluid Struct. 2020, 95, 102938. [Google Scholar] [CrossRef]
- Chen, X.Z. Estimation of extreme value distribution of crosswind response of wind-excited flexible structures based on extrapolation of crossing rate. Eng. Struct. 2014, 60, 177–188. [Google Scholar] [CrossRef]
- Li, B.B.; Au, S.K. An expectation-maximization algorithm for Bayesian operational modal analysis with multiple (possibly close) modes. Mech. Syst. Signal Process. 2019, 132, 490–511. [Google Scholar] [CrossRef]
- Xie, Y.L.; Au, S.K.; Li, B.B. Asymptotic identification uncertainty of well-separated modes in operational modal analysis with multiple setups. Mech. Syst. Signal Process. 2021, 152, 107382. [Google Scholar] [CrossRef]


| Technical Parameter | Value |
|---|---|
| Titer of yarn (dtex) | 1300 |
| Yarn count (warp/weft) (yarn/cm) | 12/12 |
| Weight of base fabric (g/m2) | 360 |
| Total weight (g/m2) | 950 |
| Total thickness (mm) | 0.8 |
| Elastic modulus (warp/weft) (MPa) | 1720/1490 |
| Tensile strength (warp/weft) (N/5 cm) | 4400/4200/5 |
| Tear strength (warp/weft) (N) | 800/700 |
| Attack Angle (°) | Wind Type | Wind Velocity (m/s) | ||
|---|---|---|---|---|
| 11 | 15 | 19 | ||
| 0 | Normal | N-11-0 | N-15-0 | N-19-0 |
| Typhoon | T-11-0 | T-15-0 | T-19-0 | |
| 30 | Normal | N-11-30 | N-15-30 | N-19-30 |
| Typhoon | T-11-30 | T-15-30 | T-19-30 | |
| 60 | Normal | N-11-60 | N-15-60 | N-19-60 |
| Typhoon | T-11-60 | T-15-60 | T-19-60 | |
| 90 | Normal | N-11-90 | N-15-90 | N-19-90 |
| Typhoon | T-11-90 | T-15-90 | T-19-90 | |
| 120 | Normal | N-11-120 | N-15-120 | N-19-120 |
| Typhoon | T-11-120 | T-15-120 | T-19-120 | |
| 150 | Normal | N-11-150 | N-15-150 | N-19-150 |
| Typhoon | T-11-150 | T-15-150 | T-19-150 | |
| 180 | Normal | N-11-180 | N-15-180 | N-19-180 |
| Typhoon | T-11-180 | T-15-180 | T-19-180 | |
| No. | Normal Wind | Typhoon |
|---|---|---|
| 1 | 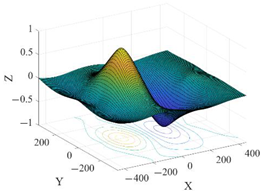 f1 = 38.31 | 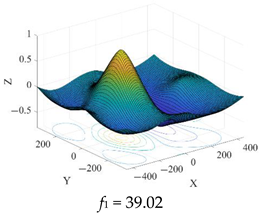 f1 = 39.02 |
| 2 |  f2 = 43.02 | 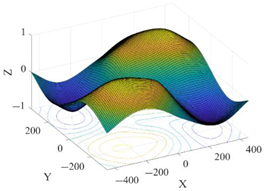 f2 = 43.06 |
| 3 |  f3 = 48.51 | 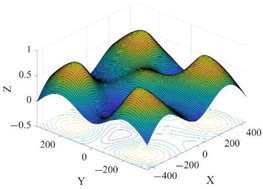 f3 = 49.49 |
| 4 | 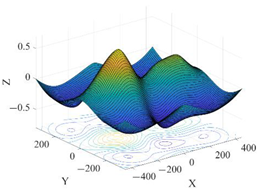 f4 = 54.31 |  f4 = 55.75 |
| 5 | 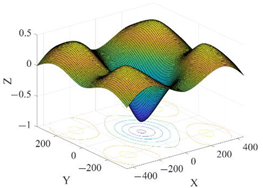 f5 = 61.38 |  f5 = 62.01 |
| 6 |  f6 = 65.50 |  f6 = 66.41 |
Publisher’s Note: MDPI stays neutral with regard to jurisdictional claims in published maps and institutional affiliations. |
© 2022 by the authors. Licensee MDPI, Basel, Switzerland. This article is an open access article distributed under the terms and conditions of the Creative Commons Attribution (CC BY) license (https://creativecommons.org/licenses/by/4.0/).
Share and Cite
Li, D.; Zhang, Z.; Zhang, C.; Zhang, Z.; Yang, X. Aeroelastic Experimental Investigation of Hyperbolic Paraboloid Membrane Structures in Normal and Typhoon Winds. Sustainability 2022, 14, 12207. https://doi.org/10.3390/su141912207
Li D, Zhang Z, Zhang C, Zhang Z, Yang X. Aeroelastic Experimental Investigation of Hyperbolic Paraboloid Membrane Structures in Normal and Typhoon Winds. Sustainability. 2022; 14(19):12207. https://doi.org/10.3390/su141912207
Chicago/Turabian StyleLi, Dong, Zhou Zhang, Chao Zhang, Zhengyu Zhang, and Xiaoqiang Yang. 2022. "Aeroelastic Experimental Investigation of Hyperbolic Paraboloid Membrane Structures in Normal and Typhoon Winds" Sustainability 14, no. 19: 12207. https://doi.org/10.3390/su141912207