Article

Disaster Prevention and Mitigation Index Assessment of Green Buildings Based on the Fuzzy Analytic Hierarchy Process

1
School of Civil and Hydraulic Engineering, Ningxia University, Yinchuan 750021, China
2
School of Architecture and Design, Southwest Jiaotong University, Chengdu 611756, China
*
Author to whom correspondence should be addressed.
Sustainability 2022, 14(19), 12284; https://doi.org/10.3390/su141912284
Submission received: 22 August 2022 / Revised: 23 September 2022 / Accepted: 23 September 2022 / Published: 27 September 2022
(This article belongs to the Section Green Building)

Abstract

:
Assessment systems for green buildings around the world have been developed over many years, but there is a lack of assessment elements for the disaster prevention and mitigation (DPM) capabilities of green buildings in many indicators. DPM indexes based on the four main aspects of structural safety, DPM design, facility settings, and resource utilization are proposed here with consideration to the complex natural disasters that occur in China (fires, earthquakes, floods, etc.) and relevant codes. Then, an assessment system for the DPM indexes of green buildings is established by the fuzzy analytic hierarchy process (FAHP) in order to evaluate the DPM ability of green buildings and to quantify the impact of different indexes on the DPM ability of green buildings; this system is also used to evaluate and compare DPM capability suggestions, taking two green buildings in South and North China as examples. The results show that the DPM capacities of the two green buildings were evaluated as good, but that the scores for the site planning and water-saving systems of the green building in South China were significantly lower—meaning that measures such as optimizing drainage systems, managing stormwater runoff, permeable paving, rainwater gardens, and installing rainwater harvesting equipment should be implemented. Then, the theory of the utilization rate of DPM conversion is put forward, providing a reference for the future development of green building DPM index systems.

1. Introduction

Since the onset of rapid industrialization at the beginning of the 20th century, ever-increasing carbon and other greenhouse gas emissions have led to an increase in the global average temperature of more than 1 °C and have resulted in significant environmental deterioration. More than one third of global greenhouse gas emissions and energy consumption are related to buildings [1]. The geographic distribution of global CO2 emissions is shown in Figure 1. The rapid rise in environmental awareness worldwide has compelled architects and engineers to increasingly focus on buildings with minimal or no environmental impact. Many countries have successively implemented and continue to revise “green building” standards. However, the assessment of green buildings involves many complex elements, influenced by the culture, geography, and climate of different countries. In 1990, the world’s first building assessment system—the Building Research Establishment Environmental Assessment Method (BREEAM)—was developed by the British Architecture Association [2]. More recently, the fourth version of Leadership in Energy and Environmental Design (LEED)—the most widely used green building assessment system worldwide—optimized the standard system for different stages of construction and different green building types. Furthermore, it divided indicators into eight categories: site selection and transportation, site sustainability, water efficiency, energy and atmosphere, materials and resources, indoor environmental quality, innovation, and regional priority [3]. In China, the current index system scores green building projects according to six categories: safety and durability, health and comfort, convenience, resource conservation, livability, and improvement and innovation [4]. Chinese government departments have also proposed that the proportion of new green buildings in cities and towns should reach 70% in 2022 [5] and that this proportion should gradually increase. At the same time, there are continuous green building reconstruction projects being carried out in China. Therefore, there are a large number of green buildings in China, which need to be focused on by scholars.
In recent years, the frequency of severe natural disasters such as earthquakes, fires, hurricanes, and tsunamis has increased worldwide. For example, in 2021, a total of 107 million people were affected by various natural disasters; 867 people died and disappeared due to disasters, 5.738 million people were resettled, 162,000 buildings were destroyed—with 1.981 million damaged to varying degrees—and the direct economic losses were 334.02 billion yuan [6]. Moreover, human wellbeing is also threatened by new disasters, such as the COVID-19 pandemic.
Facing a large number of green buildings and severe disaster situations, it is necessary to study the disaster prevention and mitigation (DPM) capability of green buildings. As a fundamental element of cities, buildings should arguably play a key role in mitigating and adapting to unexpected disasters and minimizing risks. At present, the assessment of disaster response capability is based on traditional descriptive analysis. However, little research has been conducted on the assessment of building disaster risk reduction capacity and there is no classification and assessment system for the DPM capacity of green buildings. Therefore, this study aimed to develop a DPM index system to evaluate green buildings and thus give direction to the improvement of the DPM capacity of green building projects. The DPM index assessment system was based on the FAHP and was applied to two green buildings in South and North China, respectively.
This paper is structured as follows: First, an overview of green building design in different climatic areas in South and North China is provided. Second, the DPM scores of the two green building examples are calculated and graded according to the DPM index. Third, in light of the assessment results, suggestions are made to improve the DPM capacity of green buildings. Finally, in lieu of calculating the economic cost of building conversion to meet DPM index standards, this study proposed a theoretical utilization rate of DPM conversion and discusses its feasibility and potential thereof to promote the construction of green buildings and reduce project costs.

2. Green Building and DPM Assessment Systems

2.1. Existing Green Building Assessment Systems

Recent studies on green building assessment have documented the widespread use of the analytic hierarchy process (AHP), analytic network process (ANP), decision-making trial and evaluation laboratory (DEMATEL) method, best worst method (BWM), technique for order preference by similarity to an ideal solution (TOPSIS), and other multi-criteria decision-making methods in different fields such as green building assessment, green building material (GBM) assessment, green building management, and sustainable construction material selection [7,8,9,10].
For the purposes of GBM assessment, Khoshnava et al. [11] adopted the mixed multi-criteria decision-making method to solve conflicts between multiple incompatible GBM standards and used fuzzy-ANP to adjust and sort GBM standards based on the three Ps of sustainability: people, planet, and profit. In terms of green building operation and maintenance, Van Basten [12] used a combination of qualitative and quantitative methods and life cycle assessments to evaluate the effects of functional optimization on the operation and maintenance of existing green buildings to achieve maximum efficiency and effectiveness throughout the building life cycle.
Many scholars have attempted to combine a variety of methods to develop a new hybrid model. Mathiyazhagan et al. [13] proposed a three-stage method: after the standard materials used in the Indian construction industry were determined from a literature review, the material selection standards were sorted using the BWM, and the identified materials were sorted using the fuzzy-TOPSIS method. Shao et al. [14] built an influential network relationship map (INRM) using a hybrid model by integrating DEMATEL and ANP (called DANP) and assigned weights to assessment indexes. Their results revealed environment, materials, and intelligent facilities as the three key criteria of green building assessments. Liu et al. [15] proposed a new hybrid model including the establishment of a green building assessment index and the use of the DEMATEL method to determine the relationship between criteria, as well as a new ANP model based on the BWM to determine the weight of those criteria.
Some researchers have also investigated the assessment of green buildings from an ecological perspective. Zang and Shao [16] designed a green building ecological index and developed a green building ecological footprint reduction model using the ecological footprint analysis method to accurately determine the ecological value of green buildings. Xu Zhang and Shu-lin Yi [17] used a multi-level gray evaluation method, qualitative, and quantitative combination method to establish a green building evaluation from an ecological perspective. Hui Li et al. [18] made a detailed analysis of the four dimensions of influencing factors and the composition index—namely, financial return, resource consumption, environment load, and external benefit—and established a comprehensive assessment on the green value of ecological energy-saving buildings.
In terms of research on the development of green building assessments, Tai-Yi Liu et al. [19] studied and summarized different key indicators and evaluation items, making comparisons between some major assessment systems for both green building and green civil infrastructure projects and identifying the content that was not highlighted in green building assessments. Yi Gao et al. [20] collected statistical data on China’s green building label projects from 2008 to 2018, studied the development status of China’s green buildings in three aspects—equilibrium, spatial distribution characteristics, and spatial correlation—and analyzed the spatial–temporal evolution and driving factors of green building development in China using geological detectors.

2.2. Existing Green Building DPM Assessment Systems

Many scholars have developed promising green building DPM assessment index systems by adopting methods [21,22,23,24] such as AHP and Delphi; fuzzy theory and gray theory; logistic, multi-layer linkage; and projection pursuit models. Similarly, many scholars have studied building disaster management systems. Using AHP analysis, Cho and Sue [25] developed a quantitative assessment index, evaluated the weight of different criteria, and established an efficient management system for protecting cultural heritage. Bi et al. [26] proposed an index for evaluating the comprehensive disaster prevention abilities of buildings, which measured three main criteria—structure, facilities, and personnel—based on the appraisal standards of civil and hazardous buildings. They also adopted the fuzzy comprehensive assessment method to address the difficulty of directly quantifying complex assessment criteria.
At a broader scale, many scholars have developed DPM assessment systems for cities. Gilbuena et al. [27] used the fuzzy multi-attribute decision-making method to quantitatively evaluate the flood disaster risk reduction management system of Damanila, Philippines. The results indicated that the optimization scheme should mainly focus on prevention, preparation, response, and disaster recovery. Wang et al. [28] developed a comprehensive assessment index based on three criteria—risk, vulnerability, and adaptive capacity—and evaluated urban DPM capacity using a practical probability method. In terms of fire, Yan et al. [29] developed a fire risk assessment index and assessment model for green buildings based on fuzzy-AHP.

2.3. Existing Resilience Assessment Systems

Resilience is an important theory for dealing with different disasters and represents the capability of communities and urban networked systems to recover from natural disasters [30]. Resilience was first defined by Holling [31] as “a measure of the persistence of systems and of their ability to absorb change and disturbance and still maintain the same relationships between populations or state variables”. In research on building DPM and risk management, many scholars have begun to focus on technical research of resilience assessments in order to minimize the adverse effects of disasters [32,33]. At the same time, many countries such as Australia have conducted research on disaster resilience strategies to build the resilience of their own nation to disasters [34,35,36].
Yuying Yang et al. [37] proposed a comprehensive disaster resilience evaluation index system and applied it to the disaster resilience assessments of 17 counties in the Three Gorges Reservoir Area, from which a final ranking was obtained. Saud Ali Alshehri et al. [38] used the consensus-based Delphi technique to propose a ‘community resilience to disaster’ framework which could measure community resilience to disasters in Saudi Arabia and beyond.
In terms of urban safety management, Qingjun Guo et al. [39] used the Delphi method to determine resilience indices and constructed the ANP extension cloud synthesis method, combining the cloud and matter–element extension theories. This study revealed that the resilience level was consistent with actual engineering project assessments at all stations. Sarah Irwin et al. [40] proposed the concept of ResilSIM: a decision support tool that rapidly estimates the resilience of an urban system to the consequences of natural disasters that was designed to assist decisionmakers in selecting the best options for integrating adaptive capacity into their communities to protect against the negative impacts of a hazard and was demonstrated for use in London.

2.4. Developing a Green Building DPM Index System

Based on existing green building, disaster assessment, and resilience assessment systems proposed by different scholars, current standards, and discussions with experts, a green building DPM index system has been developed here. It is proposed that index scores should be evaluated by combining AHP and fuzzy mathematics theory; this method is comprised of both subjective and objective analyses [41,42], but experiences difficulties in characterizing the indicators in the assessment model. However, this method is still used in most of the current Chinese standards, thus serving as a logical basis for establishing a new index while allowing potentially more effective methods to be selected for future optimization of the system. Figure 2 outlines the process of developing the DPM index and the subsequent scoring and assessment of green buildings.

3. Development of a DPM Index Assessment System

3.1. DPM Assessment Index

In order to evaluate the DPM capacity of green buildings, it is necessary to determine all the key points of disaster prevention and resilience for green buildings. This paper refers to a large number of standards, such as the Assessment standard for green building, BREEAM, LEED, Code for Seismic Design of Buildings [43], Code for fire protection design of buildings [44], National Strategy for Disaster Resilience, etc., and takes into account the types of common natural disasters that occur in China, including fires, earthquake, floods, etc. Then, the 13 indexes were divided into four criteria: structural safety, DPM design, facilities setting, and resource utilization. These criteria are listed and further described in Table 1.

3.2. Fuzzy-AHP Assessment Model

Fuzzy-AHP entails determining the index set and comment set, calculating the index weight, establishing a fuzzy relation matrix, and comprehensive fuzzy calculations. The index weight represents the importance and relative relationship between various green building DPM indexes. The fuzzy relation matrix describes the state of each index. The index weight and the fuzzy relation matrix were combined to form the fuzzy-AHP model.

3.2.1. Determining Index Weight

When constructing the judgment matrix, the Saaty method [45] was used to measure the relative importance of each factor on a scale of 1–5 [46], as defined in Table 2. The symbol Uij represents the importance of factor i compared to factor j. According to a criterion’s grade, the judgment matrix A is given by Equation (1), where n is the number of criteria:
A = a 11 a 12 a 1 n a 21 a 2 n a n 1 a n 2 a n n ,   i , j = 1 , 2 , 3 , , n ( n 5 ) ; a i i = 1 , a j i = 1 / a i j .
Based on the Saaty scale, 30 experts were given questionnaires and 30 sets of data were obtained, but the availability of the data needed to be further determined. Due to differences in expertise among green building experts participating in the survey, 26 valid sets of data were obtained by removing sample data that differed from the average score by two or more. Then, the indexes of the two layers were normalized based on the average score of each index according to Equation (2):
P ¯ i = i = 1 n a i j n , i ,   j = 1 , 2 , 3 , , n ; P i = P ¯ i i = 1 n P ¯ i , i = 1 , 2 , 3 , , n .
The weight vector matrix of the system was subsequently calculated using Equation (3):
P A = P B P C P D P E = P B 1 P B 2 P B 3 0 P C 1 P C 2 P C 3 0 P D 1 P D 2 P D 3 P D 4 P E 1 P E 2 P E 3 0
The final index weight results are shown in Table 3.

3.2.2. Consistency Test

After the indicator data was obtained, the consistency of the results needed to be tested [47,48] to ensure the coordination of the data and to avoid logical paradoxes such as: indicator A is more important than indicator B, indicator B is more important than indicator C, and indicator C is more important than indicator A. The calculation equations for the CI (consistency index) and CR (consistency ratio) are shown as Equations (4) and (5):
C I = λ max n n 1
C R = C I R I
where n is the unique non-zero eigenvalue of the nth order consistent matrix, λ max is the maximum eigenvalue of the judgment matrix A = a i j m × n , and RI is the known average consistency index—whose value is shown in Table 4.
The CR is more difficult to control when the number of indexes is larger, and the smaller the CR, the higher the consistency; it is completely consistent when CR = 0, but it is often inconsistent in practice. The degree of consistency for matrices is acceptable when C R 0.1 . After calculation, the CR of the matrix was 0.0039, which passes the consistency test and indicates a high consistency.

3.2.3. Assessment Matrix of the Factor Set

Using the semantic difference method, the factor set of the DPM index assessment system was established as follows: V = (1, 2, 3, 4, 5, 6, 7, 8, 9, 10). The scores were based on the rating materials of the green building case studies, and the experts responsible for the green building assessment were scored using a questionnaire. The assessment matrix R of the factor set composed of m factors is expressed by Equation (6):
R = r 11 r 12 r 1 n r 21 r 2 n r m 1 r m 2 r m n

3.2.4. Comprehensive Fuzzy Calculation

The comprehensive fuzzy calculation is given by Equation (7), in which B represents the comprehensive assessment vector matrix, P represents the specific weight vector matrix of each factor, and R represents the vector matrix of each factor:
B = P · R

3.2.5. Scoring Standard

The final score of a given DPM index was obtained by multiplying its scoring weight by the score of the experts responsible for the green building case studies. The DPM capacity of the green buildings could then be classified as qualifying, good, or excellent based on a score of over 4, 6, or 8, respectively.

4. Green Building DPM Assessment Case Studies

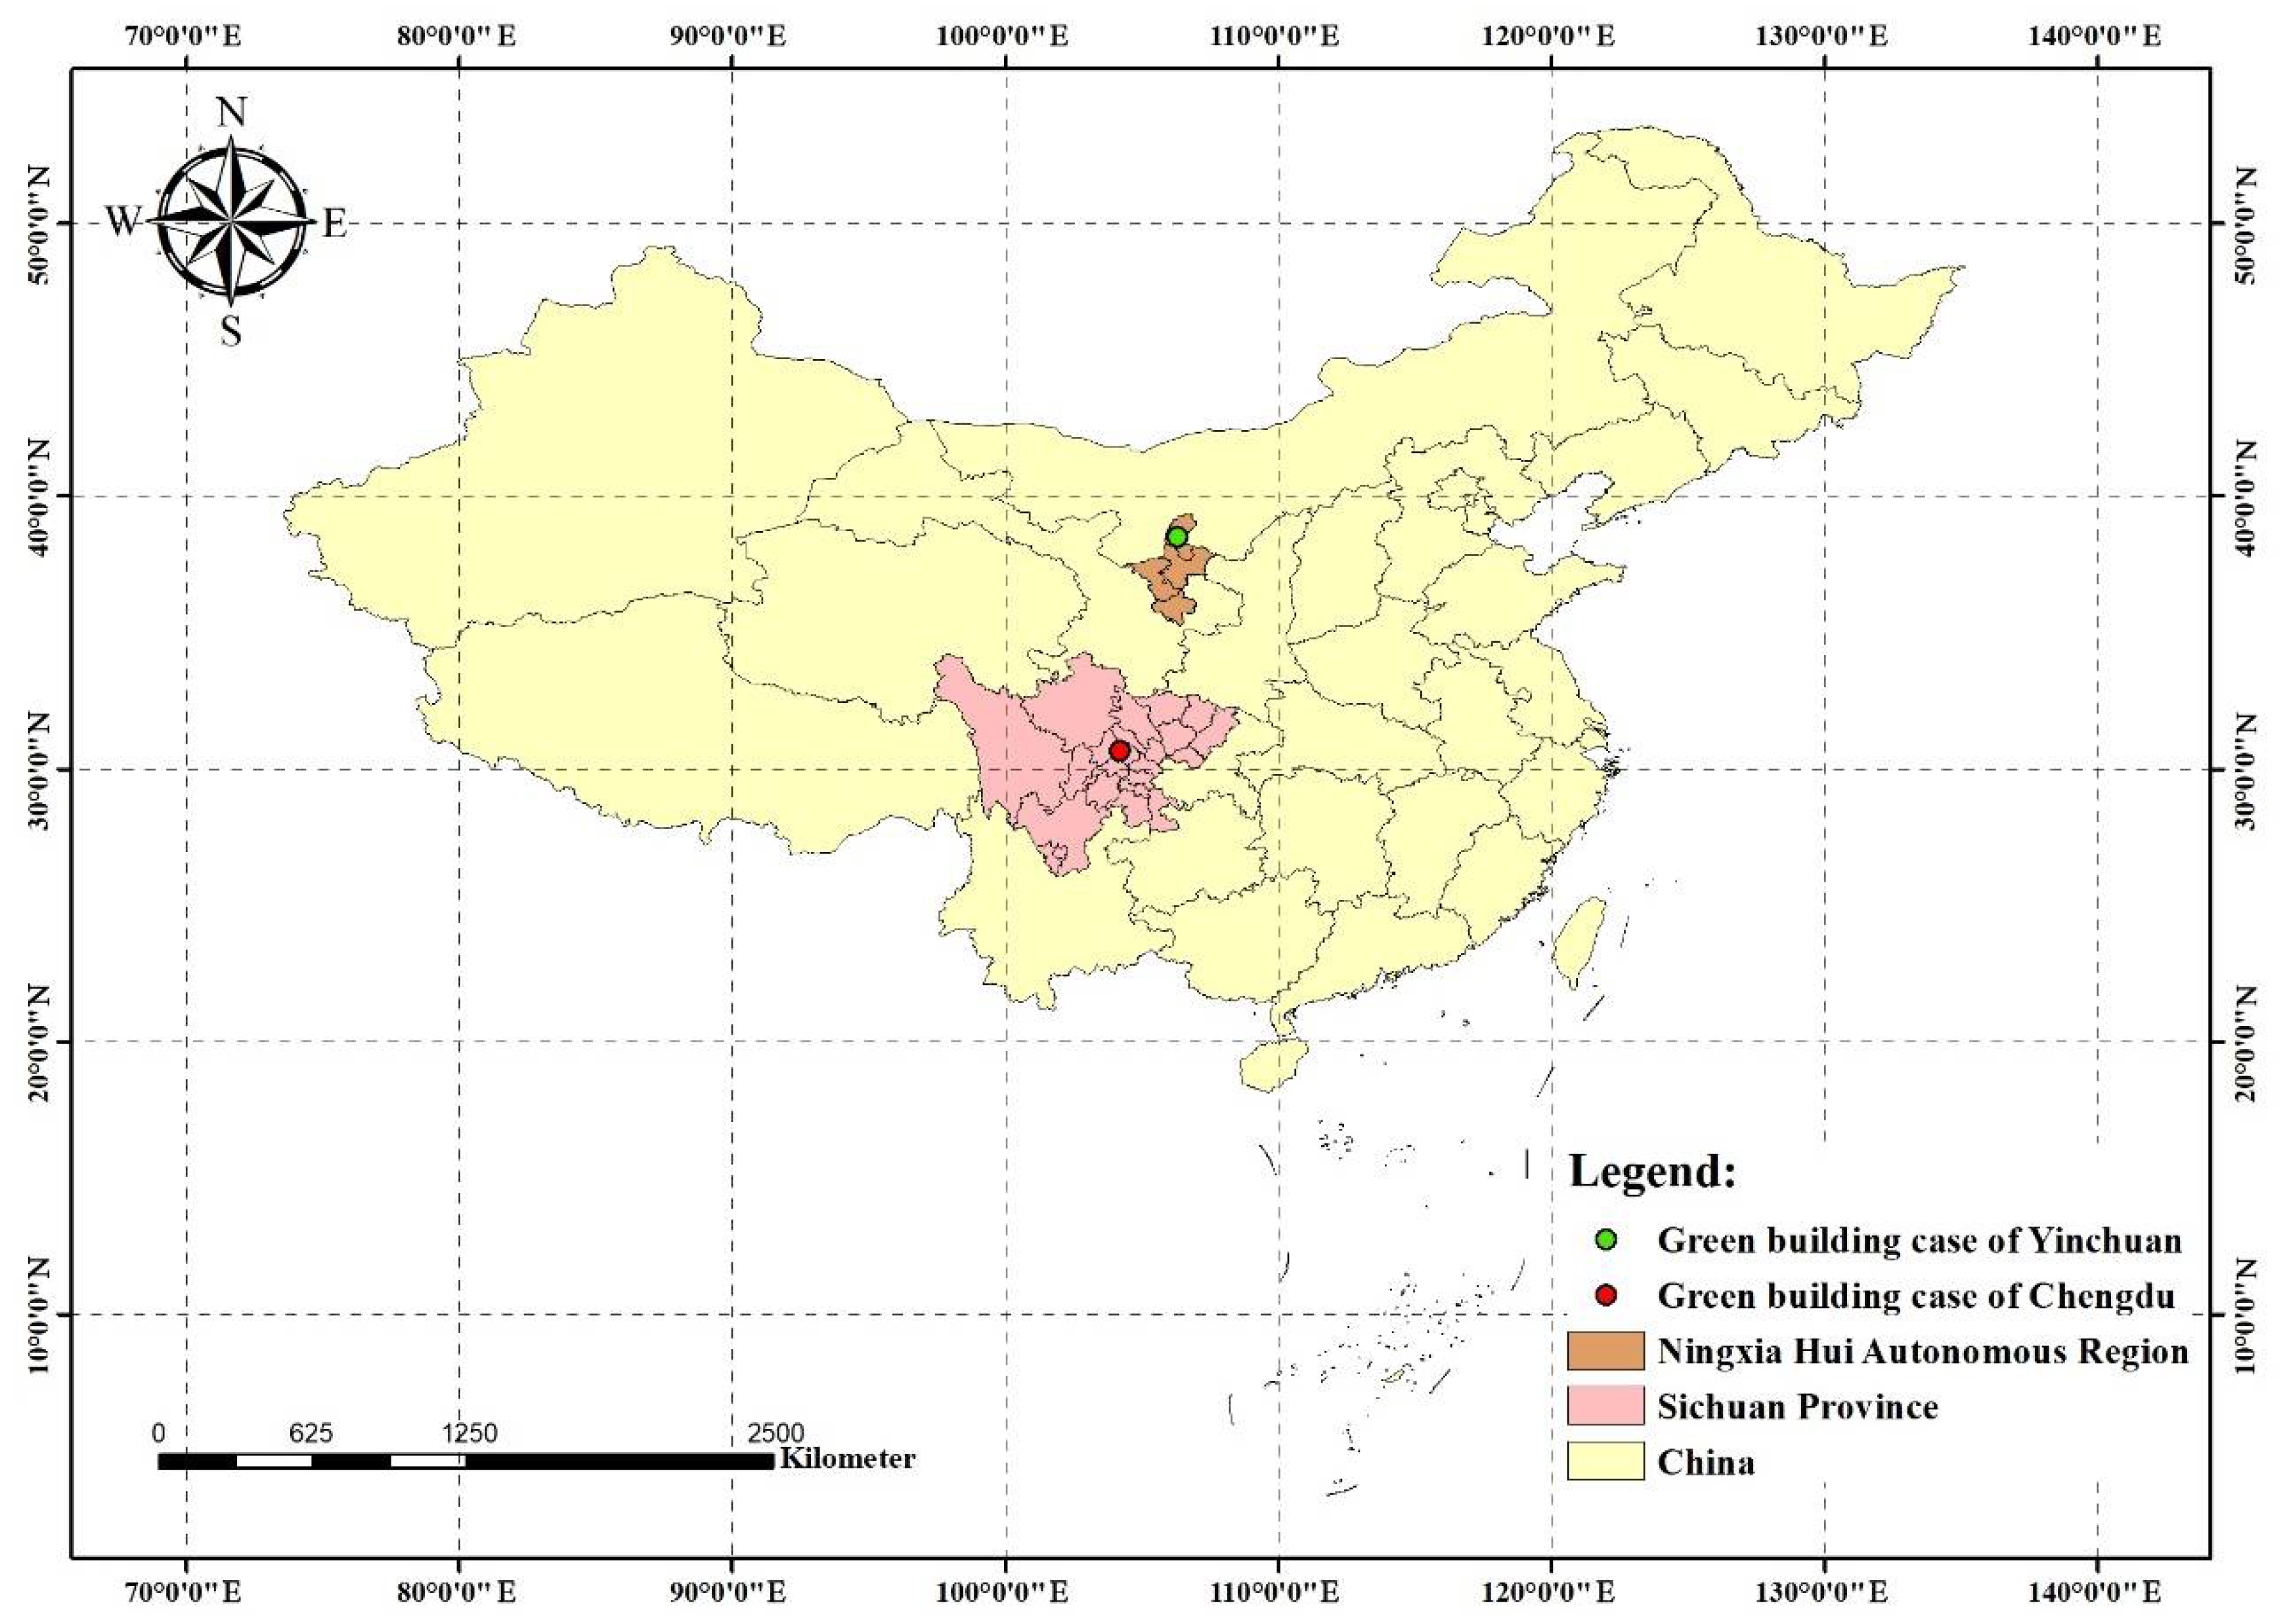
4.1. Analysis of Regional Climate and Geography

Current Chinese green building assessment criteria do not differentiate between regions, but there are clear differences in the impact of climate on buildings between the north and the south, which has led to the need for most regions to develop appropriate local standards based on climate and geography [49,50,51]. Thus, two different green building samples in South and North China were assessed to verify the applicability of the DPM assessment system, and their geographic locations are shown in Figure 3. The Ningxia Hui Autonomous Region and Sichuan Province represent the typical climates of South and North China, respectively, and were selected as case study areas. The climates of the cities in the Ningxia Hui Autonomous Region are summarized in Table 5. These five cities fall within a temperate continental climate, characterized by low temperatures, low rainfall and snow, high evaporation rates, low humidity, and high wind speeds. The climates of cities in Sichuan Province are summarized in Table 6. In contrast to the Ningxia Hui Autonomous Region, the climate in Sichuan Province varies more significantly between cities, with most located in a subtropical monsoon climate and some in a plateau or mountainous climate. The primary characteristics of the region are high temperatures, high rainfall, high humidity, and low wind speeds.
Comparing the five cities in the Ningxia Hui Autonomous Region with the 21 cities in Sichuan Province, there are clear climatic differences between North and South China. The main differences lie in the annual average precipitation, temperature, and relative humidity. The annual average precipitation, temperature, and relative humidity of the southern cities were approximately five-times, 7 °C, and 25% higher than that of the northern cities, respectively. This has significant implications for green building design and construction. For example, because of higher annual precipitation, more water seepage sites such as rainwater gardens and permeable pavements must be included in building designs in Sichuan than in Ningxia. Similarly, because of higher air humidity, buildings in Sichuan require components and structural materials with higher corrosion resistance than those in Ningxia. The seismic fortification intensity in Ningxia was eight, compared to seven in Sichuan—thus necessitating different structural designs to meet respective regional standards and minimize the damage caused by earthquakes. Therefore, the evaluation of green buildings using the DPM index system must be informed by the climatic and geographical context.

4.2. Final Risk Summary

In the case of a green building in Yinchuan City, Ningxia, the geological survey reported that the project was situated on a medium-liquefaction site, which resulted in weak earthquake resistance. However, because of the deep foundations of the project, the liquefied soil layers were excavated, and no other anti-liquefaction measures were required. There were no shallowly buried new active and seismic faults to avoid, and the site was leveled without slope failures or mass movement events such as landslides. There was one secondary gas station located in each of the southwest and northern portions of the site, the nearest of which was 30.33 m from the building.
The score assigned by the green building specialists to each building assessed in Ningxia and Sichuan using the DPM index system is represented by the factor set score r. The scores of some indexes refer to the scores of technical criteria in the review stage of the green building design. The other indexes were scored according to design criteria. The scores of each index were obtained by adding weights, according to Equation (5). The assessment results obtained in Ningxia and Sichuan are listed in Table 7 and Table 8, respectively.

4.3. Results and Discussion

The assessment vectors of each factor in the matrix were added together after obtaining the comprehensive assessment vector matrix. The resultant DPM index score of the green buildings in Yinchuan and Chengdu were 6.7465 and 6.2594, respectively. These two scores demonstrated that different indexes result in different DPM capacities of green buildings. In the case of the green building grading in Chengdu, the heights of the surrounding multi-story, high-rise residential buildings did not exceed 60 m. The site has a simple geological structure, stable strata, geological conditions favorable for construction, and is not affected by earthquakes. The most significant difference is that the scores of the site planning and water-saving systems of the green building in Chengdu was significantly lower than those in Yinchuan. However, as Chengdu is located in an area with high rainfall, its green building drainage system was not as effective as that of the green buildings in Yinchuan, where rainfall is low. Compared with non-green buildings, green buildings in Chengdu have no clear advantages when flooding occurs. Therefore, measures such as optimizing drainage systems, managing stormwater runoff, permeable paving, rainwater gardens, and installing rainwater harvesting equipment should be implemented.
The DPM index assessment system for green buildings developed in this study faces the same shortcoming as other green building assessment standards: a lack of consideration of economic costs. This problem is unavoidable during the life cycle of a project from design to construction. To address this issue, a new theoretical utilization rate of DPM conversion was proposed based on the DPM index system. This theory was predicated on the fact that each DPM index has a different weight. This influences the overall index system score and the economic costs of altering building design and construction to meet the DPM requirements associated therewith. Therefore, the ratio of each DPM index score to the economic cost of meeting the associated requirements was defined as the utilization rate of DPM conversion.
The significance of this theory lies in the fact that after calculating the utilization rate of DPM conversion of each index, higher utilization rates can be prioritized. Thus, green building DPM capacity can be improved at a relatively low cost. However, the development and application of this theory require significant future research.

5. Conclusions

(1)
This study shows the diversity of assessment considerations and provides a theoretical basis for the development of existing green building assessment standards in safety assessments. After considering natural disasters such as fires, earthquakes, and floods, and combining anti-epidemic and facility conditions, the DPM capacity of green buildings was evaluated from the four aspects of structural safety, DPM design, facility settings, and resource utilization, and the weight of the indexes were determined by an expert scoring method and fuzzy mathematics theory. Among them, the index of seismic design and fire protection design had the most significant impact on the DPM capacity of green buildings.
(2)
The assessment results show that the DPM capacities of the two green buildings were evaluated as good, but the scores of the site planning and water-saving systems of the green building in South China were significantly low. After analyzing the regional climate and geography of the two places, new measures should be implemented in this green building in Southern China—such as optimizing its drainage systems, managing stormwater runoff, permeable paving, rainwater gardens, and installing rainwater harvesting equipment.
(3)
In view of the problems of the existing green building assessment standards that do not consider climate and geography, this paper evaluated two green buildings in the north and south of China according to their differences in climate and geography, verified the feasibility of the assessment system, and put forward improvement measures. However, the criteria of evaluation indexes should be changed according to different climates and geographies, which should be studied more systematically in the future.
(4)
When establishing the DPM indexes and analyzing their weights, this study found that the DPM index assessment system faced the same shortcoming as other green building assessment standards: a lack of consideration of economic costs. As such, a theoretical utilization rate of DPM conversion based on the ratio of a given DPM index score to the economic cost of meeting the associated green building requirements was proposed. The utilization rate of DPM conversion has the potential to tangibly reduce the economic costs of green buildings and requires further study.

Author Contributions

Conceptualization, S.S. and J.C.; Methodology, S.S.; Software, S.S. and X.Y.; Validation, S.S. and J.C.; Formal Analysis, S.S.; Investigation, X.Y.; Resources, X.Y.; Data Curation, S.S. and X.Y.; Writing—Original Draft Preparation, S.S.; Writing—Review and Editing, S.S. and J.C.; Visualization, S.S.; Supervision, J.C.; Project Administration, J.C.; Funding Acquisition, J.C. All authors have read and agreed to the published version of the manuscript.

Funding

This work was supported by the First-class discipline construction (water conservancy engineering discipline) in the colleges and universities of Ningxia, China (grant number NXYLXK2021A03).

Data Availability Statement

All data generated or analysed during this study are included in this published article.

Conflicts of Interest

The authors declare that they have no competing interests.

References

  1. Shad, R.; Khorrami, M.; Ghaemi, M. Developing an Iranian green building assessment tool using decision making methods and geographical information system: Case study in Mashhad city. Renew. Sustain. Energy Rev. 2017, 67, 324–340. [Google Scholar] [CrossRef]
  2. BRE. BREEAM New Construction: Non-Domestic Buildings (Technical Manual SD5073–2.0:2011); Building Research Establishment Ltd.: Watford, UK, 2011. [Google Scholar]
  3. Green Building Council. LEED v4 BD+C; USGBC: Washington, DC, USA, 2016. [Google Scholar]
  4. National Standard of the People’s Republic of China. GB/T 50378-2019; Assessment Standard for Green Building; China Architecture & Building Press: Beijing, China, 2019. [Google Scholar]
  5. Ministry of Housing and Urban Rural Development of the People’s Republic of China. Notice on Printing and Distributing the Action Plan for the Creation of Green Buildings. 15 July 2020. Available online: http://www.gov.cn/zhengce/zhengceku/2020-07/24/content_5529745.htm (accessed on 20 June 2022).
  6. Ministry of Emergency Management of the People’s Republic of China. Ministry of Emergency Management of the People’s Republic of China Released the Basic Information of National Natural Disasters in 2021. 23 January 2022. Available online: https://www.mem.gov.cn/xw/yjglbgzdt/202201/t20220123_407204.shtml (accessed on 25 June 2022).
  7. Li, J.; Wang, Q.; Zhou, H. Establishment of key performance indicators for green building operations Monitoring—an application to China case study. Energies 2020, 13, 976. [Google Scholar] [CrossRef]
  8. Lu, S.; Liu, Y.; Sun, Y.; Yin, S.; Jiang, X. Indoor thermal environmental evaluation of Chinese green building based on new index OTCP and subjective satisfaction. J. Clean. Prod. 2019, 240, 118151. [Google Scholar] [CrossRef]
  9. Tsai, W.T. Overview of green building material (GBM) policies and guidelines with relevance to indoor air quality management in Taiwan. Environments 2017, 5, 4. [Google Scholar] [CrossRef]
  10. Madad, A.; Gharagozlou, A.; Majedi, H.; Monavari, S.M. Considering water ecological aspects in developing a quantitative climatic model of urban green building using monetary valuations. Ecol. Econ. 2020, 169, 106562. [Google Scholar] [CrossRef]
  11. Khoshnava, S.M.; Rostami, R.; Valipour, A.; Ismail, M.; Rahmat, A.R. Rank of green building material criteria based on the three pillars of sustainability using the hybrid multi criteria decision making method. J. Clean. Prod. 2018, 173, 82–99. [Google Scholar] [CrossRef]
  12. Basten, V.; Latief, Y.; Berawi, M.A.; Budiman, R.; Riswant. Evaluation of Green Building Rating Tools Based on Existing Green Building Achievement in Indonesia Using Life Cycle Assessment Method. AIP Conf. Proc. 2017, 1818, 020008. [Google Scholar]
  13. Mathiyazhagan, K.; Gnanavelbabu, A.; Prabhuraj, B.L. A sustainable assessment model for material selection in construction industries perspective using hybrid MCDM approaches. J. Adv. Manag. Res. 2019, 16, 234–259. [Google Scholar] [CrossRef]
  14. Shao, Q.G.; Liou, J.; Weng, S.S.; Chuang, Y.C. Improving the green building evaluation system in China based on the DANP method. Sustainability 2018, 10, 1173. [Google Scholar] [CrossRef]
  15. Liu, P.C.; Lo, H.W.; Liou, J.J. A Combination of DEMATEL and BWM-Based ANP Methods for Exploring the Green Building Rating System in Taiwan. Sustainability 2020, 12, 3216. [Google Scholar] [CrossRef]
  16. Zang, P.; Shao, B. Study on Evaluation Methods for Green Buildings from the Ecological Perspective. Build. Sci. 2014, 30, 19–23. [Google Scholar]
  17. Zhang, X.; Yi, S.-L. Green building evaluation methodology under ecological view. J. Discret. Math. Sci. Cryptogr. 2017, 20, 79–90. [Google Scholar] [CrossRef]
  18. Yang, M.S.; Ning, J.H.; Ning, R.R. The Green Value Evaluation Study of Ecology Energy Conservation Construction. Adv. Mater. Res. 2012, 374, 745–749. [Google Scholar] [CrossRef]
  19. Liu, T.Y.; Chen, P.H.; Chou, N.N. Comparison of assessment systems for green building and green civil infrastructure. Sustainability 2019, 11, 2117. [Google Scholar] [CrossRef]
  20. Gao, Y.; Yang, G.; Xie, Q. Spatial-temporal evolution and driving factors of green building development in China. Sustainability 2020, 12, 2773. [Google Scholar] [CrossRef]
  21. Welsh-Huggins, S.J.; Liel, A.B. A life-cycle framework for integrating green building and hazard-resistant design: Examining the seismic impacts of buildings with green roofs. Struct. Infrastruct. Eng. 2017, 13, 19–33. [Google Scholar] [CrossRef]
  22. Gromala, D.S.; Kapur, O.; Kochkin, V.; Line, P.; Passman, S.; Reeder, A.; Trusty, W. Natural Hazards and Sustainability for Residential Buildings; FEMA: Washington, DC, USA, 2010.
  23. Ertan, S.; Çelik, R.N. The Assessment of Urbanization Effect and Sustainable Drainage Solutions on Flood Hazard by GIS. Sustainability 2021, 13, 2293. [Google Scholar] [CrossRef]
  24. Zhao, X.; Hwang, B.G.; Gao, Y. A fuzzy synthetic evaluation approach for risk assessment: A case of Singapore’s green projects. J. Clean. Prod. 2016, 115, 203–213. [Google Scholar] [CrossRef]
  25. Cho, H.S.; Suh, H.J. AHP Analysis Techniques for the Weighted Evaluation of Cultural Heritage Disaster Safety Management Systems. J. Korean Soc. Hazard Mitig. 2018, 18, 43–53. [Google Scholar] [CrossRef]
  26. Bi, X.; Zhang, J.; Wang, J. Comprehensive disaster prevention assessment system for buildings based on fuzzy comprehensive evaluation. J. Nat. Disasters 2014, 23, 257–262. [Google Scholar]
  27. Gilbuena, R., Jr.; Kawamura, A.; Medina, R.; Amaguchi, H. Fuzzy-based gaps assessment of flood disaster risk reduction management systems in Metro Manila, Philippines. Water Environ. J. 2019, 33, 443–458. [Google Scholar] [CrossRef]
  28. Wang, W.; Su, J.; Ma, D.; Guo, X.; Wang, Z. Assessment of urban comprehensive disaster prevention and mitigation capability using practical probability method. China Civ. Eng. J. 2012, 45, 121–124. [Google Scholar]
  29. Yan, X.; Gong, H.; Qiu, J. Green Building Fire Risk Assessment Based on Fuzzy Analytic Hierarchy Process. Build. Sci. 2016, 32, 118–123. [Google Scholar]
  30. Bozza, A.; Asprone, D.; Fabbrocino, F. Urban resilience: A civil engineering perspective. Sustainability 2017, 9, 103. [Google Scholar] [CrossRef]
  31. Holling, C.S. Resilience and stability of ecological systems. Annu. Rev. Ecol. Syst. 1973, 4, 1–23. [Google Scholar] [CrossRef] [Green Version]
  32. Nita, Y.; Wang, P. Resilience modeling and quantification for engineered systems using Bayesian networks. J. Mech. Des. 2016, 138, 031404. [Google Scholar]
  33. Guo, D.; Shan, M.; Owusu, E.K. Resilience Assessment Frameworks of Critical Infrastructures: State-of-the-Art Review. Buildings 2021, 11, 464. [Google Scholar] [CrossRef]
  34. Council of Australian Governments (COAG). National Strategy for Disaster Resilience: Building the Resilience of our Nation to Disasters; COAG: Canberra, Australia, 2011.
  35. Australian Business Roundtable for Disaster Resilience and Safer Communities. Building Our Nation’s Resilience to Natural Disasters; Deloitte Access Economics: Canberra, Australia, 2014. [Google Scholar]
  36. Emergency Management Victoria (EMV). Critical Infrastructure Resilience Strategy; EMV: Melbourne, Australia, 2015.
  37. Yang, Y.; Guo, H.; Chen, L.; Liu, X.; Gu, M.; Pan, W. Multiattribute decision making for the assessment of disaster resilience in the Three Gorges Reservoir Area. Ecol. Soc. 2020, 25, 5. [Google Scholar] [CrossRef]
  38. Alshehri, S.A.; Rezgui, Y.; Li, H. Disaster community resilience assessment method: A consensus-based Delphi and AHP approach. Nat. Hazards 2015, 78, 395–416. [Google Scholar] [CrossRef]
  39. Guo, Q.; Amin, S.; Hao, Q.; Haas, O. Resilience assessment of safety system at subway construction sites applying analytic network process and extension cloud models. Reliab. Eng. Syst. Saf. 2020, 201, 106956. [Google Scholar] [CrossRef]
  40. Irwin, S.; Schardong, A.; Simonovic, S.P.; Nirupama, N. ResilSIM—A Decision Support Tool for Estimating Resilience of Urban Systems. Water 2016, 8, 377. [Google Scholar] [CrossRef]
  41. Mardani, A.; Jusoh, A.; Zavadskas, E.K. Fuzzy multiple criteria decision-making techniques and applications–Two decades review from 1994 to 2014. Expert Syst. Appl. 2015, 42, 4126–4148. [Google Scholar] [CrossRef]
  42. Kahraman, C.; Kaya, I.; Cebi, S. A comparative analysis for multiattribute selection among renewable energy alternatives using fuzzy axiomatic design and fuzzy analytic hierarchy process. Energy 2009, 34, 1603–1616. [Google Scholar] [CrossRef]
  43. GB50011-2010; Code for Seismic Design of Buildings. China Architecture & Building Press: Beijing, China, 2010.
  44. GB50016-2014; Code for Fire Protection Design of Buildings. China Architecture & Building Press: Beijing, China, 2014.
  45. Saaty, T.L. The Analytic Hierarchy Process; McGraw-Hill: New York, NY, USA, 1980. [Google Scholar]
  46. Liu, Y.; Eckert, C.M.; Earl, C. A review of fuzzy AHP methods for decision-making with subjective judgements. Expert Syst. Appl. 2020, 161, 113738. [Google Scholar] [CrossRef]
  47. Mi, X.; Wu, X.; Tang, M.; Liao, H.; Al-Barakati, A.; Altalhi, A.H.; Herrera, F. Hesitant fuzzy linguistic analytic hierarchical process with prioritization, consistency checking, and inconsistency repairing. IEEE Access 2019, 7, 44135–44149. [Google Scholar] [CrossRef]
  48. Tam, C.; Tong, T.K.; Chiu, G.W. Comparing non-structural fuzzy decision support system and analytical hierarchy process in decision-making for construction problems. Eur. J. Oper. Res. 2006, 174, 1317–1324. [Google Scholar] [CrossRef]
  49. DB11/T 825-2021; Assessment Standard for Green Building. China Architecture & Building Press: Beijing, China, 2021.
  50. DBJ/T45-104-2020; Assessment Standard for Green Building. China Architecture & Building Press: Beijing, China, 2020.
  51. DBJ51/T 009-2021; Assessment Standard for Green Building in Sichuan Province. China Architecture & Building Press: Beijing, China, 2021.
Figure 1. Total annual CO2 emissions worldwide.
Sustainability 14 12284 g001
Figure 2. Establishment process and calculation steps of the DPM index assessment system.
Sustainability 14 12284 g002
Figure 3. Geographic locations.
Sustainability 14 12284 g003
Table 1. DPM indexes for green buildings.
Target LayerCriterion LayerIndex LayerExplanation
DPM index (A)Structural safety (B)Seismic design (B1)Seismic isolation, energy dissipation and shock absorption design, improvement of fortification category, etc.
Structural materials (B2)Reinforcement cover thickness, high durable concrete, weatherproof structural steel, durable wood, etc.
Component material (B3)Corrosion-resistant pipe, protective glass, etc.
DPM design (C) Fire protection design(C1)Refuge floor, Design of fire-fighting area, ground refuge area, evacuation passage, etc.
Anti-epidemic design (C2)Layout of isolation room, natural ventilation design, fabricated wallboard, subdivision room, etc.
Urban planning design (C3)Surrounding environment, land exploration, nearby shelters, etc.
Facilities setting (D)Communal facilities (D1)Power supply facilities, communication facilities, alarm facilities, etc.
Fire protection facilities (D2)Fire hydrant, sprinkler system setting, water leakage monitoring, etc.
Emergency facility (D3)Material reserve, emergency lighting, etc.
Operation monitoring (D4)Air quality, real-time wind, seismic wave, local fire, etc.
Resource utilization (E)Site planning (E1)Refuge in the site, buffer zone to reduce the risk of falling objects, etc.
Water saving system (E2)Permeable pavement, rainwater collection, rainwater garden, etc.
Energy saving system (E3)Light guide in Basement, solar energy utilization, etc.
Table 2. Scales for the judgment matrix.
GradeImportance of Ui
1General important
3Comparative important
5Absolute important
2, 4Indicates an intermediate value between adjacent judgments
Table 3. Weight of DPM assessment index for green buildings.
Target LayerCriterion LayerWeightIndex LayerLocal Weight
DPM Index (A)Structural safety (B)0.3117Seismic design (B1)
Structural materials (B2)
Component material (B3)
0.1299
0.1039
0.0779
DPM design (C)0.2688Fire protection design(C1)
Anti-epidemic design (C2)
Urban planning design (C3)
0.1344
0.0807
0.0537
Facilities setting (D)0.2326Communal facilities (D1)
Fire protection facilities (D2)
Emergency facility (D3)
Operation monitoring (D4)
0.0465
0.0698
0.0465
0.0698
Resource utilization (E)0.1869Site planning (E1)
Water saving system (E2)
Energy saving system (E3)
0.0719
0.0575
0.0575
Table 4. Standard value of the average random RI.
Number of Matrix Orders12345678910
RI000.580.901.121.241.321.411.451.49
Table 5. Climate data for cities in the Ningxia Hui Autonomous Region.
CityAnnual Average Pressure (HPA)Annual Average Precipitation (mm)Annual Average Temperature (℃)Annual Average Relative Humidity (%)Annual Average Wind Speed (m/s)
Yinchuan890.9182.99.5552.2
Shizuishan889.4167.210.1481.9
Wuzhong888.7183.210532.3
Zhongwei878.6176.59.2552.4
Guyuan824.8425.56.9612.6
Table 6. Climate data for cities in Sichuan Province.
CityAnnual Average Pressure (HPA)Annual Average Precipitation (mm)Annual Average Temperature (℃)Annual Average Relative Humidity (%)Annual Average Wind Speed (m/s)
Chengdu 955812.816.4811.2
Mianyang954816.616.5791.5
Deyang954816.616.5791.5
Barkam734.8783.98.8611
Ya’an935.61407.115.6821
Ziyang972.7867.417.3811.6
Kangding743.1858.37.3742.8
Leshan965.21231.517.4801.2
Meishan965.91039.517.2811
Zigong973989.517.9801.2
Yibin974.61017.618810.8
Xichang837.91025.117.2611.5
Panzhihua878.1838.720.9581.3
Guangyuan955.6928.916.4681.3
Bazhong966.21100.917770.9
Dazhou974.41205.117.2801.3
Suining973.293317.4800.9
Nanchong978.21002.617.4801.1
Guangan975.3109517.3831
Neijiang973.1939.517.6831.3
Luzhou978.61016.218831.3
Table 7. The DPM assessment index scores for the green buildings in Ningxia.
Target LayerCriterion LayerScoreIndex LayerLocal Score
DPM index (A)Structural safety (B)1.6884Seismic design (B1)
Structural materials (B2)
Component material (B3)
0.7794
0.5195
0.3895
DPM design (C)1.8803Fire protection design (C1)
Anti-epidemic design (C2)
Urban planning design (C3)
1.0744
0.6448
0.1611
Facilities setting (D)1.7213Communal facilities (D1)
Fire protection facilities (D2)
Emergency facility (D3)
Operation monitoring (D4)
0.3720
0.5584
0.2325
0.5584
Resource utilization (E)1.4565Site planning (E1)
Water saving system (E2)
Energy saving system (E3)
0.7190
0.4600
0.2875
Table 8. The DPM assessment index scores for the green buildings in Sichuan.
Target LayerCriterion LayerScoreIndex LayerLocal Score
DPM index (A)Structural safety (B)1.6624Seismic design (B1)
Structural materials (B2)
Component material (B3)
0.7794
0.4156
0.4674
DPM design (C)1.9070Fire protection design (C1)
Anti-epidemic design (C2)
Urban planning design (C3)
0.9401
0.4836
0.4833
Facilities setting (D)1.6980Communal facilities (D1)
Fire protection facilities (D2)
Emergency facility (D3)
Operation monitoring (D4)
0.3720
0.5584
0.2790
0.4886
Resource utilization (E)0.9920Site planning (E1)
Water saving system (E2)
Energy saving system (E3)
0.3595
0.2875
0.3450
Publisher’s Note: MDPI stays neutral with regard to jurisdictional claims in published maps and institutional affiliations.

