Abstract
Traffic delays are not wholly new and are a well-known problem that impacts many of the world’s populations through disruptions and pollution. The rising urbanization and quantity of powered road vehicles necessitate a greater traffic control demand to maintain flow and avoid jams. In order to understand the notion of sustainable transportation, this study first examined sustainable transportation systems. This research then assessed Pakistan’s present transportation infrastructure and urban transportation to find the most reasonable and sustainable alternative to reduce congestion. The Taxila intersection was utilized as a pilot study area because of its vicinity to Pakistan’s leading economic hubs (i.e., industrial estates and the twin cities of Islamabad and Rawalpindi). The study used multi-criteria decision making (MCDM) techniques, including the fuzzy AHP, TOPSIS, VIKOR, and traffic simulation software, to determine the optimal solution for a more sustainable transportation system, and reducing traffic congestion. A pairwise comparison of the criteria and alternatives was made using a survey. This survey was used to look into the perspectives of various stakeholders and experts. The outcomes of the fuzzy AHP-TOPSIS and fuzzy AHP-VIKOR revealed that a flyover is the best alternative. In contrast, the best alternative, according to the software was a parking area. Ultimately, we assessed our results using the literature, and site observation, and concluded that a parking area would be the most sustainable alternative in the Taxila intersection.
1. Introduction
In wealthy and developing nations, urban areas worldwide have become less sustainable and more automobile-dominated, in just a few decades. Cities, particularly those in developing countries, have seen a sharp increase in the problems associated with transportation, including pollution, traffic congestion, accidents, a decline in public transit, environmental devastation, global warming, ecological collapse, visual impacts, and a lack of accessibility for the urban poor. Some cities in more developed nations, especially in Northern Europe, have seen a trend in reclaiming urban areas from vehicles by banning cars from entering considerable parts of the city centers or restricting them in various ways [1]. The transportation infrastructure is crucial to the sustainable growth of space. Transportation gives all communities access to economic and social possibilities, and contributes to an area’s sustainable development [2,3]. However, we must acknowledge that one of our difficulties, while building a transportation network, is the environmental issue and the corresponding necessity to avoid natural obstacles [4]. The modernization of transportation infrastructure “should guarantee sustainable mobility, communication of persons, and develop effective interactions of business agents while providing support for the national economy,” according to Lithuanian academics [5]. Due to the effects of urban transportation networks, smart mobility is now a more prevalent issue in sustainability agendas [6]. The fusion of the digital revolution with the transportation sector is largely responsible for the development of the idea of smart mobility. Thus, new technologies have been applied to boost the effectiveness of the transport network [7].
The sustainability of the transportation system can be stated in the expressions of pillars, i.e., economic sustainability, social sustainability, and environmental sustainability [8]. Sustainable transportation is critical for long-term development. To achieve the 2030 Agenda for Sustainable Development and the Paris Agreement on Climate Change, we will need to establish a set of sustainable development goals (SDGs). While many traditional modes of transportation are evolving, significant challenges remain in successfully transitioning to sustainable transport. As a result, the SDGs include essential building blocks such as universal access to safe, affordable, and sustainable transportation systems, energy efficiency, road safety, resilient infrastructure development, preventive care, and mitigating climate change [9]. Environmental pressure and energy shortages have risen over the previous few decades, and conventional road travel is raising more significant concerns due to carbon emissions and energy use. The primary driver of climate change is thought to be greenhouse gas (GHG) emissions, one of the many types of environmental consequences. The Environmental Protection Agency (EPA) claims that the transportation industry is one of the leading sources of GHG emissions [10].
In order to better understand the complexity of cities and to deepen the connections between land use and transportation, sustainable mobility offers new models that can enhance flexibility in transport planning [11]. The concept of sustainable mobility is relatively new, just over three decades old, and lacks the traction to transition from unsustainable societies to sustainable societies [12]. The authors presented a bigger picture and correlated fossil fuel replacement, increasing the number of passengers per vehicle and decreasing the amount of car travel as a workable solution toward a sustainable society [13]. One industry, transportation, is proving to be particularly difficult to reduce energy use and emissions. There are numerous good examples of how energy use in transportation has been reduced in metropolitan areas, primarily through demand management (pricing, parking, access control, and congestion charge), investments in public transportation, and other methods [3]. The rapid increase in population hurts urban mobility systems. It has achieved the need to resolve the issues of improving the transport system [14]. While congestion is cited as a critical and progressing issue, it is also a complex and loosely defined subject area, following a superficial examination. The subject becomes even more complicated when considering places, causes, effects, solutions, and impacts. The problems and solutions vary according to routes [15].
Congestion affects everyone in the developed world and many individuals in developing countries. It has an indirect impact on the world, even in unpopulated areas. Although delays due to traffic have been observed since Roman times, traffic has only had a broad and indirect influence internationally since locomotive engines rely on combustion processes to generate motion. It is worth mentioning that traffic congestion is not restricted to automobiles; pedestrian (non-automobile) traffic congestion has been widely studied to build evacuation strategies and crowd control procedures [16,17]. The smart city concept is progressively gaining traction as a new urbanization paradigm [18]. Smart, participatory sensing cities and location information from communication systems and social networks provide a vast number of diverse mobility data that might be used to regulate traffic. This intelligent transportation is one of the essential aspects of smart cities since it offers inhabitants a safer, quicker, and eco-friendlier service [19]. Real-time massive data processing, fast processing, and effective decision-making and management are one of the shortcomings [20].
Introducing vehicles into the transportation sector resulted in extraordinary developments, such as improved travel and commodities movement flexibility and the expansion of many economic sectors. Moreover, automobiles have given birth to certain important issues that need immediate answers. Environmental deterioration, pollution, and noise are examples of such difficulties. Furthermore, when more automobiles are introduced onto the roadways, people and animals are put in danger, with increased traffic accidents [21]. Automobiles have also contributed to the economic concerns linked with traffic bottlenecks, which are now common in most cities. When prioritizing and planning activities that will influence future generations, it is vital to remember that long-term economic development is aided by health, quality of life, and social inclusion [22]. One of the most important solutions to rising traffic is adopting sustainable practices. However, public perception and attitudes about these long-term therapies significantly affect their effectiveness [23]. A smart city built on sustainability ideals improves sociability while saving money for the environment, its inhabitants, and everyone’s well-being. The two most important indicators for smart cities are the development index planned by the OECD and the Cohen Smart City Index Master [24].
The multi-criteria decision making (MCDM) technique is used to evaluate the best available option, out of many, based on pre-established criteria. Traditional MCDM approaches applied for decision-making include AHP, TOPSIS, ELECTRE (elimination and choice translating reality), PROMOTHEE (Preference Ranking Organization Method for Enrichment Evaluation), or VIKOR (Vlsekrzterijumska Optimizacija I Kompromisno Resenje) were employed by the authors, Additionally, the DEMATEL (decision making trial and evaluation laboratory), REMBRANDT (ratio estimation in magnitudes of decibels to rate alternatives which are non-dominated), and MACBETH (measuring attractiveness by a categorical based evaluation technique) are also taken into consideration. Moreover, many studies employed two or more MCDM approaches (hybrids) [25,26,27]. Furthermore, the interval type-2 fuzzy TOPSIS [28], the intuitionistic fuzzy TODIM [29], and the PSO (Particle Swarm Optimization) [30] algorithms are utilized to evaluate the sustainability of the systems.
MCDM in sustainable transportation is typically used for infrastructure selection, information system selection, vehicle selection for clean technologies, location issues, and mode and route selection for transportation. The criteria and their weighting significantly impact the best-chosen options [31]. The criteria used in the decision-making process should be impartial to alternatives. Researchers argued that selecting the “Best” MCDM technique is very difficult, as these techniques have their advantages and disadvantages. Furthermore, more than one MCDM technique must be utilized to obtain a more reliable result [30]. The fuzzy AHP technique provides a series of weight vectors that will be used to identify the primary characteristic using the fuzzy arithmetic and fuzzy aggregation operations. The pairwise comparisons in the judgment matrix are fuzzy numbers. In some circumstances, the decision maker can use the AHP numerical pairwise comparison, which Saaty expressed as a nine-point significance scale between two elements, in order to convey preferences. Triangular fuzzy numbers were added to the conventional AHP to increase the decision-level makers of judgment. The center value of the fuzzy number is the comparable real clear value [32]. The fuzzy TOPSIS and fuzzy VIKOR techniques rank many workable alternatives depending on how close they are to the ideal option. The ideal alternative must be the one with the least geometric distance to a positive ideal solution and the one with the most significant geometric space. The fuzzy-neural method was suggested by Pang et al. [33] who proposed that a neural network’s implementation may be used to acquire the processes and membership functions of the fuzzy system. In addition to handling multiple routes, its learning system picked up new information from the driver’s selections. However, the training process was time-consuming and there was a high need for high-quality data. The same can be said for the implementation of the PSO [30].
Traffic congestion has been a long-standing issue that has eluded a solution. The key focus of this paper is the traffic congestion management in Taxila, Pakistan. It primarily provides a solution to traffic congestion at the Taxila intersection. The research addresses different solutions to existing traffic conditions while recognizing the inevitable congestion in urban areas. The research proposes a novel control method for clearing pre-existing congestion and reducing congestion by integrating the MCDM techniques and digital assessments of the current traffic situation. The best result, based on the MCDM and simulations have been compared, and have taken into consideration the existing literature, and an affordable and sustainable alternative is suggested. One must comprehend why traffic congestion arises and if it can be controlled more efficiently than present methods allow.
2. Methodology
2.1. Method
The research methodologies were applied to gather important information about traffic congestion in Taxila. This research used MCDM (fuzzy AHP), the Technique for Order of Preference by Similarity to Ideal Solution (TOPSIS), Vlsekrzterijumska Optimizacija I Kompromisno Resenje (VIKOR), and AIMSUN software. From the literature, we selected different criteria and alternatives. A survey was conducted among experts and analyzed the opinions through MCDM; with the fuzzy AHP, we calculated the weights of the criteria, and with the TOPSIS and VIKOR, we calculated the best alternative based on expert opinion. Furthermore, site visits in the identified areas for traffic congestion were conducted. The visits were conducted on different days, from 7 a.m. to 7 p.m. These observations aimed to quantify the vehicular volume circulating on these sites. The recordings made with the camera were later used to calculate the number of cars flowing in each intersection lane separately. The findings were used as input to the traffic software AIMSUN, based on the real-time data and traffic flow during peak hours. Finally, the results were compared, and a suitable alternative was selected. Formal mathematical techniques, modeling, and simulation systems were examined to control, measure, and manage traffic flow.
2.2. Case Study
Taxila is an old city founded in 1000BCE and was considered to be the heart of Buddhism. The Achaemenids ruled this city around 600BCE, followed by the Greeks, Mauryans, Indo-Greeks, Scythians, Parthians, Kushans, White Huns, and lastly, the Hindu Shahi, in the 10th century CE. It is located 25 km northwest of the Twin cities of Islamabad and Rawalpindi. The Taxila intersection is chosen as the point of interest because it is located at a key location on the National Highway, N-5, the longest National Highway of Pakistan, which starts from Karachi and ends at Torkham, covering 1819 km. It is the most important intersection on this highway, as discussed in the previous study [34]. Currently, it is the hub of several businesses in the region, resulting in numerous movements; however, the rapid growth of motor vehicles in an urban environment causes critical issues such as congestion caused by human activities, which reduces the true width of the roadway. All of this adds up to a congested intersection. The situation is exacerbated by heavy traffic from the nearby industrial estates (Hattar Industrial Estate, Punjab Small Industries Estate, Heavy Mechanical Complex, and Wah Industries Limited). The most noticeable effect of this congestion is the increased travel time, especially during peak hours.
Figure 1 shows the Taxila intersection along with various routes that enter the intersection from Peshawar, Rawalpindi, HMC Road, POF Road, and Thatha Khalil Road towards Taxila. At every point from which a vehicle entered the Taxila intersection, the traffic count of the vehicle was recorded on the score sheet.
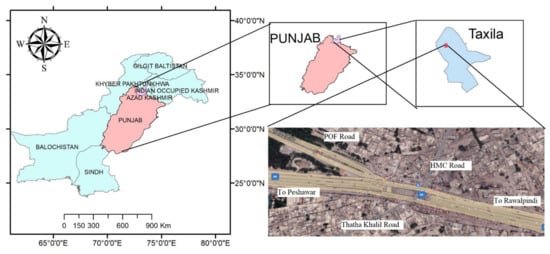
Figure 1.
Road Network at Taxila intersection (33°44′14.5″ N, 72°47′54.4″ E).
2.3. Study Framework
A two-phase framework was adopted to carry out this research. Phase-I consisted of using traffic data to simulate the given alternatives. Furthermore, Phase-II applied the fuzzy AHP-TOPSIS and the fuzzy AHP-VIKOR hybrid techniques to find the best alternative, Figure 2.
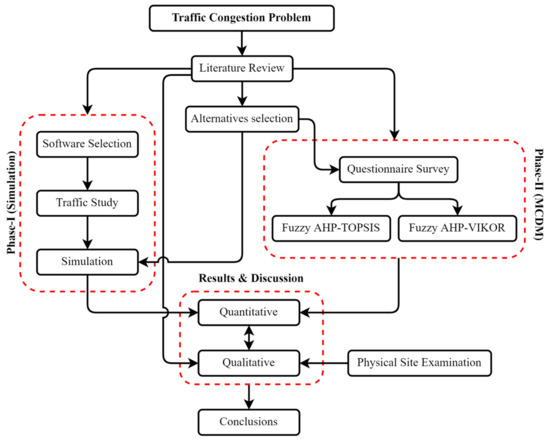
Figure 2.
Flowchart of the proposed methodology.
2.4. Phase-I (Simulation)
A traffic count determines the quantity and categorization of cars at specified locations and times. The manual and automated traffic counting are two options to choose from. A traffic counting methodology designated as “manual” is commonly referred to as “manual counting.” Vehicle counts at junctions, an estimate of average daily traffic, and daily traffic per year are all instances of traffic counting [35,36]. The site can be manually counted and classified, or video recordings might be used. The visual inspection and individual judgment observers count and grade the items. Counting/scoring sheets or mechanical counters are commonly used to record data [37]. A manual traffic count was conducted to count the number of cars traveling in each direction. Vehicles were calculated individually based on their kinds, such as bikes, passenger vehicles, single-axle trucks, and two-axle trucks [34]. The cars were tallied from 7:00 a.m. to 7:00 p.m., and a portion of the traffic count is displayed in Table A1.
AIMSUN uses dynamic exploratory tasks, implicit route selection models, and validation techniques to verify the simulation. The AIMSUN microscopic simulator demonstrates how these characteristics may be employed [38]. Building an AIMSUN model requires two types of information: supply data and demand data. Supply data involves transportation networks and services related to mobility, whereas demand data include OD matrices for each category of vehicle and time brackets [39]. To better satisfy the objectives of the ITS system assessment, an advanced transport analysis, and ATMS, AIMSUN has created a microscopic traffic simulator. The simulator’s integration with AIMSUN/ISM (intermodal strategy manager), which is a flexible visual environment for model manipulation, a simulation-based traffic analysis, and advanced traffic management techniques assessment, emphasize the description. The AIMSUN/ISM scenario study module creates and simulates the traffic management methods. The (OD Tool) makes and manipulates origin-destination matrices that reflect the mobility patterns required by a dynamic traffic analysis. The matrix calculation algorithms were created utilizing the EMME/2 transportation planning programmer, which has a customizable interface. AIMSUN generates a wide range of information, including flow rate, density, journey duration, delayed time, and speed. The output may be customized at numerous levels, including the overall system output, segment output, turning action output, and stream output (set of consecutive sections) [40,41].
2.5. Phase-II (MCDM)
2.5.1. Fuzzy AHP
The fuzzy logic-based analytic hierarchy process (AHP) technique is also known as the fuzzy analytic hierarchy process (FAHP). The AHP method and the fuzzy AHP methodology are similar, but the fuzzy AHP method turns the AHP scale into a fuzzy triangle scale that may be used immediately. Fuzzy logic is an approach that deals with uncertain data and knowledge [42]. The experts debated extensively to discover the criteria influencing the selecting and ranking options in Taxila, Pakistan. The indicators are collected from the literature and modified to fit the context of the local prevailing conditions for measuring sustainable urban transport systems. These criteria are provided in Table 1.

Table 1.
Indicators for a Sustainable Urban Transport.
The five feasible alternatives given below have been selected for the study area. Completeness, redundancy, decomposability, and minimum should all be met by the hierarchy of criteria, but in certain circumstances, compromises are possible. These alternatives include:
Shuttle transport (A1)—Public transportation, such as buses, can use less fuel per passenger and reduce the amount of traffic congestion [34,47].
Signalized intersection (A2)—Intersections may be signalized to address road safety, efficiency, or operational issues or to improve crossing opportunities for pedestrians and cyclists [51].
Lane Separation (A3)—It allows traffic to move freely and reduces the complexity of traffic movements, also reducing the risk of accidents [34,52].
Parking Areas (A4)—Parking is an essential transportation system component. Vehicles must park at every destination. Parking convenience affects the ease of reaching destinations and therefore affects the overall accessibility [53].
Flyover (A5)—To ease the traffic flow and help in decongesting traffic at a major intersection [52].
The fuzzy AHP was used to assign weight to the criteria and to display the best criteria across all criteria, Figure 3. The classical set theory is subdivided into fuzzy set theory and classical set theory. It gives a grade from one to 10 and is an associative function. A “tilde” is placed on the letter if it denotes a fuzzy set. For (l, m, u), where ‘l’ is the smallest value, ‘m’ is the most likely value, and ‘u’ is the most significant value, a fuzzy event is signaled [54].
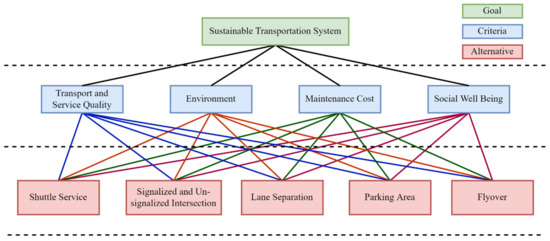
Figure 3.
Proposed matrix for the application of MCDMs.
The following are some of the definitions for the fuzzy AHP:
First definition: For a triangular fuzzy number , the membership function is given by (l, m, u) and is defined by Equation (1):
For the left and right-side representations, the degree of membership of a fuzzy number is given by Equations (2) and (3):
Second definition: Suppose that the two triangular fuzzy numbers are . The operational laws of addition, multiplication, subtraction, division, and reciprocation are expressed as follows:
Their addition is given by Equation (4):
Their multiplication is given by Equations (5) and (6):
Their subtraction is given by Equation (7):
The division is given by Equation (8):
Equation (9) gives the inverse:
In the interval judgments, the fuzzy triangular numbers precede one criterion over the other. The extent analysis is then used to make the pairwise comparison. The weights of the criteria are calculated. This method’s general steps are as follows:
Steps of the Fuzzy AHP
Chang’s method is used to evaluate the fuzzy AHP technique through the following steps:
Step 1: Construct a tiered diagram, Figure 3.
Step 2: Perform the pairwise comparisons.
The pairwise comparison matrix can be expressed in Equation (10) as follows:
When there are multiple experts, the elements of a complete pairwise comparison matrix used in the fuzzy AHP method are fuzzy triangular numbers, with ‘l’ representing the minor component, the ‘m’ representing the mean of numbers, and ‘u’ representing the maximum number.
Step 3: for the pairwise evaluation matrix
can be calculated from:
where i and j denote the row number and column number, respectively. In the formula, are fuzzy triangular numbers of the pairwise comparison matrices. The values of can be calculated by using:
where li, mi, and ui are the fuzzy number’s first, second, and third elements.
Step 4: Compute the magnitude
In general, if and are two fuzzy triangular numbers, as shown in Equation (15), the magnitude of M1 to M2 can be defined as follows:
Step 5: Calculation of the criteria weight
The weight of the criteria is calculated using the following:
Therefore, the normalized weight vector can be given as follows:
Step 6: Final weight calculation
To determine the final weight vector, first, normalize the weight vector produced in the previous step:
2.5.2. Fuzzy TOPSIS
The alternative is ranked on TOPSIS based on its performance. This study examined two sorts of options, as listed below:
- Negative ideal solution
- Positive ideal solution
TOPSIS is a strategy for choosing the best alternative: the furthest away from the negative ideal solution and the furthest away from the positive ideal solution. The positive and negative ideal solutions provide the most and least benefits. The final evaluation of the alternatives is based on how near they are to the ideal solution [55,56]. The following steps are involved in the TOPSIS process [57]. In these steps, ‘m’ stands for alternatives, ‘n’ for characteristics, and xij stands for the score of option i about criteria j. Furthermore, m stands for the cost and J for the benefit criteria.
Steps for Fuzzy TOPSIS
Step 1: Create a normalized decision matrix. The equation is used to calculate the normalized value of rij:
Step 2: Construct the weighted normalized decision matrix. Assume we have a set of weights for each criterion wj for j = 1..., n and . Each column of the normalized decision matrix is then multiplied by its weight. An element of the new matrix is equation:
Step 3: Determination of the positive ideal and the negative ideal solutions.
For a positive ideal solution:
where,
and for a negative ideal solution, the equation will be
where,
Step 4: Separation measures calculation:
From the positive ideal alternative, the separation measure is:
Furthermore, the separation measure for the negative ideal solution is:
Step 5: Calculation of the relative closeness from the ideal solution
In the TOPSIS method, Ci or Pi will denote the final score.
Step 6: The choices should be rated in ascending or descending order using the Ci or Pi values. The greatest index value, Ci or Pi, shows the shortest distance from the positive ideal solution. In contrast, the lowest index value Ci or Pi indicates the shortest distance from the negative ideal solution.
2.5.3. Fuzzy VIKOR Method
In order to optimize the complicated systems for several criteria, Opricovic originally introduced the VIKOR approach [58]. Using the initial (provided) weights, the approach generates a compromise ranking list, a compromise solution, and weight stability intervals for the preference stability. It presents a multi-criteria ranking system based on a specific indicator of how close a given solution is to the ideal one [59].
Alternatives are identified by the letters A1, A2,..., AJ. For alternative AJ, fij stands for the value of the ith criterion function, where is the number of criteria and fij is the rating of the ith aspect. The following Lp-metric is the first to be used in developing the VIKOR technique.
where; 1≤ p ≤ ∞; j = 1, 2, ..., J
The VIKOR approach uses Lp,j (as Sj in Equation (32)) and L∞j (as Rj in Equation (33)) to create a ranking measure. While min Rj’s solution has the least amount of individual regret from the opponent, min j Sj’s answer optimizes the collective utility (majority rule). The reasonable middle ground compromise is an agreement reached via reciprocal concessions, and Fc is a workable solution that is the closest to the ideal F* by . The following processes are included in the compromise ranking algorithm VIKOR [60].
Step 1: If the ith I = 1, 2, 3 …, n term represents the benefit, then compute the best and worst values for all criteria functions.
where; ˜fij = (lij, mij, rij) denotes the fuzzy rating corresponding to alternative Aj with regard to criterion Ci, wi denotes the fuzzy weights for the criteria.
Step 2: Calculate the values of Sj and Rj; j = 1, 2, …, J
where wi is a criterion weight indicating the criteria’s relative weight.
Step 3: Calculate the Qj values, j = 1, 2, …, J:
where ,,,
shows the weight of the strategy of “the majority of criteria” (or “the maximum group utility”).
Step 4: Rank the alternatives for S˜, R˜, and Q˜ values in ascending order, and construct three lists based on S˜, R˜, and Q˜ values. The best alternative in each ranked list is the one with the lowest value.
Step 5: Propose a compromise solution, the alternative (A) ranked the best by the measure Q˜ (minimum).
Numerous variations of the VIKOR approach, such as the fuzzy VIKOR (F-VIKOR), have been developed [61,62]. The interval valued VIKOR (IV-VIKOR) [63] and the intuitionistic fuzzy VIKOR (IF-VIKOR) [64].
3. Results and Discussion
3.1. Phase-I Result
Aimsun Live integrates with the traffic control center, and analyzes the live field data in real-time, simulating the vehicle flow in any sized road network, from a single highway strip to an entire metropolitan area. Aimsun Live can effectively estimate future network flow behaviors that will emerge from certain traffic management or information supply strategy by integrating live feeds from traffic data and rapid simulations to mimic the applied mitigation measures related to congestion.
Selection of the Feasible Alternative Based on Simulations
Many alternatives in the literature are used to reduce congestion and ensure sustainability. The main aim of this study is to rank the selected alternatives on the defined criteria. It is suggested that priority be given to the high-ranking alternative in construction. The low-class alternative will be taken up later due to a limited financial budget in Pakistan [65]. AIMSUN requires a simulation scenario and a collection of additional simulation parameters that describe the experiment as input data. AIMSUN generates various data, including flow rate, speed, density, trip time, delay time, and average speed. The output can be configured at multiple aggregate levels, including the system-wide creation, each segment, spin action, and stream (a consecutive set of sections), Figure 4.
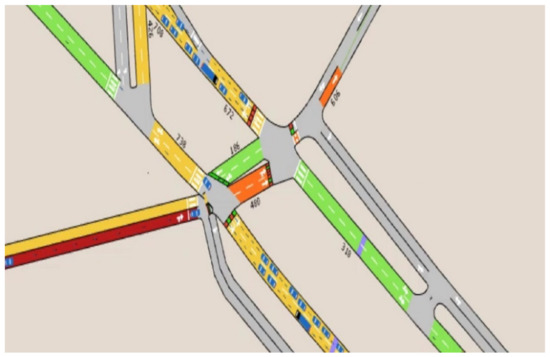
Figure 4.
AIMSUN Modelling to analyze traffic conditions.
In the 1st stage, we did not introduce any alternative to the AIMSUN and analyzed the current traffic condition. Following the introduction of each alternative, the changes in delay time, density, travel time, and average speed, are provided in Table 2.
Table 2.
AMISUN data at Peak Hour after different alternatives.
From Table 2, if we compare all of these data, one can assume that the parking area is better in all aspects (delay time, density, travel time, and average speed), so according to the AIMSUN software, the parking area will be the solution to reduce traffic congestion, Figure 5.
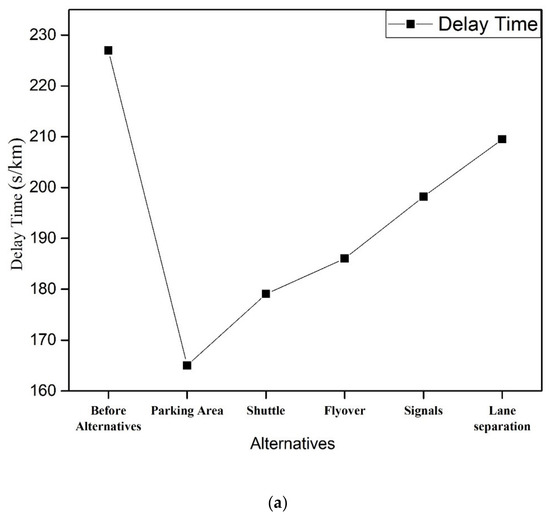
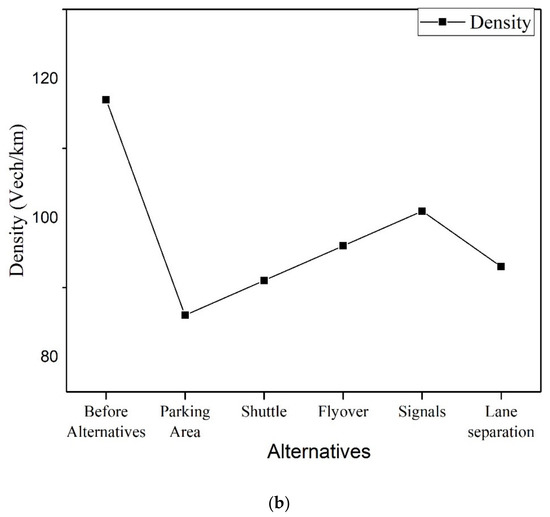
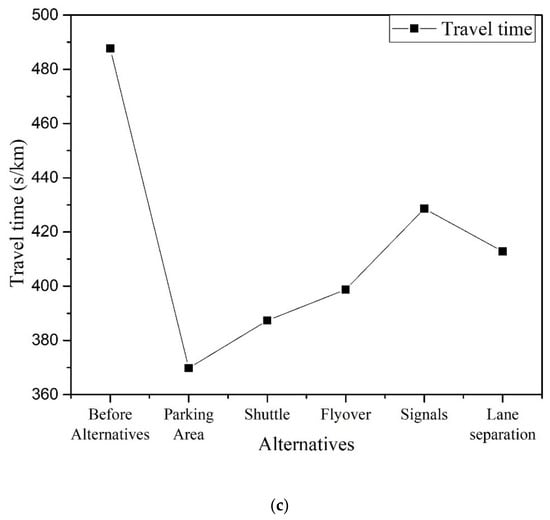
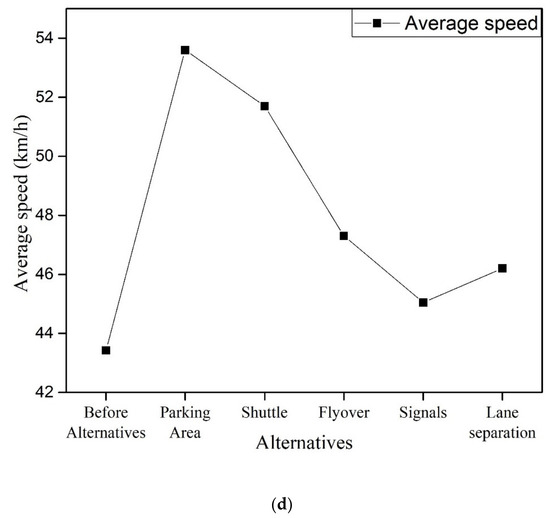
Figure 5.
Comparison of the Alternatives from AIMSUN, (a) Delay Time, (b) Density, (c) Travel Time, and (d) Average Speed.
3.2. Phase-II Result
The criteria for considering the alternatives are provided in the fuzzy-AHP [66], and the available literature was studied to do this. Triangular fuzzy numbers (TFN) [57] calculated each criterion’s priority weights. The reciprocals of these fuzzy triangular numbers are provided in Table A2. In order to create fuzzy comparison matrices, questionnaires are employed.
Twenty-four (24) experts were contacted to provide critical feedback for additional data analysis and were requested to submit their valued opinion and advice. Only twenty (20) of the twenty-four volunteered to contribute their expertise. The remaining four were thanked for their important work. Various specialists were academic experts and field experts involved in these initiatives. Only specialists were chosen and contacted in this study because the input/opinion of others with little or no expertise might have impeded both the input and input-based output. The experts were consulted to develop the criterion, considering the prevailing local conditions. The experts, using linguistic characteristics, estimated the significance rate of the criterion. For example, the first question of the questionnaire, Table 3, compares the criteria of transport and service quality with the environment. Six (6) such tables were established and compared for the different criteria. The linguistic variables were changed using fuzzy triangular numbers. The information is subsequently entered into the Excel software for a pairwise comparison, Table 4.
Table 3.
Transport and service quality criteria comparison with the criteria of Environment.
Table 4.
Pairwise comparison matrix of the defined criteria for the fuzzy AHP.
From Equation (9), the fuzzy synthetic exponential values are:
S1 = (0.3132, 0.43184, 0.59228)
S2 = (0.2519, 0.3429, 0.46496)
S3 = (0.11258, 0.1535, 0.2096)
S4 = (0.0565, 0.071, 0.0915)
The above values are used to calculate the values of V (magnitude of the fuzzy numbers). Following the calculation of V, the minimum degree of possibility is:
m(C1) = 1, m(C2) = 0.63, m(C3) = 0.0, m(C4) = 0.0
The weight vectors, are:
= (1, 0.63, 0, 0)
The calculated normalized weight vectors, are:
= (0.6134, 0.372, 0, 0)
The weight vectors indicate that the C3 and C4 criteria are not considered necessary by the experts; therefore, the weightage of these criteria comes to zero.
3.3. Ranking Alternatives Using the Fuzzy TOPSIS Technique
The alternative is ranked using TOPSIS. This research examines five alternatives, and the experts classify the alternatives using Table A3. The results of the normalization are shown in Table 5. The best and worst ideal solutions are represented in Table 6 and Table 7, respectively.
Table 5.
The weight normalized decision matrix for TOPSIS.
Table 6.
Best Ideal Solution for TOPSIS.
Table 7.
Least Ideal Solution for TOPSIS.
In the questionnaire concerning TOPSIS, we compare the alternatives with alternatives; the question is, how important criteria, such as transport and service quality, when compared with the alternative: shuttle transport. There are a total of twenty tables for the comparison of the alternatives. In this research, we dealt with the criteria and alternatives and the sub-criteria only defined the criteria, so in this research, we have four criteria and five alternatives. Through the fuzzy AHP, we derive the weight of the criteria and through TOPSIS, we derived the weightage/ranking of the alternatives. The weight vectors clearly showed that experts did not consider the criterion ‘maintenance cost’ and “social wellbeing” as important; therefore, the weighting of these criteria came out to be zero after applying Equations (15) and (16) [67].
The final ranking of TOPSIS is represented in Table 8.
Table 8.
Final Ranking of Alternatives for TOPSIS.
The Ci or Pi number closest to 1 (unity) denotes a more optimal alternative. According to this study, A5 is the most practicable alternative based on the information recorded from the twenty experts. At the same time, A4 is the least viable option owing to social and service quality failure. The quality of transport service in Pakistan needs to be improved, and there has been a strong demand to improve the quality of service [68]. The alternatives by the Pi values are for a flyover, shuttle transport, and lane separation. The parking area is the least preferred or the worst alternative, and the flyover is the best alternative because of its highest Pi value.
3.4. Ranking Alternatives Using the Fuzzy VIKOR Technique
The fuzzy VIKOR method uses the same fuzzy decision matrix, Table 4, constructed by the linguistic evaluation of the experts’ opinions. Therefore, it is possible to determine the fuzzy best ˜f∗I and the fuzzy worst ˜f-I values without constructing another decision matrix. The first step of the fuzzy VIKOR is to calculate the best (f*j) and worst value f-j which is shown in Table A4.
The values of ˜Sj are the sum of the Sj values, which mean the distance for jth alternative to the best fuzzy solution, according to all of the criteria, by using Equation (34). For example, the ˜Sj value for each alternative is shown in Table 9.
Table 9.
Ranking of alternatives for VIKOR.
The alternatives are sorted in ascending order according to Q˜ j, S˜ j and R˜j. It is determined that the alternative of A5 is the best solution according to the Q˜ j index.
3.5. Sensitivity Analysis
Most data in multi-criteria decision-making (MCDM) problems are variable rather than constant and stable. So, post-troubleshooting sensitivity analysis can help make accurate decisions [69]. A sensitivity analysis’s primary objective is to assess how the MCDM models modify the ranking of the alternatives when the input variables are slightly altered [70,71]. The sensitivity analysis is carried out to verify the system’s performance [72]. The issue of “How sensitive is the overall decision to make slight changes in the individual weights assigned during the pairwise comparison process?” is answered via a sensitivity analysis. This issue may be answered by adjusting the weights’ values slightly and analyzing how they affect the choice [73]. The priority weighting of the criterion is updated for the sensitivity analysis to reflect the conclusion of the selected alternatives and the rating process. To do the aforementioned, the criteria weights are swapped to check the changes in the ranking of the two methods, Table 10. For example, in Analysis 3, exchanging the C1 and C2 values modified the weight of the second criterion, the index value (Pi) of A2 jumps from 0.2258 to 0.29984 when the priority weights for C1 and C2 are switched. The A2 ranking changes from 4 to 3. Similarly, in the F-VIKOR, the ˜Q j changed and the A2 jumped from 4 to 3. Considering the sensitivity of the F-TOPSIS, and the F-VIKOR, 70% of the top ranking goes to A5 (flyover). As ranked by the experts, providing a flyover appears to be the most viable choice, based on the modifications. Furthermore, A1 (shuttle transport) appears to be the second highest ranked alternative, indicating that instead of using personal vehicles, one must opt for local transport services instead. This ultimately leads to reducing the vehicles per passenger, which might help in reducing the traffic congestion problem.
Table 10.
Sensitivity Analysis and its effect on the fuzzy TOPSIS and the fuzzy VIKOR.
3.6. Impact of the Flyover
The flyover is one of the most popular solutions to reduce congestion and improve travel time over major intersections of busier road networks [74]. A flyover can provide a short-term solution but they are not sustainable in the long run. With the traffic growth over time, a flyover will also tend to choke [75]. Researchers concluded that business people’s monthly income decreased after a flyover construction. Employment opportunities fell at nearby shops, and accidents increased in nearby areas [76]. The qualitative risk analysis revealed that some environmental, social, and economic components were at high risk due to the construction of flyovers [77]. Furthermore, a study suggested that flyovers obstructed and severely damaged pedestrian movement [78]. Taleb and Majumder [79] looked into how newly built flyovers influence the people living nearby. They concluded that some businesses and landowners have seen a decrease in their earnings since the flyover construction. Peiris [80] investigated whether a flyover was a suitable traffic management strategy and realized that the flyover was the scene of 67% of accidents while 74% of incidents at the flyover ends are caused by buses and large trucks. Furthermore, the researcher recorded ten accidents per month, on average, in 2007, which jumped to 36 per month in 2010. Researchers from developed countries are now moving away from the ‘road on bridge’ or flyover approach [81]. Instead, removing these flyovers is more sustainable, keeping in view the current environmental issue of global warming. They noted that the flyover’s drawbacks outweigh its anticipated advantages.
3.7. Impact of the Parking Area
Automobiles have progressively grown to offer a problem to city authorities, particularly in ensuring that the increasing number of automobiles can be managed through road expansion and the development of appropriate parking places [82,83]. The parking issue is crucial, although most people prefer private automobile ownership, which is strongly established in many daily routines [21]. As a result, finding a parking place in congested towns and cities is difficult, resulting in time waste and unnecessary fuel use and contributing to global warming [84,85]. Parking issues can be addressed by notifying users about the important parking trends and availability information for their location via mobile applications installed on drivers’ smartphones or incorporated in vehicles’ infotainment systems [86]. The construction of parking spaces in an elegant manner is crucial to reducing urban congestion [87]. The parking system is a critical component of the municipal traffic system. Its exclusion is directly linked to traffic jams, fatalities, and pollutants. Even though a sound parking system may improve urban mobility and the city’s environment, rather than residents’ quality of life, it is sometimes overlooked in urban planning and transportation [88]. A parking system can help to enhance both urban transportation and the environment. A separate location for car parking should be established to alleviate traffic congestion [89].
3.8. Physical Site Examination
Upon the physical observation of the study site, it was noted that the fruit and vegetable vendors on the roadside are a significant source of traffic congestion at the intersection. Solving this problem can reduce traffic congestion, and the vehicle will pass and move quickly in the intersection. Pedestrians in an un-signalized intersection show barriers for the vehicles, which causes congestion, and most accidents occur in such meetings. Additionally, there is no specific parking point in the Taxila intersection, and most vehicles are parked on the roadside, which causes traffic congestion, Figure 6. The existing parking area is insufficient for this enormous number of vehicles, and there is a need for a new parking area away from the mainstream traffic.
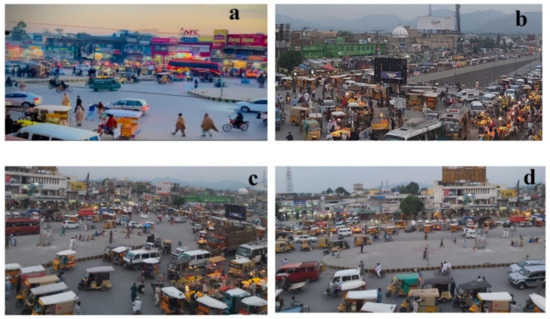
Figure 6.
Congestion Situation at the Taxila intersection with traffic moving, (a) South bound, (b) East bound, (c) North bound, and (d) West bound.
4. Conclusions
Conflicting criteria are found in traffic congestion situations; MCDM can be a valuable method for resolving these conflicts. From an expert’s view, the best alternative is a flyover, which is analyzed from the fuzzy AHP, TOPSIS, and VIKOR. The site data (traffic volume), when analyzed on the AIMSUN software, computed the parking area as the best choice for reducing traffic congestion by comparing delay time, speed, traffic density, and travel time for different alternatives.
Both parking areas and flyovers can reduce traffic congestion. Considering the studied literature, the former is more sustainable than the latter in all aspects of sustainability (social, economic, and environmental). Furthermore, the parking area outweighs the long-term benefits compared to the flyover. Additionally, from the physical site examination, we can conclude that roadside activities interrupted the traffic flow and contributed to congestion. Furthermore, the sensitivity analysis provides shuttle service as the second highest ranking alternative. This could be helpful in the reduction of traffic, due to fewer personal vehicles, by increasing the number of passengers per vehicle.
The inclusion of various perspectives is an important aspect of assessing the urban transportation system. The perspective of local road users, especially related to socio-economic and socio-psychological aspects and driver behavior, needs to be investigated to determine the implications of these alternatives. Additionally, a detailed study regarding the existing policies for mitigating traffic congestion and improving urban mobility and their shortcomings needs to be studied. For future work, more research data can be collected and the study area can be expanded to validate the proposed approach for various intersections.
Author Contributions
Conceptualization, A.R., M.U.A. and A.Z.; Data curation, A.R., U.U. and M.F.; Formal analysis, A.R., M.U.A. and M.F.; Funding acquisition, M.U.A.; Investigation, A.R., M.F. and M.J.A.; Methodology, A.R., M.U.A. and U.U.; Project administration, K.D.K.; Resources, S.H.N.; Software, U.U. and K.D.K.; Supervision, A.Z.; Visualization, M.J.A.; Writing—original draft, A.R., M.U.A. and M.F.; Writing—review & editing, M.J.A., K.D.K., A.Z. and S.H.N. All authors have read and agreed to the published version of the manuscript.
Funding
This research received no external funding.
Institutional Review Board Statement
Not applicable.
Informed Consent Statement
Not applicable.
Data Availability Statement
Not applicable.
Conflicts of Interest
The authors declare no conflict of interest.
Appendix A
Table A1.
Specimen of tally counting for the traffic study.
Table A1.
Specimen of tally counting for the traffic study.
| Traffic Survey Sheet (Tally Counting) | ||||||||
|---|---|---|---|---|---|---|---|---|
| Location: West Bound toward the Taxila Intersection | ||||||||
| Start Time: 07:00 a.m. | End Time: 08:00 a.m. | |||||||
| Time Interval | Motorcycle | Rickshaw | Car | Van | Bus | Light Truck | Heavy Truck | Total |
| 07:00 a.m.–07:15 a.m. | 118 | 105 | 155 | 87 | 11 | 4 | 20 | 500 |
| 07:15 a.m.–07:30 a.m. | 113 | 109 | 161 | 77 | 9 | 3 | 22 | 494 |
| 07:30 a.m.–07:45 a.m. | 121 | 101 | 171 | 81 | 8 | 6 | 23 | 511 |
| 07:45 a.m.–08:00 a.m. | 126 | 110 | 167 | 79 | 14 | 3 | 16 | 515 |
| Total | 478 | 425 | 654 | 324 | 42 | 16 | 81 | 2020 |
Table A2.
Fuzzy scale and its linguistic terms.
Table A2.
Fuzzy scale and its linguistic terms.
| Linguistic Terms | Triangular Fuzzy Numbers | Triangular Fuzzy Numbers |
|---|---|---|
| (Reciprocal) | ||
| Perfect | (8, 9, 10) | (0.1, 0.111, 0.125) |
| Absolute | (7, 8, 9) | (0.11, 0.125, 0.142) |
| Very good | (6, 7, 8) | (0.125, 0.142, 0.166) |
| Fairly good | (5, 6, 7) | (0.142, 0.166, 0.2) |
| Good | (4, 5, 6) | (0.166, 0.2, 0.25) |
| Preferable | (3, 4, 5) | (0.2, 0.25, 0.333) |
| Not Bad | (2, 3, 4) | (0.25, 0.333, 0.5) |
| Weak Advantage | (1, 2, 3) | (0.333, 0.5, 1) |
| Equal | (1, 1, 1) | (1, 1, 1) |
Table A3.
Linguistic scale for TOPSIS.
Table A3.
Linguistic scale for TOPSIS.
| Number | Linguistic Variable | Triangular Fuzzy Number | ||
|---|---|---|---|---|
| l | m | u | ||
| 1 | Very Weak | 0 | 0 | 1 |
| 2 | Weak | 0 | 1 | 3 |
| 3 | Partly Weak | 1 | 3 | 5 |
| 4 | Average | 3 | 5 | 7 |
| 5 | Partly good | 5 | 7 | 9 |
| 6 | Good | 7 | 9 | 10 |
| 7 | Very Good | 9 | 10 | 10 |
Table A4.
Best and worst fuzzy rating for fuzzy VIKOR.
Table A4.
Best and worst fuzzy rating for fuzzy VIKOR.
| f*j | 6.75 | 8.4 | 9.3 | 5 | 6.8 | 8.15 | 4.6 | 6.45 | 8 | 5.45 | 7.25 | 8.65 |
| f-j | 3.9 | 5.7 | 7.2 | 3.85 | 5.35 | 6.8 | 3 | 4.5 | 6.1 | 3.5 | 5.35 | 7.1 |
References
- Pojani, D.; Stead, D. Sustainable Urban Transport in the Developing World: Beyond Megacities. Sustainability 2015, 7, 7784–7805. [Google Scholar] [CrossRef]
- Richardson, B.C. Sustainable Transport: Analysis Frameworks. J. Transp. Geogr. 2005, 13, 29–39. [Google Scholar] [CrossRef]
- Banister, D. Cities, Mobility and Climate Change. J. Transp. Geogr. 2011, 19, 1538–1546. [Google Scholar] [CrossRef]
- Wolny, A.; Ogryzek, M.; Źróbek, R. Towards Sustainable Development and Preventing Exclusions—Determining Road Accessibility at the Sub-Regional and Local Level in Rural Areas of Poland. Sustainability 2019, 11, 4880. [Google Scholar] [CrossRef]
- Griškevičiūtė-Gečienė, A.; Griškevičienė, D. The Influence of Transport Infrastructure Development on Sustainable Living Environment in Lithuania. Procedia Eng. 2016, 134, 215–223. [Google Scholar] [CrossRef]
- Maldonado Silveira Alonso Munhoz, P.A.; da Costa Dias, F.; Kowal Chinelli, C.; Azevedo Guedes, A.L.; Neves dos Santos, J.A.; da Silveira e Silva, W.; Pereira Soares, C.A. Smart Mobility: The Main Drivers for Increasing the Intelligence of Urban Mobility. Sustainability 2020, 12, 10675. [Google Scholar] [CrossRef]
- Noy, K.; Givoni, M. Is ‘Smart Mobility’ Sustainable? Examining the Views and Beliefs of Transport’s Technological Entrepreneurs. Sustainability 2018, 10, 422. [Google Scholar] [CrossRef]
- Nadeem, M.; Azam, M.; Asim, M.; Al-Rashid, M.A.; Puan, O.C.; Campisi, T. Does Bus Rapid Transit System (Brts) Meet the Citizens’ Mobility Needs? Evaluating Performance for the Case of Multan, Pakistan. Sustainability 2021, 13, 7314. [Google Scholar] [CrossRef]
- United Nations Department of Economic and Social Affairs. Sustainable Transport, Sustainable Development. In Proceedings of the Second Global Sustainable Transport Conference, Beijing, China, 14–16 October 2021. [Google Scholar]
- Zhang, K.; Batterman, S. Air Pollution and Health Risks Due to Vehicle Traffic. Sci. Total Environ. 2013, 450, 307–316. [Google Scholar] [CrossRef]
- Banister, D. The Sustainable Mobility Paradigm. Transp. Policy 2008, 15, 73–80. [Google Scholar] [CrossRef]
- Holden, E.; Gilpin, G.; Banister, D. Sustainable Mobility at Thirty. Sustainability 2019, 11, 1965. [Google Scholar] [CrossRef]
- Holden, E.; Banister, D.; Gössling, S.; Gilpin, G.; Linnerud, K. Grand Narratives for Sustainable Mobility: A Conceptual Review. Energy Res. Soc. Sci. 2020, 65, 101454. [Google Scholar] [CrossRef]
- Zapolskytė, S.; Burinskienė, M.; Trépanier, M. Evaluation Criteria of Smart City Mobility System Using MCDM Method. Balt. J. Road Bridg. Eng. 2020, 15, 196–224. [Google Scholar] [CrossRef]
- Hardy, J. Smart City: A Traffic Signal Control System for Reducing the Effects of Traffic Congestion in Urban Environments. Ph.D. Thesis, University of Derby, Derby, UK, 2019. Available online: https://repository.derby.ac.uk/item/943zx/smart-city-a-traffic-signal-control-system-for-reducing-the-effects-of-traffic-congestion-in-urban-environments (accessed on 1 August 2022).
- Schadschneider, A.; Klüpfel, H.; Kretz, T.; Rogsch, C.; Seyfried, A. Fundamentals of Pedestrian and Evacuation Dynamics. In Multi-Agent Systems for Traffic and Transportation Engineering; ResearchGate GmbH: Hershey, PA, USA, 2011. [Google Scholar] [CrossRef]
- Pelechano, N.; Malkawi, A. Evacuation Simulation Models: Challenges in Modeling High Rise Building Evacuation with Cellular Automata Approaches. Autom. Constr. 2008, 17, 377–385. [Google Scholar] [CrossRef]
- Bibri, S.E.; Krogstie, J. The Emerging Data–Driven Smart City and Its Innovative Applied Solutions for Sustainability: The Cases of London and Barcelona. Energy Inform. 2020, 3, 5. [Google Scholar] [CrossRef]
- Aamir, M.; Masroor, S.; Ali, Z.A.; Ting, B.T. Sustainable Framework for Smart Transportation System: A Case Study of Karachi. Wirel. Pers. Commun. 2019, 106, 27–40. [Google Scholar] [CrossRef]
- Jan, B.; Farman, H.; Khan, M.; Talha, M.; Din, I.U. Designing a Smart Transportation System: An Internet of Things and Big Data Approach. IEEE Wirel. Commun. 2019, 26, 73–79. [Google Scholar] [CrossRef]
- Biyik, C.; Allam, Z.; Pieri, G.; Moroni, D.; O’fraifer, M.; O’connell, E.; Olariu, S.; Khalid, M. Smart Parking Systems: Reviewing the Literature, Architecture and Ways Forward. Smart Cities 2021, 4, 623–642. [Google Scholar] [CrossRef]
- Haider, F.; Rehman, Z.U.; Khan, A.H.; Ilyas, M.; Khan, I. Performance Evaluation of Brt Standard in Decision Support System for Integrated Transportation Policy. Sustainability 2021, 13, 1957. [Google Scholar] [CrossRef]
- Kamran, M. An Assessment of Sustainable Urban Transportation System in Pakistan. J. Mech. Contin. Math. Sci. 2019, 14, 470–483. [Google Scholar] [CrossRef]
- Pira, M. A Novel Taxonomy of Smart Sustainable City Indicators. Humanit. Soc. Sci. Commun. 2021, 8, 197. [Google Scholar] [CrossRef]
- Awasthi, A.; Omrani, H.; Gerber, P. Investigating Ideal-Solution Based Multicriteria Decision Making Techniques for Sustainability Evaluation of Urban Mobility Projects. Transp. Res. Part A Policy Pract. 2018, 116, 247–259. [Google Scholar] [CrossRef]
- Sakhapov, R.L.; Nikolaeva, R. V Smart Transport Systems as a Method to Improve the Sustainability of City Transportation Network. IOP Conf. Ser. Earth Environ. Sci. 2021, 666, 032004. [Google Scholar] [CrossRef]
- Sobhani, M.G.; Imtiyaz, M.N.; Azam, M.S.; Hossain, M. A Framework for Analyzing the Competitiveness of Unconventional Modes of Transportation in Developing Cities. Transp. Res. Part A Policy Pract. 2020, 137, 504–518. [Google Scholar] [CrossRef]
- Zhang, Z.; Zhao, X.; Qin, Y.; Si, H.; Zhou, L. Interval Type-2 Fuzzy TOPSIS Approach with Utility Theory for Subway Station Operational Risk Evaluation. J. Ambient Intell. Humaniz. Comput. 2021, 13, 4849–4863. [Google Scholar] [CrossRef]
- Zhang, Z.; Guo, J.; Zhang, H.; Zhou, L.; Wang, M. Product Selection Based on Sentiment Analysis of Online Reviews: An Intuitionistic Fuzzy TODIM Method. Complex Intell. Syst. 2022, 8, 3349–3362. [Google Scholar] [CrossRef]
- Xing, Z.; Zhu, J.; Zhang, Z.; Qin, Y.; Jia, L. Energy Consumption Optimization of Tramway Operation Based on Improved PSO Algorithm. Energy 2022, 258, 124848. [Google Scholar] [CrossRef]
- Senousi, A.M.; Zhang, J.; Shi, W.; Liu, X. Un Marco Propuesto Para La Identificación de Indicadores Para Modelar Ciudades de Alta Frecuencia. ISPRS Int. J. Geo-Inf. 2021, 10, 30. [Google Scholar]
- Güngör, Z.; Serhadlioǧlu, G.; Kesen, S.E. A Fuzzy AHP Approach to Personnel Selection Problem. Appl. Soft Comput. J. 2009, 9, 641–646. [Google Scholar] [CrossRef]
- Pang, G.K.H.; Takahashi, K.; Yokota, T.; Takenaga, H. Adaptive Route Selection for Dynamic Route Guidance System Based on Fuzzy-Neural Approaches. IEEE Trans. Veh. Technol. 1999, 48, 2028–2041. [Google Scholar] [CrossRef][Green Version]
- Farooq, D.; Akram, T. Traffic Flow Analysis and Solutions to Ease Traffic Flow at Unsignalized Taxila Intersection. Period. Polytech. Transp. Eng. 2018, 46, 101–107. [Google Scholar] [CrossRef]
- Findley, D.J.; Cunningham, C.M.; Hummer, J.E. Comparison of Mobile and Manual Data Collection for Roadway Components. Transp. Res. Part C Emerg. Technol. 2011, 19, 521–540. [Google Scholar] [CrossRef]
- Adebisi, O. Improving Manual Counts of Turning Traffic Volumes at Road Junctions. J. Transp. Eng. 1987, 113, 256–267. [Google Scholar] [CrossRef]
- Zheng, P.; Mike, M. An Investigation on the Manual Traffic Count Accuracy. Procedia–Soc. Behav. Sci. 2012, 43, 226–231. [Google Scholar] [CrossRef]
- Barcelo, J.; Casas, J. Dynamic Network Simulation with Aimsun. Oper. Res. Comput. Sci. Interfaces Ser. 2005, 31, 57–98. [Google Scholar] [CrossRef]
- Casas, J.; Ferrer, J.L.; Garcia, D.; Perarnau, J.; Torday, A. Traffic Simulation with Aimsun. In Fundamentals of Traffic Simulation; Springer: Berlin/Heidelberg, Germany, 2010; pp. 173–232. [Google Scholar]
- Hidas, P. Modelling Individual Behaviour in Microsimulation Models. In Proceedings of the 28th Australasian Transport Research Forum, ATRF 05; ATRF: Sydney, Australia, 2005. [Google Scholar]
- Naji, A.J. Assessment of Different Traffic Management Scenarios Using Microscopic Simulation: A Case Study. J. Eng. Sci. 2008, 36, 1347–1360. [Google Scholar] [CrossRef]
- Saaty, T.L. How to Make a Decision: The Analytic Hierarchy Process. Eur. J. Oper. Res. 1990, 48, 9–26. [Google Scholar] [CrossRef]
- Moslem, S.; Ghorbanzadeh, O.; Blaschke, T.; Duleba, S. Analysing Stakeholder Consensus for a Sustainable Transport Development Decision by the Fuzzy AHP and Interval AHP. Sustainability 2019, 11, 3271. [Google Scholar] [CrossRef]
- Ismael, K.; Duleba, S. Investigation of the Relationship between the Perceived Public Transport Service Quality and Satisfaction: A PLS-SEM Technique. Sustainability 2021, 13, 13018. [Google Scholar] [CrossRef]
- Faulin, J.; Juan, A.; Lera, F.; Grasman, S. Solving the Capacitated Vehicle Routing Problem with Environmental Criteria Based on Real Estimations in Road Transportation: A Case Study. Procedia–Soc. Behav. Sci. 2011, 20, 323–334. [Google Scholar] [CrossRef]
- Kechagias, E.P.; Gayialis, S.P.; Konstantakopoulos, G.D.; Papadopoulos, G.A. An Application of an Urban Freight Transportation System for Reduced Environmental Emissions. Systems 2020, 8, 49. [Google Scholar] [CrossRef]
- Singh, A.; Gurtu, A.; Singh, R.K. Selection of Sustainable Transport System: A Case Study. Manag. Environ. Qual. An Int. J. 2021, 32, 100–113. [Google Scholar] [CrossRef]
- Turoń, K.; Kubik, A. Economic Aspects of Driving Various Types of Vehicles in Intelligent Urban Transport Systems, Including Car-Sharing Services and Autonomous Vehicles. Appl. Sci. 2020, 10, 5580. [Google Scholar] [CrossRef]
- Kadkhodaei, M.; Shad, R. Analysis and Evaluation of Traffic Congestion Control Methods in Touristic Metropolis Using Analytical Hierarchy Process (AHP). Civ. Eng. J. 2018, 4, 602. [Google Scholar] [CrossRef]
- Bamwesigye, D.; Hlavackova, P. Analysis of Sustainable Transport for Smart Cities. Sustainability 2019, 11, 2140. [Google Scholar] [CrossRef]
- Ni, D. Signalized Intersections; Springer International Publishing: Cham, Swizerland, 2020; ISBN 978-3-030-38548-4. [Google Scholar]
- Ocalir-Akunal, E.V. Using Decision Support Systems for Transportation Planning Efficiency. IGI Global: Hershey, PA, USA, 2015; 475p. [Google Scholar] [CrossRef]
- Zheng, X.; Yin, Y.; Yang, T. Study on Evaluation Index System of Urban Traffic Improvement Based on Analytic Hierarchy Process. E3S Web Conf. 2021, 237, 04029. [Google Scholar] [CrossRef]
- Zimmermann, H.J. Fuzzy Set Theory. Wiley Interdiscip. Rev. Comput. Stat. 2010, 2, 317–332. [Google Scholar] [CrossRef]
- Ilangkumaran, M.; Kumanan, S. Selection of Maintenance Policy for Textile Industry Using Hybrid Multi-Criteria Decision Making Approach. J. Manuf. Technol. Manag. 2009, 20, 1009–1022. [Google Scholar] [CrossRef]
- Behzadian, M.; Khanmohammadi Otaghsara, S.; Yazdani, M.; Ignatius, J. A State-of the-Art Survey of TOPSIS Applications. Expert Syst. Appl. 2012, 39, 13051–13069. [Google Scholar] [CrossRef]
- Gumus, A.T. Evaluation of Hazardous Waste Transportation Firms by Using a Two Step Fuzzy-AHP and TOPSIS Methodology. Expert Syst. Appl. 2009, 36, 4067–4074. [Google Scholar] [CrossRef]
- Opricovic, S. Programski Paket VIKOR Za Visekriterijumsko Kompromisno Rangiranje. In Proceedings of the 17th International Symposium on Operational Research SYM-OP-IS, Belgrade, Serbia, 9–12 October 1990. [Google Scholar]
- Opricovic, S. Multicriteria Optimization of Civil Engineering Systems. Ph.D. Thesis, Faculty of Civil Engineering, University of Belgrade, Belgrade, Serbia, 1998. [Google Scholar]
- Opricovic, S.; Tzeng, G.-H. Compromise Solution by MCDM Methods: A Comparative Analysis of VIKOR and TOPSIS. Eur. J. Oper. Res. 2004, 156, 445–455. [Google Scholar] [CrossRef]
- Opricovic, S. Fuzzy VIKOR with an Application to Water Resources Planning. Expert Syst. Appl. 2011, 38, 12983–12990. [Google Scholar] [CrossRef]
- Opricovic, S. A Fuzzy Compromise Solution for Multicriteria Problems. Int. J. Uncertain. Fuzziness Knowl.-Based Syst. 2007, 15, 363–380. [Google Scholar] [CrossRef]
- Sayadi, M.K.; Heydari, M.; Shahanaghi, K. Extension of VIKOR Method for Decision Making Problem with Interval Numbers. Appl. Math. Model. 2009, 33, 2257–2262. [Google Scholar] [CrossRef]
- Devi, K. Extension of VIKOR Method in Intuitionistic Fuzzy Environment for Robot Selection. Expert Syst. Appl. 2011, 38, 14163–14168. [Google Scholar] [CrossRef]
- Janjua, S. Evaluation of Water Allocation System and Reservoir Ranking for Indus River Basin: A Hydro-Economic Perspective; Capital University of Sciences and Technology: Islamabad, Pakistan, 2021. [Google Scholar]
- Keeney, R.L.; Raiffa, H. Decisions with Multiple Objectives: Preferences and Value Trade-Offs. IEEE Trans. Syst. Man Cybern. 1979, 9, 403. [Google Scholar] [CrossRef]
- Janjua, S.; Hassan, I. Fuzzy AHP-TOPSIS Multi-Criteria Decision Analysis Applied to the Indus Reservoir System in Pakistan. Water Sci. Technol. Water Supply 2020, 20, 1933–1949. [Google Scholar] [CrossRef]
- Javid, M.A.; Okamura, T.; Nakamura, F.; Tanaka, S.; Wang, R. People’s Behavioral Intentions towards Public Transport in Lahore: Role of Situational Constraints, Mobility Restrictions and Incentives. KSCE J. Civ. Eng. 2016, 20, 401–410. [Google Scholar] [CrossRef]
- Alinezhad, A.; Amini, A.; Alinezhad, A. Sensitivity Analysis of Simple Additive Weighting Method (SAW): The Results of Change in the Weight of One Attribute on the Final Ranking of Alternatives. J. Ind. Eng. 2009, 4, 13–18. [Google Scholar]
- Su, M.M.; Wall, G.; Xu, K. Tourism-Induced Livelihood Changes at Mount Sanqingshan World Heritage Site, China. Environ. Manage. 2016, 57, 1024–1040. [Google Scholar] [CrossRef]
- Kabassi, K.; Martinis, A. Sensitivity Analysis of PROMETHEE II for the Evaluation of Environmental Websites. Appl. Sci. 2021, 11, 9215. [Google Scholar] [CrossRef]
- Yazdi, M. Risk Assessment Based on Novel Intuitionistic Fuzzy-Hybrid-Modified TOPSIS Approach. Saf. Sci. 2018, 110, 438–448. [Google Scholar] [CrossRef]
- Awasthi, A.; Chauhan, S.S.; Omrani, H.; Panahi, A. A Hybrid Approach Based on SERVQUAL and Fuzzy TOPSIS for Evaluating Transportation Service Quality. Comput. Ind. Eng. 2011, 61, 637–646. [Google Scholar] [CrossRef]
- Liyanage, T.U.; Ranasinghe, M.T.; Prasad, M.A. Post Impact Evaluation of Rajagiriya Flyover Evaluation for Intersection. 2018. Available online: https://www.researchgate.net/publication/359281092_Post_Impact_Evaluation_of_Rajagiriya_Flyover (accessed on 1 August 2022).
- Bedada, L.; Advani, M.; Chandra, S.; Juremalani, J. Estimating the Impact of Flyover on Vehicle Delay, Fuel Consumption, and Emissions—A Case Study. Lect. Notes Civ. Eng. 2020, 69, 517–530. [Google Scholar] [CrossRef]
- Taleb, A.; Majumder, S.; Rimon, M.R.I. Impact of Flyovers in Dhaka City of Bangladesh: A Study on the Affected People in the Adjacent Area. Manarat Int. Univ. Stud. 2011, 2, 119–125. [Google Scholar] [CrossRef]
- Martono, D.N.; Gusdini, N. Flyover Development Risk Analysis: Review of the Construction Phase Efforts to Minimize Environmental Impact. IOP Conf. Ser. Earth Environ. Sci. 2021, 940, 012020. [Google Scholar] [CrossRef]
- Arefin, S.; Rashid, T.; Habib, D. Infrastructural Development and Vulnerabilities: A Sociological Study of Two Selected Flyovers in Dhaka City, Bangladesh. Open J. Soc. Sci. 2019, 07, 18–29. [Google Scholar] [CrossRef]
- Taleb, M.A.; Majumder, S. Impact of Flyovers in Dhaka City of Bangladesh on the Affected People in the Adjacent Area. Int. J. Eng. Technol. 2012, 4, 103. [Google Scholar] [CrossRef]
- Peiris, O. V An Examination of the Appropriateness of Flyovers as a Traffic Management Measure to the Road Intersections of Sri Lanka. In Proceedings of the Transport Research Forum 2011, Colombo, Sri Lanka, 25 July 2011; p. 17. [Google Scholar]
- Siegel, C. Removing Freeways—Restoring Cities from Induced Demand to Reduced Demand. Available online: http://www.preservenet.com/freeways/FreewaysInducedReduced.html#Note2 (accessed on 20 July 2022).
- Gössling, S. Why Cities Need to Take Road Space from Cars–and How This Could Be Done. J. Urban Des. 2020, 25, 443–448. [Google Scholar] [CrossRef]
- Fraifer, M.; Fernström, M. Designing an IoT Smart Parking Prototype System. In Proceedings of the Thirty Seventh International Conference on Information Systems, Dublin, Ireland, 11–14 December 2016; Volume 1, pp. 1–12. [Google Scholar]
- Jaller, M.; Holguín-Veras, J.; Hodge, S.D. Parking in the City: Challenges for Freight Traffic. Transp. Res. Rec. 2013, 2379, 46–56. [Google Scholar] [CrossRef]
- Fraifer, M.; Kharel, S.; Elmangoush, A.; Ryan, A.; Elgenaidi, W. It Takes Two to Tango: Merging Science and Creativity to Support Continued Innovation in the IoT Domain. Adv. Sci. Technol. Eng. Syst. J. 2018, 3, 82–91. [Google Scholar] [CrossRef]
- Shinde, S.; Bhagwat, S.; Pharate, S.; Paymode, V. Prediction of Parking Availability in Car Parks Using Sensors and IoT: SPS. Int. J. Eng. Sci. Comput. 2016, 6, 4751–4756. [Google Scholar]
- Shen, T.; Hong, Y.; Thompson, M.M.; Liu, J.; Huo, X.; Wu, L. How Does Parking Availability Interplay with the Land Use and Affect Traffic Congestion in Urban Areas? The Case Study of Xi’an, China. Sustain. Cities Soc. 2020, 57, 102126. [Google Scholar] [CrossRef]
- Ibrahim, H.E.-D. Car Parking Problem in Urban Areas, Causes and Solutions. SSRN Electron. J. 2017. [Google Scholar] [CrossRef]
- Prakash, P.; Bandyopadhyaya, R.; Sinha, S. Study of Effect of On-Street Parking on Traffic Capacity. In Lecture Notes in Civil Engineering; Springer: Singapore, 2020; Volume 45, pp. 409–417. ISBN 9789813290426. [Google Scholar]
Publisher’s Note: MDPI stays neutral with regard to jurisdictional claims in published maps and institutional affiliations. |
© 2022 by the authors. Licensee MDPI, Basel, Switzerland. This article is an open access article distributed under the terms and conditions of the Creative Commons Attribution (CC BY) license (https://creativecommons.org/licenses/by/4.0/).