Article

Sustainable Food Consumption: Demand for Local Produce in Singapore

Lee Kuan Yew School of Public Policy, National University of Singapore, Singapore 259772, Singapore
Sustainability 2022, 14(19), 12330; https://doi.org/10.3390/su141912330
Submission received: 22 July 2022 / Revised: 21 September 2022 / Accepted: 23 September 2022 / Published: 28 September 2022

Abstract

:
The rapid pace of climate change has exacerbated Singapore’s ever-present vulnerability to food shortages. While most of Singapore’s current food supply is imported, the country is working towards becoming self-sufficient in at least 30% of its food demand by 2030. Though a high proportion of Singaporeans have pro-environmental views and believe that buying locally grown food is more eco-friendly, the demand for local produce remains low. To better understand the cause of this attitude–behaviour gap, this study investigated the factors influencing the purchasing decisions of local consumers, as well as their willingness to pay a premium for locally produced vegetables, eggs, and seafood in Singapore. The estimation results suggested that what primarily hinders the local produce demand of consumers with positive perceptions towards sustainability is not their income or product price. Instead, product-specific factors, such as freshness and quality of the produce, and easiness to identify the product at store were found to be positively associated with local produce purchase. Ensuring these factors can potentially lead to higher demand for local produce in Singapore. Attitudes and behaviours related to sustainability played a larger role in the willingness to pay (WTP) than purchase decision making. Thus, to enhance the WTP for local produce, educating the public regarding the sustainability aspect of local produce may prove to be effective.

1. Introduction

Food security has become one of the most pressing issues of the present day. The Food and Agriculture Organization (FAO) has reported that over the past 6 years, food security has increased in severity across the globe, and affected thirty percent of the world’s population [1]. The situation is likely to deteriorate even further, given the adverse ramifications of food scarcity in recent years, including a record high input price/Global Input Price Index (GIPI) value in 2021 and an all-time high global import bill in 2022 [2]. In the past two years, the COVID-19 pandemic also revealed or intensified vulnerabilities in the global food production and supply chain. Other major challenges are also caused by rising input costs, the ongoing war in Ukraine [2], and stagnant productivity growth owing to inadequate investment in research and development for agricultural technology [3].
Another factor exacerbating the problem of food insecurity is climate change, which has effects at both the industry and household levels [4]. The FAO noted that more countries are beginning to experience climate extremes, with casualties rising from 76% of low- and middle-income countries in 2000–2004 to 98% in 2015–2020 [1]. On a more granular level, Niles and Salerno [5] found that 71% of households surveyed across several continents had felt the effects of climate shocks in the preceding five years, and 54% experienced food insecurity for at least one month annually. Lee, Nadolnyak, & Hartarska [6] also found that higher temperatures during the fall season are detrimental to agricultural activities in South and Southeast Asia, while the overall rise in annual temperatures has depleted crops in Asian countries. The effects are also predicted to persist in the upcoming decades. For example, in Tanzania, the current rate of climate change is expected to reduce average agricultural production by more than 10% [7].
While climate change affects food production, food consumption contributes to climate change and environmental degradation, and its impact is expected to grow given the growing global population [8,9,10,11]. Transitioning towards more sustainable food consumption, therefore, is becoming more and more important [12,13,14]. Although it has been widely studied, the definition of sustainable food consumption has not yet been universally agreed upon. The UK Sustainable Development Commission [15] defines sustainable food as healthy, safe, and hygienic produce which is able to meet global needs, provides viable livelihood for farmers, processors, and retailers, supports rural economics, and respects biophysical and environmental limits, all the while reducing energy consumption and improving the wider environment; respects the highest standards of animal health and welfare compatible with the production of affordable food for all societal sectors; and supports rural economies and the diversity of rural culture, in particular by emphasizing local products that keep food miles to a minimum.
As the decision-making process of sustainable food consumption is complex, a wide range of potential determinants has been studied and identified to understand it better. For example, the level of income is found to be an important factor that influences sustainable food consumption preference [11,16]. Thøgersen also reports that sustainable food consumption is impacted by food-related lifestyle, which depends on the country of residence [11]. These differences in sustainable consumption across countries are the reasons why a single factor cannot explain the variance observed in sustainable consumption [17]. This suggests that understanding the factors influencing sustainable food consumption requires careful consideration of country-specific contexts.
In Singapore, food scarcity is also considered an imminent possibility. Despite ranking very high in the food availability and affordability criteria in the Global Food Security Index 2021, the country is facing potential instability from exposure to climate risks [18]. Importantly, Singapore sources most of its food supply from overseas, while local food production contributes to a mere 10% of the total consumption [19].
In response, the Singapore government has acknowledged the need to pursue a more sustainable food supply chain to ensure the country’s food security. According to the Green Plan 2030, Singapore has set a target to increase domestic food production such that it sustains at least 30 percent of locals’ nutritional needs by 2030. This plan is termed “30 by 30”. The country aims to achieve this goal by optimising its use of technology, and investing in research and development on “sustainable urban food production” [20]. First, to tackle the challenge of land scarcity, which has impeded the city’s capability to grow local produce on a large scale, Singapore has utilized various technologies such as vertical farming, aquaculture, and aquaponics, which is a combination of hydroponic farming and aquaculture [21]. Second, a number of farms have adopted information and communication technology (ICT) in the farming management, such as Internet of Things (IoT), cloud computing, and smart systems to improve their operations and make them more efficient. Third, several farms have adopted or invested in renewable sources of energy, such as solar panels for powering up the farm and electric vehicles for transporting the produce [22].
Singapore also granted more licenses to operate food farms, leading to the increase in number of local food farms from 221 in 2019 to 260 in 2021, consisting of 150 land-based farms and 110 sea-based farms [19,23]. The licenses granted by the Singapore Food Agency (SFA) are to ensure that each farm has a secure plan and premise in place and meets the benchmark/minimum safety and sanitary conditions [24]. The increase in the number of licensed farms has led to a 13% increase in total production value of eggs, vegetables, and seafood, from SGD (Singapore dollar) 163.4 million (equivalent to USD 119.3 million) in 2020 to SGD 185.2 million (USD 135.2 million) in 2021 [19]. The country has also seen a steady growth in the production of hen shell eggs, with the quantum rising from 528.1 million in 2019 to 643.7 million in 2021 [19]. Hen shell eggs are currently the highest consumed local produce, contributing to nearly one-third of the total egg consumption in 2021. However, consumption of other local produce also needs to be encouraged further, as local vegetables and seafoods approximately contribute merely 4% and 7–8% to the total consumption, respectively [19]. Moreover, local production of vegetables and seafoods had taken a decline during the COVID-19 pandemic in 2020, resulting in lower supply of local produce [19]. It is reported that the price of local produce is higher by between 10 to 20% compared to produce from other regions, such as Malaysia [25], thereby potentially making local produce less attractive in the eyes of the average consumer.
Besides low market demand, another problem threatening the survival of local farms in Singapore is immense competition face by producers to secure contracts with large supermarket companies to distribute their products efficiently. This is important especially for small scale farmers as it allows them to keep the distribution costs low. Additionally, major food retailers such as NTUC Fairprice, Dairy Farm International, and Sheng Siong account for more than 50% of Singapore’s market share [26]. However, competition for agricultural products in Singapore market is becoming more intense [26], providing barriers for local farms to enter the market, which may lead to a majority of local farms facing higher than desired distribution costs.
In order to boost demand for local produce, the Singapore government, through the Singapore Food Agency (SFA), has set up several policies and programs targeted at both producers and consumers. For producers, the SFA has allocated a total of SGD 144 million to improve research and development (R&D) in sustainable food production, innovation, and safety [19]. The policy aims to enable industries to increase productivity and cost efficiency.
Beyond supply side policies, there is scope for the government to introduce demand management policies that encourage locals to shift their consumption preferences from imported foods to local produce. In 2020, the SFA set up a Singapore Food Story campaign, which was publicised through various media outlets, including government websites and social media platforms. Additionally, the SFA designed a set of logos to help buyers recognize local produce. The logos have since been printed on the packaging of local produce. The designs include: a 1-star badge to identify locally grown fresh produce; a 2-star badge to identify fresh produce from farms which adhere to Good Agricultural Practice (GAP) standard; and a 3-star badge to identify fresh produce which are quality assured and sustainably grown [27]. The government has also partnered with the Singapore Agro-Food Enterprises Federation Limited (SAFEF) in organising the ‘SG Farmers’ Market’ at various community spaces and online platform, such as Lazada and Redmart which are common online shopping site in Singapore [28]. This alternative market allows consumers to easily purchase local produce both through offline and online platforms.
In Singapore, locally grown food has also been contextualized as an environmentally sustainable food option, as it is associated with environmentally sustainable food chain. In fact, purchasing locally produced products can be a way to become more environmentally sustainable [29], as producing locally reduces the amount of greenhouse gas emissions emitted from transportation and the water and land use in the farming process [30,31]. A survey by the National Climate Change Secretariat (NCCS), Prime Minister’s Office shows that more than 90% of Singapore residents have awareness of climate change and its impact, while nearly 80% are willing to take action to fight climate change. At the same time, a study shows that while 88% of Singaporeans know that buying locally grown food is more eco-friendly, only 14% purchase products that are sourced locally or within the Southeast Asia region every time they shop [25]. Why do consumers have a favourable attitude towards sustainability and an intention to consume sustainable food, yet it does not translate into action? This attitude–behaviour, or, intention–behaviour gap can be caused by various factors. One potential reason is information deficit, with only 65% of consumers being able to determine whether a product was locally produced [32]. A number of studies investigate these gaps with respect to sustainable food consumption and find factors such as wealth level, price, environmental view, availability, and convenience as other potential reasons [10,33,34,35,36,37,38].
With regard to locally produced food, numerous studies have been carried out to understand the consumer decision-making patterns. Feldmann and Hamm [39] conducted a literature review for the topic and found 550 scientific articles between January 2000 and January 2014. However, they foreground that there is no universally accepted definition for ‘local’, because many of the articles reviewed used different criteria for determining whether food products qualified as ‘local’, such as proximity or distance, emotional and social context, and political boundaries (states, provinces, or countries). For the context of this paper, ‘local food’ is defined as food products which are produced within the country.
The findings regarding the influence of environmental view on local food purchase is mixed. While Yue and Tong [40] find it to be an importance factor affecting purchase decision, Zepeda and Li [41] report that it does not affect the actual purchase. In some areas which are known to have strong agricultural prominence, consumers tend to favour local production as the produce are perceived to have higher quality, as well as better freshness and taste [40,42,43,44]. Furthermore, consumers’ perception on local foods’ quasipublic elements, such as the product’s contribution to the local economy and the environment, have proven to be a determinant of consumption decisions [45,46,47,48]. However, many studies affirmed that despite large support for local produce, accessibility and price also play a part in shaping consumer preferences [48]. Adams and Adams [42], for instance, conducted a cluster analysis in their study and suggested that consumers’ motivation for purchasing local foods is a dynamic interaction between their perceptions about the food system, socioeconomic characteristics of the consumers, and the ease of accessibility of the local foods.
Some researchers have also dig deeper to understand consumers’ preference toward local produce by investigating their premiums and willingness to pay (WTP). Gaining insights about consumers’ WTP for local food can provide policymakers with useful knowledge to devise and implement policies to promote such products [49]. Printezis et al. [49] reviewed research papers on consumers’ WTP for local food and the number of such studies to be increasing since early 2020s as the shift toward local foods became noticeable. Most of these studies show that consumers are willing to pay for the “local” attribute of varieties of food items in different countries [50,51,52,53,54,55,56] although Printezis et al. [49] point out that it may be overestimated due to publication selection bias.
People’s willingness to pay for local produce has been attributed to multiple factors, ranging from individuals’ lifestyles and consumption habits, such as cooking frequency and attention to nutritional value [57]; perceptions of product quality, including taste, freshness, and nutrition; perception of the products’ quasipublic factors [45,58]; accessibility and affordability [48]; income [50,51,59,60]; gender [47,60,61], environmental concern as well as education [60]. On the other hand, age was not found to influence willingness to pay for local produce [47,50,61].
Fan, Gómez, & Coles [36] found in the case of California that if a product contains information that it is locally produced, there will be an increase in consumers’ WTP for that product and their judgment regarding the product’s quality would be more positive. In a survey conducted by Profeta & Hamm [62] amongst German consumers, it was reported that 60% of the subjects exhibited a higher WTP for local animal products if the animals consumed local feed during the rearing process. Another study conducted in South Carolina, United States, showed that consumers are willing to pay an average premium of 27% for local produce and 23% for local animal products [47]. However, a contradictory result was also found by Brown [60] from a study conducted in Missouri, United States, where only one-fifth of the consumers expressed their WTP at a premium of at least 5% for locally grown foods.
Despite recent efforts to increase the demand for local produce in Singapore, research on Singaporean consumers’ local produce purchasing behaviour is non-existent. The current study aims to understand the demand for local produce in Singapore by conducting a survey to local consumers. Based on the findings by existing literature, the analysis includes various factors influencing consumers’ purchase behaviour: consumers’ perception of environmental issues; economic factors (price, household income level); practical factors (accessibility, availability, quality); accessibility (easiness to identify); as well as other household socioeconomic attributes. One additional factor this study considers is consumers’ willingness to support the local farmers/the country’s food security objective. This is relevant in Singapore context, as the local produce is promoted as something Singaporeans should be proud of, and is regarded as a means to ensure food security. Further, the survey asks the consumers about their WTP for the local produce, which enables additional analysis to gain insights that are useful for marketing local produce.

2. Data and Methodology

2.1. Data

For this research, descriptive and quantitative analyses are conducted on the collected data to understand the factors affecting the demand for locally produced foods. For data collection, an online survey was conducted in January and February 2022, where 7891 people were invited to participate. The participants were chosen through a registered panel by filtering consumers who carry out grocery shopping at least once a week. From the criteria, a dataset of 400 eligible participants was compiled, while 414 people accepted the invitation but were screened out as they do not conduct grocery shopping. The first section of the questionnaire asked about the consumers’ socioeconomic characteristics. The second section, as shown in Table 1, asked about perceptions and behaviours related to climate change. The third section inquired about consumption behaviour and purchase reasons for three kinds of local produces, namely leafy vegetables, eggs, and fish/seafood, as listed in Table 2. These categories are selected as the variables of interest as these items are the most consumed local produce in Singapore. The survey participants were asked on the frequency of purchase for local produce under three choices: “never”; “sometimes (once or twice a month)”; and “always (almost every week)”.
The fourth section asked about the hypothetical willingness to pay for seven types of local produce under the categories of eggs, vegetables, and fish or seafood: lettuce; leafy vegetables (e.g., nai bai, xiao bai cai); leafy vegetables for salad (e.g., salad spinach, rocket salad, kale); herbs (e.g., rosemary, basil, mint); eggs; seabass; barramundi; and red snapper). These items were chosen instead of food category to account for differences in price point amongst various food types. The willingness to pay is grouped into three categories: not willing to pay more; up to 5% higher; and more than 5%.

2.2. Estimation Methodology

2.2.1. Purchasing Behaviour

To understand what drives consumers to purchase local produce, I apply the ordered probit model, as purchase frequency, our dependent variable, is ordinal. The probability of each purchase frequency for vegetables, eggs, and fish is estimated as
y i   * = x i β + ε i
where y i * is the latent variable for consumer i’s frequency of purchasing local produce; x i is a vector of observed independent variables including gender, age, nationality, ethnicity, household size, income level, education level, whether a consumer cooks for a children under 12 years old, pro-environmental views and behaviour (see Table 1), as well as the reasons for purchase (see Table 2), and β is the vector of coefficients to be estimated. The probabilities that a consumer selects “never purchase” (=0), “sometimes purchase” (=1), and “always purchase” (=2), respectively are given as
P ( y i = 0 | x i ) = 1 Φ   ( x i   β ) P ( y i = 1 | x i ) = Φ   ( μ x i   β ) Φ   ( x i   β ) P ( y i = 2 | x i ) = 1 Φ   ( μ x i   β )
where μ is the threshold level.

2.2.2. Willingness to Pay

The participants were asked about their willingness to pay for seven different types of local produce, which are commonly sold in Singapore. The respondents were asked to indicate the premium that they were willing to pay for the local produce, by selecting from five possible options: not willing to pay more; up to 5% higher; and more than 5% higher. Upon processing the answers, the result shows that the percentage of the last two categories (11–15% higher and 16–20% higher) are small. Therefore, the last three categories were combined into one category “higher than 5%”. This yielded a dependent variable, y, which takes the following values: zero if the selected premium is “not willing to pay more”, one if the selected premium is “up to 5% higher”, and two if the selected premium is “higher than 5%”.
Given the ordinal nature of dependent variable, I apply the ordered probit model in the same manner as Equation (1), which is specified as
y i   * = x i Υ + η i
where y i * is the latent variable for consumer i’s willingness to pay the premium for local produce; x i is a vector of observed independent variables––these are same variables as those included in the question, except for reasons for purchase.

3. Descriptive Analysis

3.1. Socioeconomic Characteristics

In this section, I summarize the characteristics of the respondents who participated in the survey and compare relevant variables to national statistics to account for representativeness, such as their age, ethnicity, income level, and education level. As shown in Table 3, amongst the 400 respondents, 49% were male, the median age was 45 years old, and 89% were Singapore citizens. As a comparison, 49% of Singapore demographic are male, with the median population age of 42.5, and Singapore citizens account for 73% of the total population [63,64]. With regard to ethnic composition of the respondents, 76% were Chinese, 16% Malay, 9% Indian, and 3% others. As Singapore’s population is composed of 74% Chinese, 14% Malays, 9% Indians, and 3% other ethnicities [65], the respondents’ ethnicity could be considered representative of the population diversity. Using a dummy variable, I categorized households with a monthly income greater than SGD 10,000 (USD 7300) as “high income”, and 35% of the surveyed households belonged to this category. The surveyed data of high-income household do not deviate from the national statistics of 40% [65]. The majority of the respondents had a high level of education, with 66% having university-level education or above. With regard to cooking habits, 24% denoted that they cook for children that are under 12 years old.

3.2. Surveyed Singapore Consumers’ Purchase Frequency of Local Produces

Table 4 summarizes the respondents’ purchase frequency of local produce. Corresponding with the data obtained from Department of Statistics Singapore, eggs are the highest consumed local food in Singapore, with nearly 50% of the country’s consumers purchasing eggs almost every week. Approximately 40% of consumers regularly purchase local leafy vegetables. Relative to that, much fewer people, 23% of the respondents, purchase locally produced fish/seafood on a regular basis.

3.3. Surveyed Singapore Consumers’ Perception and Behaviour Related to Environmental Issues

In the survey, respondents were asked questions targeted at identifying their perceptions and behaviours related to environmental issues and the behaviours they have exhibited to fight climate change. The responses are consistent with a similar survey conducted by The National Climate Change Secretariat (NCCS), Prime Minister’s Office, which showed that more than 90% of Singapore residents have awareness of climate change and its impact, while nearly 80% are willing to take action to fight climate change [66]. The responses are summarized in Figure 1, Figure 2, Figure 3 and Figure 4 for each broader category.
The majority of respondents agreed on the importance of taking an action to climate change. However, approximately 16% of respondents disagreed that individual actions would make a difference in the fight against climate change. Instead, a larger proportion of respondents emphasized the importance of collective action, especially by the government, businesses, and community groups (Figure 1).
Nearly 90% of respondents agreed that Singapore should make a shift towards a low-carbon economy. However, when faced with the additional condition that consumers are expected to bear additional costs and convenience, the proportion of respondents agreeing dropped to 82% (Figure 2).
The survey also revealed that the majority of people in Singapore are aware of the imminent effects of climate change, including its disruption to the ecosystem, rising sea levels, and threats to global food security. The most acknowledged impact of climate change by the respondents was that of rising sea levels, possibly because the effect is forecast to be the most devastating to the island-state of Singapore (Figure 3).
In regard to individual actions to fight climate change, approximately 90% of respondents reported having already made efforts to conserve water and reduce food wastage in their daily lives. Meanwhile, a smaller proportion of respondents, around 80%, reported having made an effort to eat more vegetables and less meat (Figure 4).
To further understand how Singapore consumers’ perception and behaviour related to environmental issues, I used ordinary least squares to examine how the socioeconomic attributes of the consumer are associated with purchase behaviour. The results summarized in Table 5 show that that income has a positive association with most of the perceptions and behaviour. Age is positively associated the behavioural indicators (making effort to fight climate change) as well, while education is negatively associated with some perception-related variables.

3.4. Willingness to Pay for Local Produce

Table 6 shows the respondents’ willingness to pay a premium for seven types of local produce, compared to the price of imported produce. In general, more people are willing to pay a higher price than imported counterparts for locally produced fish, such as seabass barramundi and red snapper, compared to local vegetables and eggs. However, a majority (36–41% of the total respondents) of those willing to pay higher would only pay up to 5% more, and around 17–19% of them willing to pay more than 5% higher than the local price.

4. Estimation Results

4.1. Purchasing Behaviour

In this section, I estimate the factors influencing the consumers’ purchasing behaviour with regard to the local food produce. Explanatory variables include perception and behaviour of respondents about the environment, product-specific factors such as quality and freshness, and households’ socioeconomic attributes in order to investigate what can potentially close the attitude–behaviour or intention–behaviour gap. Table 7 reports the results of the ordered probit model on purchasing behaviour, run for three types of local produce: vegetable, eggs, and fish/seafood. To address the potential issue with skewness of the responses regarding environmental perception and behaviour, the responses on a scale of 1 to 6 are converted into percentiles. As described in the methodology section, the dependent variable, purchase behaviour, is an ordinal variable with three ordered categories based on the purchase frequency: never purchase, sometimes purchase (once or twice a month), and always purchase.
The results indicate that certain perception and behaviour characteristics are associated with consumers’ preference for locally produced vegetables, eggs, and fish. The previous findings regarding the role of environmental attitudes in local produce purchase were mixed [40,41]. The estimation results of the current study suggest that its effect is modest. Respondents who believe that the government has a part to play in fighting climate change purchase local eggs more often, while those who highlight the same role for businesses purchase local eggs less often. Comparably, respondents who believe that NGOs have a role to play in fighting climate change purchase local fish more often. Amongst respondents who hold pro-environmental views and exhibit pro-environmental behaviours, those who make an effort to consume less meat and eat more vegetables purchase local vegetables more often. On the contrary, the same group purchase local eggs less often. Meanwhile, the respondents who exhibit another climate change-combating behaviour of conserving water, are found to buy local eggs more often.
As for the reasons for purchase, quality and freshness are positively associated with the purchase frequency of the local produce, which is consistent with findings by a number of studies [40,42,43,44]. For vegetables, affordable price, environmental reasons, easiness to identify local products, and inclination to support local farmers/food security also influence the purchase decisions positively. This corroborates the findings of Yue and Tong that report support for local economy [40], accessibility [44], and price [48] to be significant factors influencing purchase of local produce.
Analysis for household attributes shows that age has a positive association with local vegetables purchase frequency, indicating that older people purchase local vegetables more often. As Henseleit, Kubitzki, and Teuber [67] explains, this may be because older people generally have stronger connection with their home region. The purchase frequency of local fish is higher for Singaporean citizens/Permanent Residents (PRs), while it is lower for the Chinese. There is a positive association between household size and frequent purchase of locally produced fish. Households with higher income (above SGD 10,000) and those who cook for children aged below 12 are found to purchase local fish more frequently. One possible explanation is that households with children are more conscious about the nutritional intake of their children, as studies indicate that parental role and behaviours affect children’s diet quality [68,69].
Overall results reveal that neither consumers’ environment-related perceptions and behavioural traits, product price nor household income level are the primary drivers of local produce purchase. Rather, factors specific to produce such as its quality, freshness, accessibility were found to increase the frequency of local produce purchase. Ensuring the quality and freshness of the products, easiness to identify the products, as well as to promote the products as a way to support local farmers and food security can be the determining factors to enhance demand for the local produce.

4.2. Willingness to Pay for Local Produce

Next, I analyse the consumers’ willingness to pay the premium for local produce to understand what type of consumers are more likely to pay higher premium. Table 8 summarizes the estimation results of the ordered probit model on the willingness to pay for local foods. All survey participants were asked how much they were willing to pay higher than the price of the imported produce for seven different types of local produce as described in the methodology section. In Table 8, the results for two types of local produces, leafy vegetables and herbs, are not included as the results for these food items are qualitatively similar to other food items. A table including results for all the food items can be found in Table A1 in Appendix A.
The results show that consumers who expressed willingness to pay more for local food have varied characteristics. Respondents’ perception and behaviour related to environmental issues are positively associated with some of the results for the willingness to pay. First, consumers who believe in collective action by the NGO groups are willing to pay more for all the products. Consumers who think that Singapore should make a shift to a low-carbon economy are willing to pay a higher premium for most of the varieties. Additionally, consumers who were already making efforts to fight climate change by eating more vegetables and less meat also exhibited willingness to pay higher premiums for some vegetables. These results are consistent with Brown’s [60] finding that those with higher environmental concerns are willing to pay more for local products.
Among socioeconomic characteristics, the income level shows a strong and positive association with the willingness to pay. Consumers with high incomes are willing to pay higher premiums for all the local produce, which confirms previous findings by some studies [50,51,59,60]. Though age was not found to be a determinant of willingness to pay in previous studies [47,50,61], age is negatively associated with the willingness to pay for most of the food varieties, meaning younger consumers are willing to pay higher premium for most of the local vegetables and fish. Ethnicity also impacts one’s willingness to pay, as non-Chinese are found to be willing to pay more for some local vegetables, as well as fish. For gender, the previous findings were mixed. Carpio and Isengildina-Massa [47] and Brown [60] find female consumers to be willing to pay more while Darby et al. [61] find male consumers to be willing to pay more. In this study, gender does not seem to play an important role as the only association observed is a positive one between male consumers and their willingness to pay for some local vegetables.
Compared to the estimation results for purchase, environmental attitudes and behaviour seem to play a larger role in WTP for local produce. As expected, income level does matter. However, emphasizing the connection between environmental sustainability and local produce could enhance consumers’ WTP for local produce in Singapore.

5. Discussion and Conclusions

Sustainable food consumption has become a critical issue today under the pressure of population growth and climate change. In Singapore, food security is threatened by these factors particularly due to its low food self-sufficiency, and this is also why the Singapore government now aims to enhance local production dramatically. This study attempted to better understand the demand for local produce in Singapore by investigating the factors influencing the purchasing decisions of local consumers, as well as their willingness to pay a premium for locally produced eggs, vegetables, and seafood in Singapore. Understanding what drives consumer demand for local produce is crucial for designing future policies targeted at achieving the “30 by 30” goal. The findings of this study can inform policymakers and businesses on what specific markets for local food they can direct their efforts at developing, as well as what marketing strategies they can adopt to better appeal to local consumers.
An online survey was conducted, with questions focusing on identifying consumers’ socioeconomic characteristics, their perceptions and actions with regard to environmental issues, their purchasing behaviour with regard to local produce, and their willingness to pay a premium for it vis à vis their imported counterparts. Responses from 400 participants were analysed to investigate the factors influencing consumers’ purchasing decisions and their willingness to pay a premium for local foods.
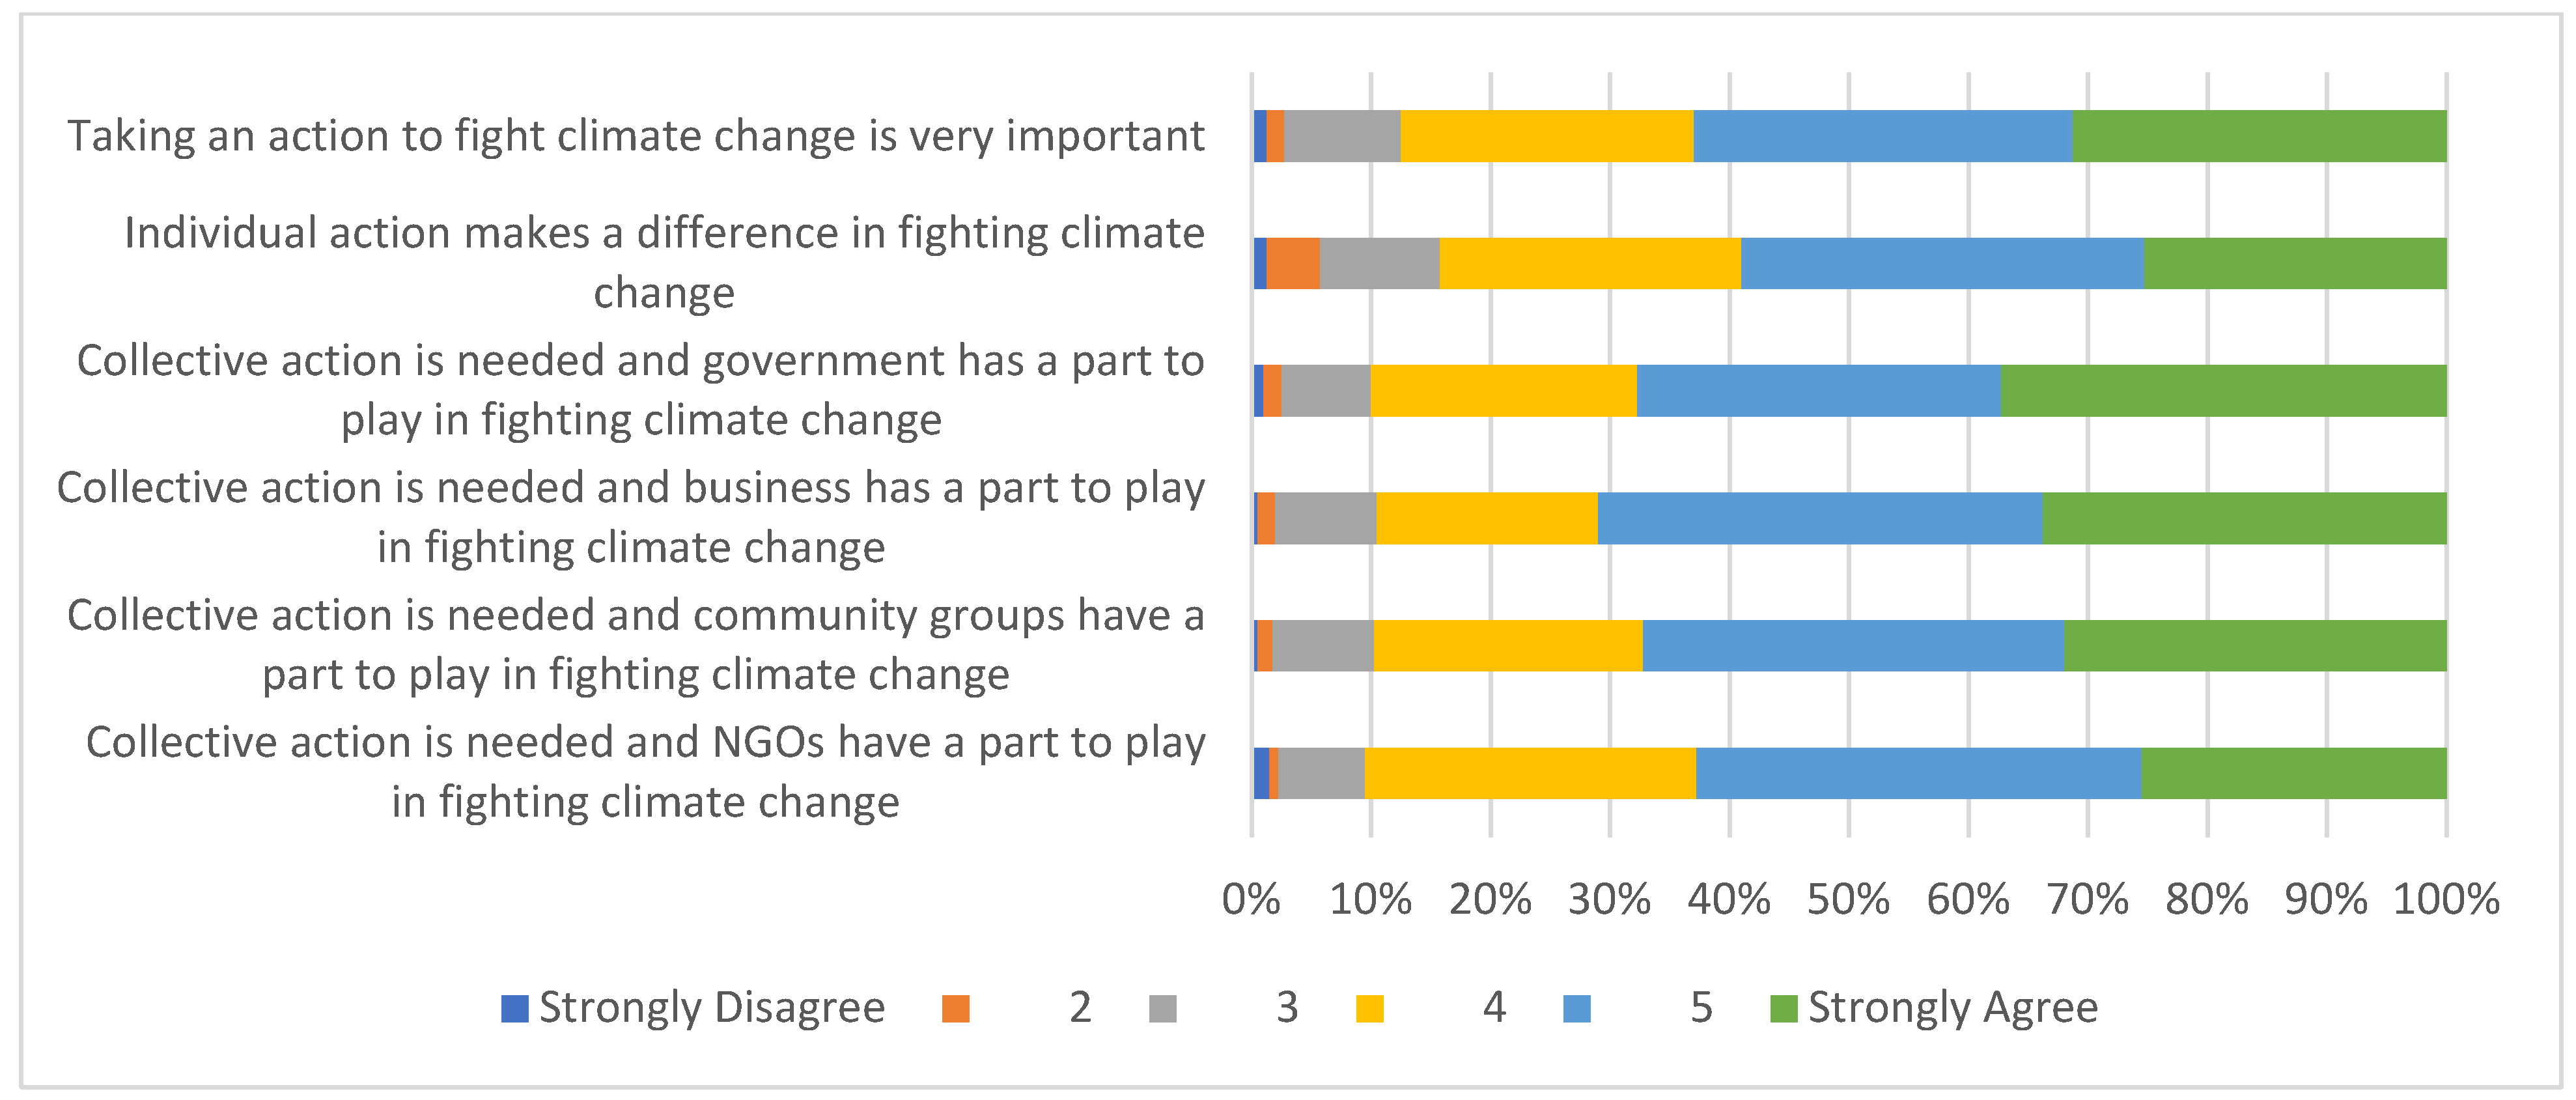
First, it was confirmed that extremely high proportion (nearly 90%) of consumers believe that it is important to make a shift towards a low-carbon economy as well as to make actions to fight climate change, which is consistent with the findings of the survey conducted by The National Climate Change Secretariat (NCCS). This suggests that the estimation results will shed light on the causes for attitude/intention–behaviour gap where people have positive attitude regarding sustainability or intention to purchase local food, but it does not translate into action.
The estimation results for purchasing local produce showed that environmental attitudes or behaviour traits are not the main drivers for demand for local produce despite the high proportion of the population with pro-environmental views. This finding is similar to the study by Zepeda and Li [41] reporting that environmental attitudes do not affect the actual purchase.
Instead, what was found to influence local produce purchase were product-specific factors, such as its quality, freshness, and easiness to identify at the store show, which corroborates previous studies [40,42,43,44] conducted in other countries. Some of the ways the policymakers and businesses could leverage on this finding to enhance the demand could be via: (i) ensuring appropriate packaging by the producer by adding origin labels; (ii) placing advertisements at the store to make it easy to identify the local produce, and (iii) promotion by the government through awareness campaigns to highlight the high quality of local produce.
Similarly, our analysis also showed that support for local farmers/Singapore’s food security has a strong and positive impact on the purchase decisions on local vegetable, which is supported by the finding by Yue and Tong [40] that report support for local economy promoted local produce purchase. This could be because of greater awareness and exposure, as consumers can readily access information pertaining to local vegetable farmers via food blogs and similar websites in Singapore. Extending this argument, policymakers and businesses may be able to reap similar results in the other categories as well, by making local egg and fish producers more visible to consumers and thus potentially motivating them to support local producers.
Household size, nationality, ethnicity, and whether they cook for children under 12 years old were also found to be associated with purchase, though only for fish.
As for the willingness to pay (WTP) for local produce, more than half of the surveyed consumers were willing to pay higher price for local produce compared to the imported. Overall, the results pertaining to the WTP for local produce suggest that environmental perception and behaviour do positively affect consumers’ WTP, which confirms findings by Brown’s [60] that consumers with higher environmental concerns are willing to pay more for local products. Income level also showed a strong positive association with WTP, which corroborates findings by a number of studies [50,51,59,60]. Though age was not found to be a determinant of willingness to pay in previous studies [47,50,61], this study identified younger consumers to have higher WTP. Pro-environmental views and behaviour were found to influence WTP more than they influence purchase decision.
In light of the aforementioned results, it is suggested that what is primarily hindering the local produce demand of consumers with positive perceptions towards sustainability is not their income or product price. Rather, what is important in their purchase decisions seems to be product-specific factors, such as freshness and quality, as well as easiness to identify the product at store. Ensuring these factors can potentially lead to higher demand for local produce in Singapore. Support for local framers and Singapore’s food security was also found to be a driver for the purchase. Promoting and emphasizing the link between local produce and these can motivate the consumers to purchase local produce more often.
Meanwhile, attitudes and behavioural traits related to sustainability played a larger role in WTP than in purchase decision-making. This implies that if local produce prices are set higher than their imported counterparts, then it is pertinent that the policymakers and businesses invest in ensuring that the consumers understand the potential pro-environmental contributions of such a decision.
In addition, this study highlights the importance of understanding the demand for different varieties of local produce to better inform producers and policymakers in designing the associated campaigns and marketing, as our analysis reveals that factors influencing their purchase decision and WTP vary by food category.
One major limitation of this study is the representativeness of the study sample. First, recruitment was based on limited panels registered with a survey company. Second, the selection was not random, which may have resulted in participants with higher interest in local produce in Singapore. Third, the sample size is not large (400). Therefore, the findings of this study are specific to those who participated in this study though the profile of the participants were not largely far from an average Singaporean.
Lastly, future studies can build on our findings by investigating alternative determinants of consumer demand to further underpin Singapore’s ongoing efforts to realize food self-sufficiency.

Funding

This research was funded by Tote Board grant number 2000009928.

Institutional Review Board Statement

The study was conducted in accordance with the Declaration of Helsinki, and approved by the National University of Singapore-Institutional Review Board (NUS-IRB-2021-826, 26 November 2021).

Informed Consent Statement

Not applicable.

Data Availability Statement

Data available on request. The data that support the findings of this study are available from the author upon reasonable request.

Conflicts of Interest

The author declares no conflict of interest.

Appendix A

Table A1. A complete estimation results of the ordered probit model on willingness to pay (Table 8).
LettuceLeafy Vegetables for Salad (e.g., Salad Spinach, Rocket Salad, Kale)Herbs (e.g., Rosemary, Basil, Mint)EggsSeabass Barramundi (Fillet)Red Snapper (Fillet)
Environmental views and behaviour
Taking an action to fight climate change is very important0.0040.006 *0.0050.0020.0020.003
(0.004)(0.004)(0.004)(0.004)(0.003)(0.004)
Individual action makes a difference in fighting climate change−0.004−0.002−0.003−0.001−0.003−0.003
(0.004)(0.004)(0.004)(0.004)(0.004)(0.004)
Collective action is needed and government has a part to play in fighting climate change−0.001−0.003−0.004−0.007 *−0.003−0.003
(0.005)(0.005)(0.004)(0.005)(0.004)(0.005)
Collective action is needed and business has a part to play in fighting climate change−0.002−0.002−0.0050.004−0.002−0.001
(0.004)(0.004)(0.004)(0.004)(0.004)(0.004)
Collective action is needed and community groups have a part to play in fighting climate change−0.008 *−0.0040.001−0.007−0.002−0.002
(0.004)(0.004)(0.004)(0.004)(0.004)(0.004)
Collective action is needed and NGOs have a part to play in fighting climate change0.010 ***0.008 **0.006 *0.010 ***0.006 *0.006 *
(0.003)(0.003)(0.003)(0.003)(0.003)(0.003)
Singapore should make a shift to a low carbon economy−0.0010.0000.003−0.002−0.0020.000
(0.004)(0.004)(0.004)(0.004)(0.004)(0.004)
Singapore should make a shift to a low carbon economy, even if they are expected to bear some additional costs and inconvenience as consumers0.009 ***0.007 **0.005 *0.007 **0.007 **0.009 ***
(0.003)(0.003)(0.003)(0.003)(0.003)(0.003)
Climate change will disrupt ecosystem0.001−0.006−0.0040.002−0.002−0.002
(0.004)(0.004)(0.004)(0.004)(0.004)(0.004)
Climate change causes rising sea level−0.0020.0010.002−0.0040.000−0.003
(0.004)(0.004)(0.004)(0.004)(0.004)(0.004)
Climate change poses a considerable threat to global food security−0.0020.0010.0010.0030.0060.005
(0.004)(0.004)(0.005)(0.004)(0.004)(0.004)
In my daily life, I make an effort to conserve water−0.002−0.002−0.004−0.0020.0010.003
(0.004)(0.004)(0.004)(0.004)(0.004)(0.004)
In my daily life, I make an effort to reduce food wastage0.0000.001−0.003−0.003−0.001−0.004
(0.004)(0.004)(0.004)(0.004)(0.004)(0.004)
In my daily life, I make an effort to eat more vegetables and less meat0.005 **0.0020.006 **0.0020.0020.001
(0.003)(0.003)(0.003)(0.003)(0.003)(0.003)
Demographic and socioeconomic attributes
Male (=1)0.1990.1770.210 *0.0610.1370.084
(0.128)(0.126)(0.128)(0.125)(0.126)(0.126)
Age−0.011 **−0.005−0.010 **−0.007−0.008 *−0.008 *
(0.005)(0.005)(0.005)(0.005)(0.005)(0.005)
Singaporean (=1)0.1230.229−0.070−0.0720.196−0.058
(0.199)(0.197)(0.196)(0.195)(0.197)(0.196)
Chinese (=1)−0.319 **−0.280 *−0.267 *−0.1530−0.301 *−0.1640
(0.159)(0.159)(0.159)(0.159)(0.158)(0.158)
Household size0.0400.0520.0640.0430.0020.013
(0.050)(0.049)(0.050)(0.049)(0.049)(0.050)
High income (=1)0.487 ***0.600 ***0.488 ***0.414 ***0.567 ***0.647 ***
(0.132)(0.130)(0.131)(0.130)(0.130)(0.131)
Graduated university (=1)−0.0250.002−0.168−0.103−0.159−0.164
(0.141)(0.139)(0.141)(0.138)(0.138)(0.139)
Cook for children under 12 (=1)0.2070.1260.0860.0470.0960.119
(0.160)(0.159)(0.159)(0.158)(0.157)(0.159)
/cut1 −0.0350.322−0.189−0.256−0.121−0.174
(0.397)(0.391)(0.394)(0.388)(0.389)(0.390)
/cut2 1.165 ***1.493 ***0.992 **0.883 **1.122 ***1.092 ***
(0.399)(0.396)(0.395)(0.390)(0.392)(0.393)
Observations400400400400400400
Robust standard errors in parentheses. *** p < 0.01, ** p < 0.05, * p < 0.1.

References

  1. FAO; IFAD; UNICEF; WFP; WHO. The State of Food Security and Nutrition in the World 2021; FAO: Rome, Italy, 2021. [CrossRef]
  2. FAO. Food Outlook–Biannual Report on Global Food Markets; FAO: Rome, Italy, 2022. [CrossRef]
  3. von Braun, J.; Birner, R. Designing Global Governance for Agricultural Development and Food and Nutrition Security. Rev. Dev. Econ. 2017, 21, 265–284. [Google Scholar] [CrossRef]
  4. Brown, M.E.; Antle, J.M.; Backlund, P.; Carr, E.R.; Easterling, W.E.; Walsh, M.K.; Ammann, C.; Attavanich, W.; Barrett, C.B.; Bellemare, M.F.; et al. Climate Change, Global Food Security, and the U.S. Food System; U.S. Global Change Research Program: Washington, DC, USA, 2015. [Google Scholar] [CrossRef]
  5. Niles, M.T.; Salerno, J.D. A Cross-Country Analysis of Climate Shocks and Smallholder Food Insecurity. PLoS ONE 2018, 13, e0192928. [Google Scholar] [CrossRef] [PubMed]
  6. Lee, J.; Nadolnyak, D.; Hartarska, V. Impact of Climate Change on Agricultural Production in Asian Countries: Evidence from Panel Study. In Proceedings of the Selected Paper prepared for presentation at the Southern Agricultural Economics Association Annual Meeting, Birmingham, AL, USA, 4–7 February 2012. [Google Scholar]
  7. Arndt, C.; Farmer, W.; Strzepek, K.; Thurlow, J. Climate Change, Agriculture and Food Security in Tanzania: Climate change and food security in tanzania. Rev. Dev. Econ. 2012, 16, 378–393. [Google Scholar] [CrossRef]
  8. Garnett, T. Three Perspectives on Sustainable Food Security: Efficiency, Demand Restraint, Food System Transformation. What Role for Life Cycle Assessment? J. Clean. Prod. 2014, 73, 10–18. [Google Scholar] [CrossRef]
  9. Reisch, L.; Eberle, U.; Lorek, S. Sustainable Food Consumption: An Overview of Contemporary Issues and Policies. Sustain. Sci. Pract. Policy 2013, 9, 7–25. [Google Scholar] [CrossRef]
  10. Thøgersen, J. Unsustainable Consumption: Basic Causes and Implications for Policy. Eur. Psychol. 2014, 19, 84–95. [Google Scholar] [CrossRef]
  11. Thøgersen, J. Sustainable Food Consumption in the Nexus between National Context and Private Lifestyle: A Multi-Level Study. Food Qual. Prefer. 2017, 55, 16–25. [Google Scholar] [CrossRef]
  12. Springmann, M.; Godfray, H.C.J.; Rayner, M.; Scarborough, P. Analysis and Valuation of the Health and Climate Change Cobenefits of Dietary Change. Proc. Natl. Acad. Sci. USA. 2016, 113, 4146–4151. [Google Scholar] [CrossRef]
  13. Hartmann, C.; Siegrist, M. Consumer Perception and Behaviour Regarding Sustainable Protein Consumption: A Systematic Review. Trends Food Sci. Technol. 2017, 61, 11–25. [Google Scholar] [CrossRef]
  14. Hedin, B.; Katzeff, C.; Eriksson, E.; Pargman, D. A Systematic Review of Digital Behaviour Change Interventions for More Sustainable Food Consumption. Sustainability 2019, 11, 2638. [Google Scholar] [CrossRef]
  15. Sustainable Development Commission. Sustainability Implications of the Little Red Tractor Scheme; SDC: London, UK, 2005. [Google Scholar]
  16. Csutora, M.; Vetőné Mózner, Z. Consumer Income and Its Relation to Sustainable Food Consumption–Obstacle or Opportunity? Int. J. Sustain. Dev. World Ecol. 2014, 21, 512–518. [Google Scholar] [CrossRef]
  17. Milfont, T.L.; Markowitz, E. Sustainable Consumer Behaviour: A Multilevel Perspective. Curr. Opin. Psychol. 2016, 10, 112–117. [Google Scholar] [CrossRef]
  18. Economist Intelligence Unit. Global Food Security Index 2021: Singapore. Available online: http://foodsecurityindex.eiu.com/ (accessed on 9 June 2022).
  19. Singapore Food Agency. Singapore Food Statistics 2021. Available online: https://www.sfa.gov.sg/publications/sgfs (accessed on 27 June 2022).
  20. Singapore Food Agency. Our SG Food Story. Available online: https://www.sfa.gov.sg/fromSGtoSG/our-sg-food-story (accessed on 27 June 2022).
  21. Mok, W.K.; Tan, Y.X.; Chen, W.N. Technology Innovations for Food Security in Singapore: A Case Study of Future Food Systems for an Increasingly Natural Resource-Scarce World. Trends Food Sci. Technol. 2020, 102, 155–168. [Google Scholar] [CrossRef] [PubMed]
  22. Singapore Food Agency. From SG to SG–The Taste of Our Own Local Produce. Available online: https://www.sfa.gov.sg/fromSGtoSG (accessed on 27 June 2022).
  23. Department of Statistics Singapore. Agriculture, Animal Production and Fisheries. Available online: http://www.singstat.gov.sg/publications/reference/ebook/industry/agriculture-animal-production-and-fisheries (accessed on 11 June 2022).
  24. Singapore Food Agency. Starting a Farm: An Industry Guide. Available online: https://www.sfa.gov.sg/docs/default-source/food-farming/sfa-farming-guide_fa-spread-high-res.pdf (accessed on 27 June 2022).
  25. Boon, L.H. Let’s Have Pride in Home-Grown Produce. Available online: https://www.businesstimes.com.sg/companies-markets/lets-have-pride-in-home-grown-produce (accessed on 21 August 2022).
  26. Kwek, A. Retail Food. United States Department of Agriculture. Available online: https://apps.fas.usda.gov/newgainapi/api/Report/DownloadReportByFileName?fileName=Retail%20Foods_Singapore_Singapore_06-30-2021.pdf (accessed on 22 September 2022).
  27. Singapore Food Agency. SG Fresh Produce Badges. Available online: https://www.sfa.gov.sg/fromSGtoSG/star-quality-local-produce (accessed on 21 June 2022).
  28. Singapore Agro-Food Enterprises Federation Limited. About SAFEF. Available online: https://safef.org.sg/about-safef/ (accessed on 27 June 2022).
  29. MacGregor, J.; Vorley, B. Fair Miles? The Concept of “Food Miles” through a Sustainable Development Lens; International Institute for Environment and Development: London, UK, 2006. [Google Scholar]
  30. Singapore Agro-Food Enterprise Federation. The Benefits of Buying Singapore-Farmed Produce. Available online: https://safef.org.sg/blog/how-buying-local-produce-supports-singapores-future/ (accessed on 15 August 2022).
  31. Singapore Food Agency. Our Singapore Food Story–The 3 Food Baskets. Available online: https://www.sfa.gov.sg/food-farming/sgfoodstory (accessed on 27 June 2022).
  32. Wong, C. Demand for Local Produce Must Complement Supply in Local Food Production: Amy Khor. Available online: https://www.straitstimes.com/singapore/environment/demand-for-local-produce-must-complement-supply-in-local-food-production-amy (accessed on 27 June 2022).
  33. Gilg, A.; Barr, S.; Ford, N. Green Consumption or Sustainable Lifestyles? Identifying the Sustainable Consumer. Futures 2005, 37, 481–504. [Google Scholar] [CrossRef]
  34. Robinson, R.; Smith, C. Psychosocial and Demographic Variables Associated with Consumer Intention to Purchase Sustainably Produced Foods as Defined by the Midwest Food Alliance. J. Nutr. Educ. Behav. 2002, 34, 316–325. [Google Scholar] [CrossRef]
  35. Weatherell, C.; Tregear, A.; Allinson, J. In Search of the Concerned Consumer: UK Public Perceptions of Food, Farming and Buying Local. J. Rural Stud. 2003, 19, 233–244. [Google Scholar] [CrossRef]
  36. Vermeir, I.; Verbeke, W. Sustainable Food Consumption: Exploring the Consumer “Attitude – Behavioral Intention” Gap. J. Agric. Environ. Ethics 2006, 19, 169–194. [Google Scholar] [CrossRef]
  37. van Dam, Y.K.; van Trijp, H.C.M. Relevant or Determinant: Importance in Certified Sustainable Food Consumption. Food Qual. Prefer. 2013, 30, 93–101. [Google Scholar] [CrossRef]
  38. Nie, C.; Zepeda, L. Lifestyle segmentation of US food shoppers to examine organic and local food consumption. Appetite 2011, 57, 28–37. [Google Scholar] [CrossRef]
  39. Feldmann, C.; Hamm, U. Consumers’ Perceptions and Preferences for Local Food: A Review. Food Qual. Prefer. 2015, 40, 152–164. [Google Scholar] [CrossRef]
  40. Yue, C.; Tong, C. Organic or local? Investigating consumer preference for fresh produce using a choice experiment with real economic incentives. HortScience 2009, 44, 366–371. [Google Scholar] [CrossRef]
  41. Zepeda, L.; Li, J. Who buys local food? J. Food Distrib. Res. 2006, 37, 1–11. [Google Scholar] [CrossRef]
  42. Adams, D.; Adams, A. De-Placing Local at the Farmers’ Market: Consumer Conceptions of Local Foods. J. Rural Soc. Sci. 2011, 26, 74–100. [Google Scholar]
  43. Batziakas, K.G.; Talavera, M.; Swaney-Stueve, M.; Rivard, C.L.; Pliakoni, E.D. Descriptive Analysis and Consumer Acceptability of Locally and Commercially Grown Spinach. J. Food Sci. 2019, 84, 2261–2268. [Google Scholar] [CrossRef]
  44. Naspetti, S.; Bodini, A. Consumer Perception of Local and Organic Products: Substitution or Complementary Goods? Int. J. Interdiscip. Soc. Sci. Annu. Rev. 2008, 3, 111–122. [Google Scholar] [CrossRef]
  45. Saito, H.; Saito, Y. Motivations for Local Food Demand by Japanese Consumers: A Conjoint Analysis with Reference-Point Effects: Local food demand by japanese consumers. Agribusiness 2013, 29, 147–161. [Google Scholar] [CrossRef]
  46. Vapa-Tankosić, J.; Ignjatijević, S.; Kiurski, J.; Milenković, J.; Milojević, I. Analysis of Consumers’ Willingness to Pay for Organic and Local Honey in Serbia. Sustainability 2020, 12, 4686. [Google Scholar] [CrossRef]
  47. Carpio, C.E.; Isengildina-Massa, O. Consumer Willingness to Pay for Locally Grown Products: The Case of South Carolina. Agribusiness 2009, 25, 412–426. [Google Scholar] [CrossRef] [Green Version]
  48. Bean, M.; Sharp, J.S. Profiling Alternative Food System Supporters: The Personal and Social Basis of Local and Organic Food Support. Renew. Agric. Food Syst. 2011, 26, 243–254. [Google Scholar] [CrossRef]
  49. Printezis, I.; Grebitus, C.; Hirsch, S. The Price Is Right!? A Meta-Regression Analysis on Willingness to Pay for Local Food. PLoS ONE 2019, 14, e0215847. [Google Scholar] [CrossRef]
  50. Wägeli, S.; Janssen, M.; Hamm, U. Organic Consumers’ Preferences and Willingness-to-Pay for Locally Produced Animal Products: Preferences for Locally Produced Animal Products. Int. J. Consum. Stud. 2016, 40, 357–367. [Google Scholar] [CrossRef]
  51. Bazzani, C.; Caputo, V.; Nayga, R.M.; Canavari, M. Revisiting Consumers’ Valuation for Local versus Organic Food Using a Non-Hypothetical Choice Experiment: Does Personality Matter? Food Qual. Prefer. 2017, 62, 144–154. [Google Scholar] [CrossRef]
  52. Mugera, A.; Burton, M.; Downsborough, E. Consumer Preference and Willingness to Pay for a Local Label Attribute in Western Australian Fresh and Processed Food Products. J. Food Prod. Market. 2017, 23, 452–472. [Google Scholar] [CrossRef]
  53. Gumirakiza, J.D.; Curtis, K.R.; Bosworth, R. Consumer Preferences and Willingness to Pay for Bundled Fresh Produce Claims at Farmers’ Markets. J. Food Prod. Market. 2017, 23, 61–79. [Google Scholar] [CrossRef]
  54. Byrd, E.S.; Widmar, N.J.O.; Wilcox, M.D. Are Consumers Willing to Pay for Local Chicken Breasts and Pork Chops? J. Food Prod. Market. 2018, 24, 235–248. [Google Scholar] [CrossRef]
  55. Merritt, M.G.; Delong, K.L.; Griffith, A.P.; Jensen, K.L. Consumer Willingness to Pay for Tennessee Certified Beef. J. Agric. Appl. Econ. 2018, 50, 233–254. [Google Scholar] [CrossRef]
  56. Printezis, I.; Grebitus, C.; Printezis, A. Importance of Perceived “Naturalness” to the Success of Urban Farming. Choices 2017, 32, 1–7. [Google Scholar] [CrossRef]
  57. Mirosa, M.; Lawson, R. Revealing the Lifestyles of Local Food Consumers. Br. Food J. 2012, 114, 816–825. [Google Scholar] [CrossRef]
  58. Kiss, K.; Ruszkai, C.; Szűcs, A.; Koncz, G. Examining the Role of Local Products in Rural Development in the Light of Consumer Preferences—Results of a Consumer Survey from Hungary. Sustainability 2020, 12, 5473. [Google Scholar] [CrossRef]
  59. Berg, N.; Preston, K.L. Willingness to Pay for Local Food?: Consumer Preferences and Shopping Behaviour at Otago Farmers Market. Trans. Res. Part A Policy Pract. 2017, 103, 343–361. [Google Scholar] [CrossRef]
  60. Brown, C. Consumers’ Preferences for Locally Produced Food: A Study in Southeast Missouri. Am. J. Alt. Ag. 2003, 18, 213–224. [Google Scholar] [CrossRef]
  61. Darby, K.; Batte, M.T.; Ernst, S.; Roe, B. Decomposing local: A conjoint analysis of locally produced foods. Am. J. Agric. Econ. 2008, 90, 476–486. [Google Scholar] [CrossRef]
  62. Profeta, A.; Hamm, U. Consumers’ Expectations and Willingness-to-pay for Local Animal Products Produced with Local Feed. Int. J. Food Sci. Technol. 2019, 54, 651–659. [Google Scholar] [CrossRef]
  63. Ministry of Social and Family Development. Singapore’s Demographic: Sex Ratio-Males to Females. Available online: https://www.msf.gov.sg/research-and-data/Research-and-Statistics/Pages/Singapore-Demographic-Sex-Ratio-Males-to-Females.aspx (accessed on 11 August 2022).
  64. National Population and Talent Division, Strategy Group, Prime Minister’s Office; Singapore Department of Statistics; Ministry of Home Affairs; Immigration & Checkpoints Authority; Ministry of Manpower. Population in Brief 2021; National Population and Talent Division, Strategy Group, Prime Minister’s Office: Singapore, 2021.
  65. Department of Statistics Singapore. Census of Population 2020 Statistical Release 1; Department of Statistics, Ministry of Trade and Industry: Singapore, 2020.
  66. National Climate Change Secretariat Singapore. Climate Change Public Perception Survey 2019. Available online: https://www.nccs.gov.sg/media/press-release/climate-change-public-perception-survey-2019 (accessed on 18 August 2022).
  67. Henseleit, M.; Kubitzki, S.; Teuber, R. Determinants of consumer preferences for regional food. In Proceedings of the European Association of Agricultural Economists, Bologna, Italy, 8–10 March 2007; Volume 7871, pp. 55–67. [Google Scholar] [CrossRef]
  68. Yee, A.Z.H.; Lwin, M.O.; Ho, S.S. The Influence of Parental Practices on Child Promotive and Preventive Food Consumption Behaviours: A Systematic Review and Meta-Analysis. Int. J. Behav. Nutr. Phys. Act. 2017, 14, 47. [Google Scholar] [CrossRef]
  69. Gillman, M.W. Family Dinner and Diet Quality Among Older Children and Adolescents. Arch. Family Med. 2000, 9, 235–240. [Google Scholar] [CrossRef]
Figure 1. Surveyed Singapore consumers’ perception on taking actions in fighting climate change.
Sustainability 14 12330 g001
Figure 2. Surveyed Singapore consumers’ perception on the country shifting to low carbon economy.
Sustainability 14 12330 g002
Figure 3. Surveyed Singapore consumers’ perceptions on the impact of climate change.
Sustainability 14 12330 g003
Figure 4. Surveyed Singapore consumers’ individual efforts for the environment.
Sustainability 14 12330 g004
Table 1. Questions regarding pro-environmental views and behaviour.
Statements regarding pro-environmental view and behaviour
1Taking an action to fight climate change is very important
2Individual action makes a difference in fighting climate change.
3Collective action is needed and government has a part to play in fighting climate change.
4Collective action is needed and business has a part to play in fighting climate change.
5Collective action is needed and community groups have a part to play in fighting climate change.
6Collective action is needed and NGOs have a part to play in fighting climate change.
7Singapore should make a shift to a low carbon economy.
8Singapore should make a shift to a low carbon economy, even if they are expected to bear some additional costs and inconvenience as consumers.
9Climate change will disrupt ecosystem
10Climate change causes rising sea level
11Climate change poses a considerable threat to global food security
12In my daily life, I make an effort to conserve water
13In my daily life, I make an effort to reduce food wastage
14In my daily life, I make an effort to eat more vegetables and less meat
Scale used in the survey
Strongly disagree
Strongly agree
123456
Table 2. Reasons for purchasing local produce.
1Better quality
2Trust in local brands/producers
3Fresher products
4More organic items available
5Affordable price
6Environmental reasons (Less carbon emissions/Improve air quality/Mitigate urban heat island)
7Easy to identify/find at the store
8Support local farmers/Singapore’s Food Security
9The product happens to be available
Table 3. Socioeconomic characteristics of surveyed Singapore consumers.
VariablesVariablesMean (Numerical Variable)
Frequency (Categorical Variable)
Standard Deviation
GenderMale195
Female205
AgeAge45.24314.522
NationalitySingaporean355
Others45
EthnicityChinese302
Malay50
Indian36
Others12
Household sizeHousehold size3.5781.369
Household incomeHousehold monthly income is >SGD 10,000138
Household monthly income is ≤SGD 10,000262
Education levelGraduated from university265
Did not graduate from university135
Cooking at homeCook for children under 12 years old70
Do not cook for children under 12 years old330
Table 4. Surveyed Singapore consumers’ purchase frequency of local foods.
Purchase of Local Produce
NeverSometimes (once or twice a month)Always (almost every week)
Leafy vegetables22217161
(5.5)(54.25)(40.25)
Eggs20189191
(5)(47.25)(47.75)
Fish/Seafood6724291
(16.75)(60.5)(22.75)
Note: Figures in parentheses are percentage to the total.
Table 5. Association between consumers’ perception and behaviour on environmental issues.
(1)(2)(3)(4)(5)(6)(7)(8)(9)(10)(11)(12)(13)(14)
Male (=1)0.1830.241 *−0.0260.1080.0580.0480.0730.0360.0000.114−0.056−0.0200.034−0.033
(0.119)(0.126)(0.117)(0.111)(0.110)(0.110)(0.119)(0.120)(0.119)(0.120)(0.121)(0.109)(0.112)(0.125)
Age−0.004−0.0010.002−0.001−0.001−0.0010.0010.0070.0030.0010.0020.009 **0.010 **0.001 **
(0.004)(0.005)(0.004)(0.004)(0.004)(0.004)(0.004)(0.005)(0.004)(0.004)(0.005)(0.004)(0.004)(0.005)
Singaporean (=1)−0.125−0.104−0.094−0.076−0.079−0.217−0.271−0.039−0.041−0.0140.018−0.093−0.042−0.194
(0.189)(0.199)(0.186)(0.176)(0.175)(0.174)(0.188)(0.191)(0.189)(0.190)(0.192)(0.173)(0.178)(0.198)
Chinese (=1)−0.083−0.0730.0920.1380.128−0.0120.071−0.0540.1420.249 *0.163−0.182−0.287 **−0.046
(0.147)(0.156)(0.146)(0.138)(0.137)(0.136)(0.147)(0.149)(0.148)(0.149)(0.150)(0.135)(0.139)(0.155)
Household size0.031−0.0240.017−0.032−0.010−0.0500.0320.023−0.036−0.041−0.074−0.0020.0130.115 **
(0.045)(0.047)(0.044)(0.042)(0.042)(0.041)(0.045)(0.045)(0.045)(0.045)(0.046)(0.041)(0.042)(0.047)
High income (=1)0.243 **0.1160.1020.201 *0.302 ***0.374 ***0.367 ***0.274 **0.410 ***0.457 ***0.423 ***0.204 *0.1770.305 **
(0.120)(0.127)(0.119)(0.113)(0.112)(0.111)(0.120)(0.122)(0.121)(0.122)(0.123)(0.110)(0.114)(0.127)
Graduated university (=1)−0.015−0.072−0.149−0.188−0.190−0.295 **−0.120−0.032−0.229 *−0.318 **−0.308 **0.0140.012−0.074
(0.128)(0.135)(0.126)(0.119)(0.118)(0.118)(0.127)(0.129)(0.128)(0.129)(0.130)(0.117)(0.120)(0.134)
Constant4.872 ***4.770 ***4.842 ***5.059 ***4.937 ***5.210 ***4.706 ***4.032 ***4.748 ***4.771 ***4.920 ***4.691 ***4.495 ***3.793 ***
(0.349)(0.369)(0.345)(0.327)(0.324)(0.322)(0.348)(0.353)(0.351)(0.353)(0.356)(0.320)(0.329)(0.367)
Observations400400400400400400400400400400400400400400
R-squared0.0280.0150.0100.0200.0280.0450.0350.0230.0500.0700.0630.0240.0300.043
Standard errors in parentheses. *** p < 0.01, ** p < 0.05, * p < 0.1. Highest and lowest estimation results for each question are highlighted in bold. Questions for each column: (1) Taking an action to fight climate change is very important; (2) Individual action makes a difference in fighting climate change; (3) Collective action is needed and government has a part to play in fighting climate change; (4) Collective action is needed and business has a part to play in fighting climate change; (5) Collective action is needed and community groups have a part to play in fighting climate change; (6) Collective action is needed and community groups have a part to play in fighting climate change; (7) Singapore should make a shift to a low carbon economy; (8) Singapore should make a shift to a low carbon economy, even if they are expected to bear some additional costs and inconvenience as consumers; (9) Climate change will disrupt ecosystem; (10) Climate change causes rising sea level; (11) Climate change poses a considerable threat to global food security; (12) In my daily life, I make an effort to conserve water; (13) In my daily life, I make an effort to reduce food wastage; (14) In my daily life, I make an effort to eat more vegetables and less meat.
Table 6. Surveyed Singapore consumers’ willingness to pay for local foods.
LettuceLeafy VegetablesLeafy Vegetables for SaladHerbsEggsSeabass BarramundiRed Snapper
Not willing to pay more46%46%43%46%43%41%40%
WTP up to 5% higher37%36%38%37%38%41%41%
WTP more than 5% higher17%19%19%17%19%19%19%
Table 7. Estimation results of the ordered probit model on purchasing behaviour.
VegetableEggFish
Environmental views and behaviour
Taking an action to fight climate change is very important0.0050.0010.005
(0.004)(0.004)(0.003)
Individual action makes a difference in fighting climate change−0.004−0.0030.003
(0.004)(0.004)(0.004)
Collective action is needed and government has a part to play in fighting climate change−0.008−0.011 **−0.004
(0.005)(0.004)(0.005)
Collective action is needed and business has a part to play in fighting climate change0.0030.008 *−0.007
(0.005)(0.004)(0.004)
Collective action is needed and community groups have a part to play in fighting climate change0.0010.0070.002
(0.005)(0.004)(0.004)
Collective action is needed and NGOs have a part to play in fighting climate change0.003−0.0040.010 ***
(0.004)(0.004)(0.003)
Singapore should make a shift to a low carbon economy0.0000.0010.000
(0.004)(0.004)(0.004)
Singapore should make a shift to a low carbon economy, even if they are expected to bear some additional costs and inconvenience as consumers0.0000.0020.002
(0.004)(0.003)(0.003)
Climate change will disrupt ecosystem−0.0020.006−0.001
(0.004)(0.004)(0.004)
Climate change causes rising sea level0.001−0.003−0.004
(0.005)(0.005)(0.005)
Climate change poses a considerable threat to global food security−0.0010.0020.000
(0.005)(0.005)(0.005)
In my daily life, I make an effort to conserve water0.0000.008 **0.004
(0.004)(0.004)(0.004)
In my daily life, I make an effort to reduce food wastage0.000−0.002−0.001
(0.004)(0.004)(0.004)
In my daily life, I make an effort to eat more vegetables and less meat0.006 *−0.005 *0.002
(0.003)(0.003)(0.003)
Reason for purchase
Better quality0.2330.359 ***0.539 ***
(0.152)(0.139)(0.142)
Trust in local brands/producers−0.0320.0740.175
(0.141)(0.132)(0.132)
Fresher products0.555 ***0.406 ***0.071
(0.146)(0.141)(0.141)
More organic items available0.3210.0820.064
(0.206)(0.194)(0.190)
Affordable price0.568 ***0.0240.222
(0.140)(0.132)(0.140)
Environmental reasons (Less carbon emissions/Improve air quality/Mitigate urban heat island)0.494 ***−0.1580.204
(0.178)(0.165)(0.168)
Easy to identify/find at the store0.646 ***−0.0150.162
(0.171)(0.164)(0.157)
Support local farmers/Singapore’s Food Security0.349 **0.181−0.113
(0.146)(0.144)(0.136)
The product happens to be available−0.217−0.005−0.175
(0.166)(0.170)(0.152)
Demographic and socioeconomic attributes
Male (=1)−0.095−0.1090.040
(0.153)(0.137)(0.141)
Age0.015 **0.0020.001
(0.006)(0.005)(0.005)
Singaporean (=1)−0.165−0.0670.511 ***
(0.221)(0.250)(0.195)
Chinese (=1)−0.287−0.116−0.364 **
(0.197)(0.187)(0.174)
Household size0.0930.0650.159 ***
(0.057)(0.053)(0.055)
High income (=1)0.1740.1630.244 *
(0.148)(0.135)(0.137)
Graduated university (=1)0.046−0.0970.201
(0.164)(0.137)(0.148)
Cook for children under 12 (=1)0.2260.1520.346 **
(0.193)(0.175)(0.163)
/cut1−0.524−0.930 **0.760 *
(0.477)(0.446)(0.438)
/cut22.293 ***0.999 **2.955 ***
(0.491)(0.438)(0.468)
Observations389389389
Robust standard errors in parentheses. *** p < 0.01, ** p < 0.05, * p < 0.1.
Table 8. Estimation results of the ordered probit model on willingness to pay.
LettuceLeafy Vegetables for Salad (e.g., Salad Spinach, Rocket Salad, Kale)EggsSeabass Barramundi (Fillet)Red Snapper (Fillet)
Environmental views and behaviour
Taking an action to fight climate change is very important0.0040.006 *0.0020.0020.003
(0.004)(0.004)(0.004)(0.003)(0.004)
Individual action makes a difference in fighting climate change−0.004−0.002−0.001−0.003−0.003
(0.004)(0.004)(0.004)(0.004)(0.004)
Collective action is needed and government has a part to play in fighting climate change−0.001−0.003−0.007 *−0.003−0.003
(0.005)(0.005)(0.005)(0.004)(0.005)
Collective action is needed and business has a part to play in fighting climate change−0.002−0.0020.004−0.002−0.001
(0.004)(0.004)(0.004)(0.004)(0.004)
Collective action is needed and community groups have a part to play in fighting climate change−0.008 *−0.004−0.007−0.002−0.002
(0.004)(0.004)(0.004)(0.004)(0.004)
Collective action is needed and NGOs have a part to play in fighting climate change0.010 ***0.008 **0.010 ***0.006 *0.006 *
(0.003)(0.003)(0.003)(0.003)(0.003)
Singapore should make a shift to a low carbon economy−0.0010.000−0.002−0.0020.000
(0.004)(0.004)(0.004)(0.004)(0.004)
Singapore should make a shift to a low carbon economy, even if they are expected to bear some additional costs and inconvenience as consumers0.009 ***0.007 **0.007 **0.007 **0.009 ***
(0.003)(0.003)(0.003)(0.003)(0.003)
Climate change will disrupt ecosystem0.001−0.0060.002−0.002−0.002
(0.004)(0.004)(0.004)(0.004)(0.004)
Climate change causes rising sea level−0.0020.001−0.0040.000−0.003
(0.004)(0.004)(0.004)(0.004)(0.004)
Climate change poses a considerable threat to global food security−0.0020.0010.0030.0060.005
(0.004)(0.004)(0.004)(0.004)(0.004)
In my daily life, I make an effort to conserve water−0.002−0.002−0.0020.0010.003
(0.004)(0.004)(0.004)(0.004)(0.004)
In my daily life, I make an effort to reduce food wastage0.0000.001−0.003−0.001−0.004
(0.004)(0.004)(0.004)(0.004)(0.004)
In my daily life, I make an effort to eat more vegetables and less meat0.005 **0.0020.0020.0020.001
(0.003)(0.003)(0.003)(0.003)(0.003)
Demographic and socioeconomic attributes
Male (=1)0.1990.1770.0610.1370.084
(0.128)(0.126)(0.125)(0.126)(0.126)
Age−0.011 **−0.005−0.007−0.008 *−0.008 *
(0.005)(0.005)(0.005)(0.005)(0.005)
Singaporean (=1)0.1230.229−0.0720.196−0.058
(0.199)(0.197)(0.195)(0.197)(0.196)
Chinese (=1)−0.319 **−0.280 *−0.1530−0.301 *−0.1640
(0.159)(0.159)(0.159)(0.158)(0.158)
Household size0.0400.0520.0430.0020.013
(0.050)(0.049)(0.049)(0.049)(0.050)
High income (=1)0.487 ***0.600 ***0.414 ***0.567 ***0.647 ***
(0.132)(0.130)(0.130)(0.130)(0.131)
Graduated university (=1)−0.0250.002−0.103−0.159−0.164
(0.141)(0.139)(0.138)(0.138)(0.139)
Cook for children under 12 (=1)0.2070.1260.0470.0960.119
(0.160)(0.159)(0.158)(0.157)(0.159)
/cut1 −0.0350.322−0.256−0.121−0.174
(0.397)(0.391)(0.388)(0.389)(0.390)
/cut2 1.165 ***1.493 ***0.883 **1.122 ***1.092 ***
(0.399)(0.396)(0.390)(0.392)(0.393)
Observations400400400400400
Robust standard errors in parentheses. *** p < 0.01, ** p < 0.05, * p < 0.1.
Publisher’s Note: MDPI stays neutral with regard to jurisdictional claims in published maps and institutional affiliations.

