1. Introduction
Current global challenges have been affecting businesses and their global operations significantly. In terms of business valuation, companies’ owners and investors can no longer rely solely on financial value. Considering that a greater emphasis is being placed on sustainability issues by numerous communities around the world, the value of a business is now seen as a combination of its financial value and its societal and environmental impact. In this way, it seems reasonable to assume that the extent to which a company is engaged in green operations is closely linked to its reputation. It is thus likely to be true that ‘green’ companies are seen as more attractive to investors that value the environment and take long-term positions. Hence, it should also be observed that sustainability factors can cause stock price differences between green and non-green logistics companies, and commitment to one of these approaches is shown by the environmental, social and fair governance (ESG) performance of the company.
As the global economy is integrating countries globally, and the paradigm is shifting from manufacturing to assembling, the importance of logistics is under the spotlight. As documented by the IEA in 2019, a quarter of the total CO2 emissions come from road transport, and the rate of emissions is predicted to increase. According to the International Transport Forum (2019), the demand for freight transport will have tripled by 2050. Thus, the ‘greening’ of logistics systems is required, and making transport operations more environmentally friendly is becoming a crucial goal of the transport industry in its attempt to prevent climate change and reduce air pollution.
In this study, we take a closer look at green and non-green logistics companies operating in the US that are listed on the US stock market. The paper considers logistics and transportation companies, since sustainability issues are significant to these industries.
2. Literature Review
This paper addresses the sustainable transformation of companies and patterns of their performance in the market, and particularly on the stock market. A combination of environmental, societal and financial value generated by green companies has been mentioned in numerous previous studies (Serafeim and Amel-Zadeh, 2018) [
1].
During operational activities, companies have a social obligation towards the surrounding environment, in what is now better known as ESG. Greater investor appetite and long-term perspectives for green companies have been addressed by Dimeson et al. (2012) [
2] and Escrig-Olmedo et al. (2019) [
3]. Moreover, in support of the mentioned studies, Flammer (2019) [
4] and Guenster et al. (2011) [
5] indicated that greater investor appetite for such companies’ stocks might lead to boosting their overall value and higher regard from the viewpoint of stock markets. Another document in support of sustainable investing was presented by BlackRock in 2018 [
6]. It delivered results derived from a globally representative set of three sustainable indices whose performance was analysed against non-sustainable benchmarks back to 2015. According to the document, companies with ESG profiles are less prone to decreasing future stock prices. This implication is valid across sectors. Another implication suggests that the implementation of ESG practices is conducive to operational performance. Thus, firm value is higher for sustainable companies, as is the efficiency of equity and asset management. Based on an 18-year analysis of numerous US companies, Eccles et al. (2014) [
7] concluded that highly sustainable firms outperform on the stock market their competitors with lower ESG ratings. The abnormal returns were 4.8% higher for the former, which was a statistically significant result. Accounting performance was also shown to be higher for sustainable companies. However, the inverse relation was found by Landi and Sciarelli (2018) [
8]. Based on the fixed effect model developed by the authors, ambiguous results were derived, although the model indicated investors and managers’ growing interest in corporate responsibility in Italy. Studies such as those by Buchanan et al. (2018), Cao et al. (2019), Gillan et al. (2018) and Hu et al. (2021) confirmed that, due to the spread of the concept among different market participants, the quality of CSR assessment has increased [
8,
9,
10,
11,
12]. In the meantime, the results of Landi and Sciarelli (2018) also suggest that by applying ESG criteria to their stocks, companies will not enjoy abnormal returns, which indicates a negative relationship between ESG implementation and market premium on the stock market [
8].
Moreover, Zhou and Zhou (2022) highlighted that a company’s good ESG performance can serve as a hedge during a crisis (they observed this during the COVID-19 pandemic) [
13]. The study considered the MSCI index in the Bloomberg database to measure environmental and social performance based on the corporate governance of A-share listed companies. The results indicated excellent ESG performance of single listed companies reduced stock price volatility during the COVID-19 crisis and stabilised their stock price. In contrast to companies with poor ESG performance, different methods have shown that those with excellent performance have had lower volatility and more stable stock prices during the economic recession caused by the COVID-19 pandemic. However, the study of Engelhardt et al. (2021) [
14] concluded from a sample of publicly listed firms from 16 European countries that their ESG score showed a negative but insignificant effect on stock return volatility during the COVID-19 crisis. Xiong (2021) [
15] and La Torre et al. (2020) [
16] found green stocks with low ESG risk to have higher returns and less volatility during the COVID-19 crisis than those with high ESG risk ratings. Additionally, the study of Albuquerque et al. (2020) used the differential difference method to measure the mitigation effect of ESG input on corporate downside risk during the COVID-19 crisis and concluded that the downside risk for companies with excellent ESG performance is significantly lower than that for companies with poor ESG performance [
17]. Ouchen (2021) confirmed the MSCI USA ESG Select portfolio to be less turbulent during a crisis than the S&P 500 benchmark index [
18].
As for studying ESG portfolio performance in terms of increasing the return, Chelawat and Trivedi (2015) examined the performance of ESG investment in an emerging economy (India). They found, using the capital asset pricing model and Brown–Forsythe and Levene’s tests, that the ESG India Index outperformed the conventional index, even in the short time since its inception, and hence ESG investing enhances investment returns without any significant difference in risk [
19]. However, Zehir and Aybars’s (2020) observation of the European and Turkish markets concluded, from results obtained from CAPM regression, that the ESG-based scores for two portfolios underperformed the market indices. This means that there was no relationship between ESG score and portfolio performance [
20]. At the same time, the research of Kumar et al. (2016) compared an ESG portfolio (Dow Jones Sustainability Index) with a non-ESG one on the US stock market and found that companies that have incorporated ESG factors show lower volatility in their stock performances than their peers in the same industry, that each industry is affected differently by ESG factors and that ESG companies generate higher returns [
21].
Table 1 depicts the main contributions of empirical studies on the topic alongside the data they contain and their dependent variable (y), ESG factor and the results of research.
From the results of the previous empirical studies, we can suppose the following hypothesis:
A green logistics portfolio will have better performance on the stock market than a non-green one.
In other words, a green portfolio is more effective, in terms of obtained return by a green group of stocks allocated with the optimised weights in the portfolio, than a non-green portfolio.
3. Materials and Methods
3.1. Initial Data Collection
The current article investigates stock returns and fluctuations among logistics companies using data from Wharton Research Data Services [
28] and Yahoo! Finance [
29]. It considers the daily historical stock data for 32 logistics companies operating in the US and listed on the US stock market. The US stock market was chosen as the most appropriate market for statistical analysis as it provides the greatest number of green logistics companies to compare with non-green ones on the same market. The data cover the period from 1 January 2007 to 4 April 2022. The companies are divided into two groups by their overall ESG risk score for February 2022. The first group comprises companies with ESG scores lower than 25 and exposure level is ‘low’; these are called the green companies. ESG risk was obtained by Wharton Research Data Services from the Sustainanalytics database. The overall ESG risk is a news-based factor that is calculated as the sum of environmental, social and corporate governance risks by Sustainanalytics. Environmental risk calculates the risk arising from factors primarily attributable to environmental issues. Social risk calculates the risk arising from factors primarily attributable to a company’s relations with its employees, for example in terms of salaries, education, workplace diversity policy and inclusion, as well as its relations with customers. Governance risk calculates the risk arising from factors primarily attributed to a company’s management policy, such as its laws, rules and regulations.
The second group consists of companies with an overall ESG risk score higher than 25 points, which are referred to as non-green companies. The companies are presented in
Table 2.
The research considers 16 green companies and 16 non-green companies to study the impact of the ESG strategy on their stock market performance. Such performance was evaluated using adjusted close price data from Yahoo! Finance and following calculations for the optimisation of the two investment portfolios.
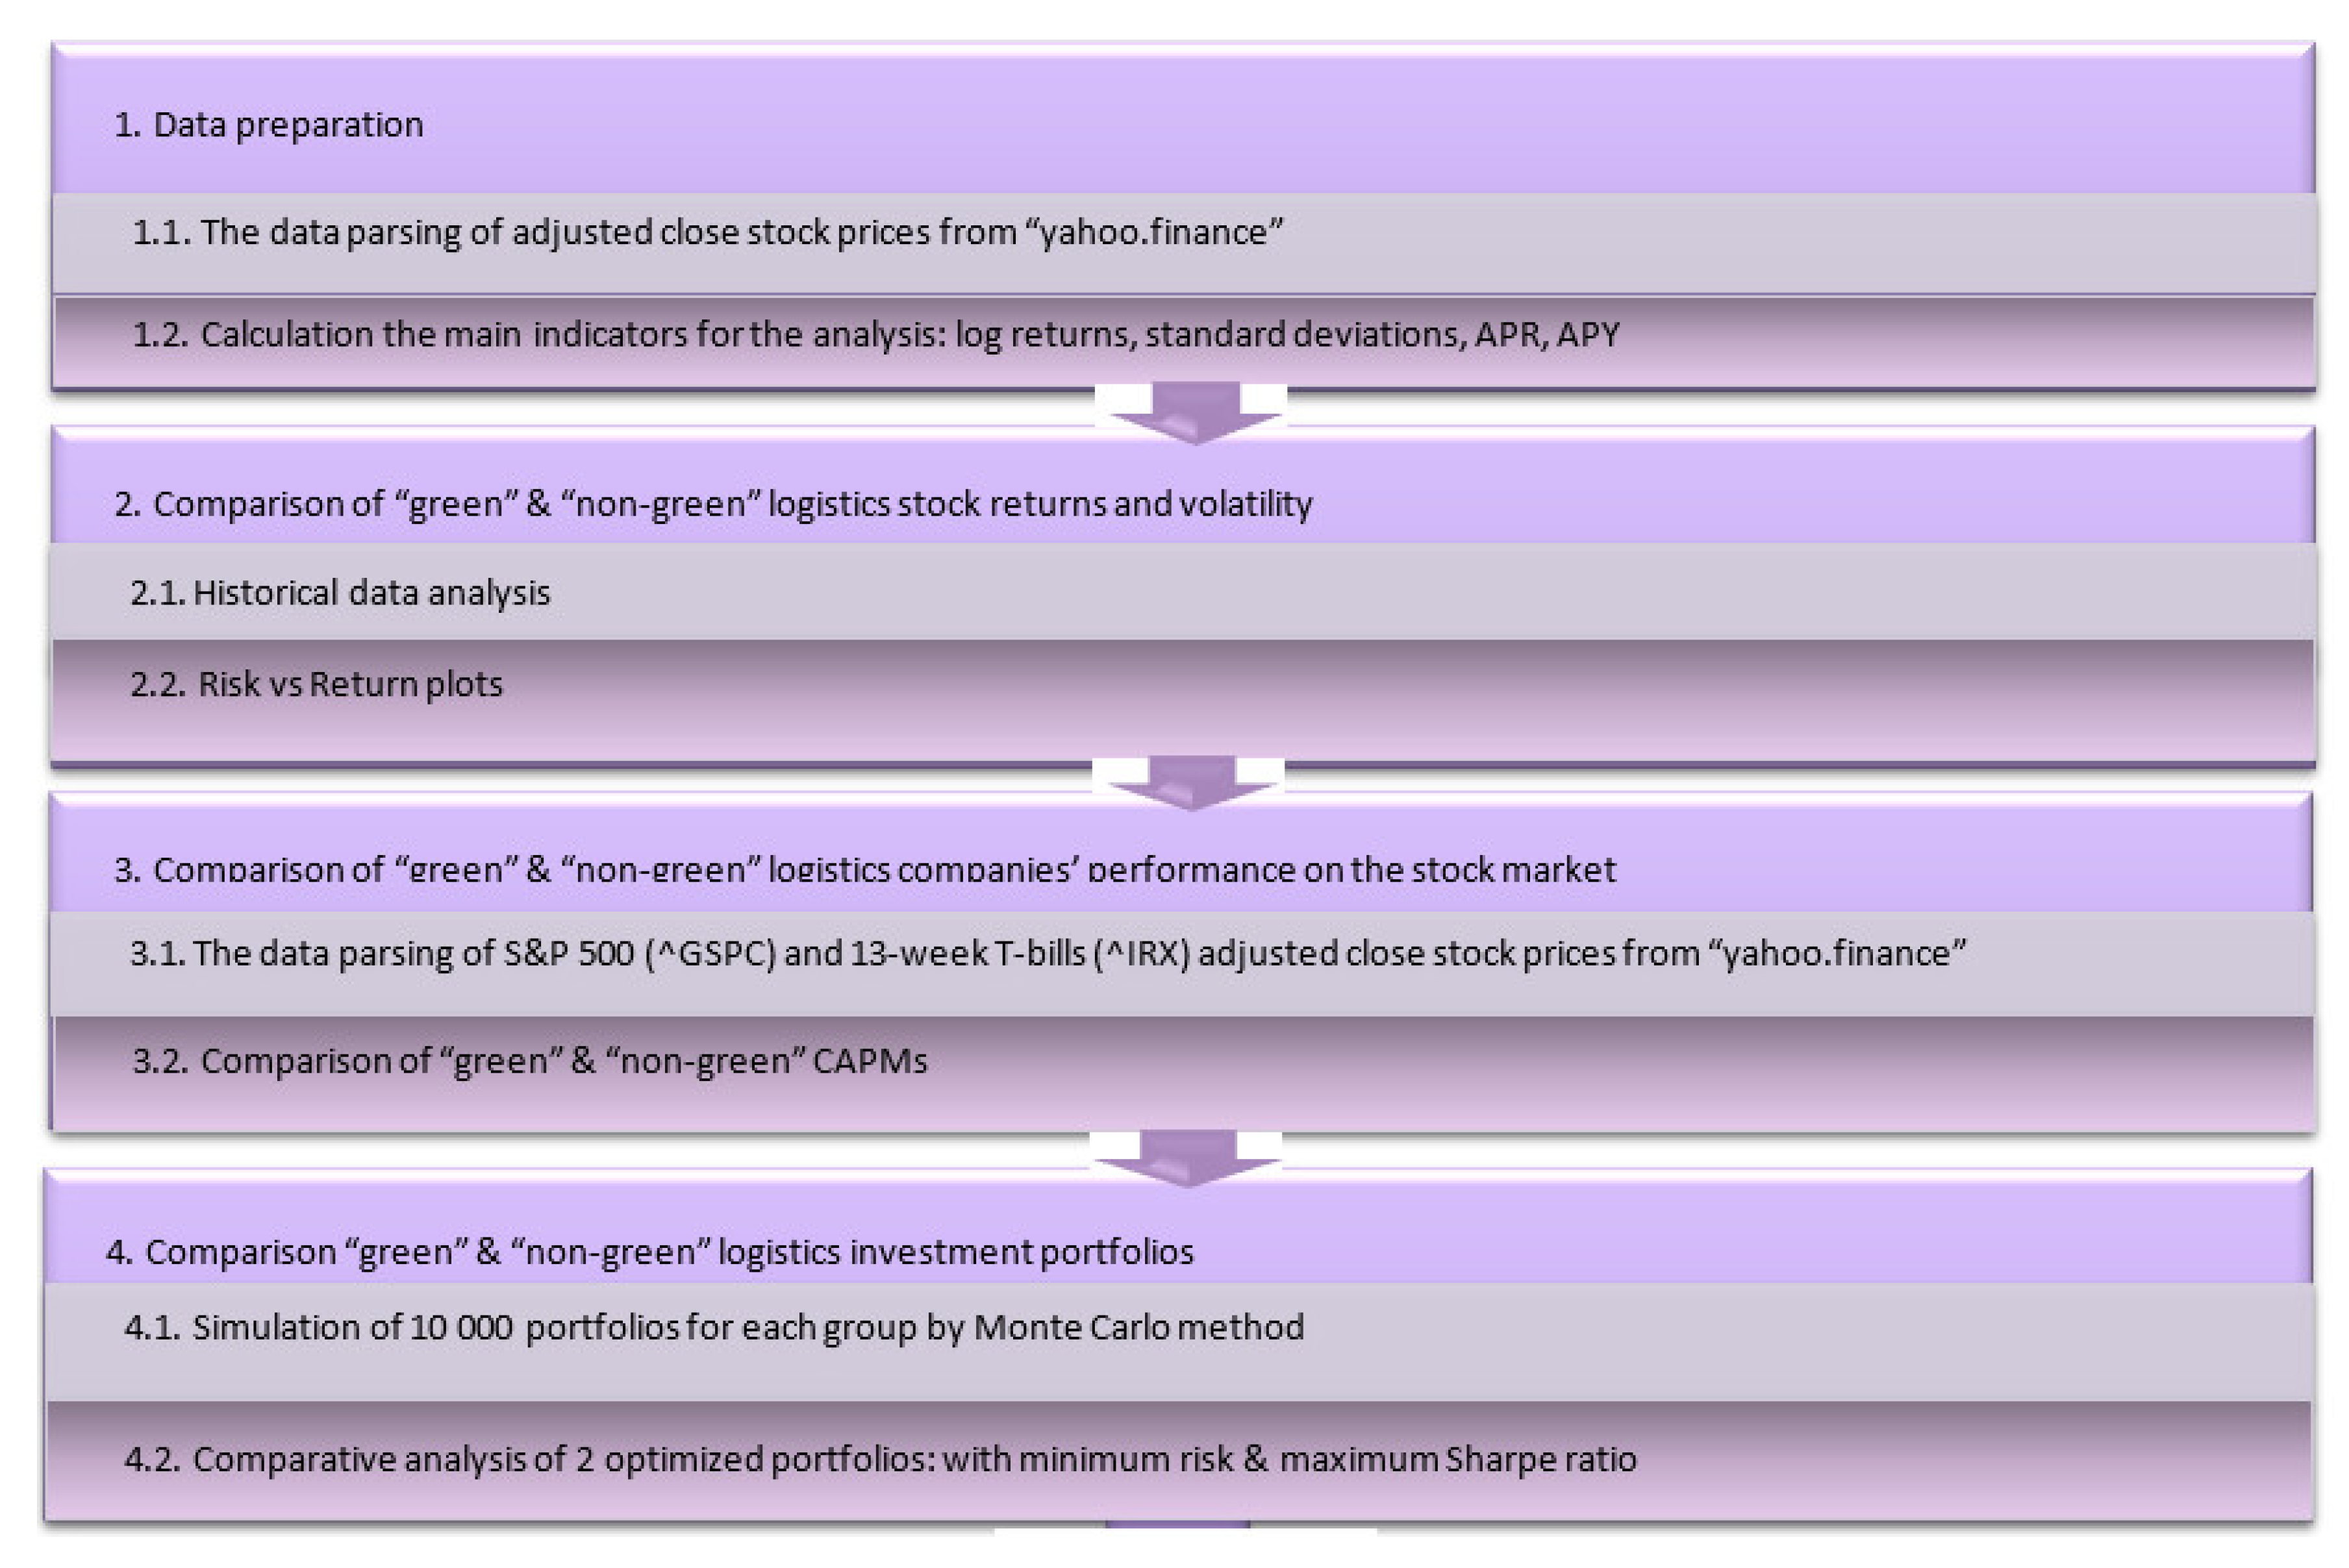
3.2. Algorithm and Methodology
Based on the data and literature review, a research algorithm was developed (
Figure 1).
The first stage of the research involves the data preparation. We first parsed the adjusted closing stock prices from Yahoo! Finance and divided them into two groups (green and non-green) based on the ESG data from Wharton Research Data Services. For further analysis, we calculated the annual returns (annual percentage rate and annual percentage yield) and the standard deviation of them. There were two annual returns calculated:
Effective rate, or annual percentage yield (APY);
Nominal rate, or annual percentage rate (APR).
APR does not consider inflation and compounding, whereas APY does, and it gives a higher value for the rate. The effective rate takes into consideration the compounding of the respective years and stands as a more accurate measure for the returns of investment instruments (Equation (1)).
where
N is the number of trading days of the corresponding year.
The nominal rate is computed as in Equation (2):
where
P0 is the stock price at the previous period and
PN is the current stock price.
Simple return shows correlations among investment instruments while only the stock price cannot indicate it. Log return, if compared with simple return, allows us to differentiate more clearly between how instruments are modelled in continuous time. The sum of the log differences can be interpreted as the total change (as a percentage) over the period summed (which is not a property of the other formulations, as they will overestimate growth).
The volatility or risk is evaluated as the annualised standard deviation of return, as in Equation (3):
where
Ri is the return of instrument
i.
The second stage was to perform a comparison of green and non-green logistics stock returns and volatility. Here, we analysed historical data of log stock returns (APR), providing graphs with returns and their standard deviations over the research period and risk–return plots.
The third stage used CAPM modelling to compare the performance of the groups of stocks. The central insight of the CAPM is that in equilibrium, the riskiness of an asset is not measured by the standard deviation (σ) of its return but by its beta (β). In particular, the CAPM model (a linear model) supposes the existence of a linear relationship between the expected return of any instrument (or portfolio) and the expected return of the market portfolio.
Equation (4) shows the CAPM-based return-generating model (expanded CAPM or single index model).
where
αp is performance, the abnormal return for portfolio;
βp is the independent variable, representing the systematic risk of the portfolio, and ε is the unsystematic risk.
The adjusted close price on 4 April 2022 of 13-week treasury bills (^IRX ticker) is used as the risk-free instrument for the CAPM and equals to 0.5 dollars. The interpretations of alpha (α) and beta (β) are presented in
Table 3.
We are not only interested in the expected return and risk of a collection of individual instruments, we also need to obtain some insights and information on the portfolio of stocks as a whole. We thus implemented the fourth stage of the research algorithm, which consists of a comparison of green and non-green logistics portfolios. For the portfolio optimisation, we used the Monte Carlo method (or simulation) to model the probability of different outcomes in a process that could not easily be predicted due to the intervention of random variables. It is a technique used to understand the impact of risk and uncertainty in prediction and forecasting models. For this study, it was used to conduct repeat random sampling of the input space to generate 10,000 probable portfolios, based on calculated risks and returns, for the two groups: green and non-green. The sum of assets’ shares was equal to 1. Expected return and risk of the portfolios are presented in the earlier formulas. For this article, a comparison of the two kinds of portfolio was provided in terms of minimum risk (standard deviation) and maximum efficiency (the Sharpe ratio). The Sharpe ratio (Equation (5)) is the ratio of the expected excess return of a portfolio to the portfolio’s volatility. Therefore, an optimal portfolio should maximise the Sharpe ratio. A large Sharpe ratio indicates that an instrument’s returns (APR) are large relative to its volatility (standard deviation).
4. Results
4.1. Analysis of Historical Stock Data
First, we provided the descriptive statistics of the dataset, which consists of 32 logistics companies and the S&P 500 index’s adjusted close prices from 1 January 2007 to 4 April 2022 (
Table 4).
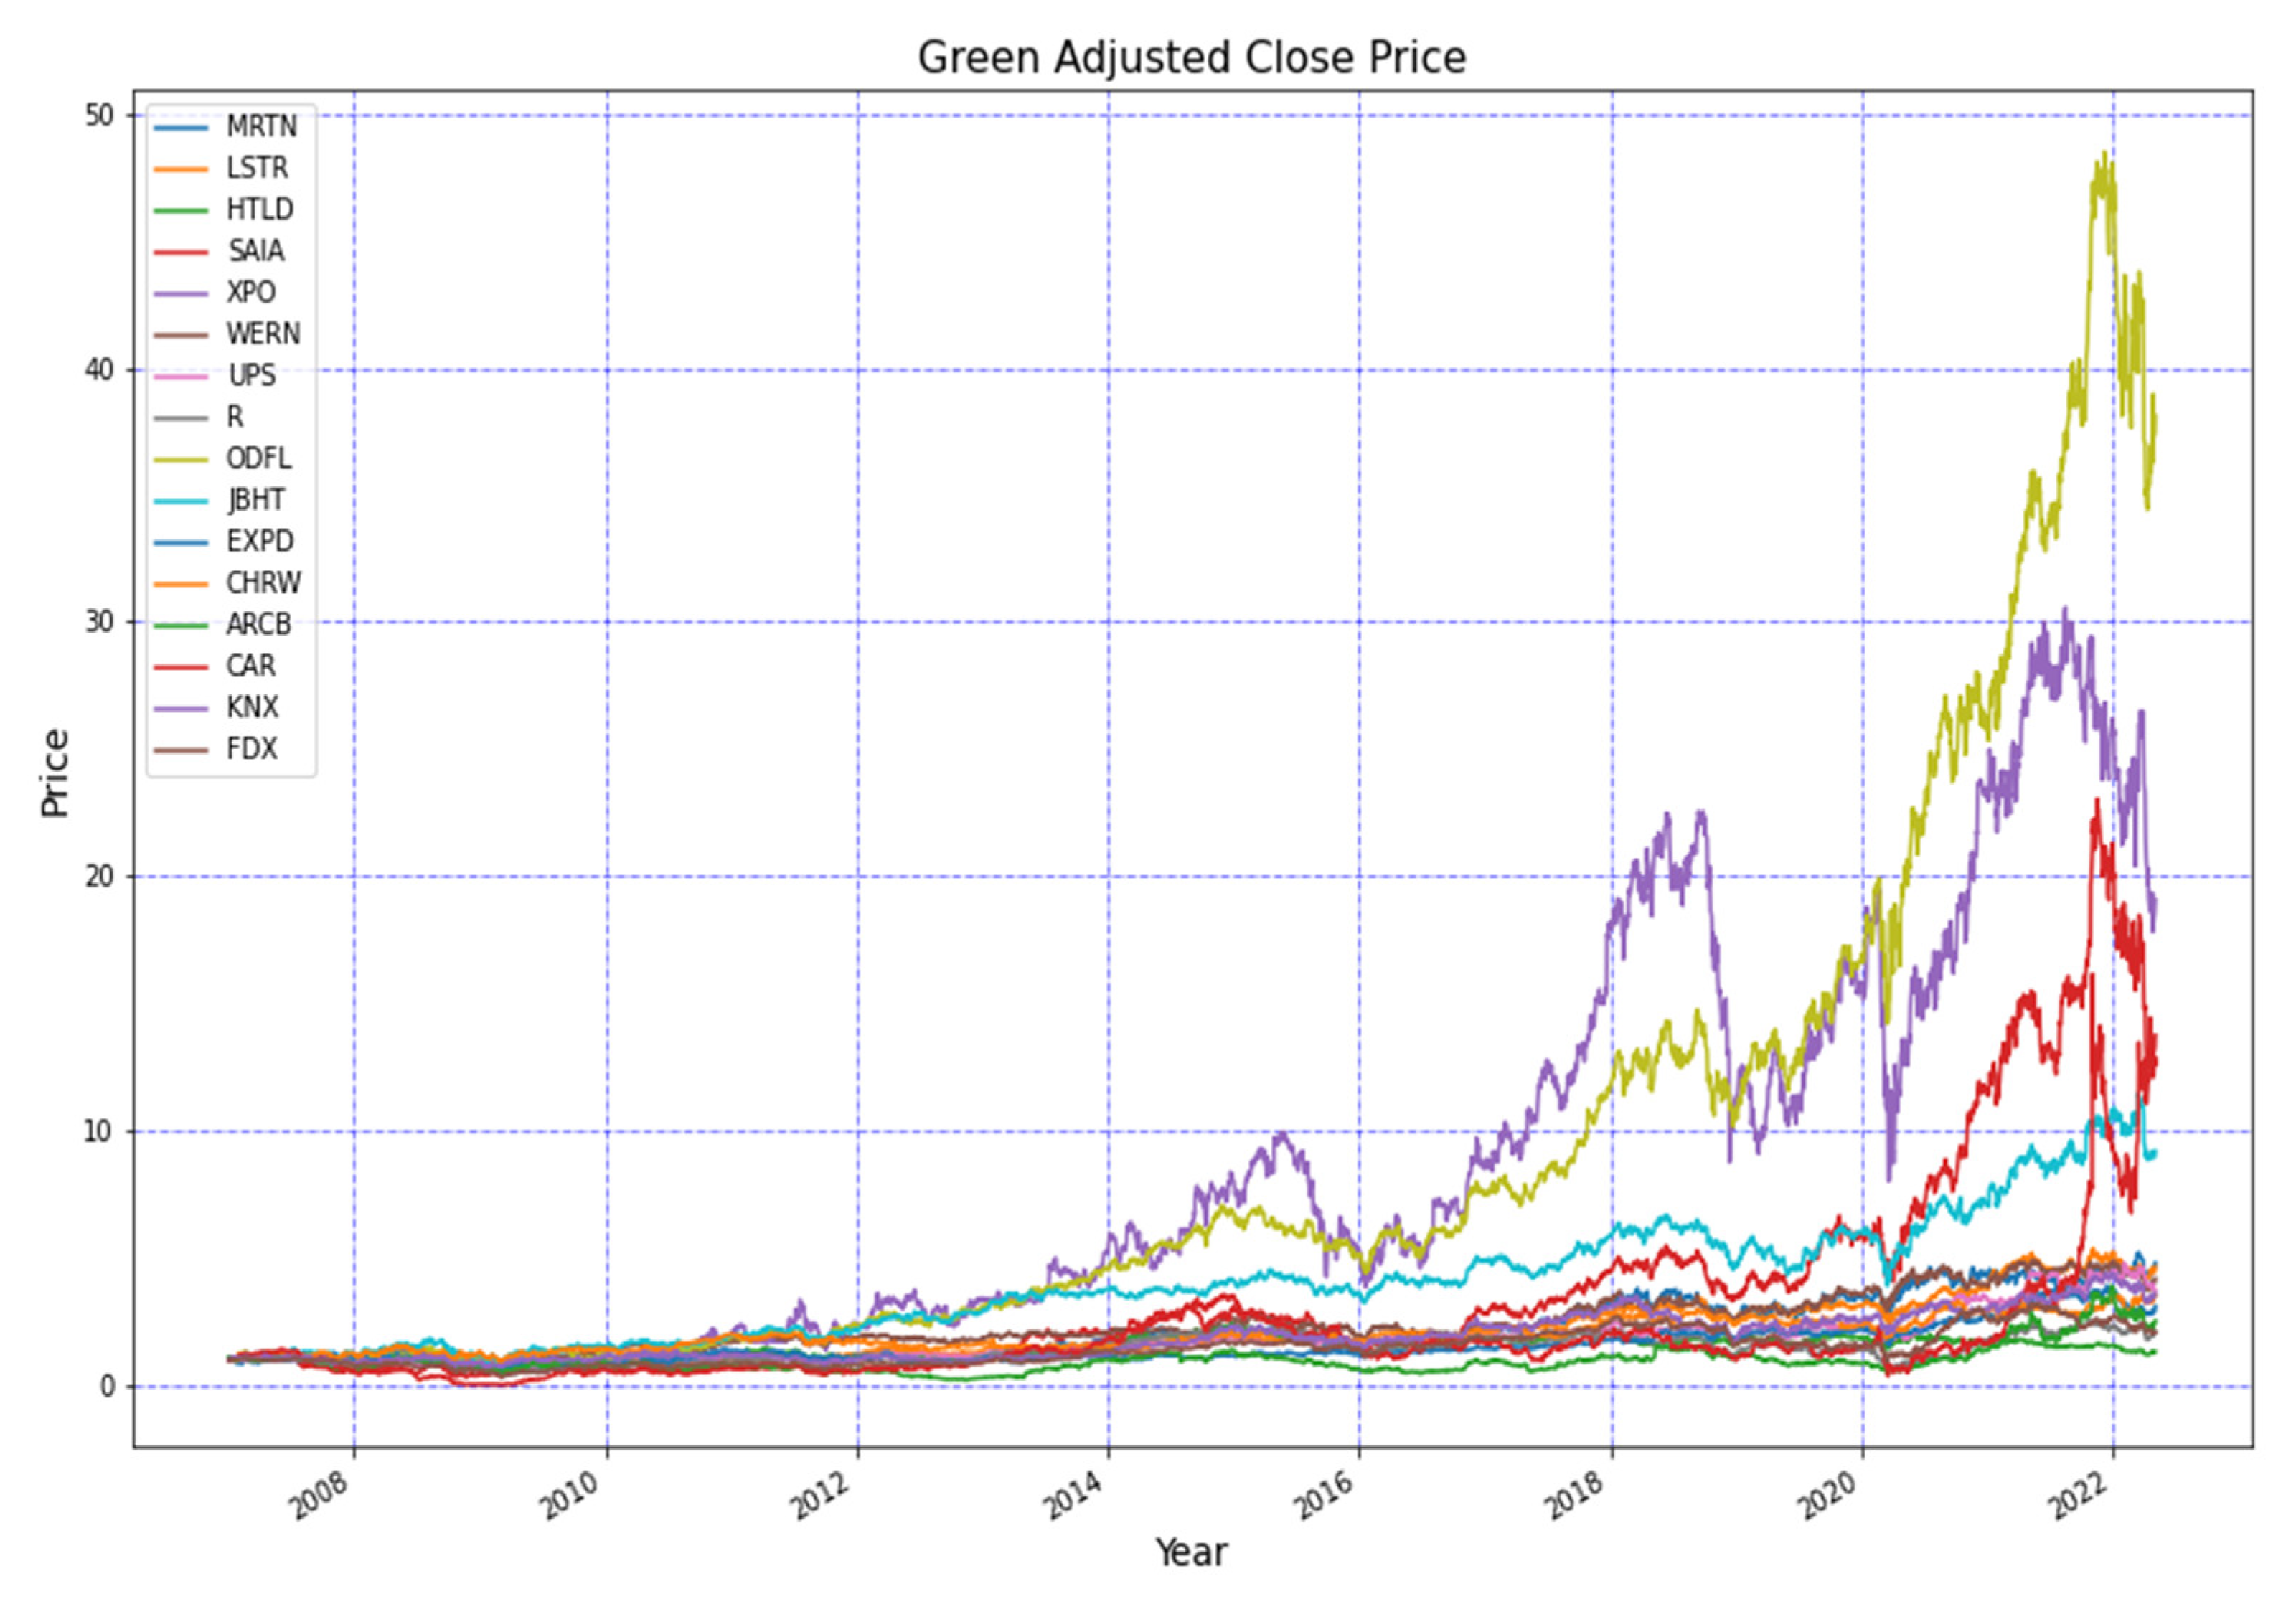
In a preliminary analysis of the dataset, the historical data of companies’ adjusted close prices was obtained to observe the collapses in stock prices, and log returns were calculated on the basis of the adjusted close prices. The graph of green companies’ adjusted close prices is presented in
Figure 2.
From
Figure 2, it can be seen that the stock prices of the green companies group show a general upward trend, although there are certain periods of stock price declines. In particular, the following shocks to the stock market can be highlighted:
2009: The Great Recession, including the US recession that lasted from December 2007 to June 2009, and the ensuing global recession in 2009.
2011: Black Monday, which refers to 8 August 2011, when US and global stock markets crashed because of a weakening US economy and a widening debt crisis in Europe.
2015–2016: A global decline in the value of stock prices between June 2015 and June 2016 due to different negative signals across the world. These included the effects of the end of quantitative easing in the US in October 2014, slowing GDP growth in China, a fall in petroleum prices, the Greek debt default in June 2015, a sharp rise in bond yields in early 2016 and the UK–European Union membership referendum (Brexit) of the same year.
2018: The shock to the stock market refers to some negative factors, such as President Donald Trump’s trade war with China, a slowdown in global economic growth and concern over missteps made by the Federal Reserve. Nevertheless, the general economy was doing well (with record low unemployment, strong GDP growth and relatively low inflation).
2020: Stock market crash due to the COVID-19 pandemic.
2022: Geopolitical shocks, including the Ukrainian crisis.
When the log return plot of green group is observed, it can be seen that the most volatile periods were the Great Recession and COVID-19 pandemic (
Figure 3).
From
Figure 4, which shows the adjusted close prices for the non-green group, it is clear that there is no general trend, and the companies’ values are more heterogeneous than those of the green group. It is also notable that the maximal prices of the green group are higher than those of the non-green one.
As
Figure 4 does not define a general time trend pattern, periods of stock price falls can hardly be seen, except for during the Great Recession and the period of the lockdowns due to the COVID-19 pandemic. Therefore, a plot of log returns should be more representative (
Figure 5).
In general, it can be highlighted that values of non-green companies’ log returns are more volatile, as can be seen from the graph of their stock prices (
Figure 4). However, the peaks of log return volatility can be distinguished in
Figure 5. These include:
2008–2009: The Great Recession.
2016: Global decline in the value of stock prices, as it affected green companies; the period when consequences of quantitative easing in the US appeared; the fall in petroleum prices; the Brexit referendum; etc.
2020: Global recession due to the COVID-19 pandemic.
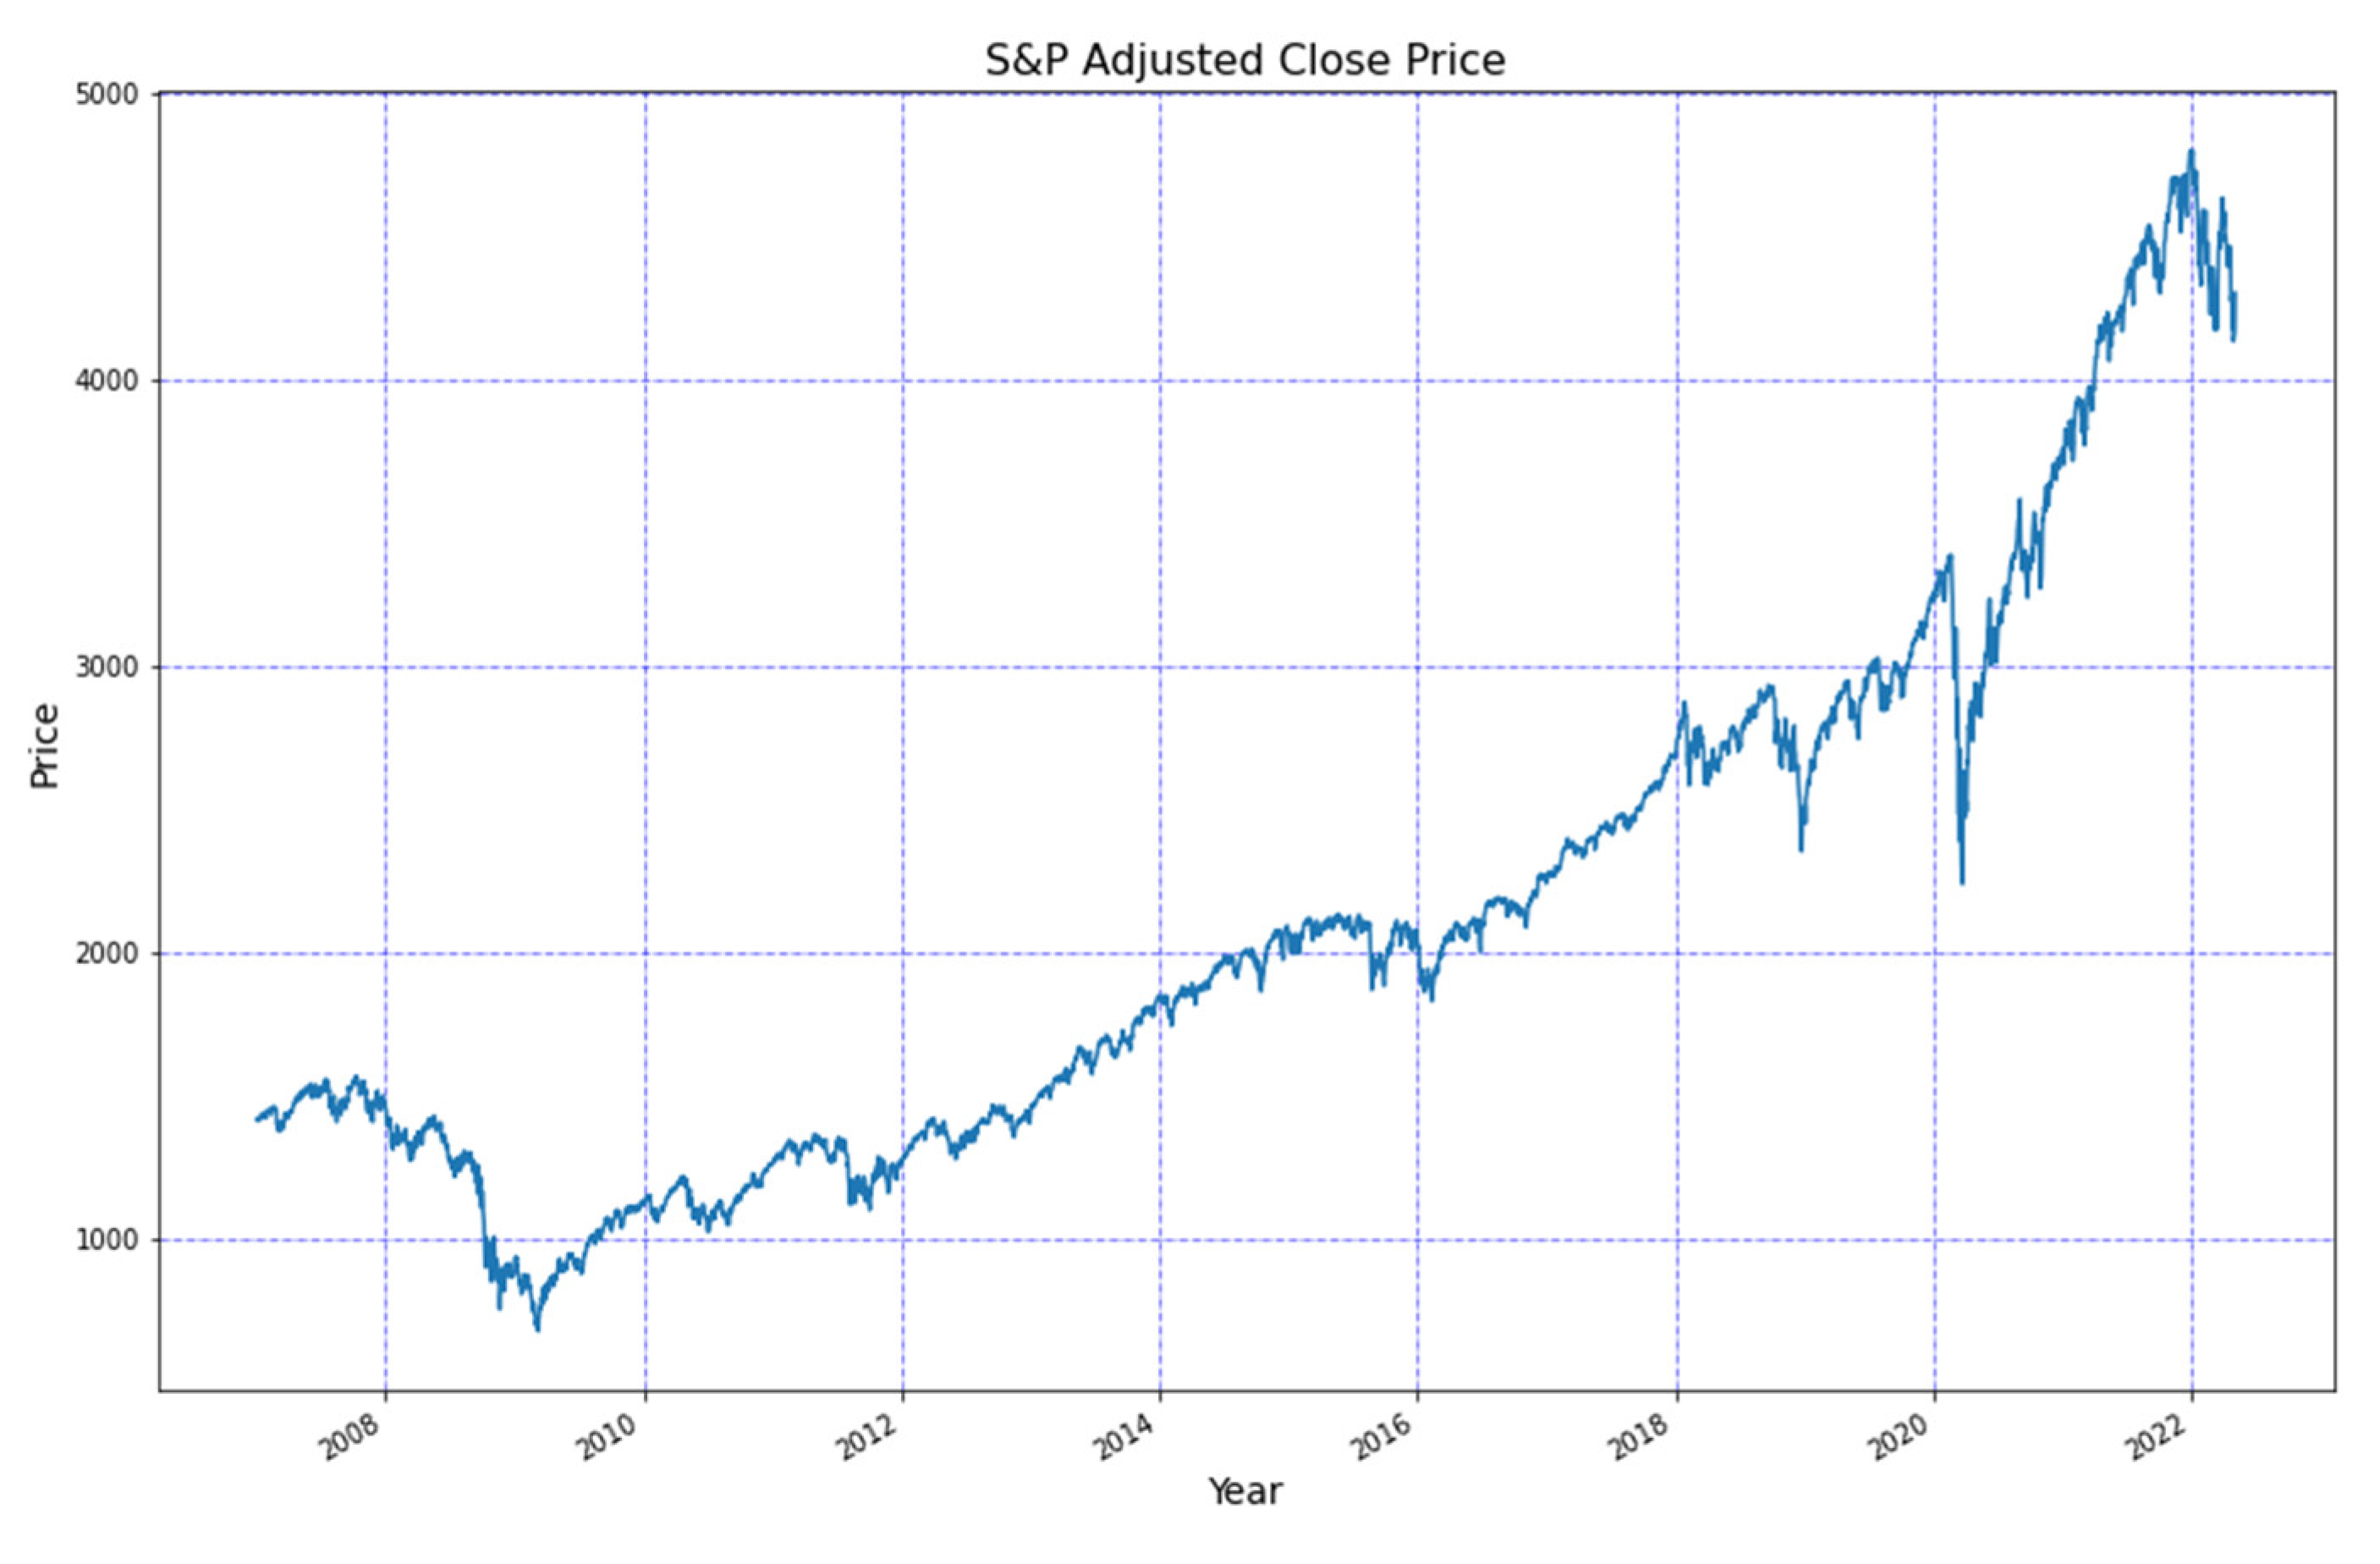
As a benchmark for the market, historical data from S&P 500 were analysed. Adjusted close stock prices of the S&P 500 are presented in
Figure 6.
The S&P 500 can be seen to show an increasing trend generally from 2009, except for some falls that are the same as for the green companies’ performance listed above.
The greatest volatility of the S&P 500 log returns is during the period of the Great Recession and at the beginning of COVID-19 pandemic (
Figure 7).
Risk in finance is commonly described by computing standard deviation as a measure of dispersion. This basic mathematical concept that measures volatility in the stock market is calculated on the basis of log return values. It determines the level of risk associated with investment, so that the higher the standard deviation of the stock price, the higher the risk that the stock bears. In fact, after examining the graphs with stock prices and log return plots, the riskiest situations for the observed companies and their stock performance can be seen. However, computing the standard deviation values allows us to identify when the risk was the highest during the risky periods.
The historical data on the stocks’ standard deviations are presented in
Figure A1,
Figure A2 and
Figure A3. It can be seen that the highest peaks of standard deviation were in 2008 and 2020 (the Great Recession and the pandemic), but it can also be seen that all the considered companies were exposed to a general trend, as was explained in the return analysis above, and the highs of the standard deviations repeat information about the stock price falls and the volatility of the stock returns.
4.2. Analysis of Risk–Return Plots
We provide a risk–return plot that depicts stock risk on the x-axis and returns on the y-axis. Such scatterplots are used to explain portfolio selection from modern portfolio theory by analysing the past performance of stocks. In our case, standard deviation was used as a measure of stock risk and APY (effective rate).
The first risk-versus-return plot is that for stocks in the green group (
Figure 8).
The green group stocks are shown mostly to have standard deviation equal to about 0.3 and APY of about 10%. Nevertheless, some stocks are riskier; for example, Avis Budget Group Inc. (CAR) has a standard deviation of −0.7 and an APY of −17%. Some stocks are more profitable and less risky, such as Old Dominion Freight Line (ODFL), with an APY −25% and a standard deviation of −0.34.
On the other hand,
Figure 9 shows the risk versus return plot of stocks in the non-green group. If the two scatterplots are compared with each other, it should be noted that the general performance of companies in the non-green group is worse. Although all the observed green group stocks have positive APY, four out of the 16 non-green group companies have negative APY; moreover, although most of the companies have positive values of APY, these are close to zero and with higher standard deviation (about 0.5), in comparison with green stocks (0.3).
As can be seen, the riskiest stock (average standard deviation 0.8) is Eagle Bulk Shipping Inc (EGLE), which also has the lowest stock APY (–38%). The second riskiest stock is Allegiant (ALGT), with standard deviation of –0.4 and an APY of –12%. Union Pacific company (UNP) shows both the least risky (average standard deviation 0.2) and the most profitable (APY 18%) performance in the stock market. Therefore, it can be reiterated that non-green companies do not create a general trend for the group.
A comparison with the USA stock market (results of S&P 500) shows the average standard deviation to be equal to 0.2 and the APY to be –7%. This confirms that the S&P 500 is not as risky as the groups of logistics companies, and hence not as profitable. Nevertheless, companies with a lower APY value have higher standard deviation, on average.
Therefore, from the risk–return analysis, the following findings can be drawn:
Periods with the highest volatility of green logistics stocks are similar to the whole US market (S&P 500 performance) and also for the non-green group of stocks. This means that we described the main US stock market shocks.
The green stocks are less volatile, and hence less risky, and more profitable when compared with the non-green stocks.
The green stocks showed exposure to general trends in the frame of the selected green logistics companies, in contrast with non-green stocks that are more disconnected within the group.
The logistics company groups are on average more profitable yet riskier than the S&P 500.
The Great Recession (2007–2009) and COVID-19 pandemic (2020) had the greatest impact, in terms of the US stock market, on stock volatility.
4.3. CAPM Analysis
CAPM, as has already been mentioned, is a set of metrics necessary for the financial analysis of stock performance. It considers the nexus between the expected return and the systematic risk of investing in an asset. The main idea of the model is that the higher the risk of investing in an asset, the higher the returns from it.
CAPM calculation begins by computing the pairwise correlation of stock log returns and S&P 500 log returns. This is required for the subsequent calculation of beta coefficients. The results of the coefficient of determination, or R-squared (the square of correlation), for stocks are presented in
Table A1. The coefficient of determination shows the proportion of the variation in the S&P 500 log return that can be predicted from the stocks log returns.
For a comparison of the two groups of stocks in terms of obtaining abnormal returns (alpha’s output),
Figure 10 provides bar plots for non-green (top) and green (bottom) stocks, where each colour depicts a company’s stock. When analysing the alpha values, attention should be paid to
Table 3 for an interpretation of alpha and beta values.
As can be seen in
Figure 10, there are stocks with negative and close to zero alpha in both groups. Three non-green stocks have negative alpha, with the lowest value equal to −0.27; EGLE shows the highest average risk and lowest average loss in return. Five green stocks have negative alpha, with Heartland Express Inc. (HTLD) having the lowest value (−0.115). It can also be highlighted that the negative alpha values of green stocks, with the exception of HTLD, do not exceed 0.1; rather, they are close to zero, in the range of −0.1 to 0.4, which means that investment in such stocks will earn adequate return for the risk taken. All non-green stocks with negative alpha exceed −0.1, which is why investment in such non-green stocks is riskier for returns in comparison with green ones.
At the same time, non-green stocks with positive alpha have values that are around 0.1, with Atlas Air Worldwide Holdings (AAWW) and Hawaiian Holdings Inc. (HA) having the highest values (0.144 and 0.143, respectively). The green stocks with the highest values are CAR (0.39) and Saia Inc. (SAIA; 0.267). It should be noted that CAR also shows the greatest risk after EGLE, according to a comparison of the graphs with the risk versus return plots (
Figure 7 and
Figure 8); however, CAR has one of the highest stock returns, while EGLE has the lowest one. The situation is understandable because a positive alpha indicates that stock investments earn excess returns for the risk taken, which is why CAR stock, with the second highest risk and the highest alpha, has one of the highest annual percentage yields, while EGLE, with the highest risk and the lowest alpha, has the lowest annual percentage yield.
Therefore, green stocks, on average, earn adequate return for the risk taken, while non-green stocks earn abnormal return for the risk taken, although there are also non-green stocks that are riskier than other logistics stocks. In comparison, there are green stocks that give the highest return for the risk taken, which may increase the attractiveness of investment in the group of green stocks.
Figure 11 shows a comparison of beta coefficients between the two groups, representing the systematic risk of the stocks. The top graph shows the non-green stocks, and the bottom shows the green stocks, with each colour depicting a company’s stock.
From the top of the
Figure 11, it can be seen that most of the stocks (14 out of 16 companies) have beta higher than 1, which means that these stocks are more volatile than the US stock market. The highest beta value is obtained by EGLE, and it is worth mentioning that this stock also has the highest alpha, making it the most volatile of the non-green stocks and the second highest out of all the observed logistics stocks.
When considering the EGLE stock conditions, it should be explained that the stock is very volatile, according to beta value, and very risky, according to alpha value, which is why it has the lowest APY. In contrast, the two other non-green stocks here with negative alpha, Radiant Logistics Inc (RLGT) and USA Truck (USAK), have beta lower than 1 (0.58 and 0.841, respectively), which means that these stocks are less volatile than the stock market. However, the most volatile stock is the green stock CAR, with beta equal to 1.705. Nevertheless, it is one of the most profitable stocks, and it confirms the highest positive value of alpha (0.39). SAIA presents the second highest beta value (1.4) and alpha value (0.267) of the green group of stocks. It is also one of the most profitable stocks in the whole sample.
On the other hand, it can be mentioned that most green stocks have values of around 1, which is close to the overall stock market performance, and seven stocks do not exceed it.
To conclude the alpha and beta comparisons, it can be highlighted that the alpha and beta values mostly repeated each other’s performances in terms of stock and performance on the stock market. In addition, graphic information about CAPM can be found for non-green stocks in
Figure A4 and for green stocks in
Figure A5 as plots of stock log returns versus S&P 500 log returns. These illustrate the beta of stocks as a slope of the regression line.
4.4. Portfolio Comparison
The last stage of the research is to compare the US logistics companies as two portfolios, the first consisting of only non-green stocks and the second comprising only green stocks.
So far, the research has not been concerned with the expected return and risk of a collection of individual stocks, but rather it has preferred insights and information on the portfolio of stocks as whole.
Therefore, 10,000 simulated portfolios were created consisting of non-green stocks with data points (portfolios) based on their Sharpe ratio performance (the higher they are, the denser the pink). The result of simulation for the non-green group is presented in
Figure 12.
It can be seen that in the portfolio with the least risk, the annualised return is 0.035, the annualised risk is 0.186 and the Sharpe ratio is −2.505. In the portfolio with the maximum Sharpe ratio, the annualised return is 0.027, the annualised risk is 0.327 and the Sharpe ratio is −1.447. Both portfolios have negative Sharpe ratios, meaning that the risk-free rate is greater than the portfolio’s return. This is explained by the fact that the stock market is under pressure from crises and geopolitical shocks at the moment.
The same algorithm is applied to green stocks in
Figure 13.
It can be seen that in the portfolio with least risk, the annualised return is 0.473, the annualised risk is 0.447 and the Sharpe ratio is −0.061. In the portfolio with the maximum Sharpe ratio, the annualised return is 1.253, the annualised risk is 0.800 and the Sharpe ratio is 0.941. In this case, a positive Sharpe ratio is obtained by the portfolio with maximum Sharpe ratio, while the portfolio with minimum risk has a negative Sharpe ratio value; however, it is close to zero, which is much smaller than for the non-green stocks.
Figure 14 provides a comparison of the non-green and green portfolios, revealing that the performance of the green portfolio is better overall. The weights of the stocks in the portfolios are depicted in
Table A2 and
Table A3. Therefore, times of crisis give a negative Sharpe ratio of the markets and risk-free assets increase their value; in contrast, the Sharpe ratio becomes negative for risky assets.
It can be seen that the optimised green portfolio containing stocks of US logistics companies at the point of the maximum Sharpe ratio gives a positive ratio value (0.94), whereas the corresponding non-green portfolio returns a negative value (−1.45). In addition, the returns and risks for the green portfolio are higher than for the non-green one.
Such results are obtained even during crisis, with high volatility on the global markets, geopolitical shocks and various sanctions, such as the embargo on energy from Russia that directly exerts pressure on the logistics and transport industry. Consequently, it can be concluded that green companies are more resistant to market volatility during the crisis.
To test the statistical significance of the results obtained in the portfolio comparison, we conducted a two-sample t test with equal variances, a two-sample t test with unequal variances with using Welch’s formula and a median test based on the returns, risks and Sharpe ratios of our 20,000 randomly generated portfolios (
Table 5).
These tests help us to conclude that there is a difference between green and non-green indicators, and it is statistically significant. The two-sample t test confirmed the significant difference between green and non-green portfolios in terms of the mean values of their indicators, whereas the median test proved it in terms of median values. Therefore, we can conclude that the results of the portfolio comparison are valid, due to the significant difference between the green and non-green portfolios.
5. Discussion
As a result of the study, it can be concluded that the proposed hypothesis, based on a literature review of previous studies, is confirmed.
As suggested by the previous research of Chelawat and Trivedi (2015), ESG investing enhances investment returns without any significant difference in risk [
19]. However, Zehir and Aybars (2020) provided a different point of view on the issue, finding there to be no relationship between ESG score and portfolio performance [
20], while the research of Kumar et al. (2016) showed ESG portfolios to be less volatile in their stock performance and to generate higher returns than non-ESG ones [
21].
In the current article, individual green logistics stocks were less volatile than non-green ones but more volatile than the market (S&P 500), according to the results of standard deviation values and an analysis of stock log returns, especially during periods of high volatility on the US stock market (crises, news shocks). Additionally, CAPM analysis indicated better performance of green logistics stocks in comparison with the US market (S&P 500) than non-green stocks. Analysis of alpha values showed that some non-green alphas had the lowest value, equal to −0.27 (EGLE, which had the highest average risk and lowest average loss in returns), −0,13 (USAK) and −0,12 (RLGT). Five green stocks had negative alphas, with HTLD having the lowest value (−0.115); nevertheless, with the exception of HTLD, green stocks did not exceed 0.1 and were close to zero, in the range of –0.1 to 0.4, meaning that investment in such stocks would earn adequate returns for the risk taken, leading to more investor confidence. All non-green stocks with negative alpha exceeded 0.1, which is why, in comparison with green stocks, investment in these is riskier for the returns.
With regard to other EGLE stock conditions, it should be explained that the stock is also very volatile, according to beta value, and very risky, according to alpha value, which is why it has the lowest APY, as is seen from the risk–return plot. In contrast, two other non-green stocks with negative alpha, RLGT and USAK, had beta lower than 1 (0.58 and 0.84, respectively), which means that the stocks are less volatile than the stock market. However, the most volatile stock was CAR, a green stock with beta equal to 1.705. Nevertheless, it is one of the most profitable stocks, and it also had the highest positive alpha value (0.39). SAIA had the second highest beta value (1.4) out of the green group of stocks, as well as alpha (0.267). It is also one of the most profitable stocks out of the whole observed sample. On the other hand, most of the green stocks had beta values of around 1, which put them close to the overall stock market performance, and seven stocks did not exceed it, meaning that green logistics stocks are mostly less volatile than the market.
Hence, the overall performance of the green logistics portfolio was better. The optimised green portfolio with stocks of US logistics companies at the point of the maximum Sharpe ratio give a positive ratio value (0.94), whereas the corresponding non-green portfolio gave a negative Sharpe ratio (−1.45). The green portfolio with the minimum risk also gave a higher Sharpe ratio, which was negative but close to zero (−0.06), in contrast with the non-green portfolio, for which the ratio was equal to −2.51. In addition, the analysis showed that the returns and risks of the green portfolio were higher than those of the non-green portfolio. Therefore, it can be highlighted that, even in the current period of US economic recession, the green logistics portfolio showed a positive Sharpe ratio in contrast to the non-green one. However, moments of crisis usually give a negative Sharpe ratio for the markets, and in particular the US stock market (Nieto and Rubio, 2022), as risk-free assets increase in value, while for risky assets the ratio becomes negative [
30].
6. Conclusions
In the current research, we have analysed the stock performance of several large logistics companies in the US and estimated their performance relative to the US stock market (using the S&P 500 as a benchmark) from an investor’s point of view. Due to restricted access to the full database of logistics companies operating in the US, we have considered only the 32 largest companies listed on the US stock market. This means that the dataset does not capture the patterns of all companies in the logistics industry. However, given that the companies with the largest market shares have been considered, it is likely that the current paper mirrors the general picture of how logistics companies’ commitment to ESG strategy can improve their stock performance on the market and increase their stock return.
We obtained CAPM and 20,000 simulated portfolios, which confirmed the hypothesis stated in the paper: that a green logistics portfolio will have a better performance on the stock market than non-green one, in terms of portfolio investment effectiveness.
We can also conclude the following. First, periods of the highest volatility, which were described for green group, are similar to the whole US market (S&P 500 performance) and non-green group of stocks. This means that we described the main US stock market shocks in the research period. Second, green logistics stocks are less volatile, and hence less risky, and more profitable when compared with non-green logistics stocks. Third, the logistics companies, divided into green and non-green groups, were on average more profitable and riskier than the S&P 500. Fourth, the Great Recession (2007–2009) and the COVID-19 pandemic (2020) had the greatest impact in terms of the US stock market on stock volatility. Fifth, the optimised green logistics portfolio, as of April of 2022, had higher returns, risks and Sharpe ratios than non-green one.
Our article supports previous studies and outlines that being labelled as a green company may be conducive to enhanced performance, from an investor’s point of view.
Overall, the obtained results support several earlier articles concerning the relationship between a company’s commitment to ESG policy and its stock performance. The novelty of our research lies in its confirmation of the hypothesis concerning better green logistics companies’ stock performance on the US stock market. We also established additional result in terms of green companies’ higher resilience to crisis (e.g., investment portfolio during the Ukrainian crisis).
The research has some limitations. We have only considered companies in the US transport and logistics sector, which reduces the heterogeneity of the data and eliminates institutional differentiation. Additionally, we investigated companies with different firm sizes, since we were examining the general trend of green and non-green groups of logistics stocks. Future research may consider other indicators that can influence companies’ stock performance (e.g., market value, net income, Tobin’s Q, financial leverage) using panel data analysis. In addition, the resilience of green stocks to crises may be investigated by event study analysis.


