Article

Urban Green Space Pattern in Core Cities of the Greater Bay Area Based on Morphological Spatial Pattern Analysis

1
School of Architecture, South China University of Technology, Guangzhou 510641, China
2
Guangzhou Municipal Key Laboratory of Landscape Architecture, Guangzhou 510641, China
*
Author to whom correspondence should be addressed.
Sustainability 2022, 14(19), 12365; https://doi.org/10.3390/su141912365
Submission received: 16 August 2022 / Revised: 22 September 2022 / Accepted: 26 September 2022 / Published: 28 September 2022
(This article belongs to the Special Issue Our Future Earth and Sustainable Ecological Environment and Society)

Abstract

:
Urban green spaces (UGSs) play a crucial role in supporting urban ecological systems and improving human well-being in cities. The spatial patterns of UGS are vital bases for analyzing various ecological processes. However, few studies have investigated morphological UGS patterns, especially in high-density cities. The Guangdong–Hong Kong–Macao Greater Bay Area (GBA) in China is one of the four major bay areas in the world. The aim of this study was to investigate the patterns and distributions of UGS in the core GBA cities (Guangzhou, Shenzhen, Zhuhai, Hong Kong, and Macao), and discuss the shortcomings and potential environmental impacts of the contemporary patterns of UGS. Morphological spatial pattern analysis (MSPA) was used to analyze the spatial UGS pattern. Seven MSPA metrics (core, islet, perforation, edge, loop, bridge, and branch) were assessed to measure morphological UGS patterns. The results showed that: (1) Hong Kong has the highest quality habitat, with a large and continuous distribution of UGSs, and a few smaller green spaces scattered in built-up areas; (2) Guangzhou’s UGSs are unevenly distributed, with large green spaces concentrated in the northern part of the city and many small, scattered green spaces distributed in built-up areas, demonstrating the most prominent pattern of green space fragmentation; (3) green space patches in the Shenzhen–Hong Kong region exhibit a relatively complex form; and (4) the UGS in Zhuhai–Macao is relatively discrete, and its connectivity is relatively low. These findings not only improve the depth of understanding of the spatial pattern of UGS in the GBA, but also confirm the applicability of MSPA in the analysis of spatial patterns of UGS.

1. Introduction

Ongoing rapid urbanization has resulted in severe environmental problems, such as frequent extreme weather events [1,2], increased heat island effects [3], and difficulties in pollutant dispersion [4]. Urban green space (UGS) has been suggested as an essential factor for advancing human well-being and sustainable urban development [5,6]. Several studies have substantiated the effect of UGSs on carbon sequestration and oxygen release [7,8], cooling and humidification [9,10], dust and haze reduction [11,12], urban ventilation improvements [13], and biodiversity conservation [14,15], thereby significantly improving urban environmental quality.
The ecological benefits of UGSs are clearly influenced by their spatial pattern, which has received continuous attention from many scholars [12,16,17,18]. Studies have shown that large green areas provide critical ecosystem services, whereas fragmented and scattered patches hinder or diminish the relative ecological benefits [19,20]. UGSs have a significant impact on land surface temperature (LST); a higher proportion of UGSs is conducive to reducing the LST [21,22]. The patch density and degree of aggregation of UGSs are significantly and negatively correlated with LST [23,24]. The complexity of the shape of the green space edge significantly affects the cooling effect, although this effect is somewhat contradicted by the results of different studies [25,26,27,28]. Guo et al. and Li et al. showed that the complexity of the edges of UGSs was significantly positively correlated with LST [25,26], whereas Peng et al. and Liu et al. showed that the complexity was significantly negatively correlated with LST [27,28]. UGSs with a high degree of connectivity frequently serve as urban ventilation corridors, improving the atmospheric environment [29], and are also important for urban biodiversity conservation [30]. McRae et al. performed simulations and found that creating corridors to promote UGS connectivity could significantly improve urban ventilation [31]. Imai and Alexis found that connectivity is a major influence on biodiversity, and that maintaining the natural network interoperability of the UGS is the most effective way of conserving biodiversity [30,32].
Most relevant studies use landscape metrics to quantify the overall spatial pattern of UGSs [23,33,34,35]. The selected landscape metrics include class area (CA), mean area (AREA_MN), patch density (PD), edge density (ED), aggregation index (AI), number of patches (NP), landscape shape index (LSI), and the largest patch index (LPI) [36]. Studies have substantiated that rapid urbanization has led to the replacement of surfaces covered with plants by impermeable surfaces, with an obvious trend towards fragmentation of the UGS pattern and small, sporadic green spaces are overwhelmingly dominant in terms of quantity [37,38,39,40]. This phenomenon is particularly evident in central urban areas. Li et al. used landscape metrics, including the LPI and LSI, to quantify the degree of fragmentation of UGSs in Beijing [37]. Rapid urbanization has contributed to a high level of fragmentation of UGSs, with dramatic changes in spatial patterns of UGSs. Saeedeh et al. investigated the trend in landscape changes in district 2 of Tehran, based on landscape metrics, and the results showed that increasing the NP and reducing the AREA_MN is an essential index of fragmentation [38]. Gao et al. analyzed landscape metrics and determined that the number of large green spaces in Shanghai is low, and the degree of fragmentation of green space patches within the central city is significantly high [39]. Gao et al. showed that the number of green space patches in Chengdu is high, with a predominance of small, sporadic green space types and a low density of green space patch edges [40].
However, these landscape metrics can only quantitatively reflect the spatial pattern of UGSs; however, it is difficult to implement the spatial location of UGSs. Unlike landscape metrics analysis, morphological spatial pattern analysis (MSPA), which has emerged in recent years, is a spatial pattern metric based on the principles of mathematical morphology [41], which can classify green spaces into seven types—core, islet, perforation, loop, bridge, edge, and branch—which do not overlap each other. The method not only quantifies various spatial patterns with indicators, but also graphically presents the spatial patterns of green spaces [42], which helps to provide specific spatial strategies oriented to optimize the planning and construction of green spaces. MSPA has mainly been applied to the study of ecological source identification and ecological corridor analysis [43,44]. The core areas obtained from MSPA are often identified as ecological source sites. Combining MSPA and Conefor Sensinode (network connectivity analysis) methods to identify the MSPA metrics of UGSs and provide clear guidelines on where the conservation management efforts should be targeted [45,46]. In addition, some studies demonstrated the applicability of MSPA to the analysis of the spatial pattern of the UGSs [12,47,48,49]. Using MSPA metrics to analyze the spatial pattern for UGS evaluation, adjustment, and optimization [50,51,52,53], Wickham et al. conducted a national assessment of green infrastructure in the United States [51]. Wei et al. applied MSPA to explore what kind of UGS would be better for ecological benefits and to prioritize the construction of UGSs [52]. Xie et al. found that edge, branch, and bridge types of UGS have a better cooling effect, which is used as a basis for optimizing green space in practice [53].
In the context of rapid urbanization, a targeted analysis of the green space pattern in high-density cities is more practically relevant. The Guangdong–Hong Kong–Macao Greater Bay Area is one of the four major bay areas in the world, and is one of the most modernized, economically vibrant, and open regions in China. Guangzhou, Shenzhen, Zhuhai, Hong Kong, and Macao are the five cities with the highest degree of urbanization in the Greater Bay Area [54]. The five cities have similarities and as well as different features in urban spatial development and the construction of green space patterns, which is of high research value. Therefore, the aims of this study were: (1) to quantify the UGS spatial pattern by MSPA metrics; and (2) compare the similarities and differences in spatial patterns of UGSs between the locations and explore the potential impact of UGS patterns on the environment. These results could contribute to furthering our understanding of the spatial pattern of UGSs, and provide a valuable reference for future planning and managing the UGSs of high-density cities.

2. Materials and Methods

2.1. Study Area

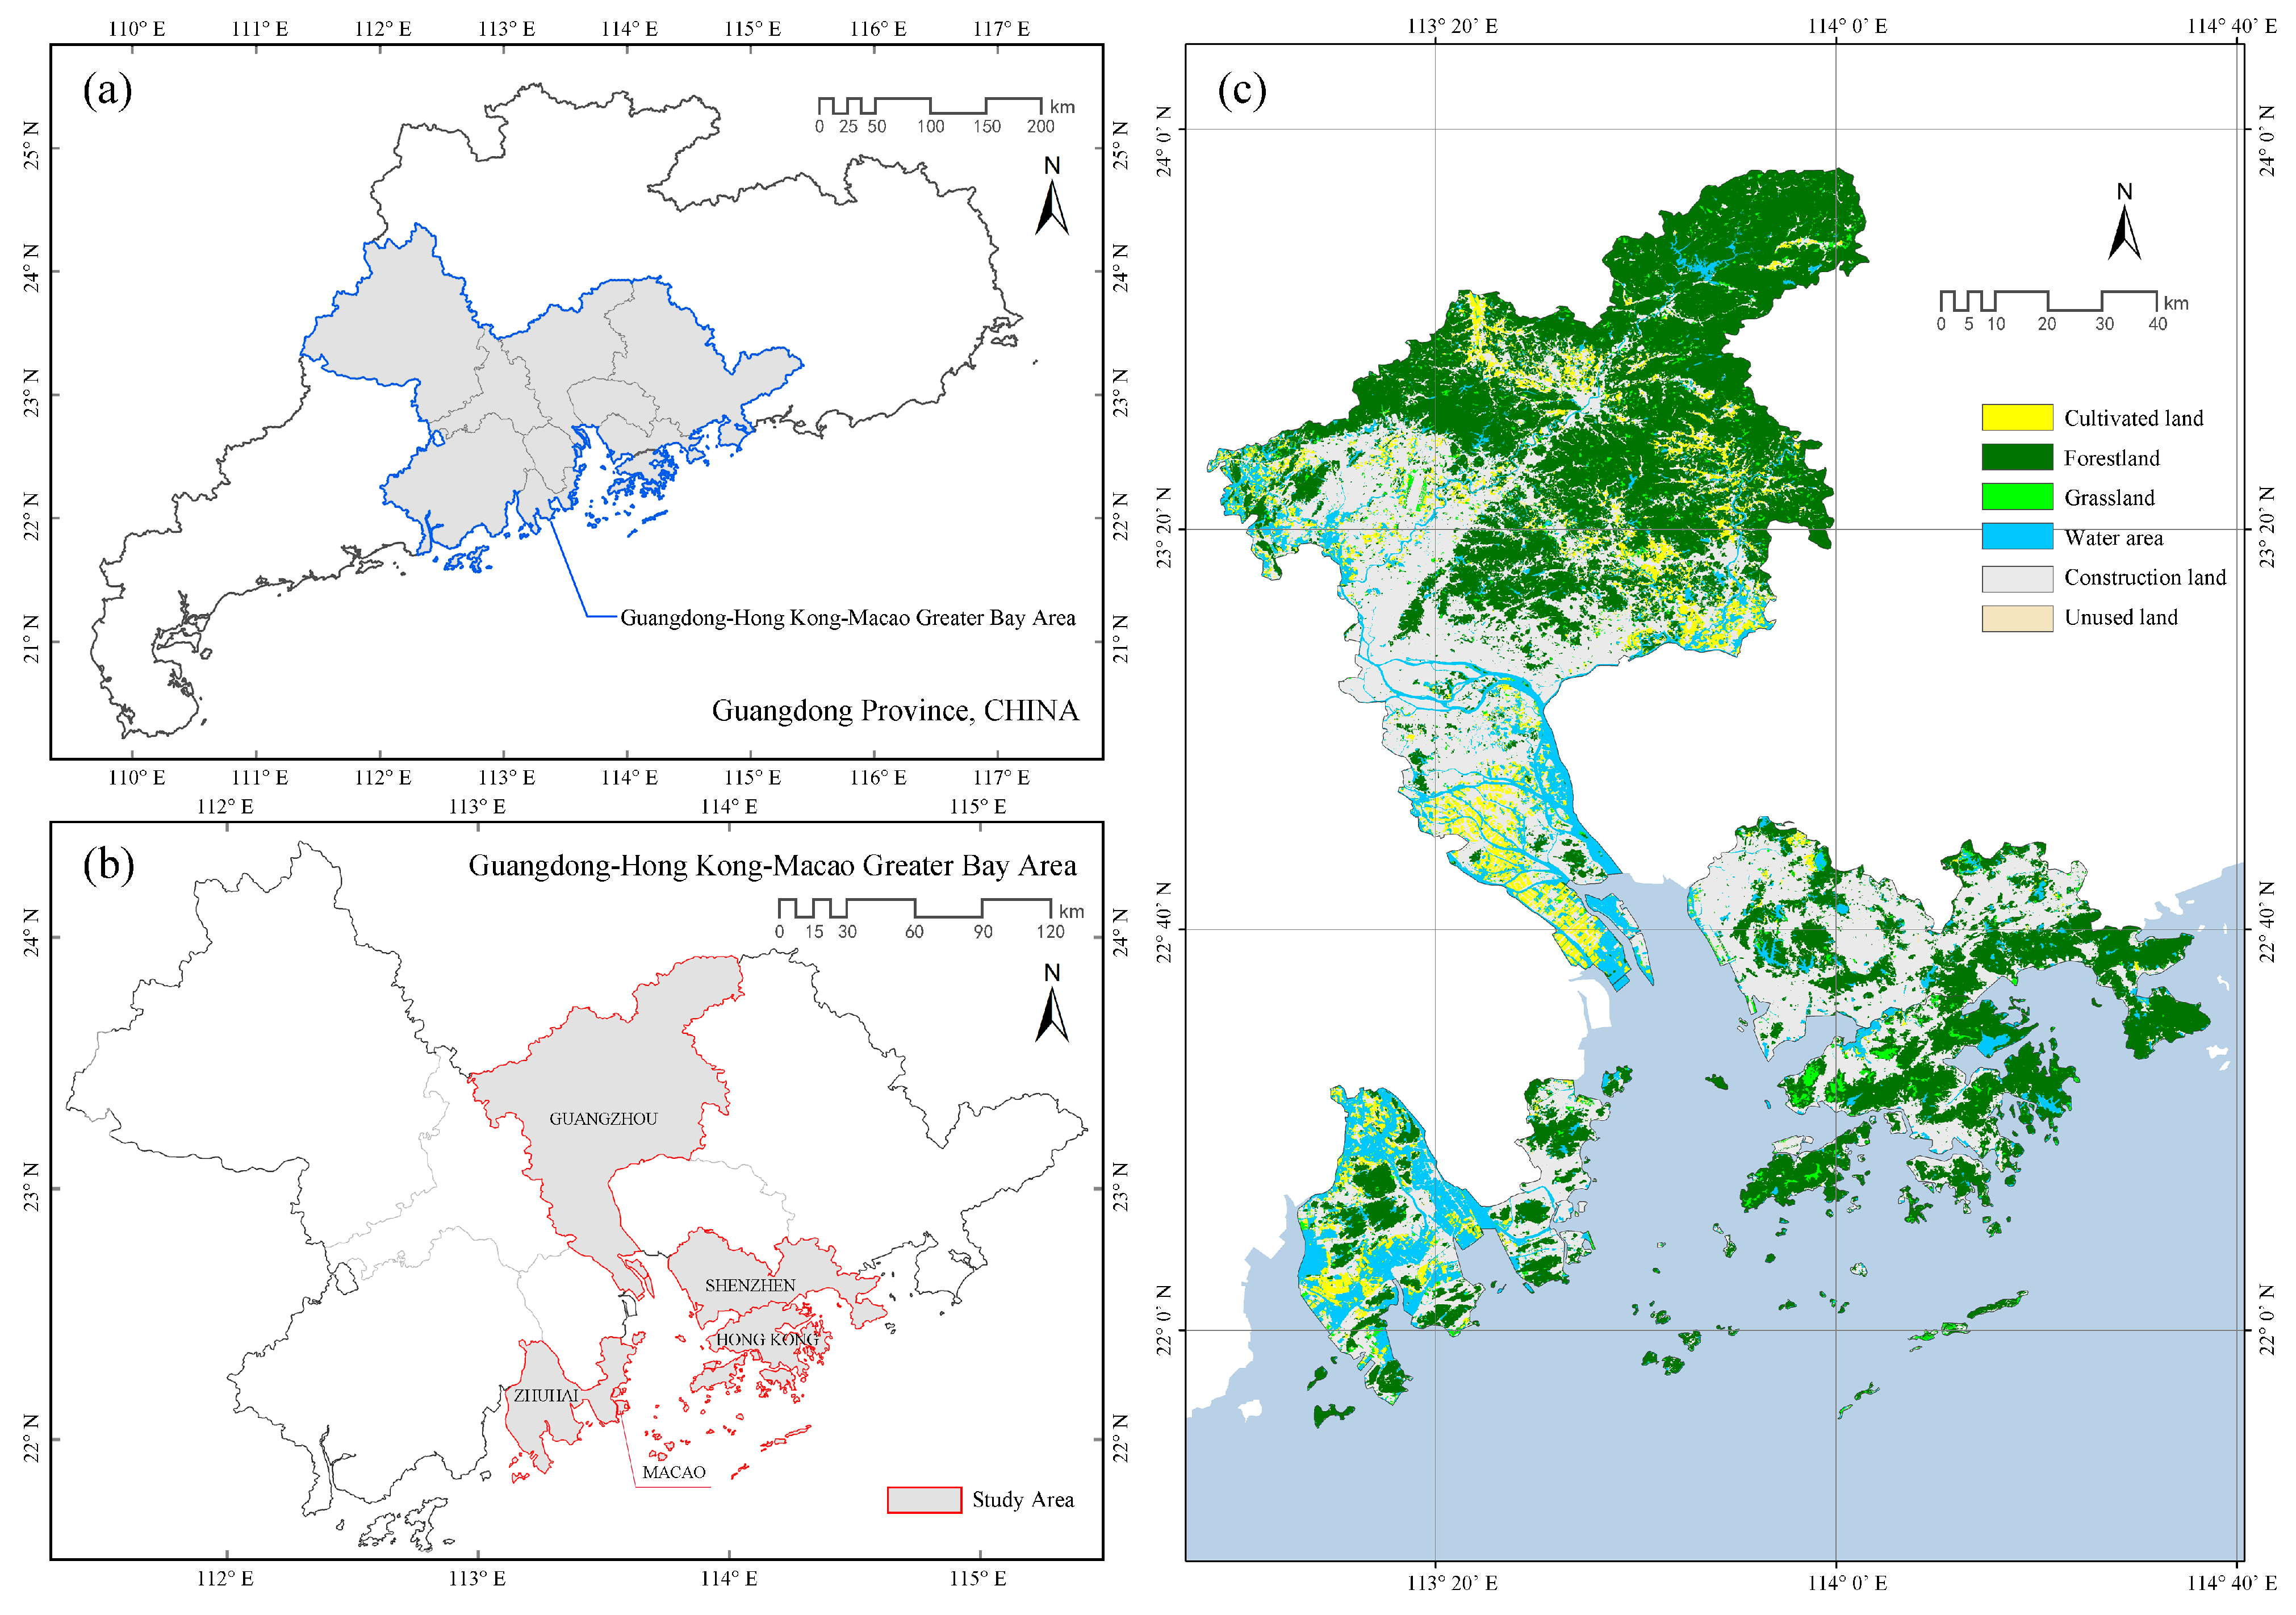
The Guangdong–Hong Kong–Macao Greater Bay Area city cluster is located on the coast of southern China, which is rich in natural resources and has excellent ecological base conditions [54]. Rapid urbanization in recent years has given rise to high-density built-up areas, of which Guangzhou, Shenzhen, Zhuhai, Hong Kong, and Macao (Figure 1) are core cities with a high level of urban development in the Greater Bay Area city cluster. As shown in Figure 2, utilizing the municipal administrative boundaries of the five cities as the study area (21°84′ N–23°94′ N, 112°95′ E–114°62′ E), the total area is 11911.97 km2, accounting for 21.41% of the total area of the Greater Bay Area city cluster. This area lies in a subtropical climate zone with significant maritime climatic characteristics [55].
Guangzhou is the capital of Guangdong Province and the central city of the Greater Bay Area, and it is of great importance at both the geographical location and economic level. Hong Kong is adjacent to Shenzhen, whereas Macao is adjacent to Zhuhai, both of which are located in Guangzhou’s eastern and western wings and across the sea from Guangzhou, respectively. Due to their unique geographical locations, Hong Kong and Shenzhen have continuous geographical characteristics; thus, the two cities are treated as the Shenzhen–Hong Kong zone. At the same time, Zhuhai and Macao are treated as the Zhuhai–Macao region because they are equally intertwined, and Macao is substantially smaller in size. Therefore, this study divided the five cities into three regions for comparative analysis: Guangzhou, Shenzhen–Hong Kong, and Zhuhai–Macao. Shenzhen and Hong Kong have had different urban development histories and modes of urban construction [56]; therefore, the Shenzhen–Hong Kong zone was divided into Shenzhen and Hong Kong for separate studies.

2.2. Data Sources and Processing

Sentinel-2A remote sensing images were obtained from the European Space Agency (ESA) Copernicus Open Access Hub (https://scihub.copernicus.eu/ accessed on 20 July 2021). The remote sensing image had a spatial resolution of 10 m. The remote sensing image data were collected with a cloud cover of less than 5%. The remote sensing images were preprocessed for radiometric calibration and atmospheric correction using Sen2Cor software, and resampled through SNAP software. Machine learning land use and land cover (LULC) classification was developed through a random forest (RF) classifier. The image was classified into six LULC categories—cultivated land, forestland, grassland, water area, construction land, and unused land (Table 1)—with reference to the CAS land use classification system [57], and the final LULC data for the study area were obtained (Figure 2c). The Kappa coefficient was calculated to confirm the validity and accuracy of the results. The Kappa coefficient of the land decoded results was 0.852, with the required accuracy value [58,59].

2.3. Morphological Spatial Pattern Analysis

Morphological spatial pattern analysis (MSPA) is a method developed by Peter Vogt to identify and classify the morphological spatial patterns of corresponding images based on mathematical morphology [41]. The suitability of the MSPA method for multi-scale applications has previously been demonstrated. The method can be used to assess the spatial pattern and type of urban green space at the neighborhood scale, as well as the district and city scales [12,47,51,60], and can also be combined with other methods to assess the connectivity of green space patches [53,61], providing a reference for the integration and optimization of green space system patterns and sustainable urban development [44]. The analysis is based on the Guidos ToolBox software, which was developed by European Commission Joint Research Centre (JRC).
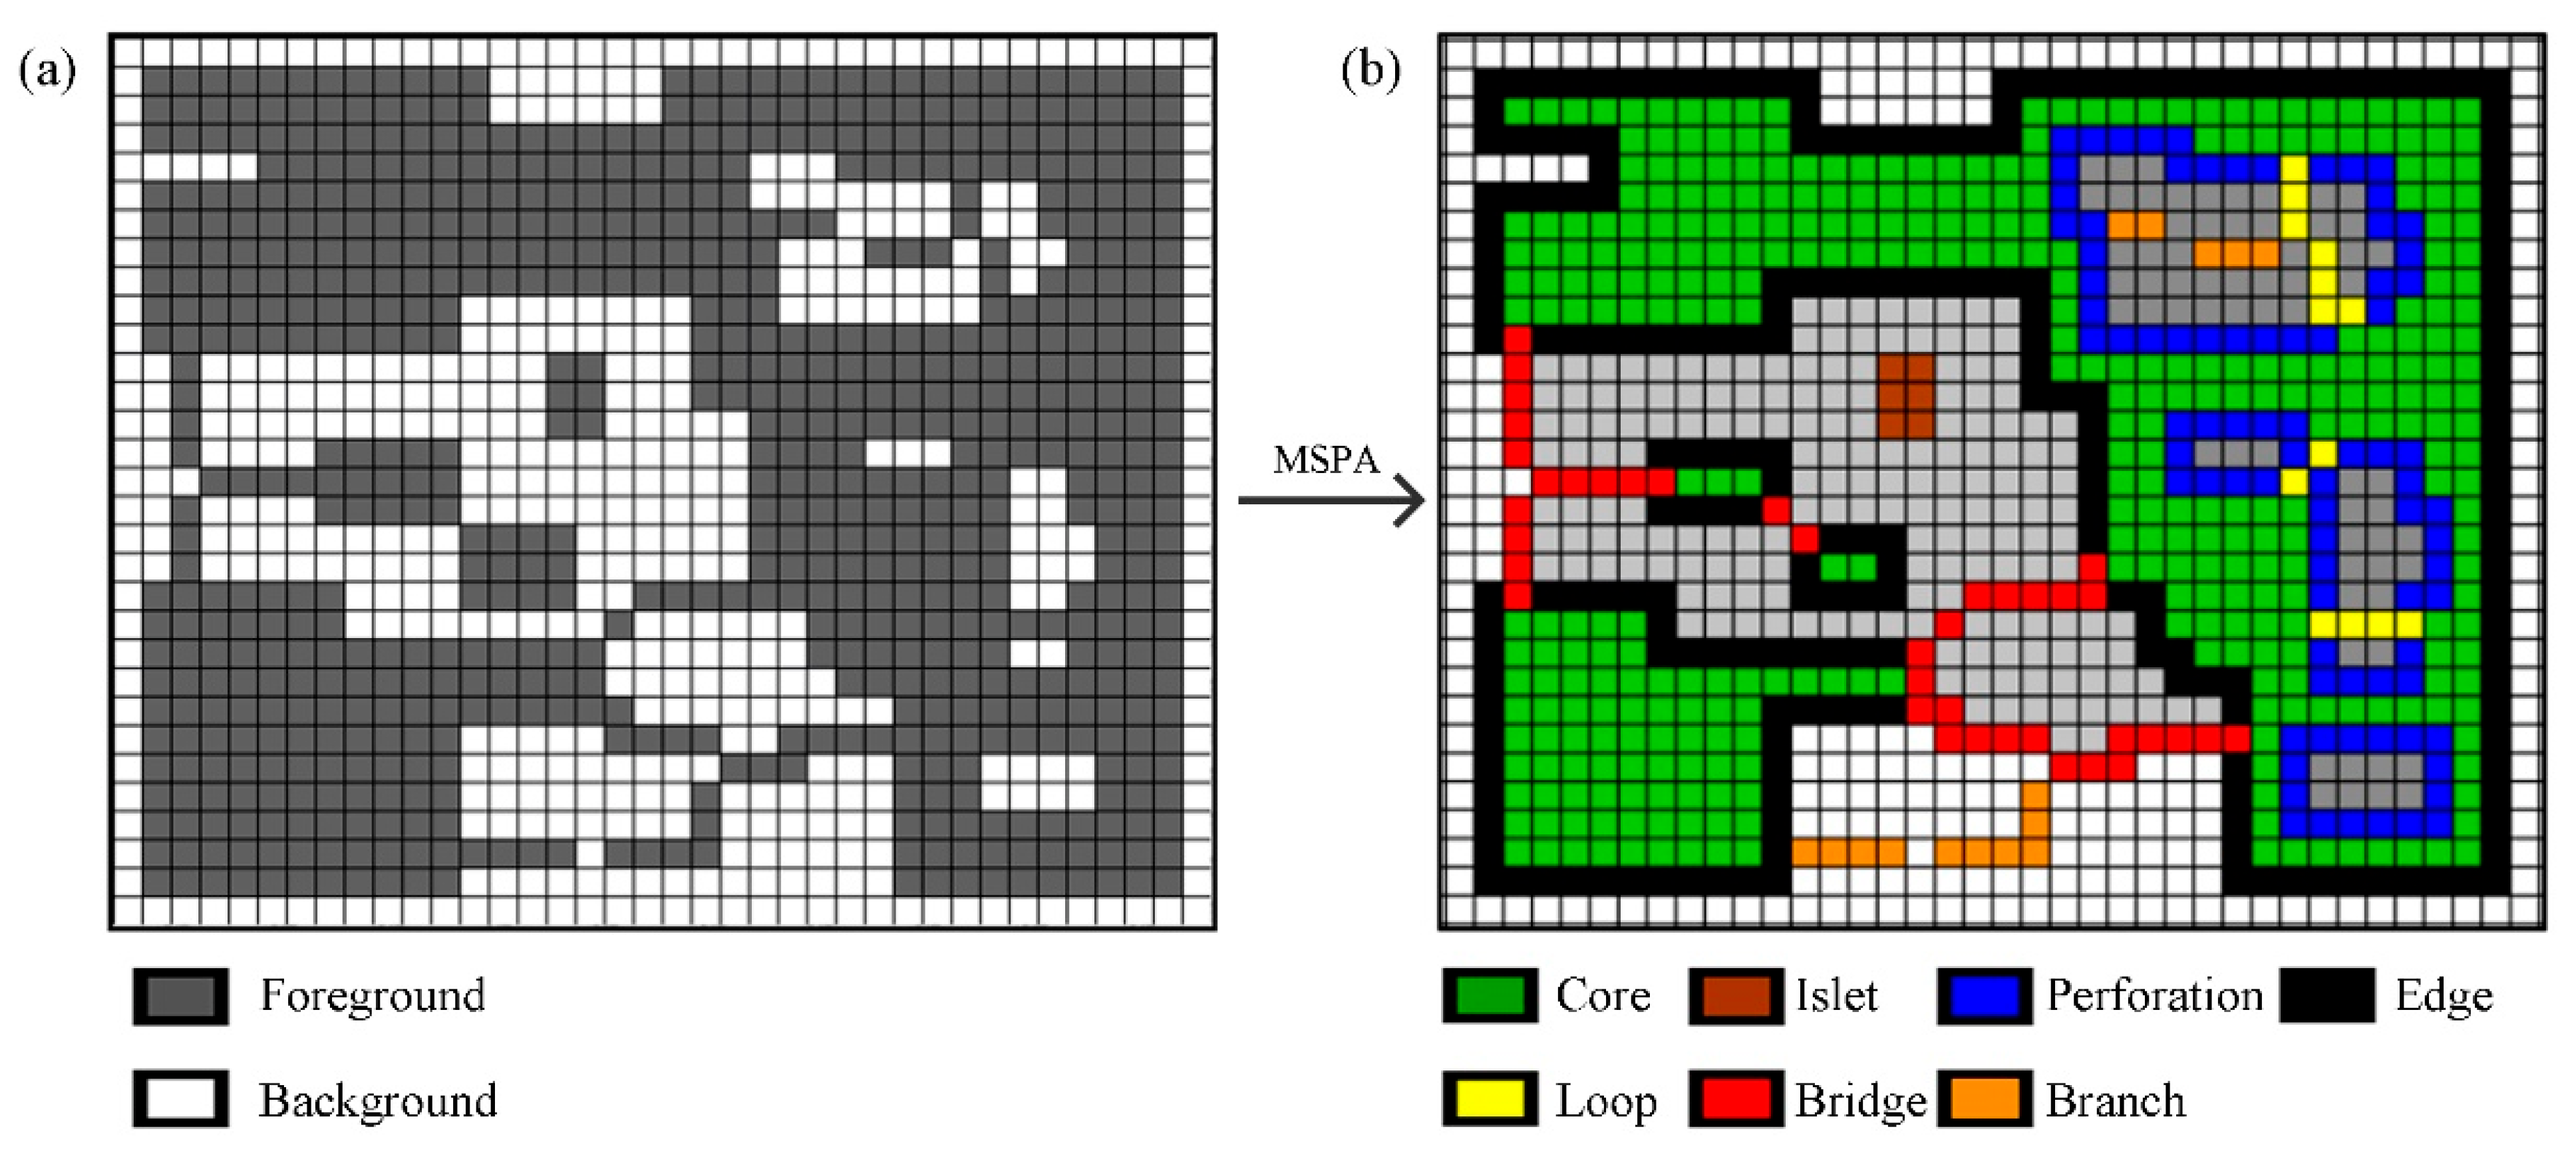
First, according to the MSPA guidelines and tutorials [62], the LULC dataset of the core cities in the Greater Bay Area was reclassified in ArcGIS 10.2, with green areas classified as foreground and other elements as background elements. Conversion of the land cover map into a binary raster map (where green areas were assigned a value of 2, and the other areas assigned a value of 1). Secondly, as shown in Figure 3, by identifying the spatial location of each foreground image element, MSPA metrics identification was applied to the study area using eight-neighborhood analysis to determine the spatial topological relationships between foreground image elements and their internal elements. The landscape was classified into seven types (core, island, perforation, edge, loop, bridge, and branch) that did not overlap (Table 2) [41]. In this study, the edge value was set to 90 m, considering the study scale and related research results [63]. Finally, based on the classification by Chen et al. [42], these seven spatial patterns could be summarized as (1) surface-point patterns (including core and islet metrics); (2) boundary patterns (including perforation and edge metrics); and (3) corridor patterns (including loop, bridge, and branch metrics). Referring to the method developed by Chen et al. [12], the area proportion of each type of element was used as a quantitative analysis indicator of the spatial pattern of green spaces in the city.
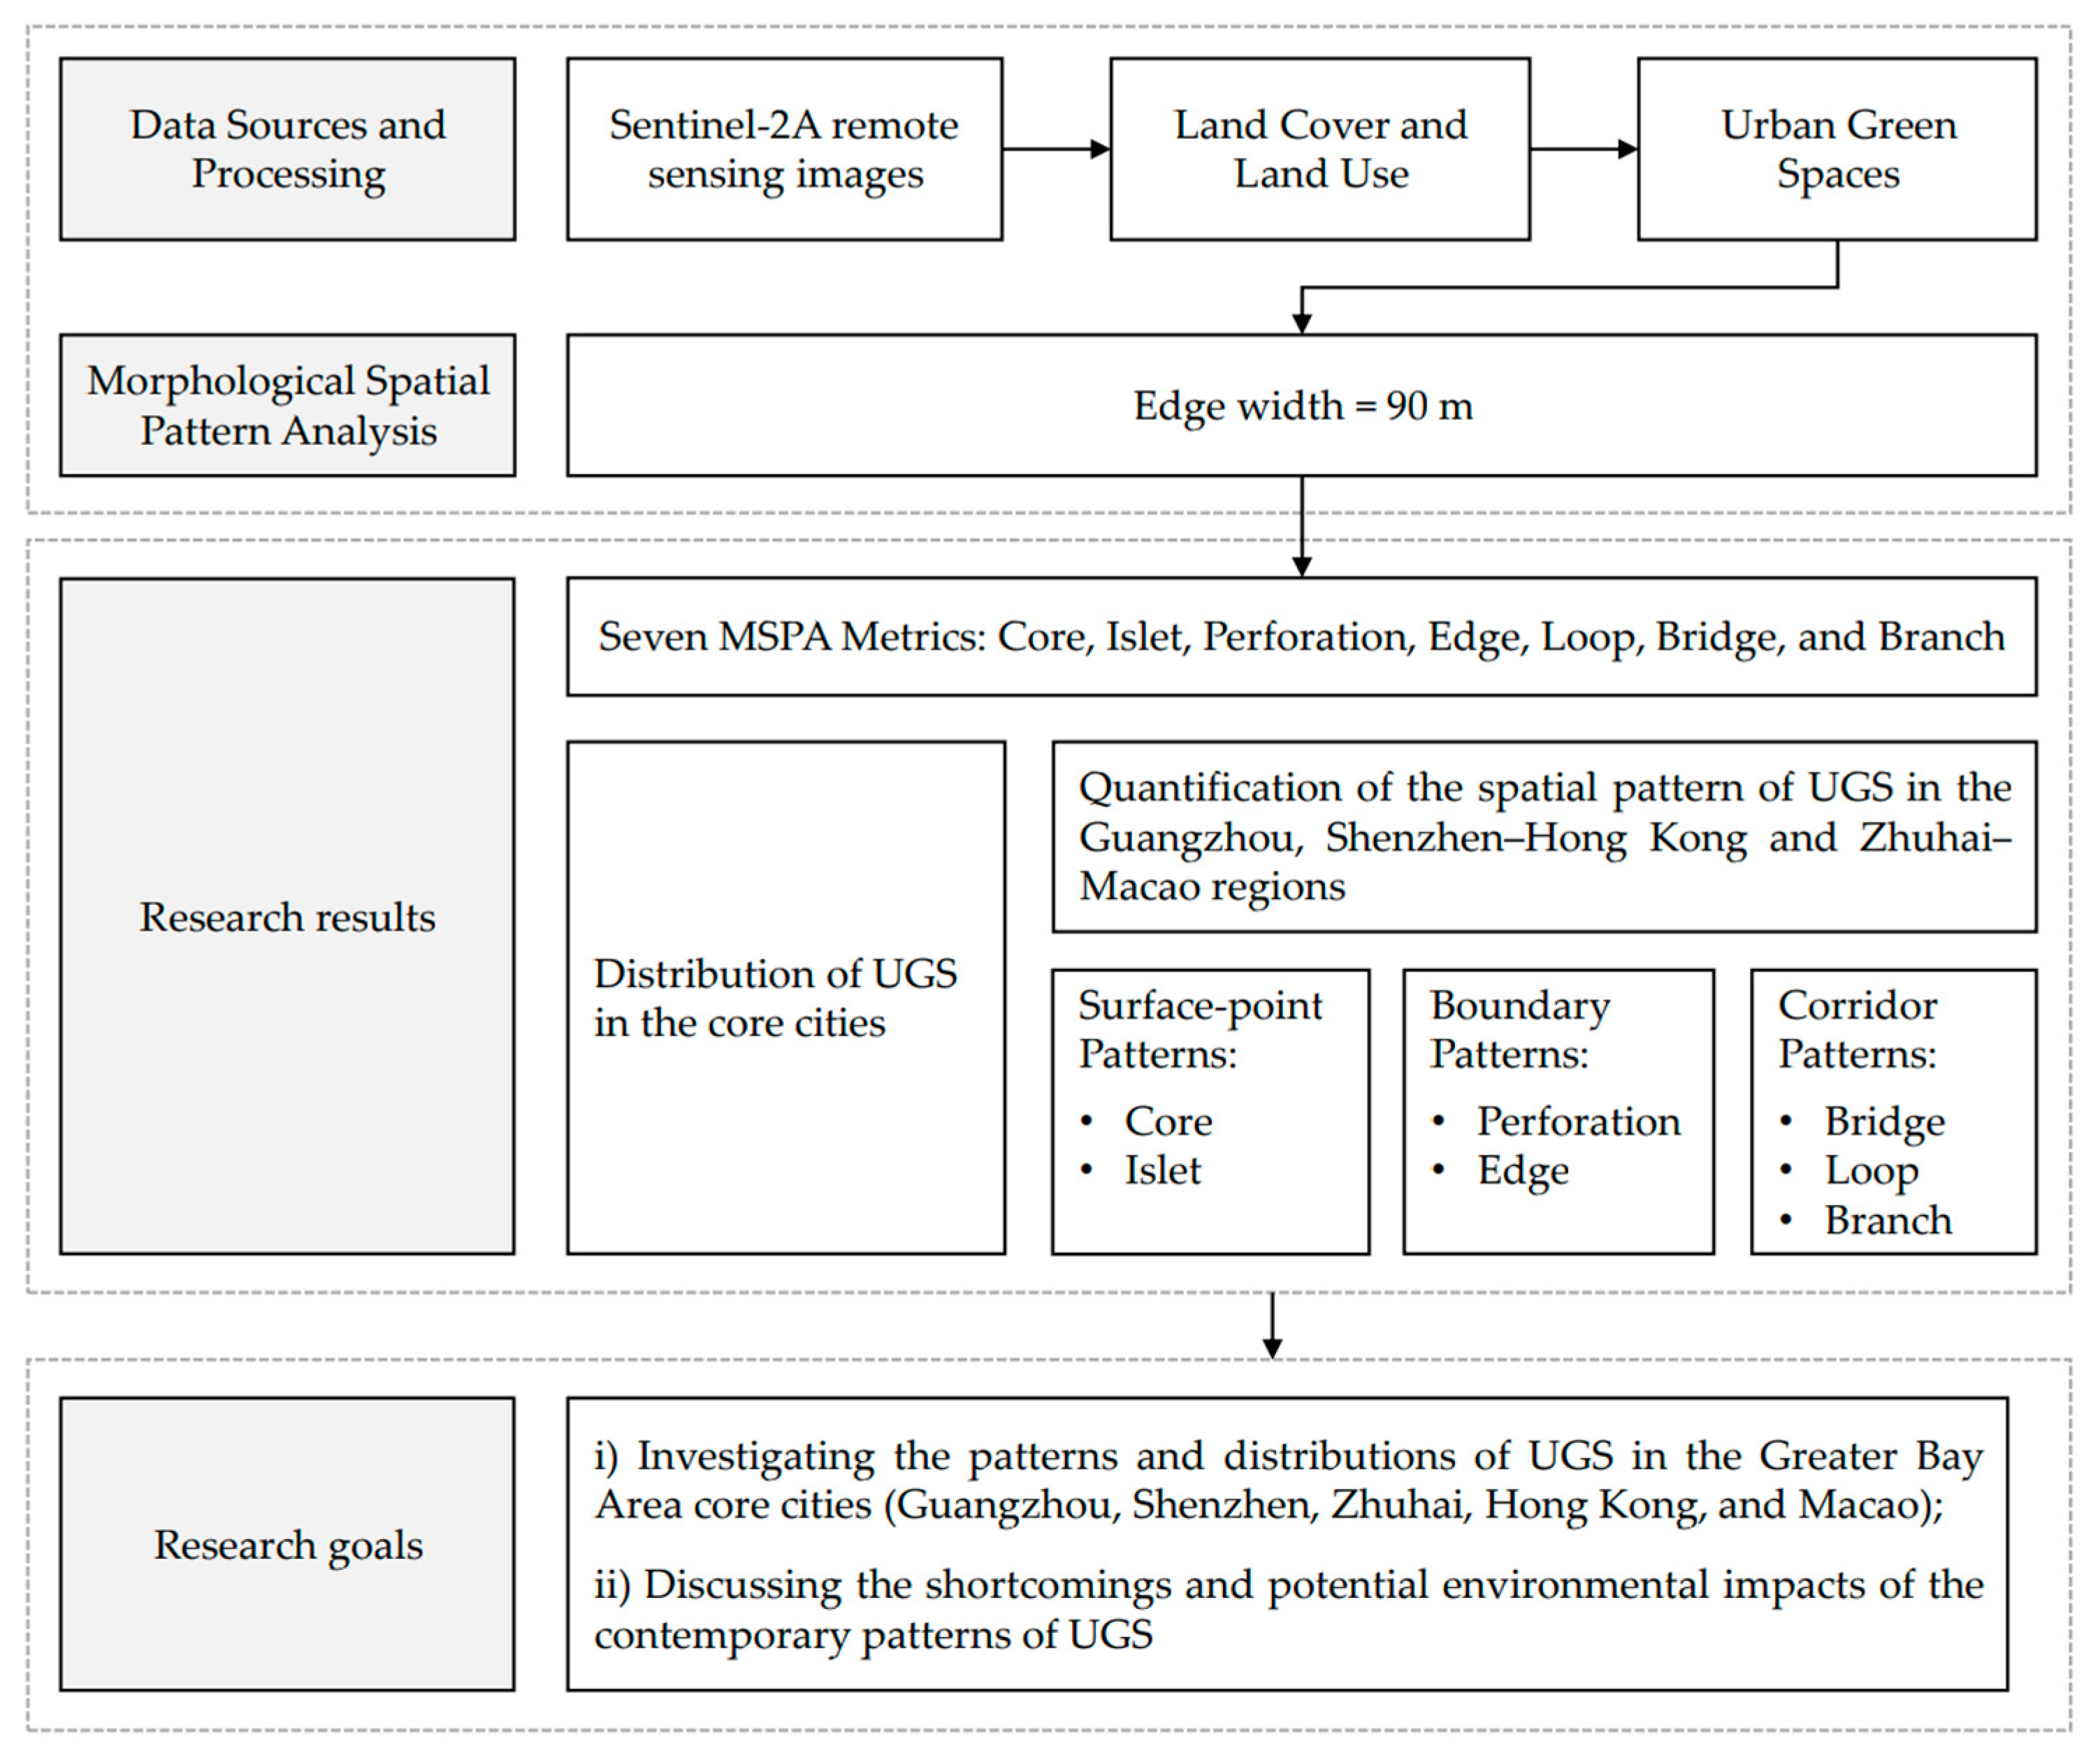
Figure 4 represents the methodological workflow of the study.

3. Results

3.1. Distribution of UGSs in the Core Cities of the Guangdong–Hong Kong–Macao Greater Bay Area

According to the LULC obtained in 2021 (Figure 2c, Table 3), the greenery coverage of the Guangzhou and Shenzhen–Hong Kong zones is approximately the same at 46.3%, with the southern part of Guangzhou and the western part of Zhuhai exhibiting a flat topography and a dense river network. The proportion of water area in the Zhuhai–Macao zone is as high as 27.51%, which is significantly higher than the other zones. The five cities are generally highly urbanized; the Shenzhen–Hong Kong zone has the highest level of urbanization, with an urban built-up area of 44.17%.
The area of forestland in Guangzhou is about 3341.96 km2, accounting for 46.28% of the total area of Guangzhou. These are mainly conservation green areas, concentrated in the northern and central parts of Guangzhou, with continuous distribution characteristics, and are the most important part of Guangzhou’s green areas, as well as representing a significant ecological barrier in the northern part of the Greater Bay Area. These include the Conghua Mountain Regional Green Space, the Mountain Regional Green Space in the northwestern part of Huadu, and the Maofeng Mountain Regional Green Space. There are only a few green areas in the southern part of Guangzhou near the sea, with an area of about 67.14 km2, including the Hai-O Island Regional Green Space and the Huangshanlu Regional Green Space. Scenic recreational green space covers an area of about 1076.28 km2, including various scenic spots and country parks scattered across Guangzhou. The productive green area is about 381.25 km2, mainly in Panyu and Nansha Districts of Guangzhou.
The total area of forestland in the Shenzhen–Hong Kong area is about 1418.72 km2, with 46.31% of green space, which is approximately the same green space cover of Guangzhou and is the area with the most significant proportion of green space in the three areas. It mainly includes scenic recreational and conservation green spaces, with many natural hills. Examples include Tanglang Mountain Country Park, Meilin Mountain Park, Maluan Mountain Country Park, and Guangming Forest Park in Shenzhen, and Lantau Island, Tai Mo Shan, and Sai Kung Hill in Hong Kong. The Dapeng Peninsula, which lies to the east side of Shenzhen, and Hong Kong are characterized by a contiguous and concentrated distribution of large green areas. Relative to other regions, the Shenzhen–Hong Kong zone has significantly less productive green space, with only 3.95 km2 distributed in Shenzhen’s Guangming District.
The Zhuhai–Macao region has a total green space area of approximately 459.71 km2, with 28.47% of the green space area. The area of green space in this region is low, and there is no prominent characteristic of continuous and concentrated distribution. The green space is mainly scenic recreational green space, which is scattered in the offshore area of the Zhuhai–Macao area. The area of conservation green space in Zhuhai is approximately 60.27 km2 and is concentrated in the Huangyang Mountain Scenic Area and Phoenix Mountain Forest Park. Relative to other regions, the Zhuhai–Macao zone has a relatively large proportion of productive green space, which plays an essential productive role, concentrated in the Jinwan and Doumen Districts of Zhuhai on the western side.

3.2. Analysis of the Spatial Pattern of UGSs in the Guangzhou, Shenzhen–Hong Kong and Zhuhai–Macao Regions

MSPA was conducted to divide the UGS in the study area into seven types of landscape spatial structure metrics (core, islet, perforation, edge, loop, bridge, and branch), and the MSPA landscape map was obtained (Figure 5). According to the different characteristics of each MSPA metric, the landscape pattern could be divided into three categories: point surface pattern, boundary pattern, and corridor pattern. Among them, the area proportions of the seven types of MSPA metrics for each administrative region are shown in Table 4.

3.2.1. Surface-Point Patterns

The surface-point pattern of green spaces included core and islet metrics. Core areas are usually large nature reserves or large areas of forestland and are important indicators of habitat quality. Larger core areas represent a larger scale or more concentrated distribution of green space. Islet areas are isolated islands of landscape patches, characterized by small areas of green space and isolated from each other, scattered in point-like areas.
Regarding the core metric, Hong Kong has the highest core share of 42.22%, making it the city with the highest core share. Compared with other cities, Hong Kong’s core patches are relatively continuous, with a smaller number of patches but a larger average area, indicating its high habitat quality and relatively good ecological environment. Guangzhou has a core area share of 31.84%, which is high. However, the distribution of core patches of Guangzhou is not uniform; the average area of patches in the northern core area is large and the distribution is continuous and concentrated, although patches in the southern core area are scattered and their number and distribution density are much less than those in the north. Shenzhen’s core area share is 25.55%, which is between the five cities. The core area shares in Zhuhai and Macao are 18.31% and 3.94%, respectively, representing lower levels among the five cities. The distribution of core areas is relatively uniform, and there is not much difference in the area of each core patch.
Macao has the highest percentage of islets, at 1.88%, which may be due to the small size of its administrative region. Guangzhou, Shenzhen, and Zhuhai are at a similar level in the share of islet metrics, all around 1%. However, it is worth noting that Guangzhou has the most islet patches, with a large number of fragmented patches, and most of them are located within the central city, indicating a high number of fragmented green areas within the built-up area of Guangzhou. Hong Kong has the lowest percentage of isolated metrics, at 0.79%, indicating that the majority of green spaces in Hong Kong are generally large and continuously concentrated, with a small number of smaller fragmented green spaces interspersed within built-up areas.

3.2.2. Boundary Patterns

The boundary pattern of green space includes edge, and perforation metrics. The edge and perforation are the outer edges and inner edges of the core area, respectively, both of which are areas that produce edge effects.
Perforation serves as the inner edge of greenfield patches. A small number of perforation spaces are connected to small-scale water bodies inside the greenfield, whereas other perforation spaces are probably generated due to human-induced disturbances, leading to encroachment inside large patches. The most significant proportion of perforation area in Guangzhou is 2.47%, with a large amount of perforation spaces not connected to water bodies within the green space, representing a significant occurrence of perforation within large green space patches. The reason for this may be the lack of red lines and no-build zones for forests in historical planning, leading to uncontrolled urban growth, the perforation of large green spaces due to the disturbance of human activities, and the destruction of the transition zone between the green space patches and the surrounding non-vegetated land types to some extent, making it a more vulnerable part of the green space system components. The perforation areas are concentrated in the northern part of Conghua Mountains and the central part of Maofeng Mountains in Guangzhou. The proportion of perforation in Zhuhai and Macao is approximately 0.4%, the lowest percentage of this indicator among the five cities, and the phenomenon of perforation within large green areas is not apparent.
The edge reflects the complexity of outer contours of the core patches of green space to a certain extent. The higher the proportion of edges, the more complex the contours of the green space are. Hong Kong and Shenzhen have edge percentages of 8.26% and 6.82%, respectively, representing the relatively complex shapes of the edges of their green space patches and more intense material-energy exchanges.

3.2.3. Corridor Patterns

The corridor pattern of green space includes bridge, loop, and branch metrics. A bridge zone is a narrow area from the edge of one patch to the edge of another, connecting different patches and acting as a corridor linking them together; it is an essential medium for the flow of ecological elements. A loop is a corridor for ecological flows within the core area. Branches are linear corridors connected at only one end with edges, perforations, loops, or bridges.
Among the five cities, the share of bridge and loop areas in Zhuhai–Macao is at a low level, and the overall landscape connectivity of green areas in the region is not high, indicating a discontinuous distribution of large green areas and a more dispersed distribution of green areas. Hong Kong has the largest shares of loop area and bridge area of the five cities, at 2.69% and 2.49%, respectively, demonstrating that greenways connect distinct green space patches. The UGS of Hong Kong has a high degree of landscape connectivity. The area percentages of branches in Guangzhou, Shenzhen, and Hong Kong are 1.48%, 1.61%, and 1.49%, respectively, i.e., at high levels.

4. Discussion

In high-density cities, where land resources are tight, the optimization and adjustment of UGSs becomes a crucial issue. In China’s historical green space system planning, the green space coverage and the green space per capita in each administrative district were used as important indicators to measure green space construction. However, many studies have proven that not only the area of green space, but also the spatial configuration of green space plays an important role in yielding ecological benefits [23,24,37]. MSPA enables a more effective and graphical assessment of the morphological patterns and distribution of UGSs. Ma et al. applied MSPA to investigate whether the spatial distribution of UGSs in Beijing is well-balanced [50]. Chen et al. applied MSPA metrics to measure green space patterns and explore the spatial and temporal changes in UGSs. Xie et al. determined the landscape connectivity of Shenzhen through changes in branch and bridge metrics [53].
The core area is the main body of UGSs and represents an ecological source in regional ecological networks [60]. The area share of core indicators directly determines a city’s green space scale and ecological environment level [45]. Wang et al. showed that an increase in the size of the core area of a green space is a sign of improved green space habitat quality [64]. Only green areas of a certain size can effectively perform their ecosystem services [20,65]. In future urban green space planning processes, ecological protection red lines should be established to avoid the fragmentation of core patches of green space as far as possible.
A large number of islets within the city centers is reflected in the UGS patterns of all five cities, indicating that the fragmentation of spatial patterns of green space is more common in high-density cities. Abbas demonstrated that the Greater Bay Area showed a trend of UGS fragmentation in the last three decades, with a decrease in core areas and the formation of a large number of small patches [66]. The results of this study show that all five cities have varying degrees of fragmentation in their green spaces. Among them, Guangzhou has the largest percentage of islets, and is the city with the most obvious pattern of UGS fragmentation, suggesting some degree of ecological risk. This may be associated with the traditional “building first, green spaces inserted into gaps” planning approach. Small and scattered green spaces (islets) are not conducive to ecological benefits [65,67]; therefore, future planning could integrate small, isolated patches to form larger faceted patches.
Several studies have shown significant differences in the distribution patterns of UGSs along a linear urban-rural gradient in more urbanized cities [68,69]. This is because urbanization accelerates the fragmentation of UGS patterns, especially in central urban areas [37]. This study has confirmed that there is a significant difference in the spatial pattern of UGSs within the city center and further outside in high-density cities, and this difference is most evident in Hong Kong and Guangzhou. Tian et al. demonstrated high levels of green space fragmentation in built-up areas along the coast of Kowloon and Hong Kong Island, and low levels of fragmentation in large green spaces in the countryside [70]. Yang also showed that compared with Guangzhou city center, northern Guangzhou has a higher UGS concentration due to the richness of mountains and forests [71]. Therefore, in subsequent studies, urban areas could be subdivided for more focused discussions, and specific UGS conservation recommendations and measures can be proposed.
Edges and perforations may represent the encroachment of ecological source sites [41]. The percentage of perforations is significantly higher in Guangzhou, and the percentage of the edges is significantly higher in Shenzhen–Hong Kong. UGS edges bordering other landscape types are generally less resistant to external pressures [72]. Vogt et al. showed that edges and perforations are relatively narrow characteristics due to them being at the intersection of green and non-green areas; thus, they may be vulnerable [73]. Therefore, land use conversions between green and surrounding non-green areas may be developed in the future. These two types of UGS, namely, edge and perforation, should be protected and monitored dynamically to prevent “destruction before treatment”.
The bridge and branch areas of Shenzhen–Hong Kong area account for a relatively high proportion, with a continuous and more clustered distribution of large green areas and high landscape connectivity. Tian showed that regions with high green area coverage, such as conservation areas and country parks in Hong Kong, exhibit higher landscape connectivity [74]. Cao et al. applied MSPA to demonstrate that the Dapeng Peninsula area, to the east of Shenzhen, has higher landscape connectivity compared with the west [61], consistent with the results of this study. Xie et al. found that a large proportion of Shenzhen’s loops have become bridges, increasing landscape connectivity [53]. This is related to the strict and effective green space conservation and restoration policies in Shenzhen and Hong Kong in recent years. In terms of UGS optimization, adding more green corridors to form greenways based on bridge areas has been proven as an effective means for enhancing landscape connectivity [74].
Setting distance thresholds at different scales may influence the results of MSPA index identification [75]. In this study, according to the scale and combined with related research results, by checking the total areas of green areas after resampling to 90 m, and smaller error in the loss of green information, we thus set the edge as 90 m [53,63], although the results were still influenced by the set value. In addition, the results of this study do not provide a good representation of the spatio-temporal characteristics of UGSs at street and community scale due to the accuracy of remote sensing images. The multiscale sensitivity of MSPA could represent an important topic for future research. In follow-up studies, incorporating time series to analyze the spatial and temporal dynamics of the landscape pattern and exploring the spatial and temporal changes in UGS patterns could be considered [66], to provide a reference for the evolution and causes of change in UGSs. According to the evolution of the seven indicators, the relationship between the development of green space system and relevant laws and policies, existing problems, and promotion strategies could be discussed.

5. Conclusions

In this study, we took the five core cities of the Greater Bay Area as the study area and used MSPA to analyze the UGS spatial pattern. The main conclusions are as follows.
The core is the indicator with the highest area percentage among the seven types of MSPA metrics. The percentage of core area is an important indicator to characterize the urban ecological quality. Hong Kong has the most significant core area share, followed by Guangzhou, indicating that Hong Kong and Guangzhou have high habitat quality and relatively better ecological environment, and are important ecological barriers in the southeastern and northern parts of the Greater Bay Area, respectively.
In terms of the concentration of UGS distribution, Guangzhou has a significantly uneven distribution of green space, with large green spaces concentrated in the north, while the number and scale of green spaces in central and southern Guangzhou are much smaller than those in the north. There is no significant uneven distribution of UGSs in other cities.
In terms of green space fragmentation, islets are generally distributed within the central urban areas of each city, with different degrees of green space fragmentation patterns in the five cities. Guangzhou has the highest percentage of islets and many small, scattered green areas, making it the city with the most pronounced green space fragmentation pattern. Unlike Guangzhou, Hong Kong has significantly fewer and smaller green spaces within its built-up area, with scattered green spaces interspersed throughout.
In terms of green space connectivity, the bridge and branch linear indicators are bases for the construction of urban green corridors and directly influence the degree of connectivity between green spaces. The bridge and branch indicators in the Shenzhen–Hong Kong region are relatively high, whereas the bridge and branch indicators in the Zhuhai–Macao zone are relatively low; thus, the connectivity of UGSs in the Shenzhen–Hong Kong region is high, whereas the connectivity of UGSs in the Zhuhai–Macao region is low.

Author Contributions

Conceptualization, Z.L. and X.F.; methodology, Z.L.; software, Z.L.; validation, X.F. and Z.L.; formal analysis, Z.L.; data curation, Z.L.; writing—original draft preparation, Z.L.; writing—review and editing, X.F.; supervision, X.F.; project administration, X.F.; funding acquisition, X.F. All authors have read and agreed to the published version of the manuscript.

Funding

This research was funded by National Natural Science Foundation of China, grant number 51978276.

Institutional Review Board Statement

Not applicable.

Informed Consent Statement

Not applicable.

Data Availability Statement

Not applicable.

Conflicts of Interest

The authors declare no conflict of interest.

References

  1. Haaland, C.; van Den Bosch, C.K. Challenges and strategies for urban green-space planning in cities undergoing densification: A review. Urban For. Urban Green. 2015, 14, 760–771. [Google Scholar] [CrossRef]
  2. National Climate Centre of China Meteorological Administration. China Climate Bulletin (2021). 2022. Available online: http://www.cma.gov.cn/2011xwzx/2011xqxxw/2011xqxyw/202203/t20220301_592530.html (accessed on 10 August 2022).
  3. IPCC. Climate Change 2021: The Physical Science Basis. Contribution of Working Group I to the Sixth Assessment Report of the Intergovernmental Panel on Climate Change; Masson-Delmotte, V., Zhai, P., Pirani, A., Connors, S.L., Péan, C., Berger, S., Caud, N., Chen, Y., Goldfarb, L., Gomis, M.I., et al., Eds.; Cambridge University Press: Cambridge, UK, 2021. [Google Scholar]
  4. Song, C.; He, J.; Wu, L.; Jin, T.; Chen, X.; Li, R.; Ren, P.; Zhang, L.; Mao, H. Health burden attributable to ambient PM2.5 in China. Environ. Pollut. 2017, 223, 575–586. [Google Scholar] [CrossRef] [PubMed]
  5. Hunter, R.F.; Cleland, C.; Cleary, A.; Droomers, M.; Wheeler, B.W.; Sinnett, D.; Nieuwenhuijsen, M.J.; Braubach, M. Environmental, health, wellbeing, social and equity effects of urban green space interventions: A meta-narrative evidence synthesis. Environ. Int. 2019, 130, 104923. [Google Scholar] [CrossRef] [PubMed]
  6. Maas, J.; Verheij, R.A.; Groenewegen, P.P.; de Vries, S.; Spreeuwenberg, P. Green space, urbanity, and health: How strong is the relation? J. Epidemiol. Community Health 2006, 60, 587–592. [Google Scholar] [CrossRef] [PubMed]
  7. McPherson, E.G. Atmospheric carbon dioxide reduction by Sacramento’s urban forest. J. Arboric. 1998, 24, 213–215. [Google Scholar] [CrossRef]
  8. Nowak, D.J.; Crane, D.E.; Stevens, J.C.; Ibarra, M. Brooklyn’ s Urban Forest; Gen Tech Rep NE-290; US Department of Agriculture, Forest Service, Northeastern Research Station: Newtown Square, PA, USA, 2002. [Google Scholar]
  9. Li, X.; Zhou, W. Optimizing urban greenspace spatial pattern to mitigate urban heat island effects: Extending understanding from local to the city scale. Urban For. Urban Green. 2019, 41, 255–263. [Google Scholar] [CrossRef]
  10. Yilmaz, S.; Toy, S.; Irmak, M.A.; Yilmaz, H. Determination of climatic differences in three different land uses in the city of Erzurum, Turkey. Build. Environ. 2007, 42, 1604–1612. [Google Scholar] [CrossRef]
  11. Cavanagh, J.-A.E.; Zawar-Reza, P.; Wilson, J.G. Spatial attenuation of ambient particulate matter air pollution within an urbanised native forest patch. Urban For. Urban Green. 2009, 8, 21–30. [Google Scholar] [CrossRef]
  12. Chen, M.; Dai, F.; Yang, B.; Zhu, S. Effects of urban green space morphological pattern on variation of PM2.5 concentration in the neighborhoods of five Chinese megacities. Build. Environ. 2019, 158, 1–15. [Google Scholar] [CrossRef]
  13. Feng, X.; Wei, Q. Characteristics of the urban near-surface wind field in Guangzhou. Ecol. Environ. Sci. 2011, 20, 1558–1561. [Google Scholar]
  14. Jauregui, E. Influence of a large urban park on temperature and convective precipitation in a tropical city. Energy Build. 1990, 15, 457–463. [Google Scholar] [CrossRef]
  15. Cornelis, J.; Hermy, M. Biodiversity relationships in urban and suburban parks in Flanders. Landsc. Urban Plan. 2004, 69, 385–401. [Google Scholar] [CrossRef]
  16. Masoudi, M.; Tan, P.Y. Multi-year comparison of the effects of spatial pattern of urban green spaces on urban land surface temperature. Landsc. Urban Plan. 2019, 184, 44–58. [Google Scholar] [CrossRef]
  17. Sandstrom, U.G.; Angelstam, P.; Mikusinski, G. Ecological diversity of birds in relation to the structure of urban green space. Landsc. Urban Plan. 2006, 77, 39–53. [Google Scholar] [CrossRef]
  18. Bernatzky, A. The contribution of tress and green spaces to a town climate. Energy Build. 1982, 5, 1–10. [Google Scholar] [CrossRef]
  19. Su, Y.; Huang, G.; Chen, X.; Chen, S.; Li, Z. Research progress in the eco-environmental effects of urban green spaces. Acta Ecol. Sin. 2011, 31, 7287–7300. [Google Scholar]
  20. Ngulani, T.; Shackleton, C.M. The degree, extent and value of air temperature amelioration by urban green spaces in Bulawayo, Zimbabwe. S. Afr. Geogr. J. 2020, 102, 344–355. [Google Scholar] [CrossRef]
  21. Du, H.; Cai, W.; Xu, Y.; Wang, Z.; Wang, Y.; Cai, Y. Quantifying the cool island effects of urban green spaces using remote sensing Data. Urban For. Urban Green. 2017, 27, 24–31. [Google Scholar] [CrossRef]
  22. Yu, Z.; Guo, X.; Jorgensen, G.; Vejre, H. How can urban green spaces be planned for climate adaptation in subtropical cities? Ecol. Indic. 2017, 82, 152–162. [Google Scholar] [CrossRef]
  23. Estoque, R.C.; Murayama, Y.; Myint, S.W. Effects of landscape composition and pattern on land surface temperature: An urban heat island study in the megacities of Southeast Asia. Sci. Total Environ. 2017, 577, 349–359. [Google Scholar] [CrossRef]
  24. Peng, J.; Xie, P.; Liu, Y.; Ma, J. Urban thermal environment dynamics and associated landscape pattern factors: A case study in the Beijing metropolitan region. Remote Sens. Environ. 2016, 173, 145–155. [Google Scholar] [CrossRef]
  25. Guo, G.; Wu, Z.; Chen, Y. Complex mechanisms linking land surface temperature to greenspace spatial patterns: Evidence from four southeastern Chinese cities. Sci. Total Environ. 2019, 674, 77–87. [Google Scholar] [CrossRef]
  26. Li, X.; Zhou, W.; Ouyang, Z.; Xu, W.; Zheng, H. Spatial pattern of greenspace affects land surface temperature: Evidence from the heavily urbanized Beijing metropolitan area, China. Landsc. Ecol. 2012, 27, 887–898. [Google Scholar] [CrossRef]
  27. Peng, J.; Jia, J.; Liu, Y.; Li, H.; Wu, J. Seasonal contrast of the dominant factors for spatial distribution of land surface temperature in urban areas. Remote Sens. Environ. 2018, 215, 255–267. [Google Scholar] [CrossRef]
  28. Liu, K.; Su, H.; Li, X.; Wang, W.; Yang, L.; Liang, H. Quantifying Spatial-Temporal Pattern of Urban Heat Island in Beijing: An Improved Assessment Using Land Surface Temperature (LST) Time Series Observations from LANDSAT, MODIS, and Chinese New Satellite GaoFen-1. Ieee J. Sel. Top. Appl. Earth Obs. Remote Sens. 2016, 9, 2028–2042. [Google Scholar] [CrossRef]
  29. Mo, S.; Shen, S.; Liao, Q. Landscape Design Strategy of Ventilation Corridor in the Green Heart of CZT Urban Agglomeration Based on WRF Model. Chin. Landsc. Archit. 2021, 37, 80–84. [Google Scholar]
  30. Alvey, A.A. Promoting and preserving biodiversity in the urban forest. Urban For. Urban Green. 2006, 5, 195–201. [Google Scholar] [CrossRef]
  31. McGuire, J.L.; Lawler, J.J.; McRae, B.H.; Nunez, T.A.; Theobald, D.M. Achieving climate connectivity in a fragmented landscape. Proc. Natl. Acad. Sci. USA 2016, 113, 7195–7200. [Google Scholar] [CrossRef]
  32. Imai, H.; Nakashizuka, T. Environmental factors affecting the composition and diversity of avian community in mid- to late breeding season in urban parks and green spaces. Landsc. Urban Plan. 2010, 96, 183–194. [Google Scholar] [CrossRef]
  33. Uuemaa, E.; Antrop, M.; Roosaare, J.; Marja, R.; Mander, Ü. Landscape metrics and indices: An overview of their use in landscape research. Living Rev. Landsc. Res. 2009, 3, 1–28. [Google Scholar] [CrossRef]
  34. Pramanik, S.; Punia, M. Assessment of green space cooling effects in dense urban landscape: A case study of Delhi, India. Model. Earth Syst. Environ. 2019, 5, 867–884. [Google Scholar] [CrossRef]
  35. Li, X.; Zhou, W.; Ouyang, Z. Relationship between land surface temperature and spatial pattern of greenspace: What are the effects of spatial resolution? Landsc. Urban Plan. 2013, 114, 1–8. [Google Scholar] [CrossRef]
  36. McGarigal, K. FRAGSTATS: Spatial Pattern Analysis Program for Quantifying Landscape Structure; US Department of Agriculture, Forest Service, Pacific Northwest Research Station: Newtown Square, PA, USA, 1995; Volume 351. [Google Scholar]
  37. Li, F.; Zheng, W.; Wang, Y.; Liang, J.; Xie, S.; Guo, S.; Li, X.; Yu, C. Urban Green Space Fragmentation and Urbanization: A Spatiotemporal Perspective. Forests 2019, 10, 333. [Google Scholar] [CrossRef] [Green Version]
  38. Nasehi, S. Assessment of urban green space fragmentation using landscape metrics (case study: District 2, Tehran city). Model. Earth Syst. Environ. 2020, 6, 2405–2414. [Google Scholar] [CrossRef]
  39. Gao, J.; Yang, M.; Tao, K. Analyse the pattern of urban greenary features in shanghai. Chin. Landsc. Archit. 2000, 1, 53–56. [Google Scholar]
  40. Gao, S.; Chen, Q.; Xie, Y. Analysis landscape pattern of urban greening system in the center of chengdu. Chin. Landsc. Archit. 2005, 7, 49–52. [Google Scholar]
  41. Soille, P.; Vogt, P. Morphological segmentation of binary patterns. Pattern Recognit. Lett. 2009, 30, 456–459. [Google Scholar] [CrossRef]
  42. Chen, M.; Dai, F. The influence of urban green spaces on thermal environment based on morphological spatial pattern analysis. Ecol. Environ. Sci. 2021, 30, 125–134. [Google Scholar]
  43. Ye, H.; Yang, Z.; Xu, X. Ecological Corridors Analysis Based on MSPA and MCR Model-A Case Study of the Tomur World Natural Heritage Region. Sustainability 2020, 12, 959. [Google Scholar] [CrossRef]
  44. Chang, Q.; Liu, X.; Wu, J.; He, P. MSPA-Based Urban Green Infrastructure Planning and Management Approach for Urban Sustainability: Case Study of Longgang in China. J. Urban Plan. Dev. 2015, 141, A5014006. [Google Scholar] [CrossRef]
  45. Saura, S.; Vogt, P.; Velazquez, J.; Hernando, A.; Tejera, R. Key structural forest connectors can be identified by combining landscape spatial pattern and network analyses. For. Ecol. Manag. 2011, 262, 150–160. [Google Scholar] [CrossRef]
  46. Guo, S.; Saito, K.; Yin, W.; Su, C. Landscape Connectivity as a Tool in Green Space Evaluation and Optimization of the Haidan District, Beijing. Sustainability 2018, 10, 1979. [Google Scholar] [CrossRef]
  47. Wang, H.; Pei, Z. Urban Green Corridors Analysis for a Rapid Urbanization City Exemplified in Gaoyou City, Jiangsu. Forests 2020, 11, 1374. [Google Scholar] [CrossRef]
  48. Bi, S.; Chen, M.; Dai, F. The impact of urban green space morphology on PM2.5 pollution in Wuhan, China: A novel multiscale spatiotemporal analytical framework. Build. Environ. 2022, 221, 109340. [Google Scholar] [CrossRef]
  49. Yu, Z.; Zhang, J.; Yang, G. How to build a heat network to alleviate surface heat island effect? Sustain. Cities Soc. 2021, 74, 103135. [Google Scholar] [CrossRef]
  50. Ma, Y.; Zheng, X.; Liu, M.; Liu, D.; Ai, G.; Chen, X. Spatio-temporal evolution characteristics analysis and optimization prediction of urban green infrastructure: A case study of Beijing, China. Sci. Rep. 2022, 12, 10702. [Google Scholar] [CrossRef] [PubMed]
  51. Wickham, J.D.; Riitters, K.H.; Wade, T.G.; Vogt, P. A national assessment of green infrastructure and change for the conterminous United States using morphological image processing. Landsc. Urban Plan. 2010, 94, 186–195. [Google Scholar] [CrossRef]
  52. Wei, J.; Qian, J.; Tao, Y.; Hu, F.; Ou, W. Evaluating Spatial Priority of Urban Green Infrastructure for Urban Sustainability in Areas of Rapid Urbanization: A Case Study of Pukou in China. Sustainability 2018, 10, 327. [Google Scholar] [CrossRef]
  53. Xie, M.; Gao, Y.; Cao, Y.; Breuste, J.; Fu, M.; Tong, D. Dynamics and Temperature Regulation Function of Urban Green Connectivity. J. Urban Plan. Dev. 2015, 141, A5014008. [Google Scholar] [CrossRef]
  54. People’s Republic of China State Council. Outline Development Plan for the Guangdong-Hong Kong-Macao Greater Bay Area. 2019. Available online: http://dwhzjd.hceb.edu.cn/Upload/156302245549.pdf (accessed on 3 August 2022).
  55. Guangdong Meteorological Service, Hong Kong Observatory, Macao Meteorological and Geophysical Bureau. Guangdong-Hong Kong-Macao Greater Bay Area Climate Bulletin. Available online: http://gd.cma.gov.cn/zwgk/zwyw/gzdt/201907/t20190723_887447.html (accessed on 22 July 2022).
  56. Shen, J.; Luo, X. From Fortress Hong Kong to Hong Kong-Shenzhen Metropolis: The emergence of government-led strategy for regional integration in Hong Kong. J. Contemp. China 2013, 22, 944–965. [Google Scholar] [CrossRef]
  57. Institute of Geographical Sciences and Resources Research, CAS. Resource and Environmental Science and Data Centre. 2021. Available online: https://www.resdc.cn (accessed on 11 June 2022).
  58. Janssen, L.L.; Vanderwel, F.J. Accuracy assessment of satellite derived land-cover data: A review. Photogramm. Eng. Remote Sens. 1994, 60, 4. [Google Scholar]
  59. Pontius, R.G. Quantification error versus location error in comparison of categorical maps. Photogramm. Eng. Remote Sens. 2001, 67, 540. [Google Scholar]
  60. Wang, Y.; Lin, Q. The Transformation of Planning Ideas and the Exploration of Planning Methods of Urban Green Space Ecological Network Based on MSPA. Chin. Landsc. Archit. 2017, 33, 68–73. [Google Scholar]
  61. Cao, Y.; Fu, M.; Xie, M.; Gao, Y.; Yao, S. Landscape connectivity dynamics of urban green landscape based on morphological spatial pattern analysis (MSPA) and linear spectral mixture model (LSMM) in Shenzhen. Acta Ecol. Sin. 2015, 35, 526–536. [Google Scholar]
  62. Vogt, P.; Riitters, K. GuidosToolbox: Universal digital image object analysis. Eur. J. Remote Sens. 2017, 50, 352–361. [Google Scholar] [CrossRef]
  63. De Oliveira, S.N.; de Carvalho Junior, O.A.; Trancoso Gomes, R.A.; Guimaraes, R.F.; McManus, C.M. Landscape-fragmentation change due to recent agricultural expansion in the Brazilian Savanna, Western Bahia, Brazil. Reg. Environ. Chang. 2017, 17, 411–423. [Google Scholar] [CrossRef]
  64. Wang, Y.; Brandt, M.; Zhao, M.; Xing, K.; Wang, L.; Tong, X.; Xue, F.; Kang, M.; Jiang, Y.; Fensholt, R. Do afforestation projects increase core forests? Evidence from the Chinese Loess Plateau. Ecol. Indic. 2020, 117, 106558. [Google Scholar] [CrossRef]
  65. Gunawardena, K.R.; Wells, M.J.; Kershaw, T. Utilising green and bluespace to mitigate urban heat island intensity. Sci. Total Environ. 2017, 584, 1040–1055. [Google Scholar] [CrossRef]
  66. Abbas, Z.; Zhu, Z.; Zhao, Y. Spatiotemporal analysis of landscape pattern and structure in the Greater Bay Area, China. Earth Sci. Inform. 2022, 15, 1993–1994. [Google Scholar] [CrossRef]
  67. Lin, Y.; An, W.; Gan, M.; Shahtahmassebi, A.; Ye, Z.; Huang, L.; Zhu, C.; Huang, L.; Zhang, J.; Wang, K. Spatial Grain Effects of Urban Green Space Cover Maps on Assessing Habitat Fragmentation and Connectivity. Land 2021, 10, 1065. [Google Scholar] [CrossRef]
  68. Liu, S.; Zhang, X.; Feng, Y.; Xie, H.; Jiang, L.; Lei, Z. Spatiotemporal Dynamics of Urban Green Space Influenced by Rapid Urbanization and Land Use Policies in Shanghai. Forests 2021, 12, 476. [Google Scholar] [CrossRef]
  69. Zhang, L.; Kong, F.; Yin, H.; Sun, Z.; Zhuang, Y.; Ju, W. Spatial pattern of Jinan city based on landscape metrics and moving windows. Chin. J. Ecol. 2010, 29, 1591–1598. [Google Scholar] [CrossRef]
  70. Tian, Y.; Liu, Y.; Jim, C.Y.; Song, H. Assessing Structural Connectivity of Urban Green Spaces in Metropolitan Hong Kong. Sustainability 2017, 9, 1653. [Google Scholar] [CrossRef]
  71. Yang, W.; Yang, R.; Zhou, S. The spatial heterogeneity of urban green space inequity from a perspective of the vulnerable: A case study of Guangzhou, China. Cities 2022, 130, 103855. [Google Scholar] [CrossRef]
  72. Hebert-Dufresne, L.; Pellegrini, A.F.A.; Bhat, U.; Redner, S.; Pacala, S.W.; Berdahl, A.M. Edge fires drive the shape and stability of tropical forests. Ecol. Lett. 2018, 21, 794–803. [Google Scholar] [CrossRef] [PubMed]
  73. Vogt, P.; Riitters, K.H.; Iwanowski, M.; Estreguil, C.; Kozak, J.; Soille, P. Mapping landscape corridors. Ecol. Indic. 2007, 7, 481–488. [Google Scholar] [CrossRef]
  74. Tian, Y.; Jim, C.Y.; Tao, Y.; Shi, T. Landscape ecological assessment of green space fragmentation in Hong Kong. Urban For. Urban Green. 2011, 10, 79–86. [Google Scholar] [CrossRef]
  75. Ostapowicz, K.; Vogt, P.; Riitters, K.H.; Kozak, J.; Estreguil, C. Impact of scale on morphological spatial pattern of forest. Landsc. Ecol. 2008, 23, 1107–1117. [Google Scholar] [CrossRef]
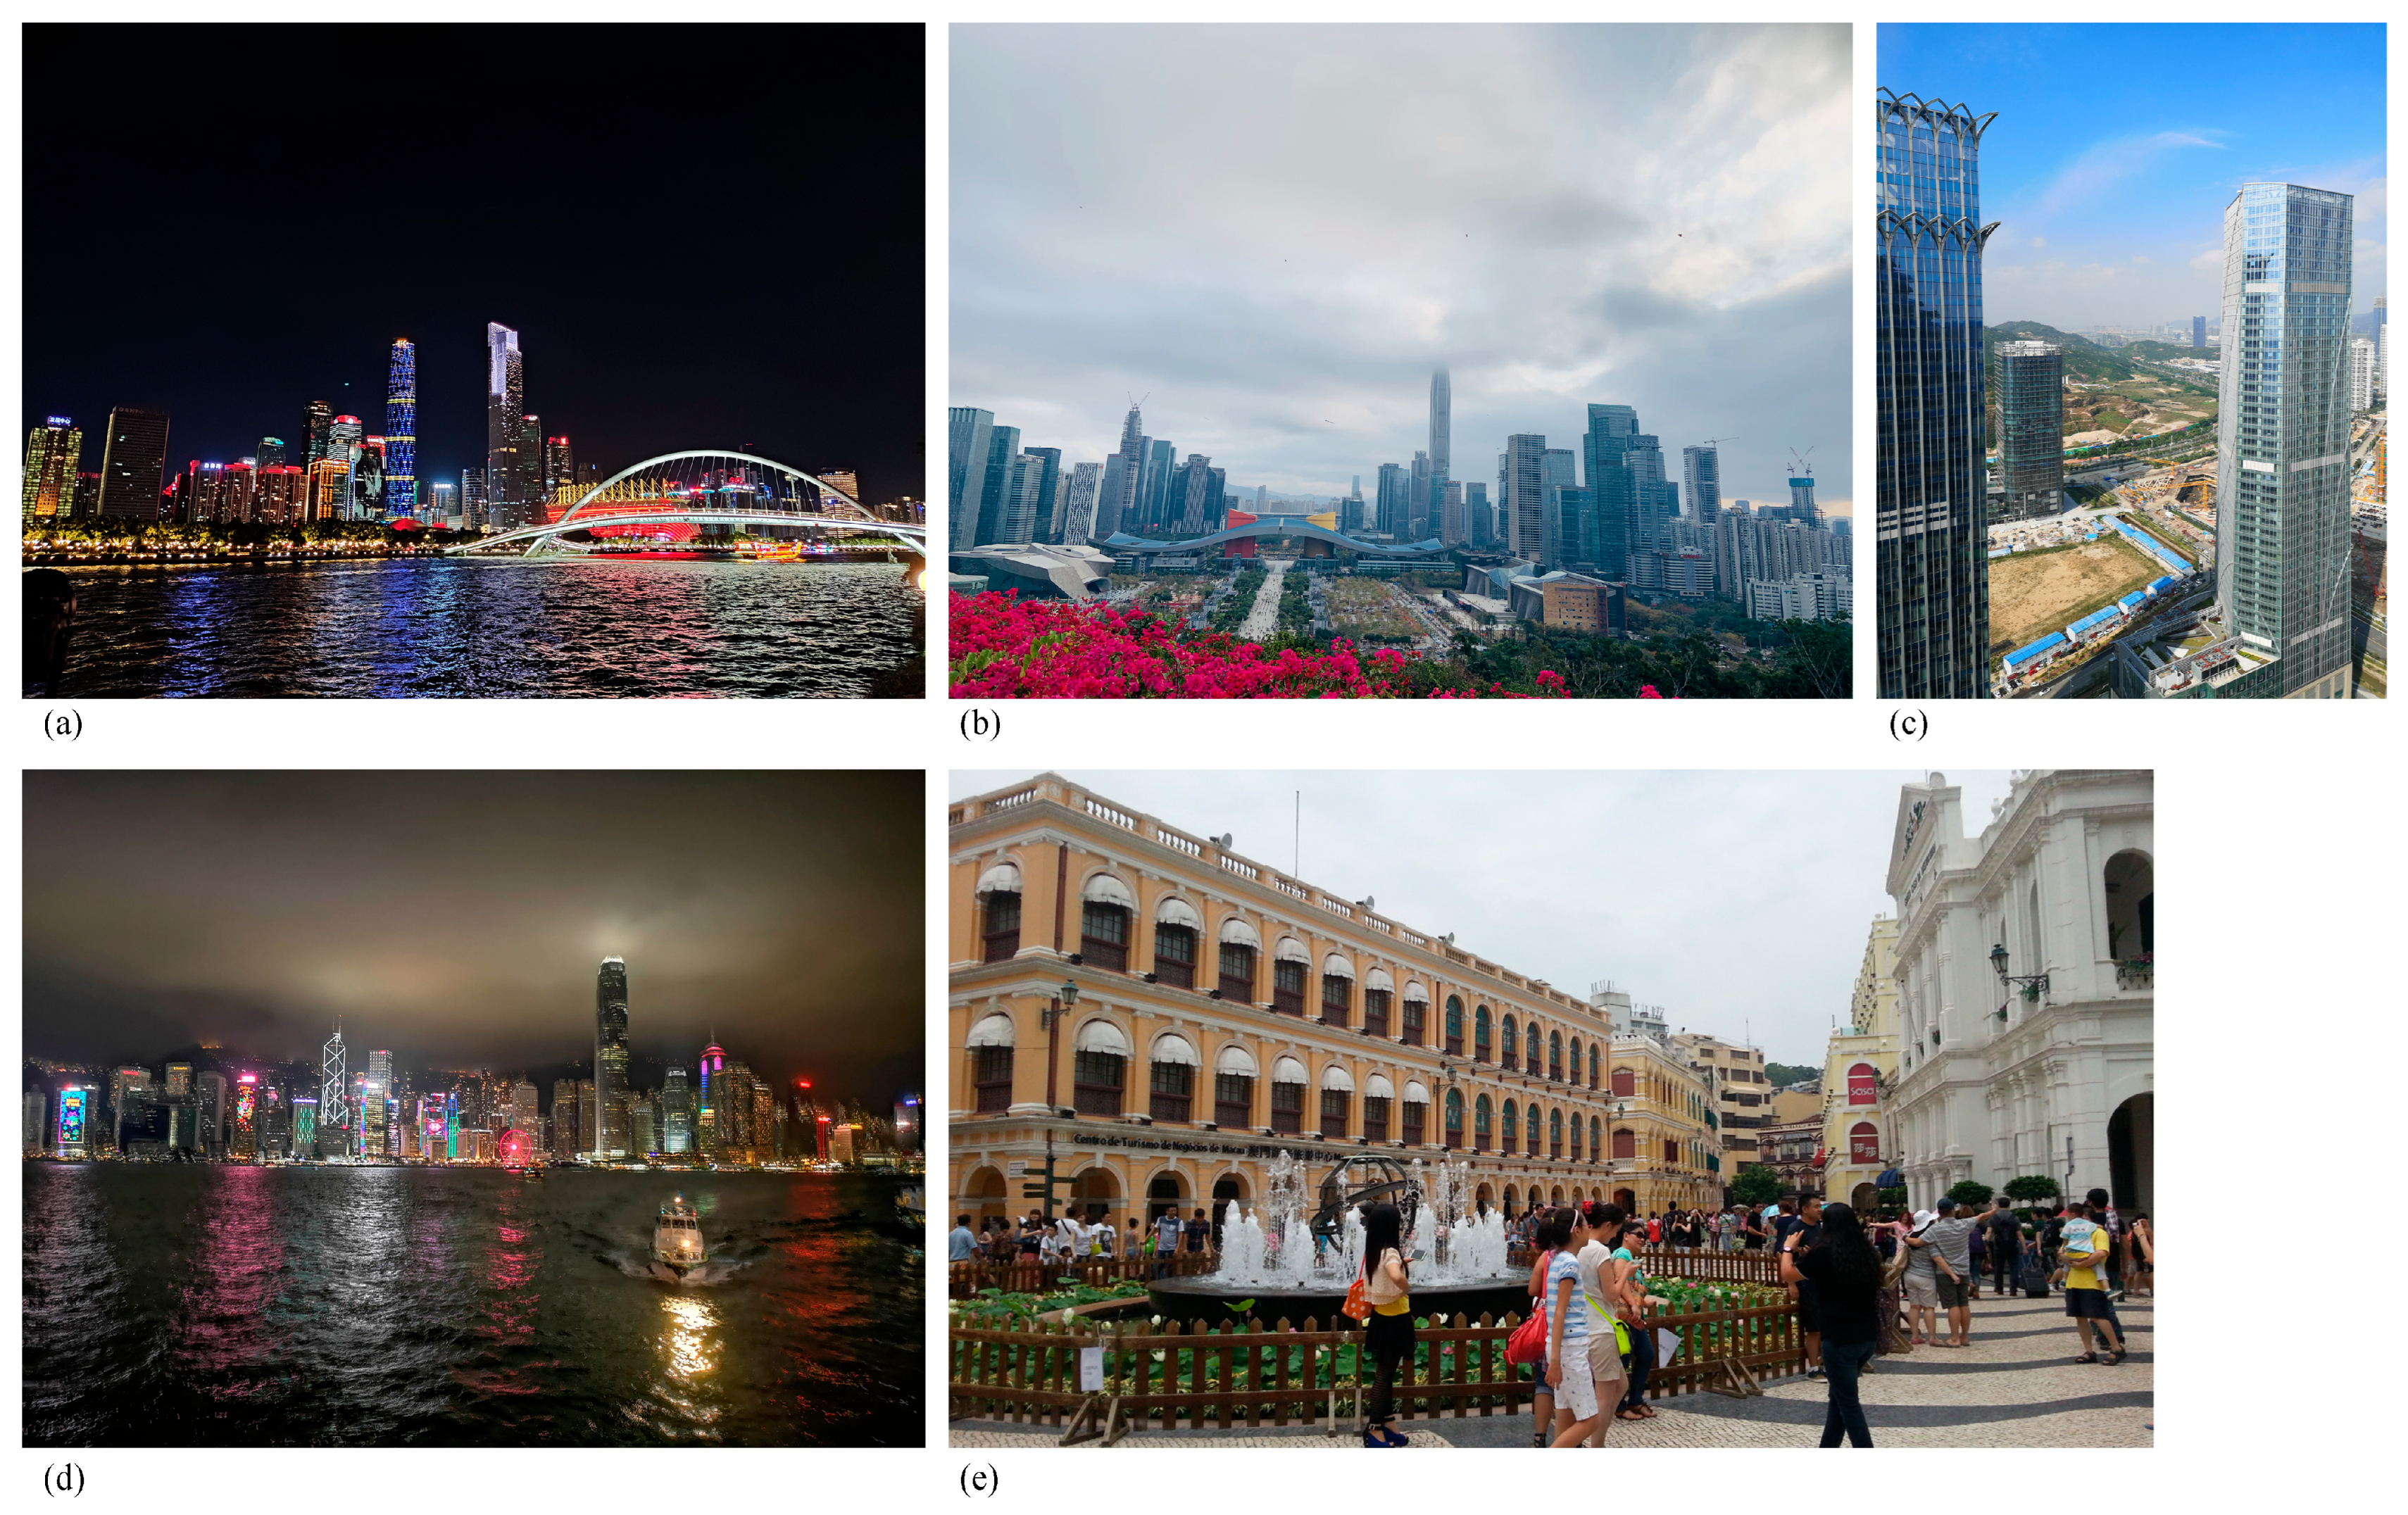
Figure 1. Photos of the five cities. (a) Guangzhou (b) Shenzhen (c) Zhuhai (d) Hong Kong (e) Macao. The source of these photos is taken by the author.
Sustainability 14 12365 g001
Figure 2. Study Area (a) Location of the study area. (b) Guangdong–Hong Kong–Macao Greater Bay Area Core City Area. (c) Land cover and land use in the study area (2021). This figure is based on the National Catalogue Service for Geographic Information (www.webmap.cn/ accessed on 13 July 2021)—1:1 million National Basic Geographic Database (Review No. GS (2016)2556), and the base map is unmodified.
Sustainability 14 12365 g002
Figure 3. Morphological Spatial Pattern Analysis (a) Input binary graph. (b) Output MSPA landscape types. This figure was depicted based on the following source: https://forest.jrc.ec.europa.eu/en/activities/lpa/mspa/ (accessed on 6 August 2022).
Sustainability 14 12365 g003
Figure 4. Methodological workflow for the study.
Sustainability 14 12365 g004
Figure 5. Urban green spaces morphology in Guangzhou (a), Shenzhen–Hong Kong (b), Zhuhai–Macao (c).
Sustainability 14 12365 g005
Table 1. LULC classification. This table is obtained from Institute of Geographical Sciences and Resources Research, CAS, Resource and Environmental Science and Data Centre. (Available online: https://www.resdc.cn accessed on 27 May 2021).
Land Use TypesDescription
Cultivated landLand for growing crops.
ForestlandGrows trees, bushes, bamboo, and mangroves.
GrasslandGrassland with a predominantly herbaceous growth and a cover of 5% or more, including scrub grassland with a predominantly grazing aspect and open forest grassland with a depression of less than 10%.
Water areaLand dedicated for water and water facilities.
Construction landUrban and rural settlements, as well as industrial, mining, and transport land.
Unused landUnexploited land, including land that is difficult to access.
Table 2. Descriptions of the seven MSPA element types and landscape ecological meaning. The spatial morphological definition is available online: https://forest.jrc.ec.europa.eu/en/activities/lpa/mspa/#Description (accessed on 6 August 2022).
Landscape
Element Type
Spatial Morphological
Definition
Landscape Ecological Meaning
CoreInterior area excluding perimeterThe larger green patches in the foreground are an important part of the ecological network of “sources”, mostly habitats for organisms or migration sites, and in the urban areas, such as large parks and scenic areas.
IsletDisjoint and too small to contain coreSmall, isolated or weakly interconnected green patches, equivalent to “ecological islands” in an ecological network, usually at the municipal level as residential green spaces, small parks, etc.
PerforationInternal object parameterTransition zone between the core and the non-vegetated land type within it, acting like an edge, with edge effects.
EdgeExternal object parameterTransition zone between core and peripheral non-vegetated land types, acting as an edge, e.g., forested periphery of a landscape.
LoopConnected to the same core areaInterconnected corridors within the same core area for the exchange of materials and energy within the core area, mostly in the form of road green belts within patches.
BridgeConnected to different core areaCorridors used to connect different cores, which are channels for energy and material exchange between adjacent core patches, mostly in the form of ribbons of green space.
BranchConnected at one end to edge, perforation, bridge, or loopExtending area of green space; only one end is connected to the green space.
Table 3. Statistics of land types in Guangzhou, Shenzhen–Hong Kong, Zhuhai–Macao.
Land Use TypeGuangzhouShenzhen–Hong KongZhuhai–Macao
Area (km2)Proportion of Total (%)Area (km2)Proportion of Total (%)Area (km2)Proportion of Total (%)
Cultivated land548.4297.59%21.6840.71%138.0378.55%
Forestland3341.95946.28%1418.72446.31%459.70728.47%
Grassland102.4731.42%78.6242.57%33.6682.09%
Water area707.9929.80%176.4125.76%444.18427.51%
Construction land2484.00734.40%1353.03744.17%517.35732.04%
Unused land36.7420.51%14.9600.49%21.5791.34%
Table 4. Statistic of the seven MSPA elements in five cities.
CityArea of Each MSPA Element Indicator As a Proportion of the Administrative Area (%)
CoreIsletPerforationEdgeLoopBridgeBranch
Guangzhou31.84%1.05%2.47%5.64%1.77%1.94%1.48%
Shenzhen25.55%1.03%0.75%6.82%1.28%1.70%1.61%
Hong Kong42.22%0.79%1.50%8.26%2.69%2.49%1.49%
Zhuhai18.31%0.96%0.41%5.55%1.37%1.05%1.08%
Macao3.94%1.88%0.35%4.51%1.68%0.56%1.06%
Publisher’s Note: MDPI stays neutral with regard to jurisdictional claims in published maps and institutional affiliations.