Article

Application of Smart Glasses for Field Workers Performing Soil Contamination Surveys with Portable Equipment

Department of Energy Resources Engineering, Pukyong National University, Busan 48513, Korea
*
Author to whom correspondence should be addressed.
Sustainability 2022, 14(19), 12370; https://doi.org/10.3390/su141912370
Submission received: 13 August 2022 / Revised: 26 September 2022 / Accepted: 26 September 2022 / Published: 28 September 2022

Abstract

:
Currently, portable X-ray fluorescence (PXRF) analysis is widely used as an auxiliary method for the preliminary investigation of soil heavy metal contamination. In this study, a smart glasses-based application (app) was developed to support field workers performing soil contamination surveys with a PXRF analyzer. The app was developed using the MIT App Inventor and runs on smart glasses based on an optical head-mounted display that provides both the original function of glasses to see the objects in front of the wearer, and the function of a computer at the same time. Using the app, a field worker wearing smart glasses can move to soil sampling points while checking the satellite image, survey plan, and real-time locations of other field workers through the smart glasses. At a sampling point, the worker can use both hands to collect and pretreat soil samples, and then measure the content of elements using a PXRF analyzer. The measurement results can be entered into the app using a wearable keyboard and shared in real-time with other field workers. The demonstration at the Ilgwang mine in Korea revealed that the app could effectively support field workers and shorten the working time compared to a previous study that was performed under the same conditions. The subjective workload was evaluated using the NASA task load index on ten subjects, and most of workload factors were evaluated as low.

1. Introduction

Tailing in the mining area typically contains trace amounts of potentially toxic elements (PTEs) [1]. Therefore, if tailings or leachate flows into the surrounding soil during a rainfall, serious disasters such as soil heavy metal contamination, ecosystem disturbance, inhibition of growth of animals and plants, and chronic and acute human diseases may occur in the long term [2,3,4]. Until recently, various studies on soil heavy metal contamination by mine drainage and tailings leachate have been conducted [5,6,7,8]. In addition, studies have been conducted to create soil heavy metal contamination maps through field surveys to establish appropriate soil contamination prevention measures in the mine area [9,10].
Chemical test methods such as the inductively coupled plasma-atomic emission spectrometer (ICP-AES) have been mainly used to investigate the type and content of PTE in the soil of the mine area [11]. ICP-AES is also used as a standard soil analysis method designated by the government in Korea, and has the advantage of high accuracy [12]. However, ICP-AES has disadvantages. For example, the pretreatment process of soil samples is complex, requires a long time for analysis, and is expensive [13]. To counteract these shortcomings, the portable X-ray fluorescence (PXRF) analysis method can be used in the field [14]. The PXRF analysis method is relatively low in analysis accuracy compared to the chemical analysis method, but it has the advantage of being able to immediately check the type and content of PTE in the field because the pretreatment of soil samples is simple and the time required for analysis is short [15,16]. The method using PXRF can analyze a larger amount of soil samples than the chemical method in a limited time and with budget conditions [15]. Therefore, PXRF analysis is widely used as an auxiliary method for the preliminary investigation of soil heavy metal contamination and effective soil sample sampling support [17,18,19,20,21].
Until recently, many studies using PXRF analysis have been reported for the preliminary investigation of soil heavy metal contamination. Weindorf et al. [22] applied the PXRF analysis method to evaluate the quality of the agricultural environment around the city and Hu et al. [23] evaluated the applicability of PXRF analysis in agricultural soils. McGladdery et al. [24] used PXRF analysis to identify the concentration of elemental affecting plant growth, and Tighe et al. [25] evaluated the potential contamination of old copper metallurgy sites and appraised the environmental and human risks. Lemière and Bruno [26] examined the effects of PXRF and cases applied in mining and environment fields to solve the disadvantages of the ICP-AES method. Rawal et al. [27] showed that PXRF analysis can predict soil base saturation percentage (BSP) for agricultural soils. Andrade et al. [28] analyzed the chemical properties of the soil of the Brazilian Coastal Plain in tropical climate conditions using PXRF. In addition, Karimi et al. [29] gauged the level of potential soil contamination using PXRF to measure the concentration of heavy metals that deteriorated and decomposed during the natural transformation of ultrafine rocks in the Kurdistan region in western Iran.
During the preliminary investigation of soil heavy metal contamination in abandoned mine areas, PXRF was used to quickly analyze the types and contents of PTE in the soil and to study how to efficiently prepare the pollution map. Lee and Choi [10] verified that the copper and lead soil contamination mapping method using PXRF and GIS (geographic information systems) can be effectively used in the field. Suh et al. [30] obtained data using PXRF analysis in soil heavy metal contamination survey in an abandoned mine area and produced a copper (Cu) soil contamination map in the investigated area using GIS. The mapping method using PXRF and GIS increased the investigation speed to shorten the mapping time and verified the prediction accuracy. Lee et al. [31] compared the results of ICP-AES and PXRF for the accuracy of soil contamination mapping through four methods. The results of this study show that ICP-AES and PXRF each have advantages and that their integration is the most accurate method. Kim and Choi. [32] conducted an effective soil sampling by identifying areas requiring soil heavy metal contamination evaluation and additional investigation through hot spot analysis based on the soil sample data obtained using PXRF. However, until now, research on the use of smart glass, a wearable technology that can support field workers in the preliminary investigation of soil heavy metal contamination using PXRF analysis, has not been conducted.
Smart glasses are wearable devices that can be worn on the face as a device that provides both the original function of glasses to see objects in front of the wearer, and the function of a computer at the same time. Since Google released ‘Google Glasses’ in 2012, companies such as Sony, Microsoft, and Epson have launched smart glasses products, and smart glass-based apps are being developed in various fields. Various studies have been conducted on the application of smart glasses and their user perceptions in various fields [33,34,35,36]. Most of the studies noted hands-free, photo and video documentation, and rapid analysis as some of the advantages of smart glasses. For example, in the medical field, smart glasses apps have been developed for the purpose of effectively delivering patient status and information from doctors [28], or assisting people with disabilities such as vision and autism [37,38]. In the logistics industry, smart glasses apps have been developed so that workers could freely use both hands and easily check the information of goods [39]. In the livestock industry, the app using the camera of smart glasses immediately and visually provided livestock information to improve the efficiency of stable operation [40]. In addition, smart glass-based app development is actively being carried out in the fields of education [41] and tourism [42]. However, until now, no smart glasses-based application has been developed that can support field workers with handheld equipment when investigating soil heavy metal contamination in the mining industry.
In this study, a smart glasses-based app, named the Mine Field Worker Support (MFWS) system, was developed to support field workers in conducting preliminary investigations of heavy metal soil contamination using a handheld PXRF analyzer. A field worker wearing smart glasses moves to the survey point with the help of the app, and inputs the analysis result of the type and content of PTE in the soil measured using the PXRF analyzer into the app. As a result, it is possible to immediately check the evaluation results of each element according to the standards for heavy metal soil contamination concern and countermeasures prescribed by the Korean Soil Environment Conservation Act and the results of the heavy metal pollution index (PI) evaluation [43,44,45]. In addition, it enables efficient collaboration with other workers through a cloud that allows real-time data sharing. The developed smart glasses-based apps were tested at the Ilgwang mine in Korea. The workload of field workers wearing smart glasses was evaluated according to the NASA-TLX evaluation method [46].

2. Methods

2.1. Development of Smart Glasses-Based Mine Field Worker Support (MFWS) System

The design of the MFWS system is summarized in Figure 1. A handheld portable XRF (Innov-X DELTA Handheld XRF analyzer; Olympus, Japan) was used to determine quickly the heavy metal content in the soil. Mine field workers arriving at the survey point measured the heavy metal content using the PXRF after collection and pretreatment of soil samples, and input the result into the app using a wearable keyboard (TAP). Workers could immediately check the evaluation results according to the soil contamination concerns/measure standard for each heavy metal element and the heavy metal pollution index evaluation results at the site using a visual method. Therefore, it was possible to quickly make decisions such as soil sampling and additional investigation. In addition, since the evaluation results of heavy metal content and soil contamination for each branch were transmitted to the cloud server in real-time through the app, multiple workers working together could efficiently collaborate while sharing the survey results.
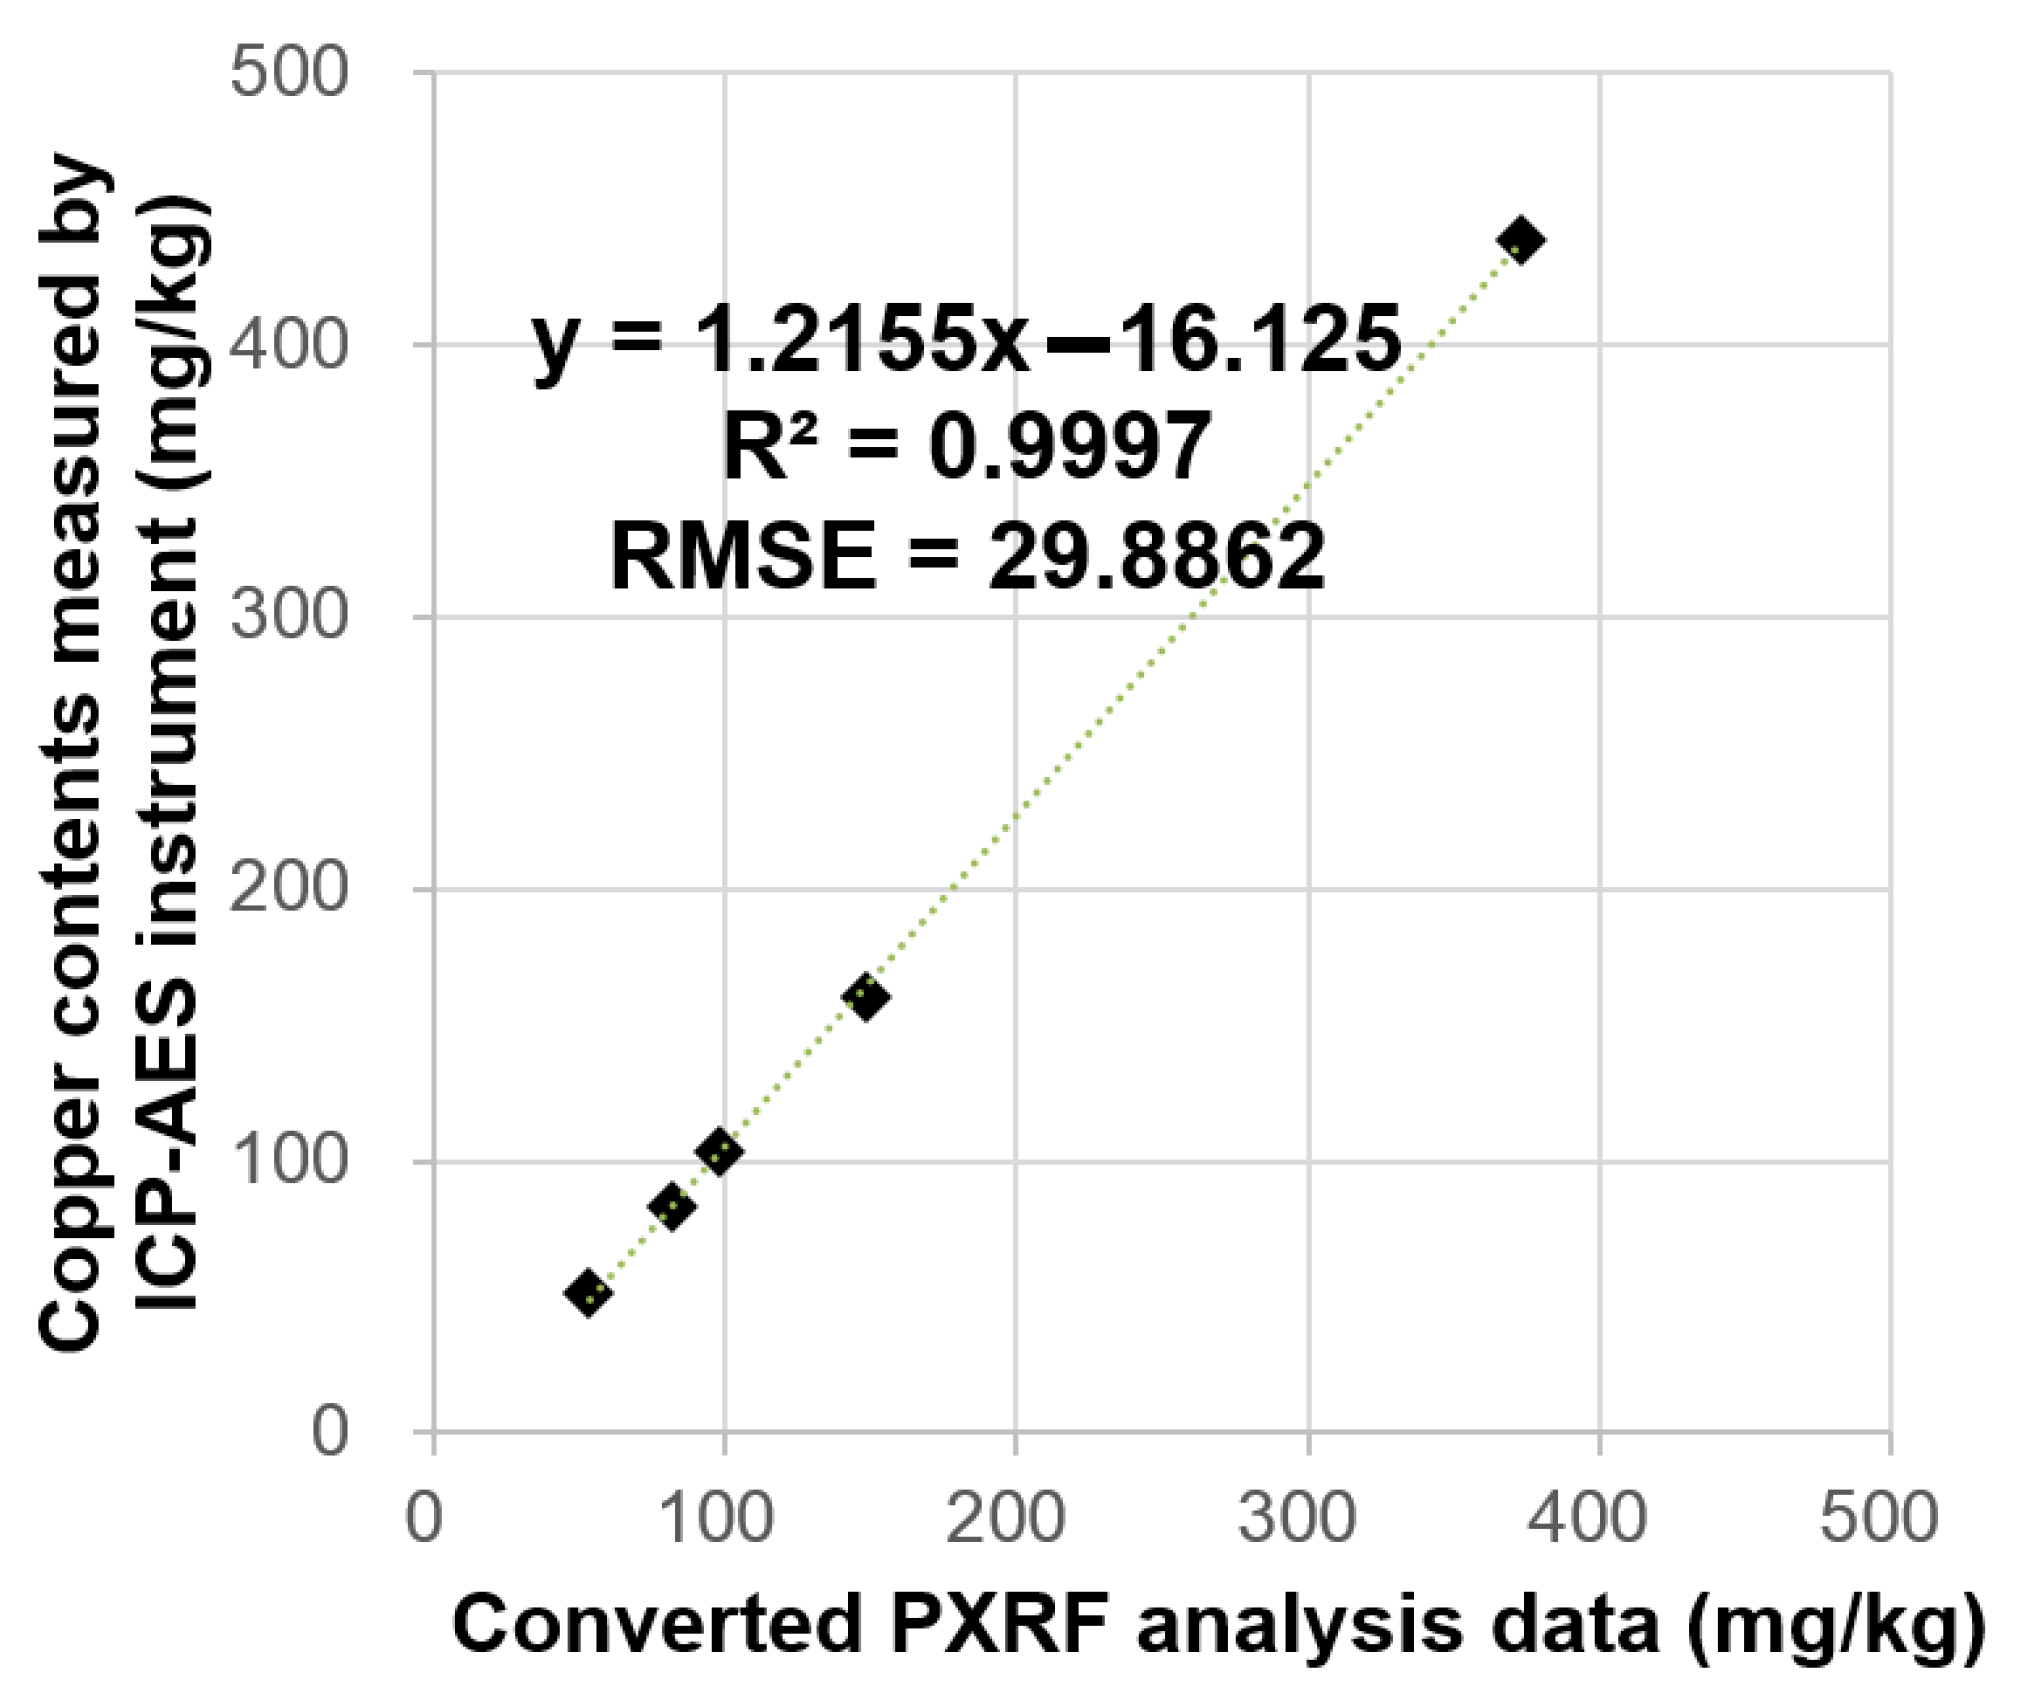
The device, weighing about 2 kg, consists of a rechargeable Li-ion battery, a silicon drift detector (SDD), a special filter, and multiple beams with a resolution of about 185 eV. It operates at 40 kV and 0.1 mA and can analyze a wide range of elements. PXRF instruments support quantitative analysis using the fundamental parameters (FP). The FP method can perform elemental analysis without a calibration curve, and the accuracy of the results can be improved if the proper sample is used [47]. The accuracy of the PXRF instrument used in this study was verified in a previous study [30] by comparing the PXRF and inductively coupled plasma atomic emission spectrometry (ICP-AES) analysis data for the same soil samples. The result of the comparison of the PXRF and ICP-AES datasets is shown in Figure 2. The gradient (slope) of the first-order trend line and y-intercept were determined to be 1.2155 and −16.125, respectively. The root mean square error (RMSE) was calculated to be 29.8862.
The smart glasses used in this study were Moverio BT-350 (Epson, Japan) (Figure 3a). This product, launched in 2017, has a panel (0.43 inches) and screen size of 40 to 320 inches (virtual viewing distance 2.5–20 m), but the screen size can have a personal difference, and shows the stereoscopic view to the user by the frequency-based reflective waveguide method [48]. The technology called the Epson light-guide transmits light from the microdisplay through a waveguide of about 1 cm thickness to the eyes through total reflection. It uses an Android 5.1 operating system and is equipped with sensors such as GPS, and gyroscopic, accelerometer, illumination, and geomagnetic sensors. Moreover, Wi-Fi communications and Bluetooth 4.1 communications are possible. Unlike other Epson products, the BT-350 has a controller connected to the main body by wire.
In this study, a TAP was used as an input device for data in the MFWS system (Figure 3b). The TAP consists of five flexible rings, each of which is connected by a strap [49]. Characters as well as sentence codes and special characters can be input. TAP works in two modes: tapping and optical mouse. Almost any alphabet can be entered on a standard keyboard by tapping, and the user can specify and activate the keyboard. The optical mouse mode uses a small optical chip installed at the edge of the thumb ring where the laser and image sensors are located. The mouse can be used as follows: Place the edge of the ring on the surface, move the cursor with the movement of the thumb, and control the mouse click through the tab of the index or middle finger. In this study, screen movement and item selection were performed using the optical mouse mode, and measured values were entered through the tapping motion. TAP can be optimized for both right and left hands. In particular, TAP can be used not only on a desk with a hard surface, but also on a soft or irregular surface, so it can be used conveniently without any restrictions in place [50]. In this study, it was judged that a wearable keyboard was more convenient for field workers than a smartphone that has to be carried in the hand or put in a pocket and then taken out.
In this study, we developed an application for smart glasses based on the Android operating system to control the MFWS system, which helps field workers to easily collect information and evaluate soil contamination. The application development tool used App Inventor which can program the app of the Android operating system. App Inventor is based on Scratch developed by MIT Media Lab, and is composed of three elements: the App Inventor designer, blocks editor, and an Android emulator [50]. Elements to be used in the app designer can be placed and designed, and graphic codes can be drag-and-dropped in the block editor to connect the desired action to each event and control the application [51].
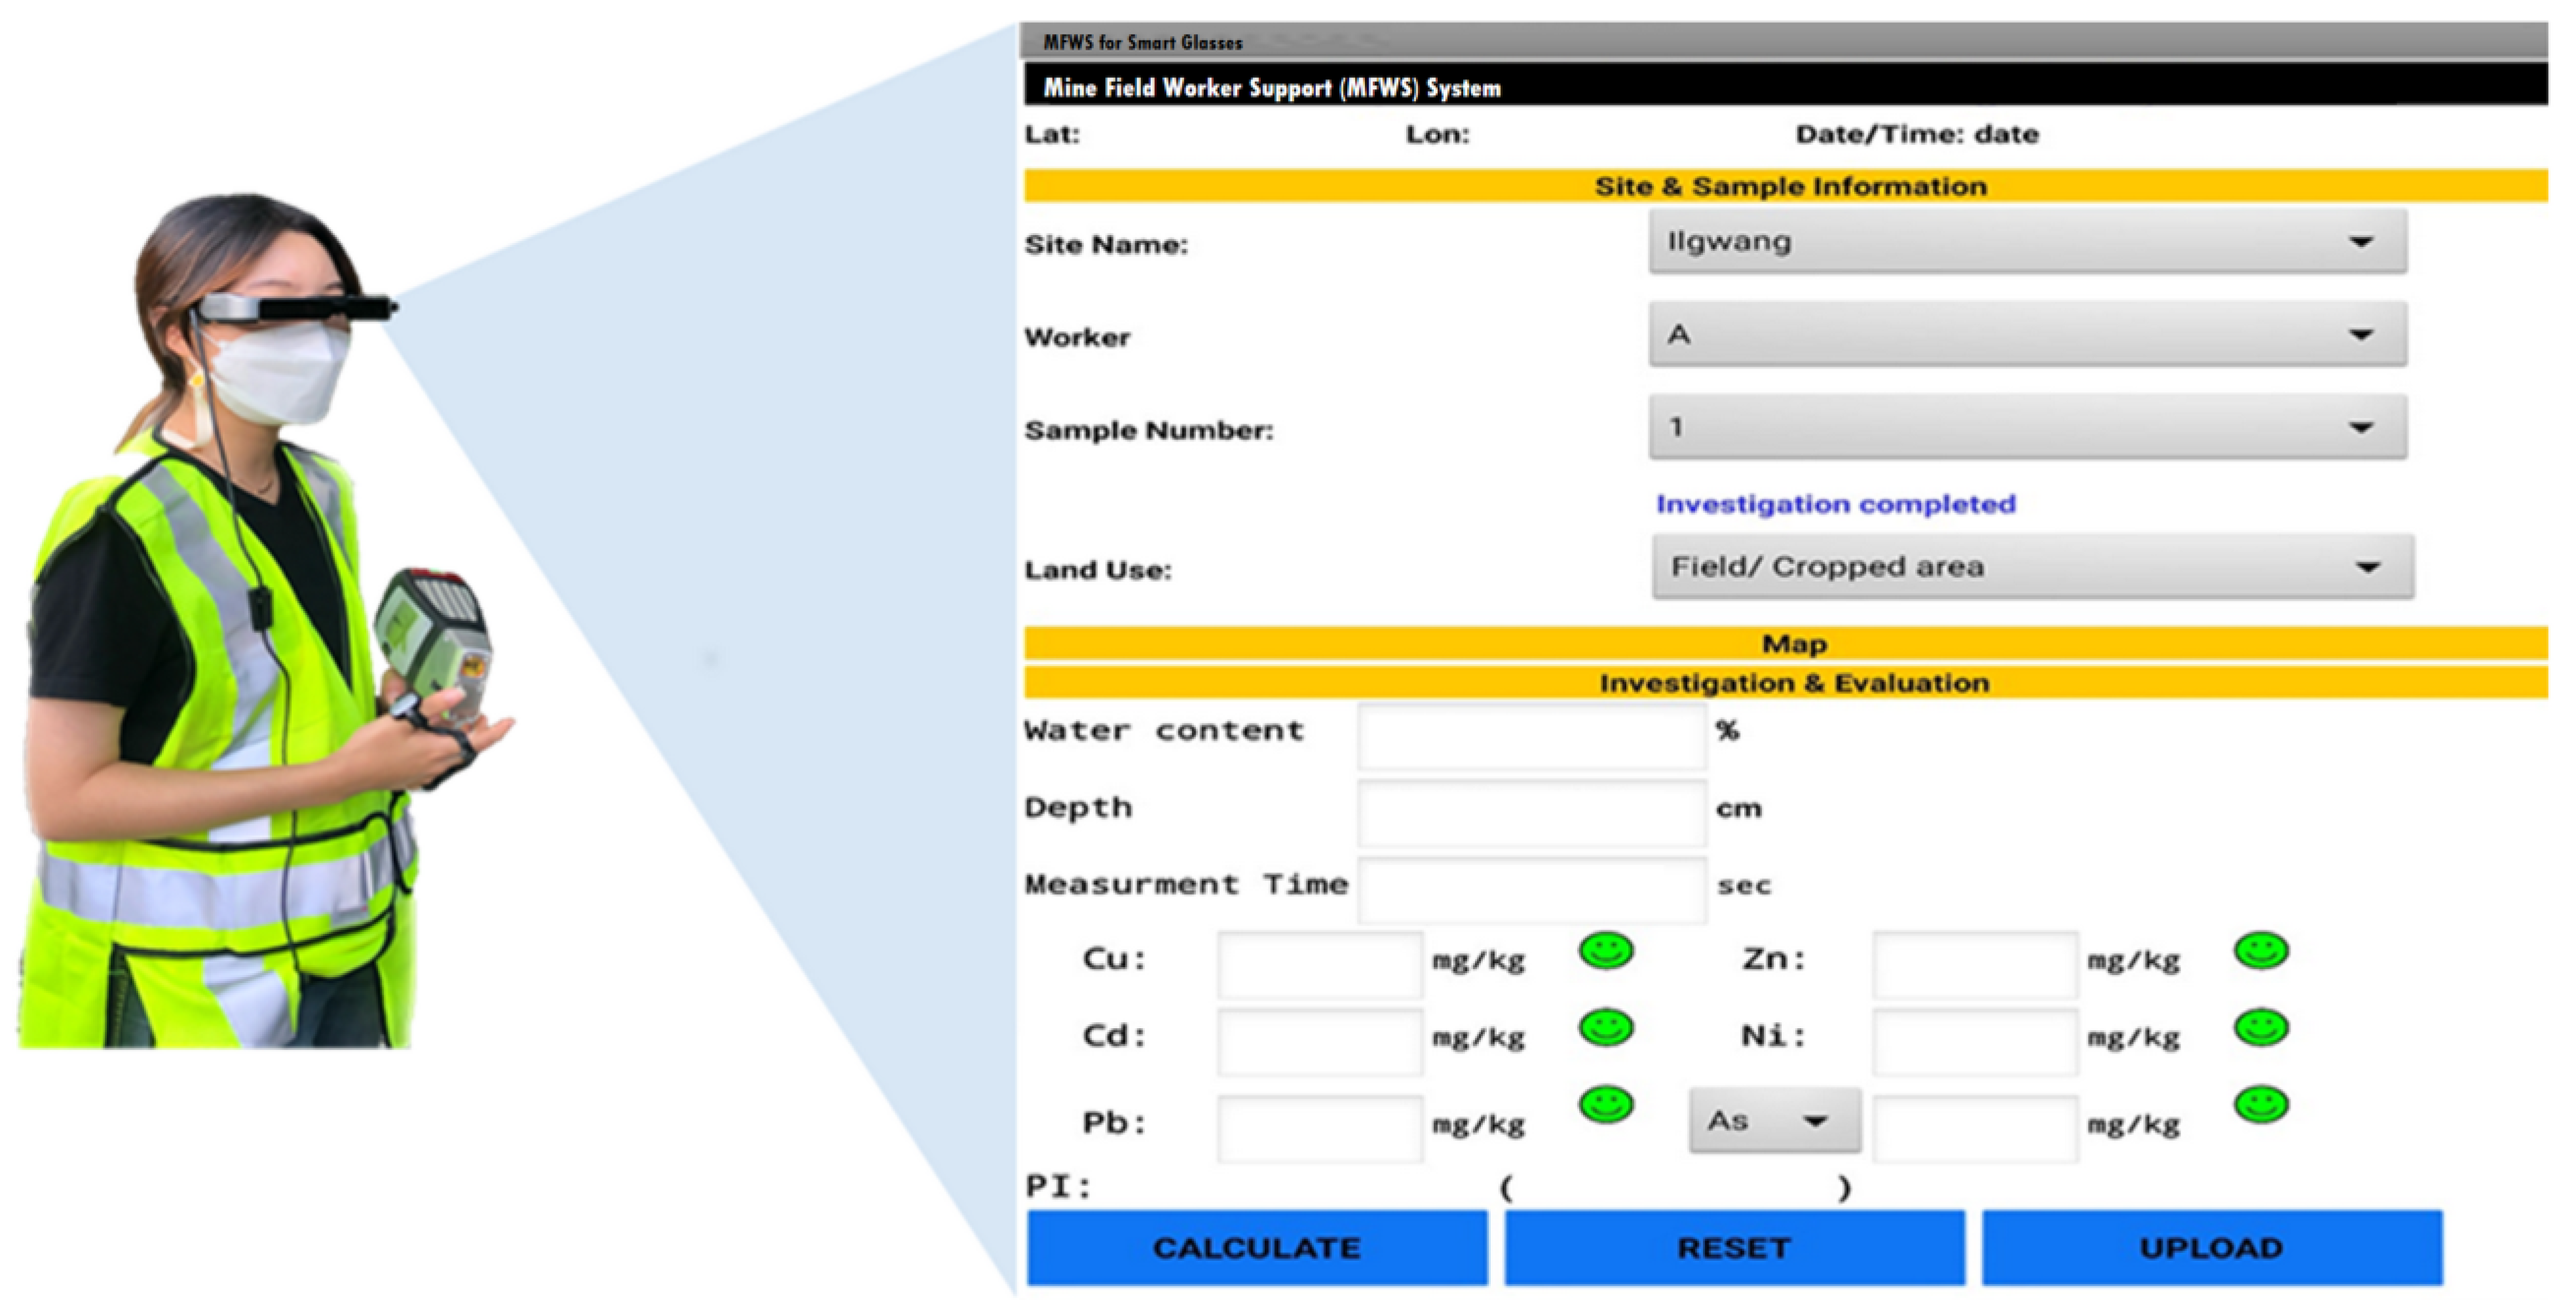
The MFWS system developed in this study is divided into three sections: (1) site and sample information, (2) map, and (3) investigation and evaluation as shown in Figure 4. At the top, one can check the worker’s current location (latitude, longitude) and the current date and time. ‘Site and sample information’ is a section for setting the basic data to be stored. Basic information (site name, worker, sample number, land use) about the sample location to be measured can be entered. Each item is composed in the form of a spinner, so you can select a value for each item. Selecting a sample number can prevent the worker from the sample investigated in duplicate by showing whether the sample is irradiated. In the map section, whether or not the sampling point is irradiated through color can be checked at a glance, and workers in the field can know the current location and the path of the sample point through the map. ‘Investigation and evaluation’ is the section where data values to be stored are entered, and where moisture obtained during pre-processing, sample measurement depth, sample measurement time, and the content values of each element of the completed soil sample (Cu, Cd, Pb, Zn, Ni, As, and others) can be entered. The contamination degree of the comprehensive heavy metal of the corresponding spot can be confirmed through the calculate button at the bottom.
Soil pollution standards and analysis methods vary from country to country. Thus, in the preliminary survey of soil pollution, we used the soil pollution standards prescribed by the Korea Soil Environment Conservation Act and pollution index (PI). First, the pollution degree of the soil was evaluated by applying the PI using the data acquired via PXRF for the soil in the evaluation area. Next, according to the soil pollution conservation in Korea, it was judged whether the soil pollution standard value of each element was exceeded. The PI is based on the tolerance level (Table 1) proposed by Kloke [52]. The conversion formula is as follows:
Pollution   Index ( N ) = i = 1 n E a c h   h a e v y   m e t a l   c o n t e n t A l l o w a b l e   l i m i t s   f o r   s o i l   c o n t a m i n a t i o n   o f   e a c h   h e a v y   m e t a l n
A PI value of 1.0, or higher, not only indicates that the heavy metal content in the soil is above the permissible limit value on average, but also that an area is contaminated by artificial or natural factors. Additionally, a PI of less than 1.0 indicates an uncontaminated area [52]. The contamination status of each element was divided into three stages according to the Korean soil environment conservation method [12].
The Korean soil environment conservation method [12] has the soil contamination concern standards and the soil contamination countermeasures standards. The soil contamination countermeasures standard is the pollution status of the extent to which the degree of pollution may interfere with the health of people, animals, and plants. It also indicates that the land use and facility installation regulation measures are necessary. The soil contamination concern standard is approximately 40% of the countermeasures standard, which is the pollution level that will prevent contamination from deepening. In addition, the two criteria are divided into three according to the use of the survey area. Therefore, in the app, when the measured value of heavy metals does not exceed the soil contamination concern standard, it is displayed in green color, and red if it exceeds the countermeasures standard.
The calculated data was stored and processed through the real-time database cloud. In this study, Firebase, a mobile and web application development platform operated by Google, was used [53]. Firebase is a tool for app development, app data storage, synchronization, and app quality improvement, and this study used a real-time database function. A real-time database can process large-scale data using a cloud-hosted database. It is also saved in JSON format, and the saved data can be exported in the form of a txt file or Excel, so it is effective for data processing [54]. By using a real-time database, all users can share data instantly. That is, by synchronizing information in real-time, it is possible to collaborate between devices.

2.2. Field Experiment Method

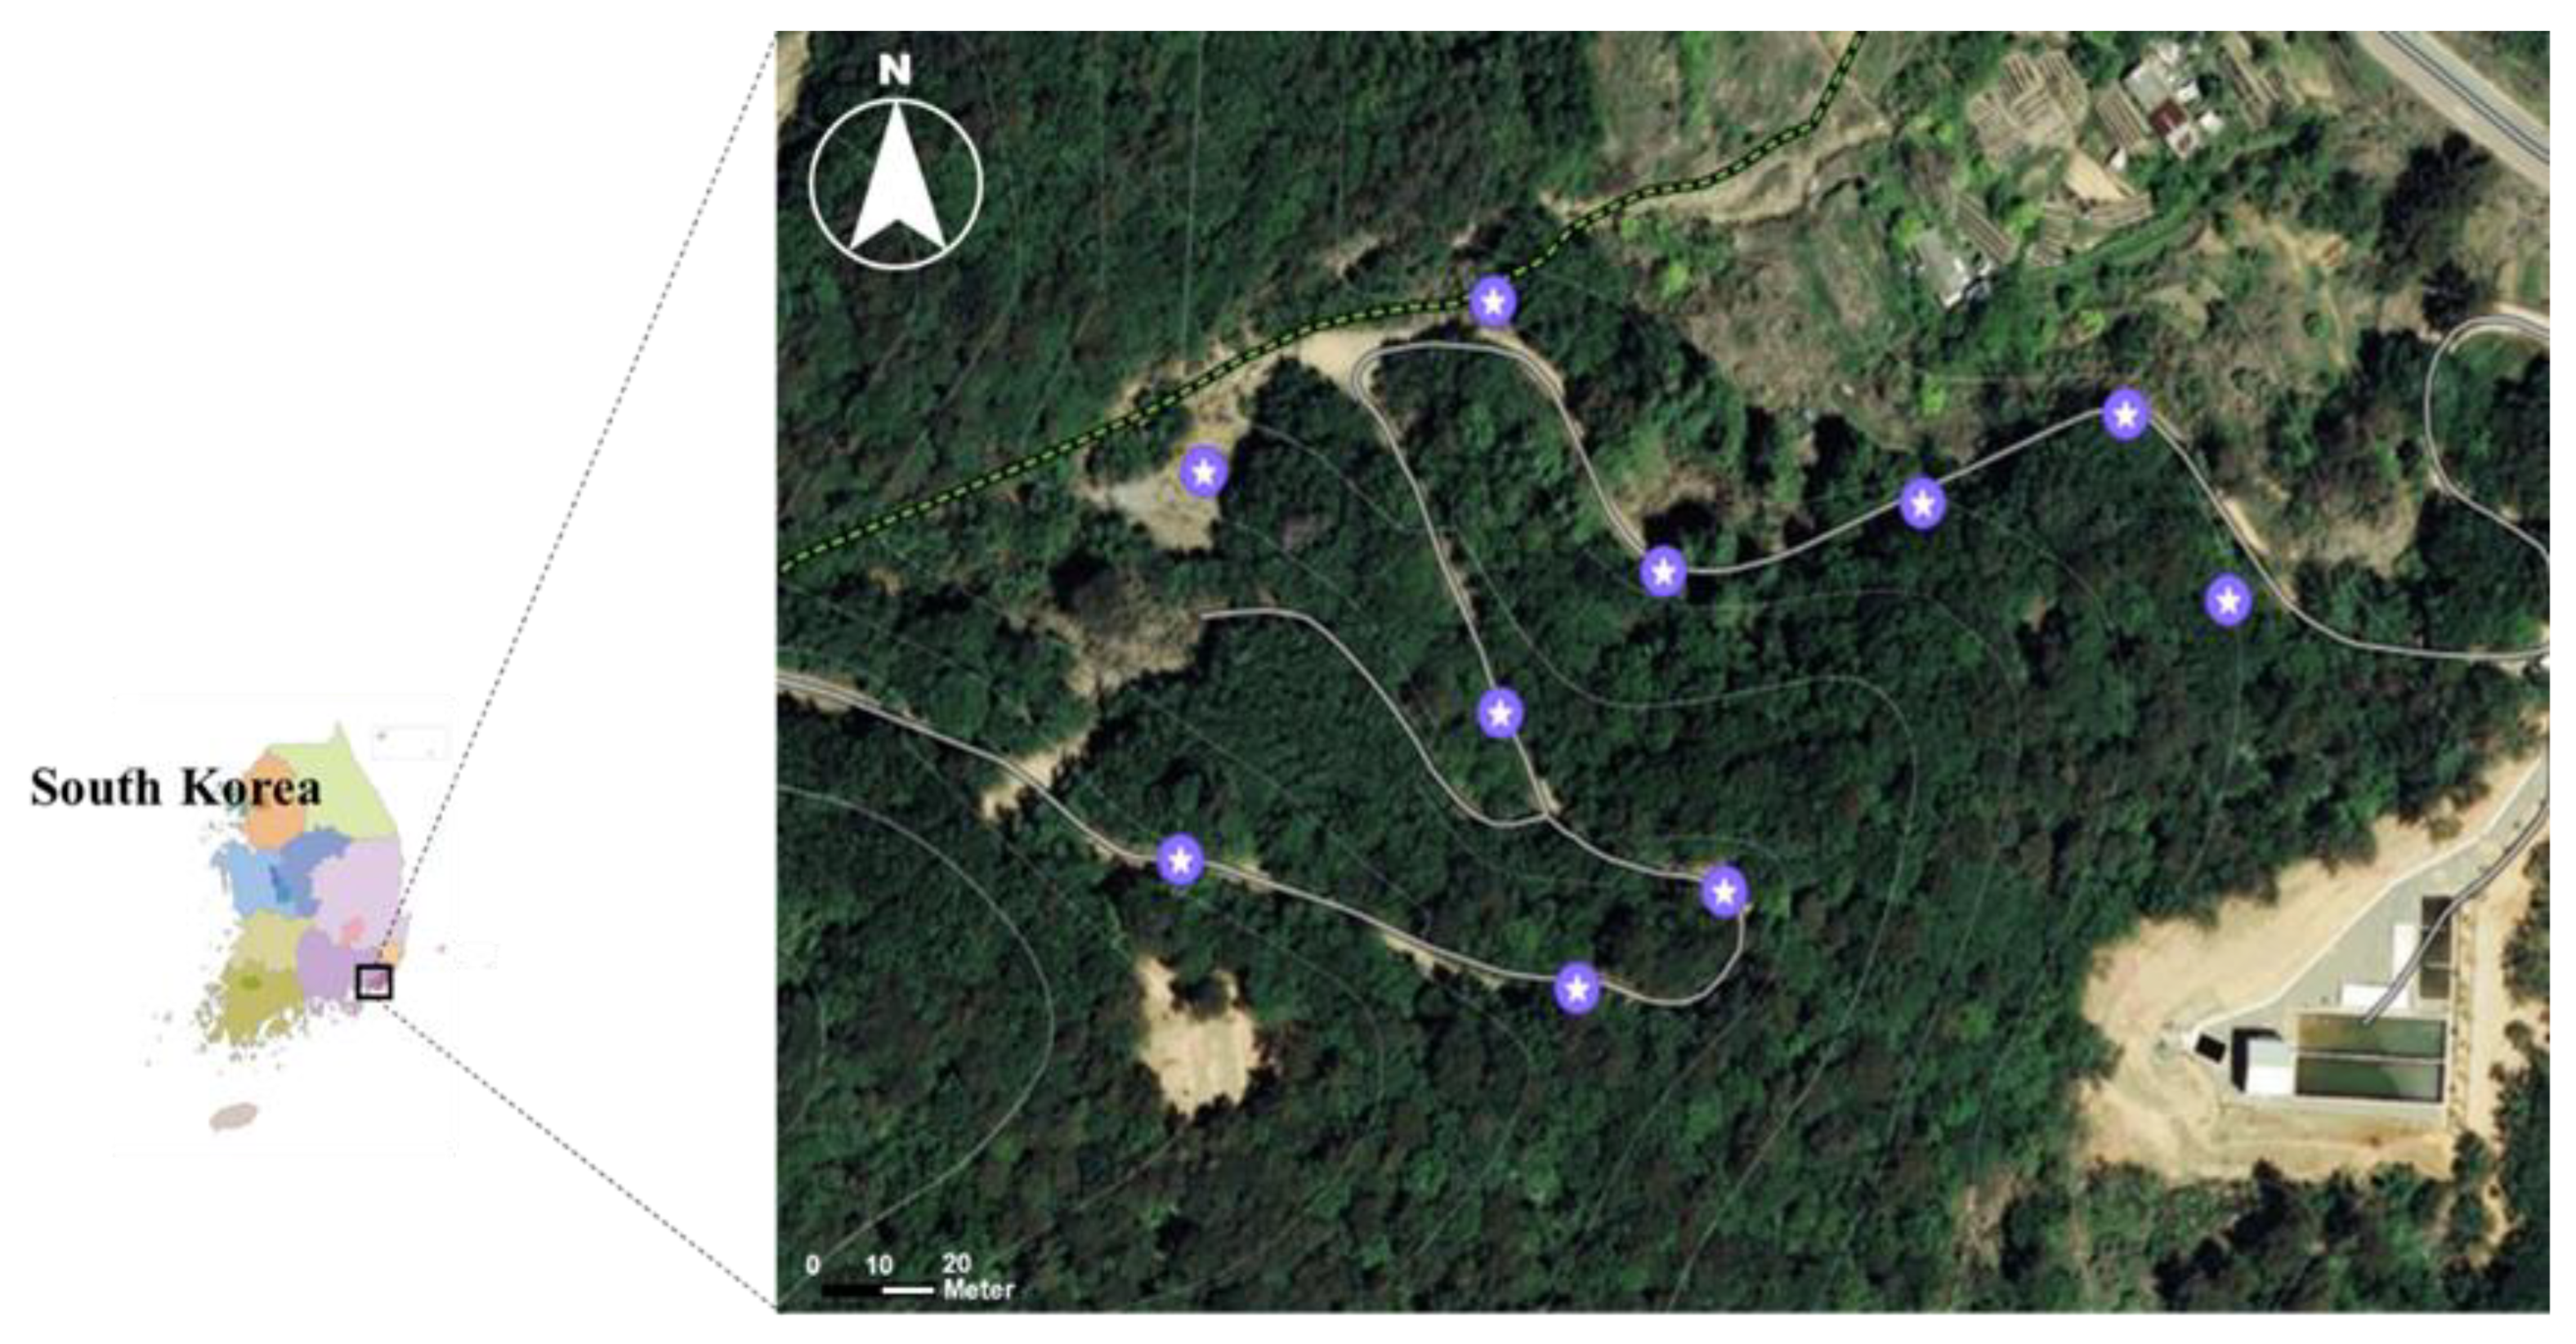
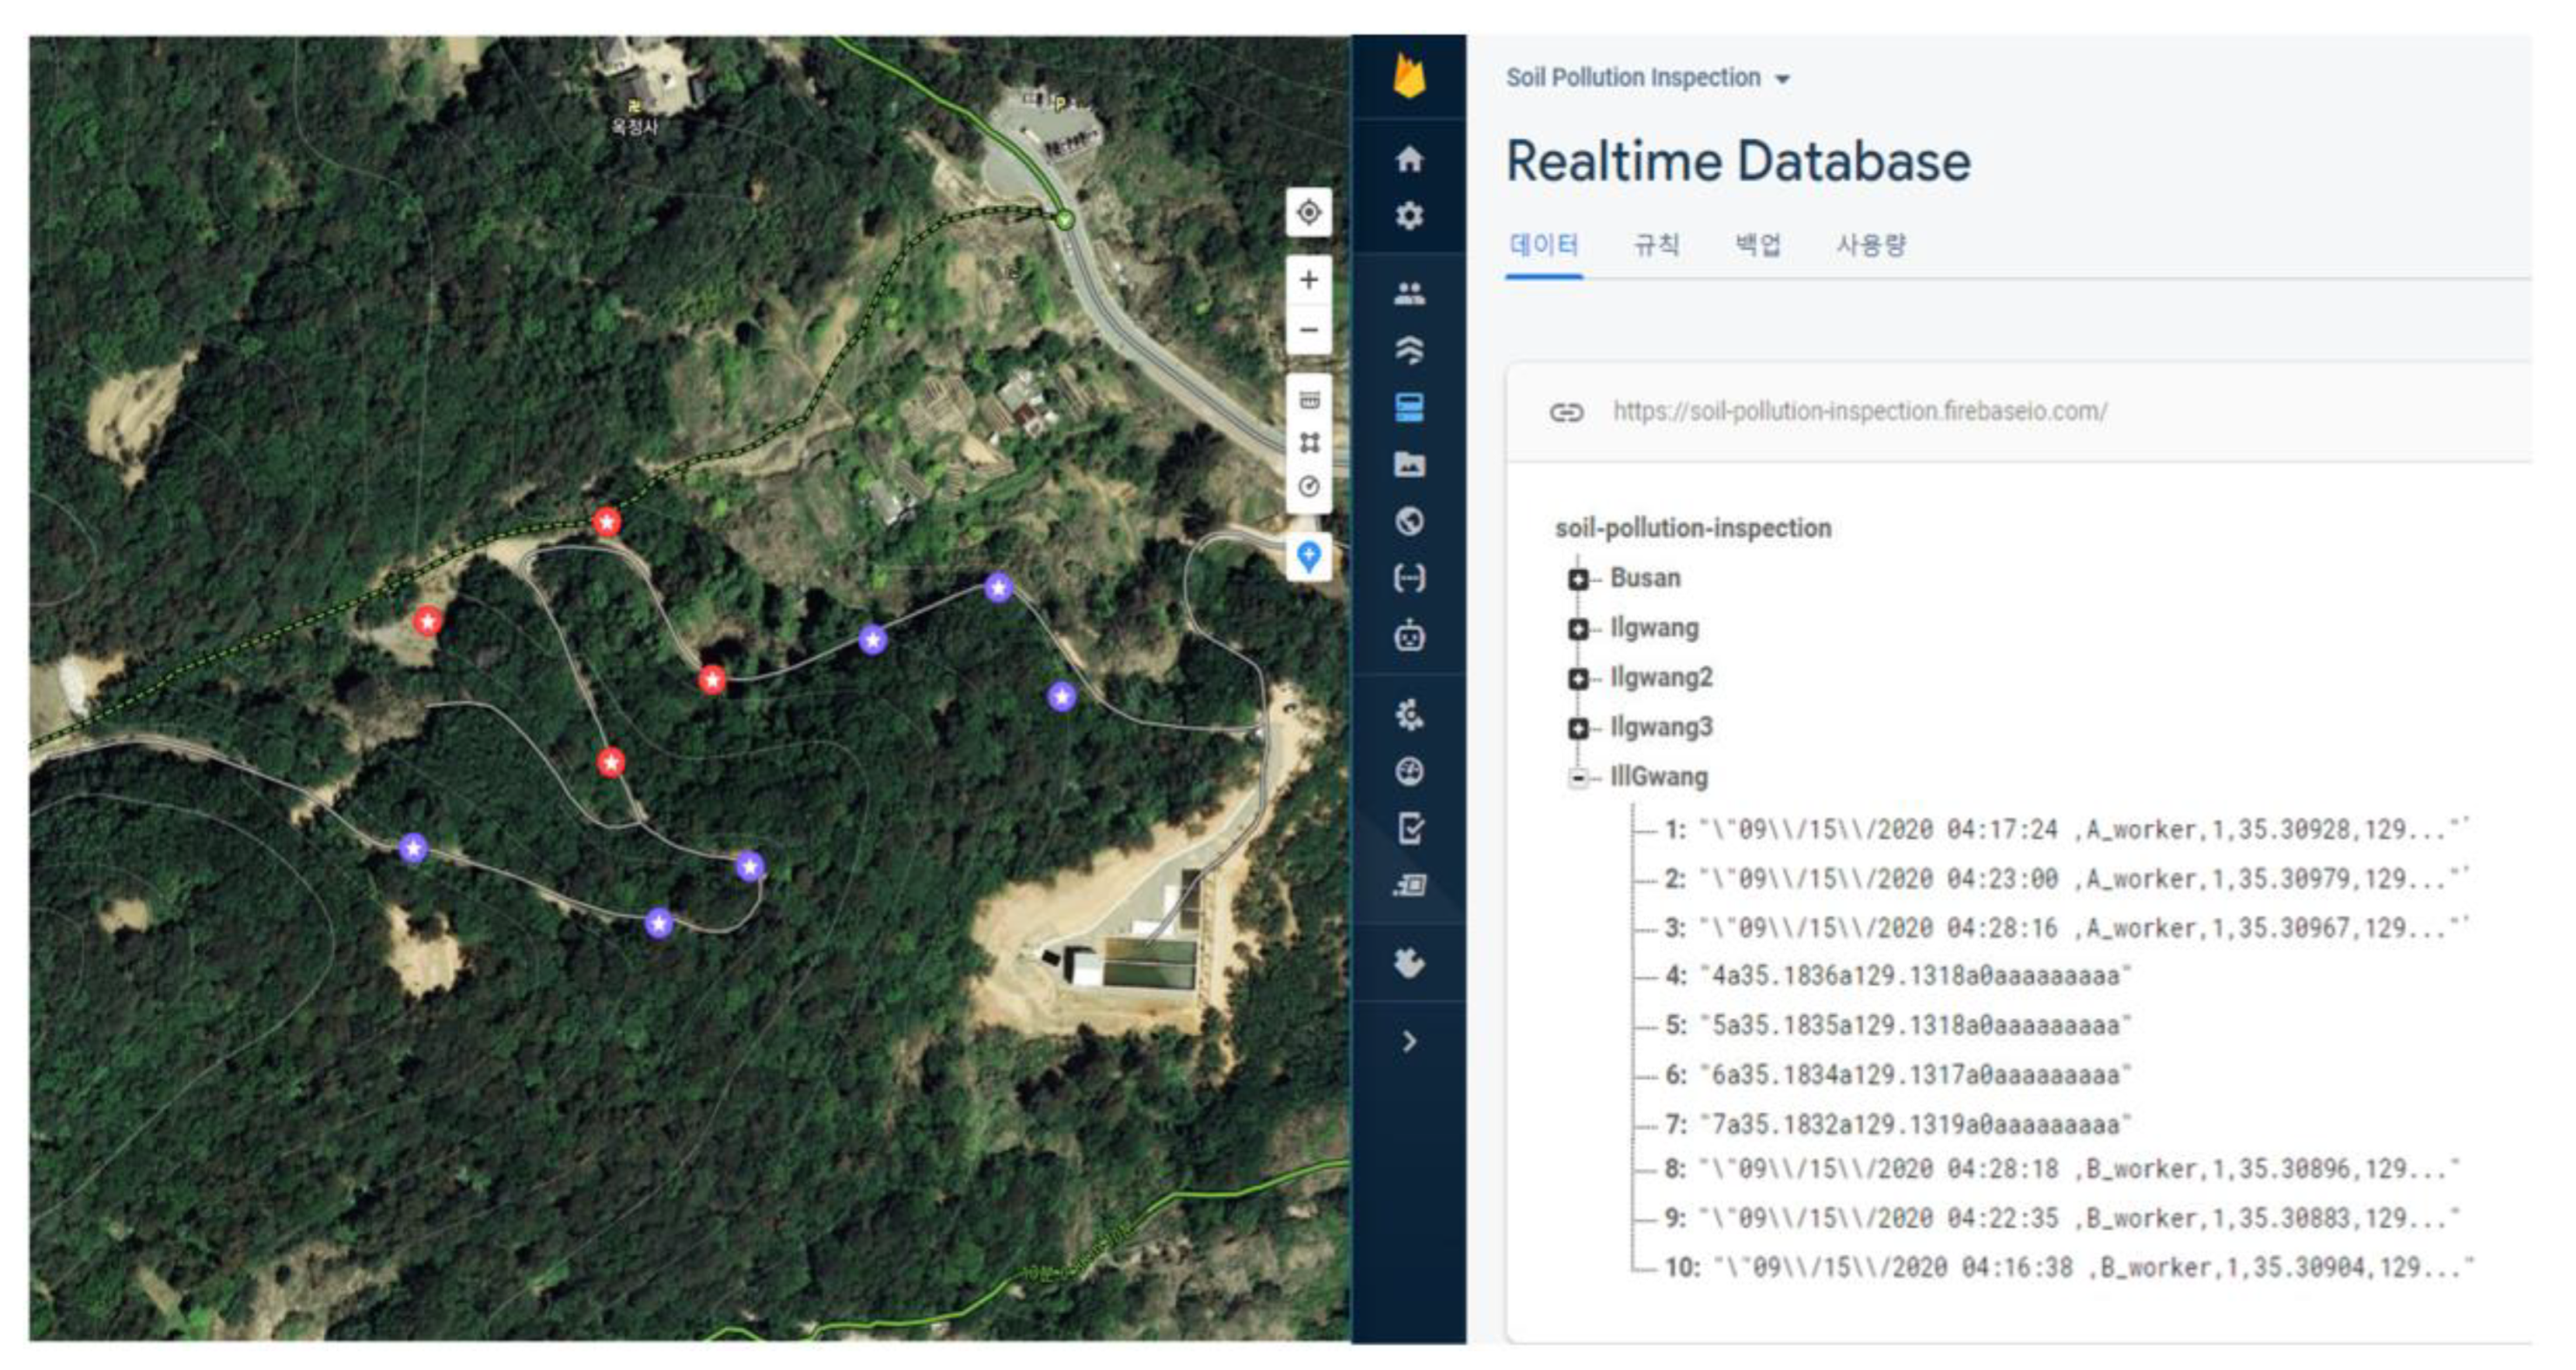
To evaluate the performance of the developed smart glasses-based app, a field test was conducted at an abandoned metal mine (Ilgwang mine) located in Gijang-gun, Busan, Korea. It produced copper, gold, silver, and tungsten in the early 1930s, and was one of the largest mines in Korea, and the fifth largest copper mine in Joseon. After the mine was closed in the 1970s, a high concentration of PTE was confirmed in the soil due to the leakage of wastewater containing a large amount of mullock and heavy metals in a situation where adequate environmental improvement was not performed. In 1999, the Korean government implemented a mine reclamation project to prevent this problem, but soil pollution had already occurred in a wide area including the hiking trail due to the successive surface erosion of tailings and mine wastes. Water flows near the abandoned mine, and there is a village with 47 households currently living at a distance of about 300 m along the waterway. Villagers use this water to manage rice paddy and fields. At the scene, vehicles cannot move, but people have a mobile length. Because this hiking trail is very close to agricultural land as well as waterways, 10 sample points were planned considering the location and dispersion of topographical pollution sources (Figure 5).
Field analysis was conducted on the heavy metal content at 10 points using a portable XRF instrument. The elemental analysis results calculated by the PXRF device may vary depending on the moisture content of the soil. Tolner [13] said that when the moisture content was 10%, 15%, and 20%, respectively, the detected metal elements were about 30% and 30~39% lower. Therefore, in this study, the moisture content of each soil sample was measured using a portable soil moisture meter (PMS-714, Lutron, Taiwan), and PXRF element analysis was performed when the moisture content of the soil sample was less than 10%. Using seedling shovels, surface soil samples were collected from the sampling point to a depth of 10 cm. The collected soil samples were sieved to <2 mm and <850 μm and analyzed using PXRF. The collected sample was scanned for 30 s through the aperture, and after each scan, air was blown to prevent dirt or dust from contaminating the aperture window and keep it clean. The PXRF scan was measured by placing the collected soil sample and PXRF on a parallel vertical line.
In the field, workers wore smart glasses to which the MFWS system could be applied. Through the map of the app, the sample point to be investigated was identified, compared with the current location, and moved to the target point. the measured values were input according to the corresponding elements in the ‘investigation and evaluation’ of the MFWS system for the soil components measured using PXRF. The MFWS system displayed the contamination level according to the Korean soil environment conservation method [12] and calculated the PI value. At the same time that the calculation was completed, the worker uploaded the data to the cloud server.

2.3. Subjective Workload Assessment Method

Workload is a quantitative representation of the level of mental tension a person feels while performing a task within a specific system [55]. Through the workload, the subjective workload of the smart glasses-based MFWS system was evaluated. In field surveys, human performance is one of the factors that affect the accuracy of data. While performing complex tasks, the worker experiences a significant amount of cognitive load [56]. When a worker is required to have a complex job that exceeds the worker’s ability, human performance also decreases. The work efficiency in which human performance decreases can be reduced. Therefore, it is very important to properly design and operate a worker’s job difficulty in order to increase work efficiency.
In this study, the NASA-TLX analysis method, a subjective task difficulty assessment method developed by the National Aeronautics and Space Administration NASA in the early 1980s, was used. Through the NASA-TLX method, it is possible to evaluate which cause of each item has greatly affected work efficiency [46]. The NASA-TLX method includes six items in total: mental demand, physical demand, temporal demand, performance, effort, and frustration level, measured according to the procedure of the steps [46]. For each item, a score between 0 and 100 is allocated, and the upper, median, lower, first, and third quartiles are calculated and compared through a graph. A questionnaire was created for the analysis of work efficiency using the NASA-TLX method. For statistical analysis, the questionnaire included a question about the experience of using wearable devices and smart glasses knowledge. It also includes a brief introduction to the NASA-TLX method, an assessment method, and questions to assess the importance of each of the six items.
The experiment was conducted using 10 students aged 23–27 years (average = 24). Before the start of the experiment, the subjects listened to the explanation of the ICP-AES method, which is the most commonly used method for soil pollution surveys, with visual data. Afterwards, the experimenters learned how to use smart glasses, wearable keyboards, and the PXRF used in the experiment, through practice. After learning and practicing for approximately an hour before the experiment, the experimenters were told about the experimental method and process. The experimental process was as follows. The experimenter, wearing smart glasses, checked the sample point shown on the map, moved to the target point, collected the sample that had completed the pretreatment process, and performed the soil composition investigation through PXRF. All subjects performed this process twice for the same spot. Ten experimenters performed work on different sample spots, and the subjects who completed the work then completed the NASA-TLX questionnaire.

3. Results

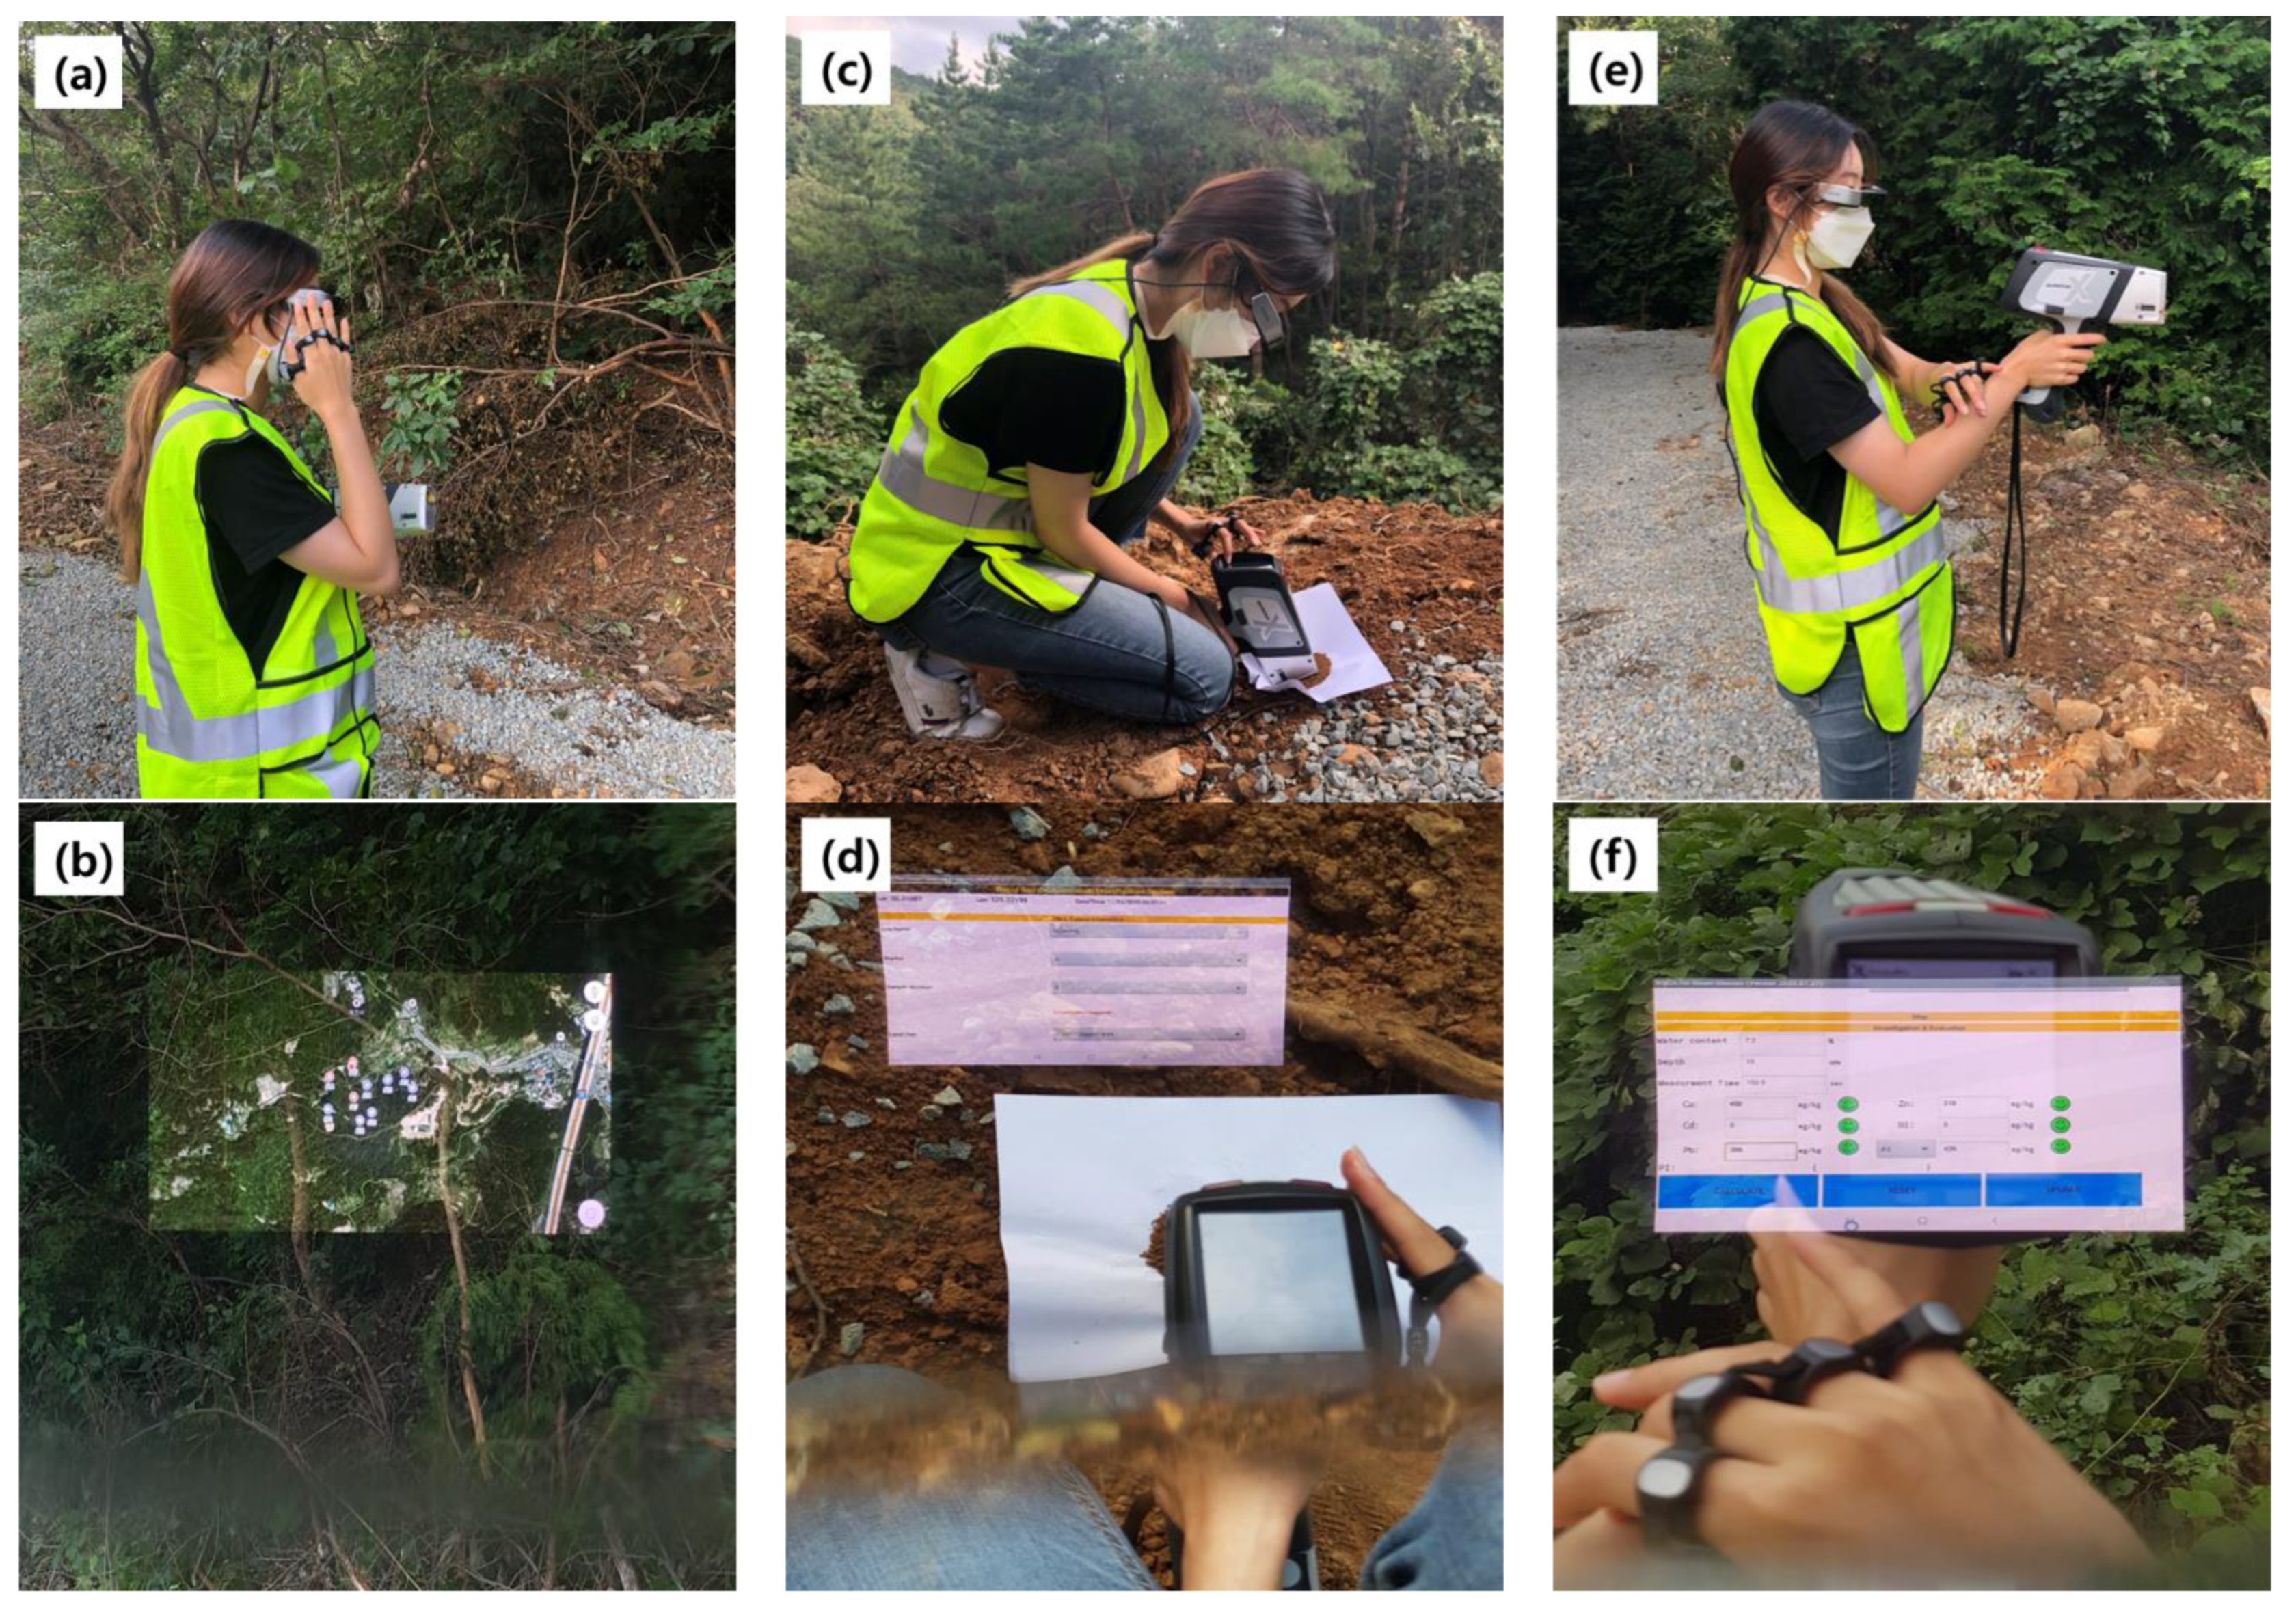
In order to evaluate the performance of the MFWS system, field experiments were conducted at the Ilgwang mine located in Busan, Korea. Figure 6 shows the first-person and third-person appearances of workers according to the work order of the field experiment. Figure 6a shows the worker arriving at the scene wearing smart glasses, and the worker looking at the map where the sample points appear (Figure 6b). Figure 6c,d show the components measured through PXRF of a soil sample that was pretreated. This is how the measured value was entered into the app using a wearable keyboard (Figure 6e,f). As a result of the input, according to the Korean soil environment conservation method [12], the pollution degree of each element is a different image, and the PI calculation result is the pollution degree and color as shown in Figure 7. At the same time as the data were saved, the measured values and contamination levels could be uploaded to the data cloud and checked in real-time. Figure 7 shows the office manager checking the status of work in real-time through data uploaded to the cloud. When the worker who completed the work at the current point moves to the next point, the operator could check whether the survey was completed by selecting the point number on the Figure 6d screen. In other words, it is possible to check real-time data, so that even if several workers work simultaneously, they can change the work flexibly and the manager is easy to grasp.
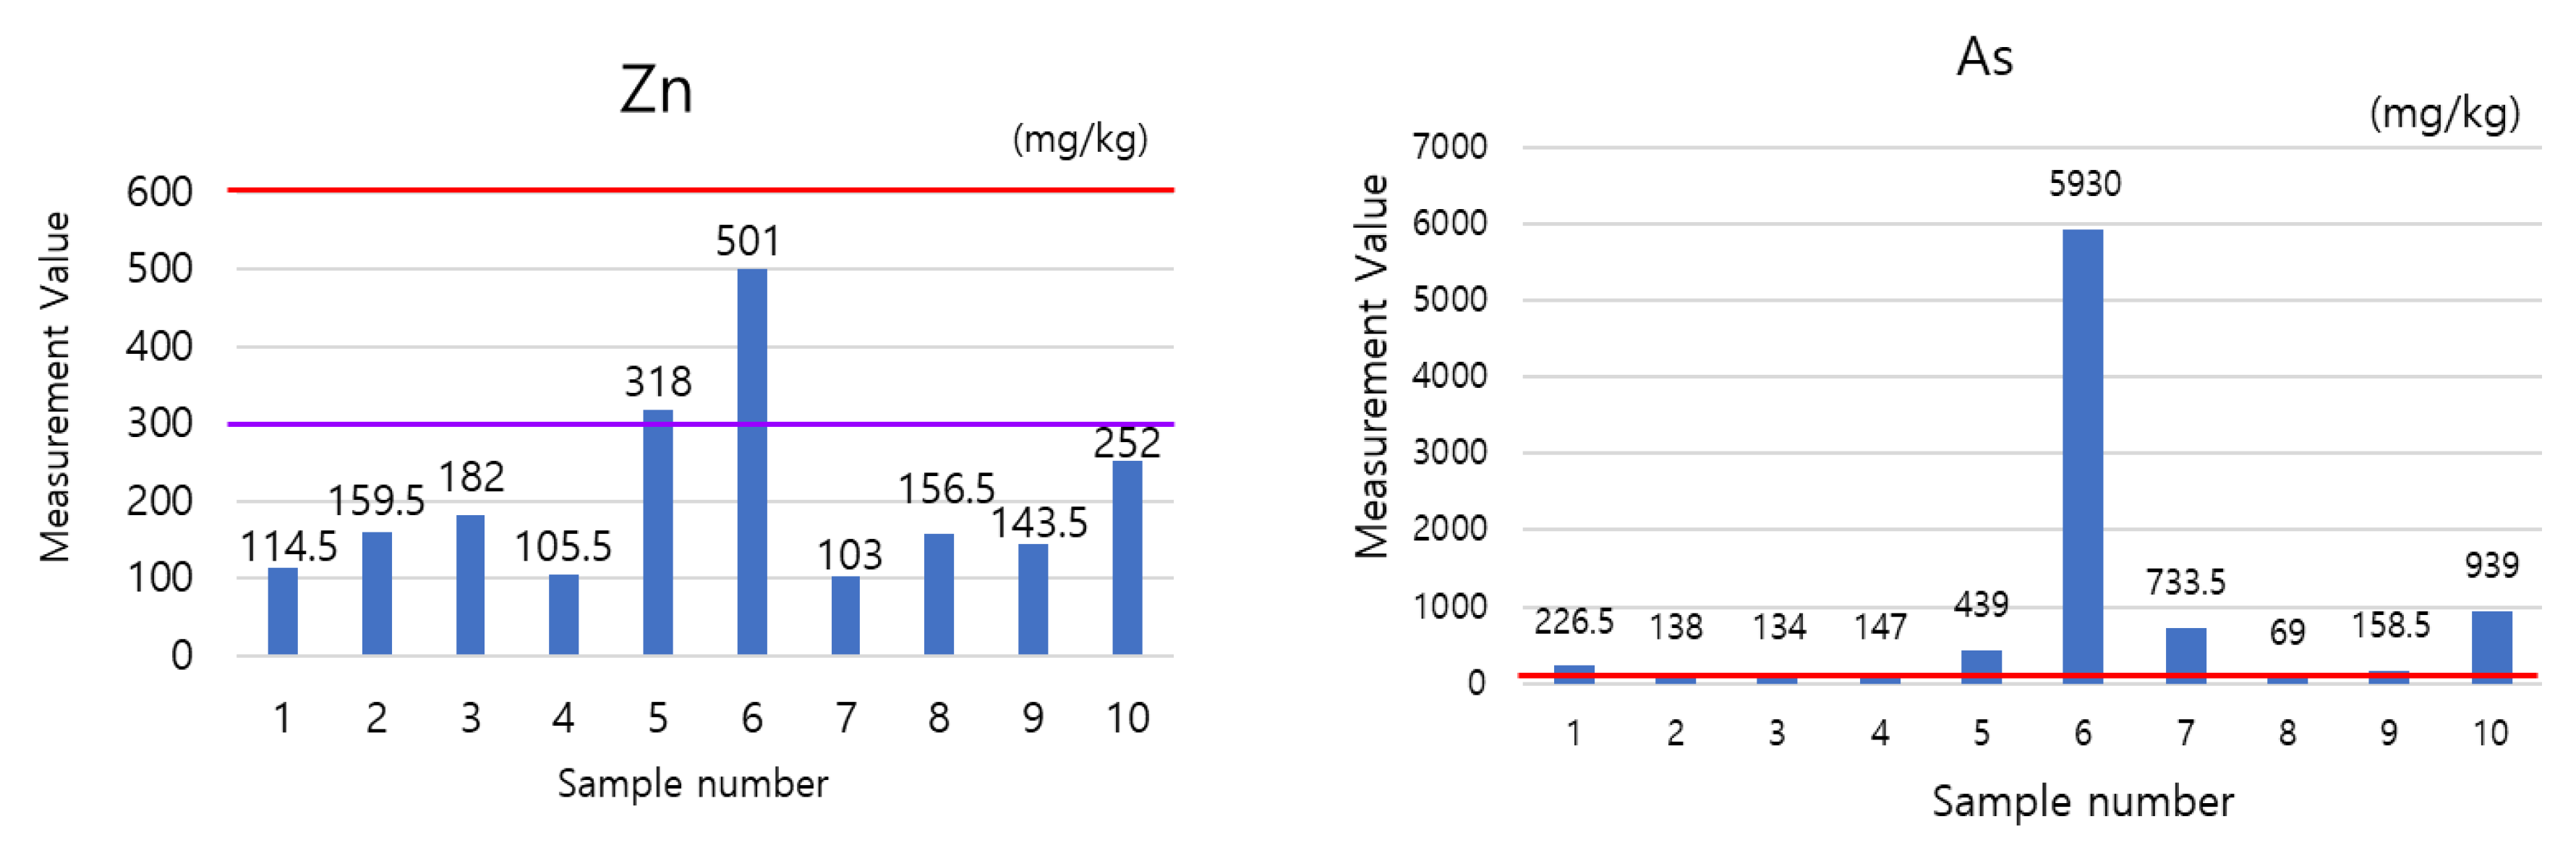
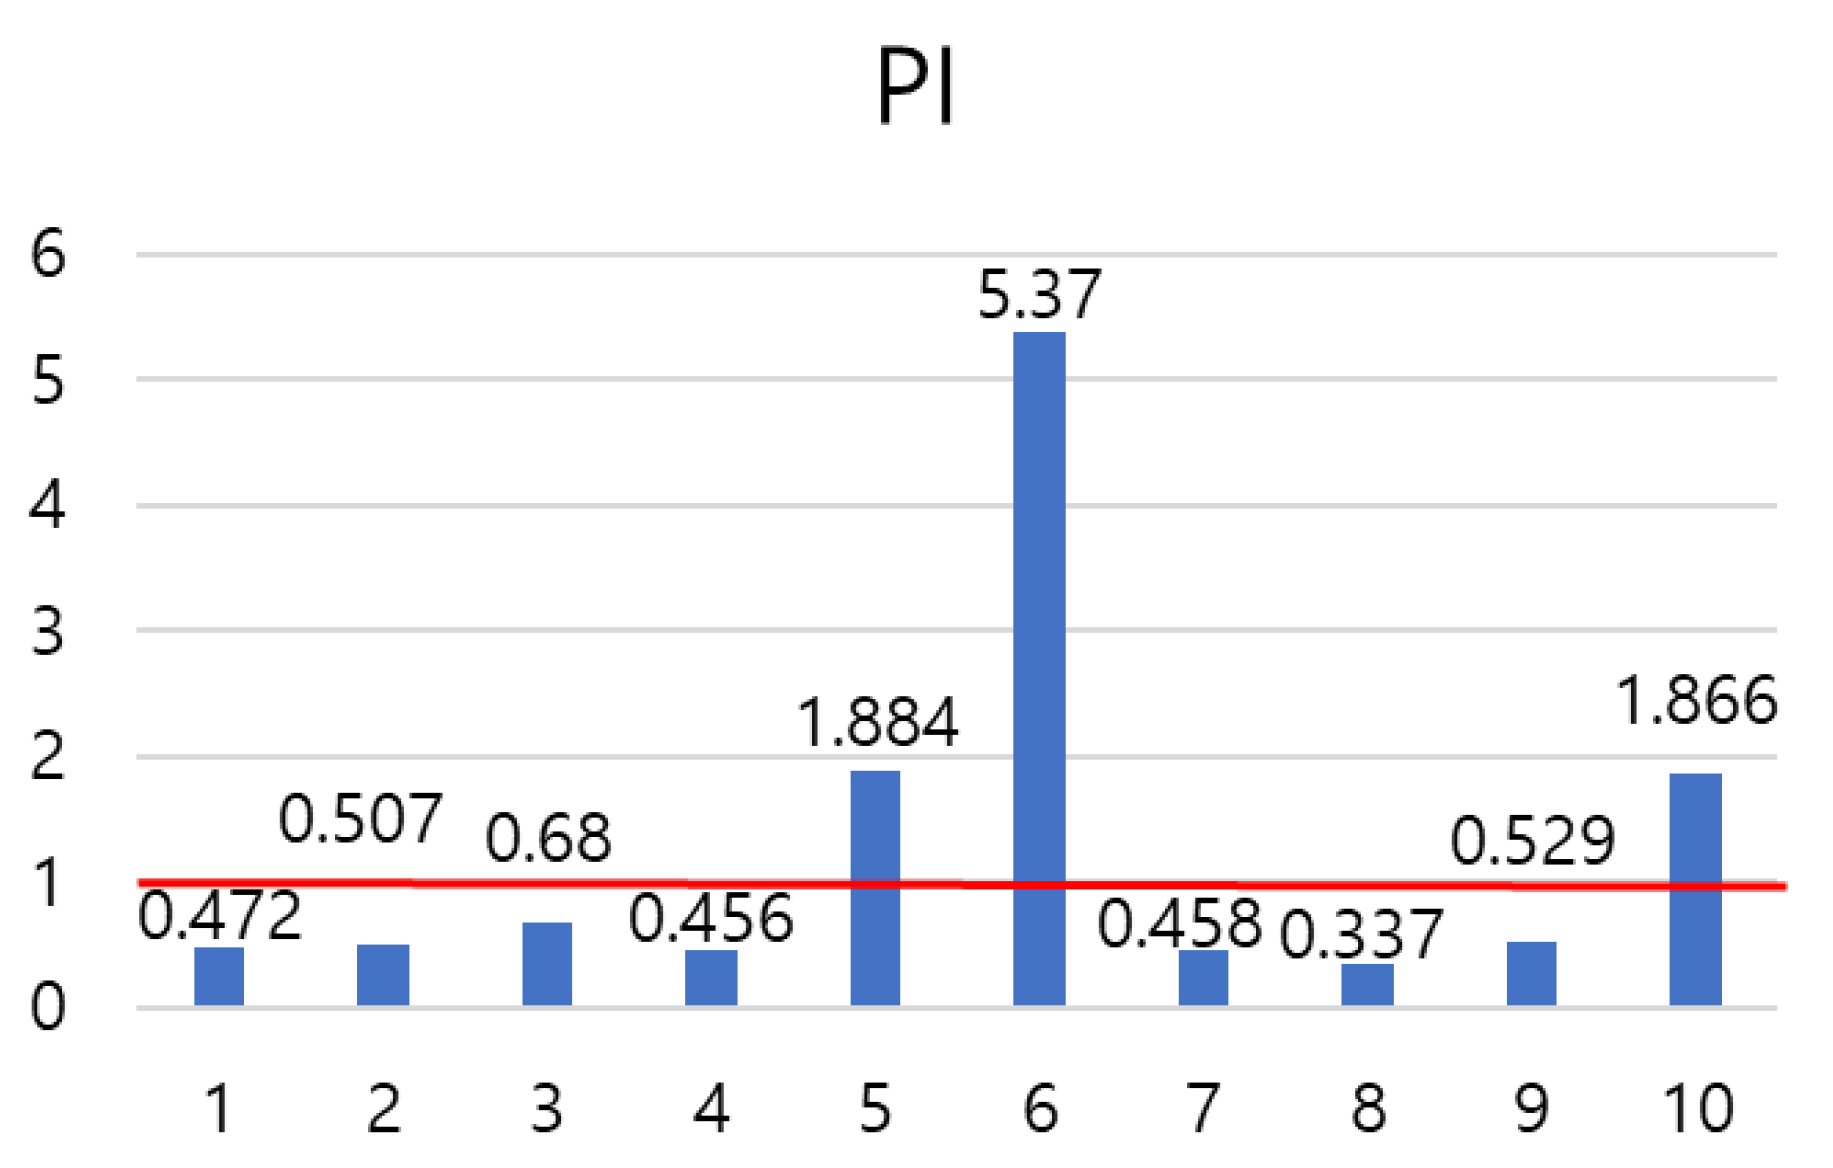
As a result of the measurement, four heavy metals—Cu, Pb, Zn, and As—were detected at all points, and this was expressed as a histogram (Figure 8). The X-axis in Figure 8 represents the number of samples, and the Y-axis means the measurement of each element. The purple and red reference lines drawn on the Y-axis are the lines that mean the soil contamination concern standard and the soil contamination countermeasure standard. Four points (3, 5, 6, and 10) in the graph of Cu exceeded the soil contamination concern standard, and two of them (5, 6) exceeded the soil contamination control standard. In Pb, three points (5, 6, 10) exceeded the criterion for concern, and one point (6) exceeded the criterion for countermeasures. In Zn, two points (5,6) exceeded the criterion of the concern and no point exceeded the criterion for countermeasure. In As, all branches exceeded the concern standard and all points exceeded the countermeasures standard except the eighth point. In particular, the measurement values of the sixth point were Cu 819.5, Pb 1698.5, Zn 501, and As 5930 mg/kg, which exceeded the concern standard for all four elements and considerably exceeded the soil contamination countermeasures standards except Zn. The PI value at point 6 was 5.37, indicating that the pollution level was high (Figure 9). During the field test, the manager who was reviewing the test situation in real-time and the field worker judged this (the value of point 6 being too high) as an error by the operator, and the investigation was re-executed. The result of the re-examination revealed that the actual heavy metal contamination was not a mistake, but a serious contamination. In this case, the worker and manager were able to quickly identify and support decision-making at the site.
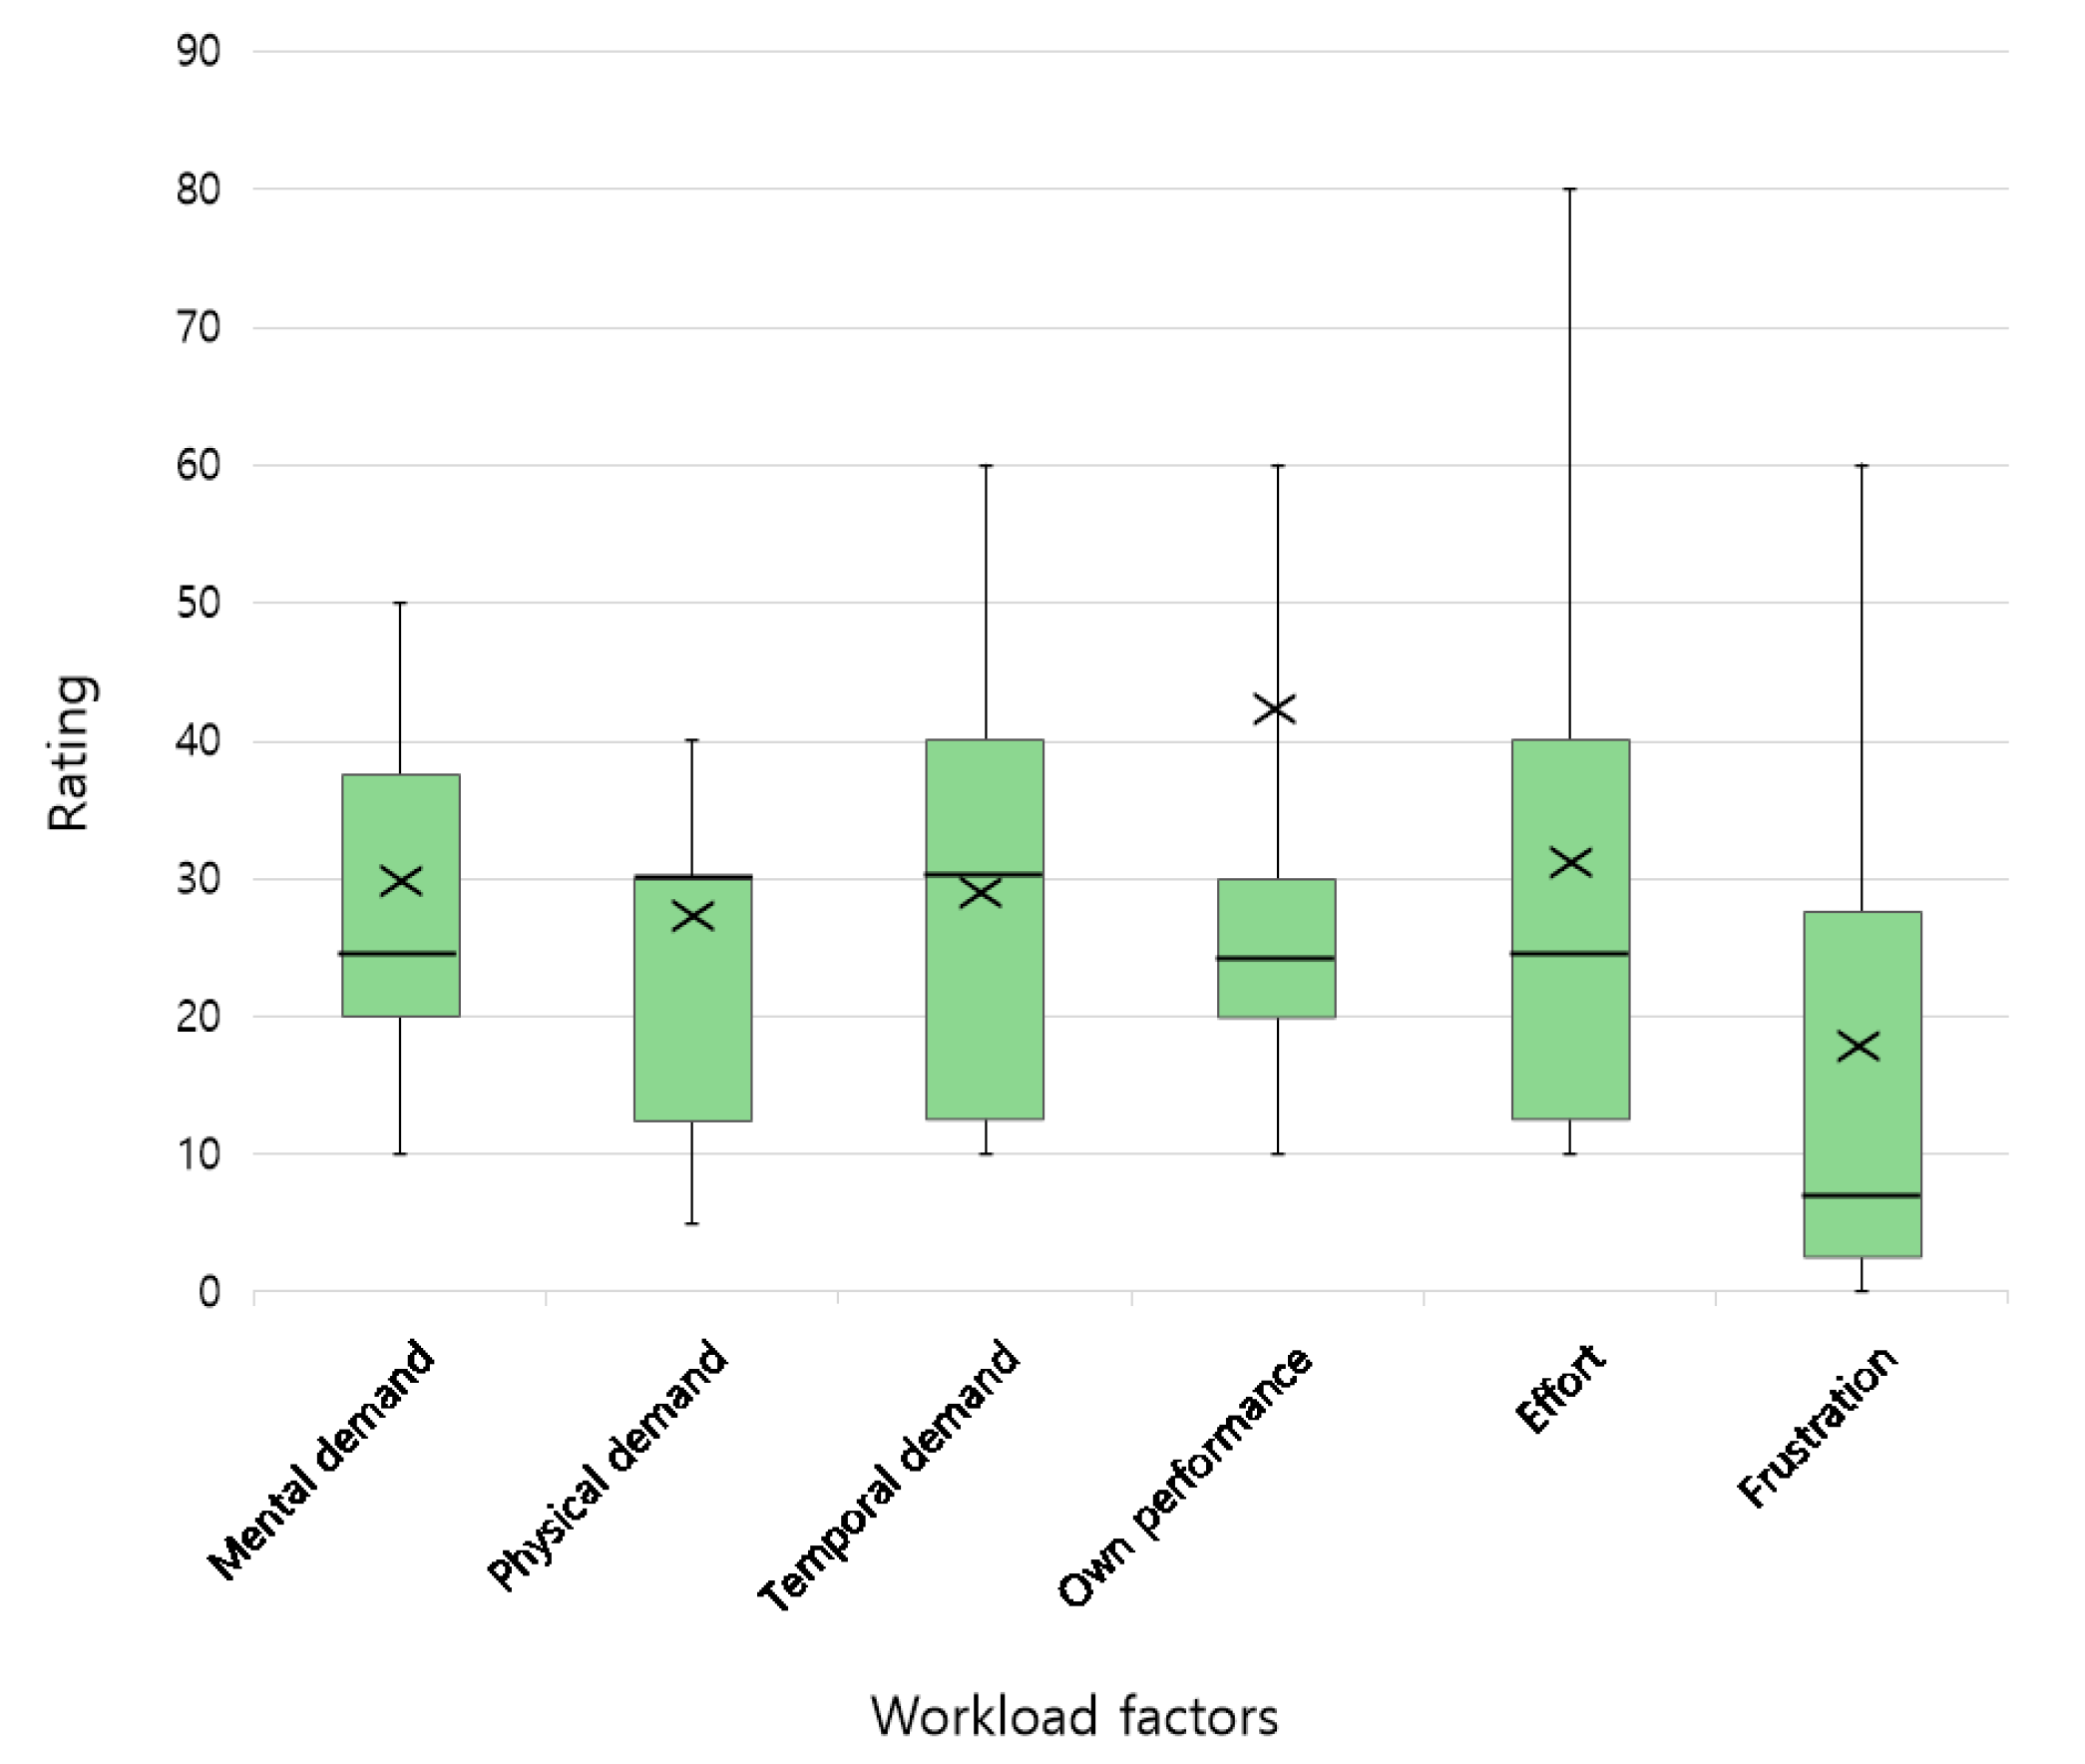
Figure 10 is a box–whisker plot showing the worker’s psychological and physical changes for the MFWS system. In Figure 10, the X-axis represents six evaluation items (mental demand, physical demand, temporal demand, performance, effort, and frustration) and the Y-axis represents the value of each item. The box–whisker graph is composed of a minimum value, first quartile, median value, average value, third quartile value, and maximum value. Of the 10 experimenters, 90% answered that they have knowledge about smart glasses, and 40% of them answered that they had experience using smart glasses. Other factors, except own performance, were mostly low. The reason the own performance was high is that subjects who are not familiar with wearing smart glasses and wearable keyboards felt uncomfortable and felt that their work was delayed a bit. However, wearable keyboards would be solved if the worker became used to using them through practice. On the other hand, the reason frustration was the lowest was that there was no great difficulty in the work by using the MFWS system to conduct a soil contamination investigation that has not been experienced, and the situation and results could be visually confirmed, so that the work could be performed comfortably. The smart glasses helped to increase work efficiency by freeing both hands of the worker, and there was no great difficulty in using them as data could be effectively processed and shared. However, the review of the subjects showed that they felt uncomfortable wearing (slip, weight, wearing smart glasses when wearing existing glasses) smart glasses, so it is necessary to study how to improve them.

4. Discussion

To determine how the smart glasses-based app affected the efficiency of soil contamination survey work, the total time for heavy metal content measurement and data sharing were compared with a previous study [30], which experimented with the same area and PXRF analyzer as in this study. Table 2 presents the total measurement time of heavy metal content using the PXRF analyzer and the total data sharing time with other field workers at 10 points for both studies. In the previous study [30], a notebook PC was used instead of smart glasses.
From the comparison results, we can confirm that the smart glasses-based app has the following advantages for field workers performing soil contamination surveys with a PXRF analyzer. First, smart glasses worn on the face simplify the equipment and the worker can freely use both hands. Therefore, the total measurement time for heavy metal content (including soil sample preparation) at sampling points could be reduced compared to the previous study using a notebook PC. Second, the smart glasses-based app can process and share data with other field workers in real-time. Therefore, the evaluation results and PI values for each heavy metal element could be obtained immediately, and the data sharing time with others could be shortened compared to the previous study. The real-time data sharing enables several field workers to collaborate effectively and facilitates communication between field workers and managers, thereby managing the work plan flexibly according to the situation.
The limitations of the current study to be overcome through future work are as follows. First, the smart glasses-based app can be extended by developing new functions through the Android application programming interface. For example, the stored PI value is processed to show the soil contamination map of the survey area in real-time, so that the worker and the manager can easily check the work status. Second, this study simplified the work by increasing the time efficiency, such as the simultaneous work of this system and sharing of information to grasp roughly the degree of contamination during the preliminary investigation, by combining wearable devices. Therefore, in addition to the wearable keyboard, it is possible to interoperate with various wearable devices and to control smart glasses more easily.

5. Conclusions

In this study, a smart glasses-based application was developed and confirmed to support field workers in the preliminary investigation of soil heavy metal contamination in a mine area using a portable XRF analyzer. The soil composition was measured with the portable XRF analyzer, and the results were entered into the app using a wearable keyboard. According to the standards for heavy metal soil contamination concern and countermeasures prescribed by the Korean Soil Environment Conservation Act, the workers were able to immediately confirm the results of evaluation by heavy metal elements and the results of evaluation of heavy metal pollution index (PI). In addition, as soon as the investigation was completed, the results of the evaluation of heavy metal content and soil contamination for each point could be uploaded to the cloud server in real-time. Therefore, efficient collaboration between field workers and other workers was possible, and communication was smoothed through data sharing between field workers and office managers.
As a result of evaluating the performance of the smart glasses-based application, real-time data sharing is possible, so that two workers can collaborate and proceed, thus shortening the working time. According to the results of the quantitative analysis of six items according to the NASA-TLX standards for 10 subjects of the MFWS system based on smart glasses, they smart glasses were difficult to use, uncomfortably fitted, and the wearable keyboard was unfamiliar. However, it has been proven that the use of smart glasses-based application means that workers are free to use two hands while providing visual information and maintaining high work efficiency by simple data processing.

Author Contributions

Conceptualization, Y.C. and D.K.; methodology, Y.C.; software, Y.C.; validation, D.K.; formal analysis, D.K.; investigation, Y.C.; resources, Y.C.; data curation, D.K.; visualization, D.K.; supervision, Y.C.; project administration, Y.C.; funding acquisition, Y.C.; writing—original draft preparation, Y.C. and D.K.; writing—review and editing, Y.C. All authors have read and agreed to the published version of the manuscript.

Funding

This work was supported by the KETEP grant funded by the Korea Government’s Ministry of Trade, Industry, and Energy (project no. 20206110100030).

Institutional Review Board Statement

This study was approved by IRB of Pukyong National University (1041386-202102-HR-4-02).

Informed Consent Statement

Informed consent was obtained from all subjects involved in the study.

Data Availability Statement

Not applicable.

Conflicts of Interest

The authors declare no conflict of interest.

References

  1. Osher, L.J.; Leclerc, L.; Wiersma, G.B.; Hess, C.T.; Guiseppe, V.E. Heavy Metal Contamination from Historic Mining in Upland Soil and Estuarine Sediments of Egypt Bay, Maine, USA. Estuar. Coast. Shelf Sci. 2006, 70, 169–179. [Google Scholar] [CrossRef]
  2. Thornton, I. Sources and Pathways of Arsenic in South-West England: Health Implications. In Arsenic Exposure and Health; Chapell, W.R., Abernathy, C.O., Cothern, C.R., Eds.; Science and Technology Letters: London, UK, 1994; pp. 61–70. [Google Scholar]
  3. Bolan, N.S.; Adriano, D.C.; Curtin, D. Soil Acidification and Liming Interactions with Nutrientand Heavy Metal Transformationand Bioavailability. In Advances in Agronomy; Elsevier: Amsterdam, The Netherlands, 2003; Volume 78, pp. 215–272. [Google Scholar] [CrossRef]
  4. Li, Z.; Ma, Z.; van der Kuijp, T.J.; Yuan, Z.; Huang, L. A Review of Soil Heavy Metal Pollution from Mines in China: Pollution and Health Risk Assessment. Sci. Total Environ. 2014, 468–469, 843–853. [Google Scholar] [CrossRef] [PubMed]
  5. Navarro, M.C.; Pérez-Sirvent, C.; Martínez-Sánchez, M.J.; Vidal, J.; Tovar, P.J.; Bech, J. Abandoned Mine Sites as a Source of Contamination by Heavy Metals: A Case Study in a Semi-Arid Zone. J. Geochem. Explor. 2008, 96, 183–193. [Google Scholar] [CrossRef]
  6. Bacchetta, G.; Boi, M.E.; Cappai, G.; De Giudici, G.; Piredda, M.; Porceddu, M. Metal Tolerance Capability of Helichrysum Microphyllum Cambess. Subsp. Tyrrhenicum Bacch., Brullo & Giusso: A Candidate for Phytostabilization in Abandoned Mine Sites. Bull. Environ. Contam. Toxicol. 2018, 101, 758–765. [Google Scholar]
  7. Luo, C.; Routh, J.; Dario, M.; Sarkar, S.; Wei, L.; Luo, D.; Liu, Y. Distribution and Mobilization of Heavy Metals at an Acid Mine Drainage Affected Region in South China, a Post-Remediation Study. Sci. Total Environ. 2020, 724, 138122. [Google Scholar] [CrossRef]
  8. Dutta, M.; Islam, N.; Rabha, S.; Narzary, B.; Bordoloi, M.; Saikia, D.; Silva, L.F.O.; Saikia, B.K. Acid Mine Drainage in an Indian High-Sulfur Coal Mining Area: Cytotoxicity Assay and Remediation Study. J. Hazard. Mater. 2020, 389, 121851. [Google Scholar] [CrossRef]
  9. Estimation of Soil Erosion and Sediment Yield from Mine Tailing Dumps Using GIS: A Case Study at the Samgwang Mine, Korea. Available online: https://www.tandfonline.com/doi/full/10.1080/12269328.2012.674426 (accessed on 8 December 2020).
  10. Lee, H.-G.; Choi, Y.-S. A Study on the Soil Contamination (Maps) Using the Handheld XRF and GIS in Abandoned Mining Areas. J. Korean Assoc. Geogr. Inf. Stud. 2014, 17, 195–206. [Google Scholar] [CrossRef]
  11. Radu, T.; Diamond, D. Comparison of Soil Pollution Concentrations Determined Using AAS and Portable XRF Techniques. J. Hazard. Mater. 2009, 171, 1168–1171. [Google Scholar] [CrossRef]
  12. MOE. The Korean Standard Test (KST) Methods for Soils; Gwachun, Korea, 2009. Available online: http://me.go.kr/home/web/board/read.do;jsessionid=gwC0Cs0SjX8ND1XaKdjfp2OC.mehome1?pagerOffset=150&maxPageItems=10&maxIndexPages=10&searchKey=&searchValue=&menuId=&orgCd=&boardId=70036&boardMasterId=515&boardCategoryId=&decorator= (accessed on 8 September 2022). (In Korean).
  13. Tolner, M.; Vaszita, E.; Gruiz, K. On-Site Screening and Monitoring of Pollution by a Field-Portable X-ray Fluorescence Measuring Device. In Proceedings of the Consoil 2010 Conference, Salzburg, Austria, 22–24 September 2010; pp. 22–24. [Google Scholar]
  14. Rouillon, M.; Taylor, M.P. Can Field Portable X-ray Fluorescence (PXRF) Produce High Quality Data for Application in Environmental Contamination Research? Environ. Pollut. 2016, 214, 255–264. [Google Scholar] [CrossRef] [PubMed]
  15. Carr, R.; Zhang, C.; Moles, N.; Harder, M. Identification and Mapping of Heavy Metal Pollution in Soils of a Sports Ground in Galway City, Ireland, Using a Portable XRF Analyser and GIS. Environ. Geochem. Health 2008, 30, 45–52. [Google Scholar] [CrossRef]
  16. Kalnicky, D.J.; Singhvi, R. Field Portable XRF Analysis of Environmental Samples. J. Hazard. Mater. 2001, 83, 93–122. [Google Scholar] [CrossRef]
  17. Baykara, O.; Dogˇru, M. Measurements of Radon and Uranium Concentration in Water and Soil Samples from East Anatolian Active Fault Systems (Turkey). Radiat. Meas. 2006, 41, 362–367. [Google Scholar] [CrossRef]
  18. Clark, S.; Menrath, W.; Chen, M.; Roda, S.; Succop, P. Use of a Field Portable X-ray Fluorescence Analyzer to Determine the Concentration of Lead and Other Metals in Soil Samples. Ann. Agric. Environ. Med. 1999, 6, 27–32. [Google Scholar] [PubMed]
  19. Ene, A.; Bosneaga, A.; Georgescu, L. Determination of Heavy Metals in Soils Using XRF Technique. Rom. J. Phys. 2010, 55, 815–820. [Google Scholar]
  20. Parsons, C.; Grabulosa, E.M.; Pili, E.; Floor, G.H.; Roman-Ross, G.; Charlet, L. Quantification of Trace Arsenic in Soils by Field-Portable X-ray Fluorescence Spectrometry: Considerations for Sample Preparation and Measurement Conditions. J. Hazard. Mater. 2013, 262, 1213–1222. [Google Scholar] [CrossRef]
  21. McComb, J.Q.; Rogers, C.; Han, F.X.; Tchounwou, P.B. Rapid Screening of Heavy Metals and Trace Elements in Environmental Samples Using Portable X-ray Fluorescence Spectrometer, A Comparative Study. Water Air Soil Pollut. 2014, 225, 2169. [Google Scholar] [CrossRef]
  22. Weindorf, D.C.; Zhu, Y.; Chakraborty, S.; Bakr, N.; Huang, B. Use of Portable X-ray Fluorescence Spectrometry for Environmental Quality Assessment of Peri-Urban Agriculture. Environ. Monit. Assess. 2012, 184, 217–227. [Google Scholar] [CrossRef]
  23. Hu, W.; Huang, B.; Weindorf, D.C.; Chen, Y. Metals Analysis of Agricultural Soils via Portable X-ray Fluorescence Spectrometry. Bull. Environ. Contam. Toxicol. 2014, 92, 420–426. [Google Scholar] [CrossRef]
  24. McGladdery, C.; Weindorf, D.C.; Chakraborty, S.; Li, B.; Paulette, L.; Podar, D.; Pearson, D.; Kusi, N.Y.O.; Duda, B. Elemental Assessment of Vegetation via Portable X-ray Fluorescence (PXRF) Spectrometry. J. Environ. Manag. 2018, 210, 210–225. [Google Scholar] [CrossRef]
  25. Tighe, M.; Rogan, G.; Wilson, S.C.; Grave, P.; Kealhofer, L.; Yukongdi, P. The Potential for Portable X-ray Fluorescence Determination of Soil Copper at Ancient Metallurgy Sites, and Considerations beyond Measurements of Total Concentrations. J. Environ. Manag. 2018, 206, 373–382. [Google Scholar] [CrossRef]
  26. Lemiere, B. A Review of PXRF (Field Portable X-ray Fluorescence) Applications for Applied Geochemistry. J. Geochem. Explor. 2018, 188, 350–363. [Google Scholar] [CrossRef] [Green Version]
  27. Rawal, A.; Chakraborty, S.; Li, B.; Lewis, K.; Godoy, M.; Paulette, L.; Weindorf, D.C. Determination of Base Saturation Percentage in Agricultural Soils via Portable X-ray Fluorescence Spectrometer. Geoderma 2019, 338, 375–382. [Google Scholar] [CrossRef]
  28. Andrade, R.; Silva, S.H.G.; Weindorf, D.C.; Chakraborty, S.; Faria, W.M.; Mesquita, L.F.; Guilherme, L.R.G.; Curi, N. Assessing Models for Prediction of Some Soil Chemical Properties from Portable X-ray Fluorescence (PXRF) Spectrometry Data in Brazilian Coastal Plains. Geoderma 2020, 357, 113957. [Google Scholar] [CrossRef]
  29. Karimi, A.; Ahmadi, A.; Partabian, A. Potential Soil Pollution by Heavy Metals in Kurdistan Region, Western Iran: The Impact of Ultramafic Bedrock. Geopersia 2020, 10, 41–52. [Google Scholar]
  30. Suh, J.; Lee, H.; Choi, Y. A Rapid, Accurate, and Efficient Method to Map Heavy Metal-Contaminated Soils of Abandoned Mine Sites Using Converted Portable XRF Data and GIS. Int. J. Environ. Res. Public Health 2016, 13, 1191. [Google Scholar] [CrossRef] [PubMed]
  31. Lee, H.; Choi, Y.; Suh, J.; Lee, S.-H. Mapping Copper and Lead Concentrations at Abandoned Mine Areas Using Element Analysis Data from ICP–AES and Portable XRF Instruments: A Comparative Study. Int. J. Environ. Res. Public Health 2016, 13, 384. [Google Scholar] [CrossRef]
  32. Kim, S.-M.; Choi, Y. Assessing Statistically Significant Heavy-Metal Concentrations in Abandoned Mine Areas via Hot Spot Analysis of Portable XRF Data. Int. J. Environ. Res. Public Health 2017, 14, 654. [Google Scholar] [CrossRef]
  33. Mitrasinovic, S.; Camacho, E.; Trivedi, N.; Logan, J.; Campbell, C.; Zilinyi, R.; Lieber, B.; Bruce, E.; Taylor, B.; Martineau, D. Clinical and Surgical Applications of Smart Glasses. Technol. Health Care 2015, 23, 381–401. [Google Scholar] [CrossRef]
  34. Syberfeldt, A.; Danielsson, O.; Gustavsson, P. Augmented Reality Smart Glasses in the Smart Factory: Product Evaluation Guidelines and Review of Available Products. IEEE Access 2017, 5, 9118–9130. [Google Scholar] [CrossRef]
  35. Kalantari, M.; Rauschnabel, P. Exploring the Early Adopters of Augmented Reality Smart Glasses: The Case of Microsoft HoloLens. In Augmented Reality and Virtual Reality; Springer: Berlin/Heidelberg, Germany, 2018; pp. 229–245. [Google Scholar]
  36. Danielsson, O.; Holm, M.; Syberfeldt, A. Augmented Reality Smart Glasses for Operators in Production: Survey of Relevant Categories for Supporting Operators. Procedia CIRP 2020, 93, 1298–1303. [Google Scholar] [CrossRef]
  37. Meza-de-Luna, M.E.; Terven, J.R.; Raducanu, B.; Salas, J. A Social-Aware Assistant to Support Individuals with Visual Impairments during Social Interaction: A Systematic Requirements Analysis. Int. J. Hum.-Comput. Stud. 2019, 122, 50–60. [Google Scholar] [CrossRef]
  38. Machado, E.; Carrillo, I.; Saldana, D.; Chen, F.; Chen, L. An Assistive Augmented Reality-Based Smartglasses Solution for Individuals with Autism Spectrum Disorder. In Proceedings of the 2019 IEEE International Conference on Dependable, Autonomic and Secure Computing, International Conference on Pervasive Intelligence and Computing, International Conference on Cloud and Big Data Computing, Intl Conf on Cyber Science and Technology Congress (DASC/PiCom/CBDCom/CyberSciTech), Fukuoka, Japan, 5–8 August 2019; IEEE: Piscataway, NJ, USA, 2019; pp. 245–249. [Google Scholar]
  39. Kirks, T.; Jost, J.; Uhlott, T.; Püth, J.; Jakobs, M. Evaluation of the Application of Smart Glasses for Decentralized Control Systems in Logistics. In Proceedings of the 2019 IEEE Intelligent Transportation Systems Conference (ITSC), Auckland, New Zealand, 27–30 October 2019; IEEE: Piscataway, NJ, USA, 2019; pp. 4470–4476. [Google Scholar]
  40. Caria, M.; Todde, G.; Sara, G.; Piras, M.; Pazzona, A. Performance and Usability of Smartglasses for Augmented Reality in Precision Livestock Farming Operations. Appl. Sci. 2020, 10, 2318. [Google Scholar] [CrossRef] [Green Version]
  41. Spitzer, M.; Nanic, I.; Ebner, M. Distance Learning and Assistance Using Smart Glasses. Educ. Sci. 2018, 8, 21. [Google Scholar] [CrossRef]
  42. Han, D.-I.D.; Tom Dieck, M.C.; Jung, T. Augmented Reality Smart Glasses (ARSG) Visitor Adoption in Cultural Tourism. Leis. Stud. 2019, 38, 618–633. [Google Scholar] [CrossRef]
  43. Moghal, A.A.B.; Lateef, M.A.; Mohammed, S.A.S.; Lemboye, K.; Chittoori, B.C.S.; Almajed, A. Efficacy of Enzymatically Induced Calcium Carbonate Precipitation in the Retention of Heavy Metal Ions. Sustainability 2020, 12, 7019. [Google Scholar] [CrossRef]
  44. Moghal, A.A.B.; Lateef, M.A.; Abu Sayeed Mohammed, S.; Ahmad, M.; Usman, A.R.A.; Almajed, A. Heavy Metal Immobilization Studies and Enhancement in Geotechnical Properties of Cohesive Soils by EICP Technique. Appl. Sci. 2020, 10, 7568. [Google Scholar] [CrossRef]
  45. Abu Sayeed Mohammed, S.; Moghal, A.A.B.; Sanaulla, P.F.; Kotresha, K.; Reddy, H.P. Cadmium Fixation Studies on Contaminated Soils Using Nano Calcium Silicate—Treatment Strategy. Geotech. Front. 2017, 276. [Google Scholar] [CrossRef]
  46. NASA Task Load Index (TLX) v.1.0 Paper and Pencil Package. Available online: https://humansystems.arc.nasa.gov/groups/tlx/downloads/TLX_pappen_manual.pdf (accessed on 21 January 2020).
  47. Young, K.E.; Evans, C.A.; Hodges, K.V.; Bleacher, J.E.; Graff, T.G. A Review of the Handheld X-ray Fluorescence Spectrometer as a Tool for Field Geologic Investigations on Earth and in Planetary Surface Exploration. Appl. Geochem. 2016, 72, 77–87. [Google Scholar] [CrossRef]
  48. Epson Home Page. Available online: https://tech.moverio.epson.com/en/bt-350 (accessed on 14 August 2020).
  49. TAP Systems. Available online: https://www.tapwithus.com/how-tap-works (accessed on 18 August 2020).
  50. Choi, Y.; Kim, H.; Suh, J. Development of a Smartphone Application to Investigate Unsurfaced Road Conditions in Mines. Tunn. Undergr. Space 2018, 28, 555–568. [Google Scholar]
  51. MIT App Inventor. Available online: https://appinventor.mit.edu/ (accessed on 23 March 2020).
  52. Kloke, A. Contents of Arsenic, Cadmium, Chromium, Fluorine, Lead, Mercury and Nickel in Plants Grown on Contaminated Soil. In Proceedings of the UN-ECE Symposium, Genova, Switzerland, 13–15 November 1979. [Google Scholar]
  53. Gankhurel, B.; Fukushi, K.; Akehi, A.; Takahashi, Y.; Zhao, X.; Kawasaki, K. Comparison of Chemical Speciation of Lead, Arsenic, and Cadmium in Contaminated Soils from a Historical Mining Site: Implications for Different Mobilities of Heavy Metals. ACS Earth Space Chem. 2020, 4, 1064–1077. [Google Scholar] [CrossRef]
  54. Firebase. Available online: https://firebase.google.com/docs/database/security?hl=ko (accessed on 14 August 2020).
  55. Cain, B. A Review of the Mental Workload Literature; Defence Research and Development Toronto (Canada): Toronto, ON, Canada, 2007; pp. 1–35. [Google Scholar]
  56. Richer, G.; Gruber, H.; Friesenbichler, H.; Uscilowsk, A.; Jancurova, L.; Konova, D. Mental Workload: Identification and Evaluation of Hazards; Taking Measures. In Guide for Risk Assessment in Small and Medium Enterprises; The International Social Security Association (ISSA): Genova, Switzerland, 2008; pp. 1–25. [Google Scholar]
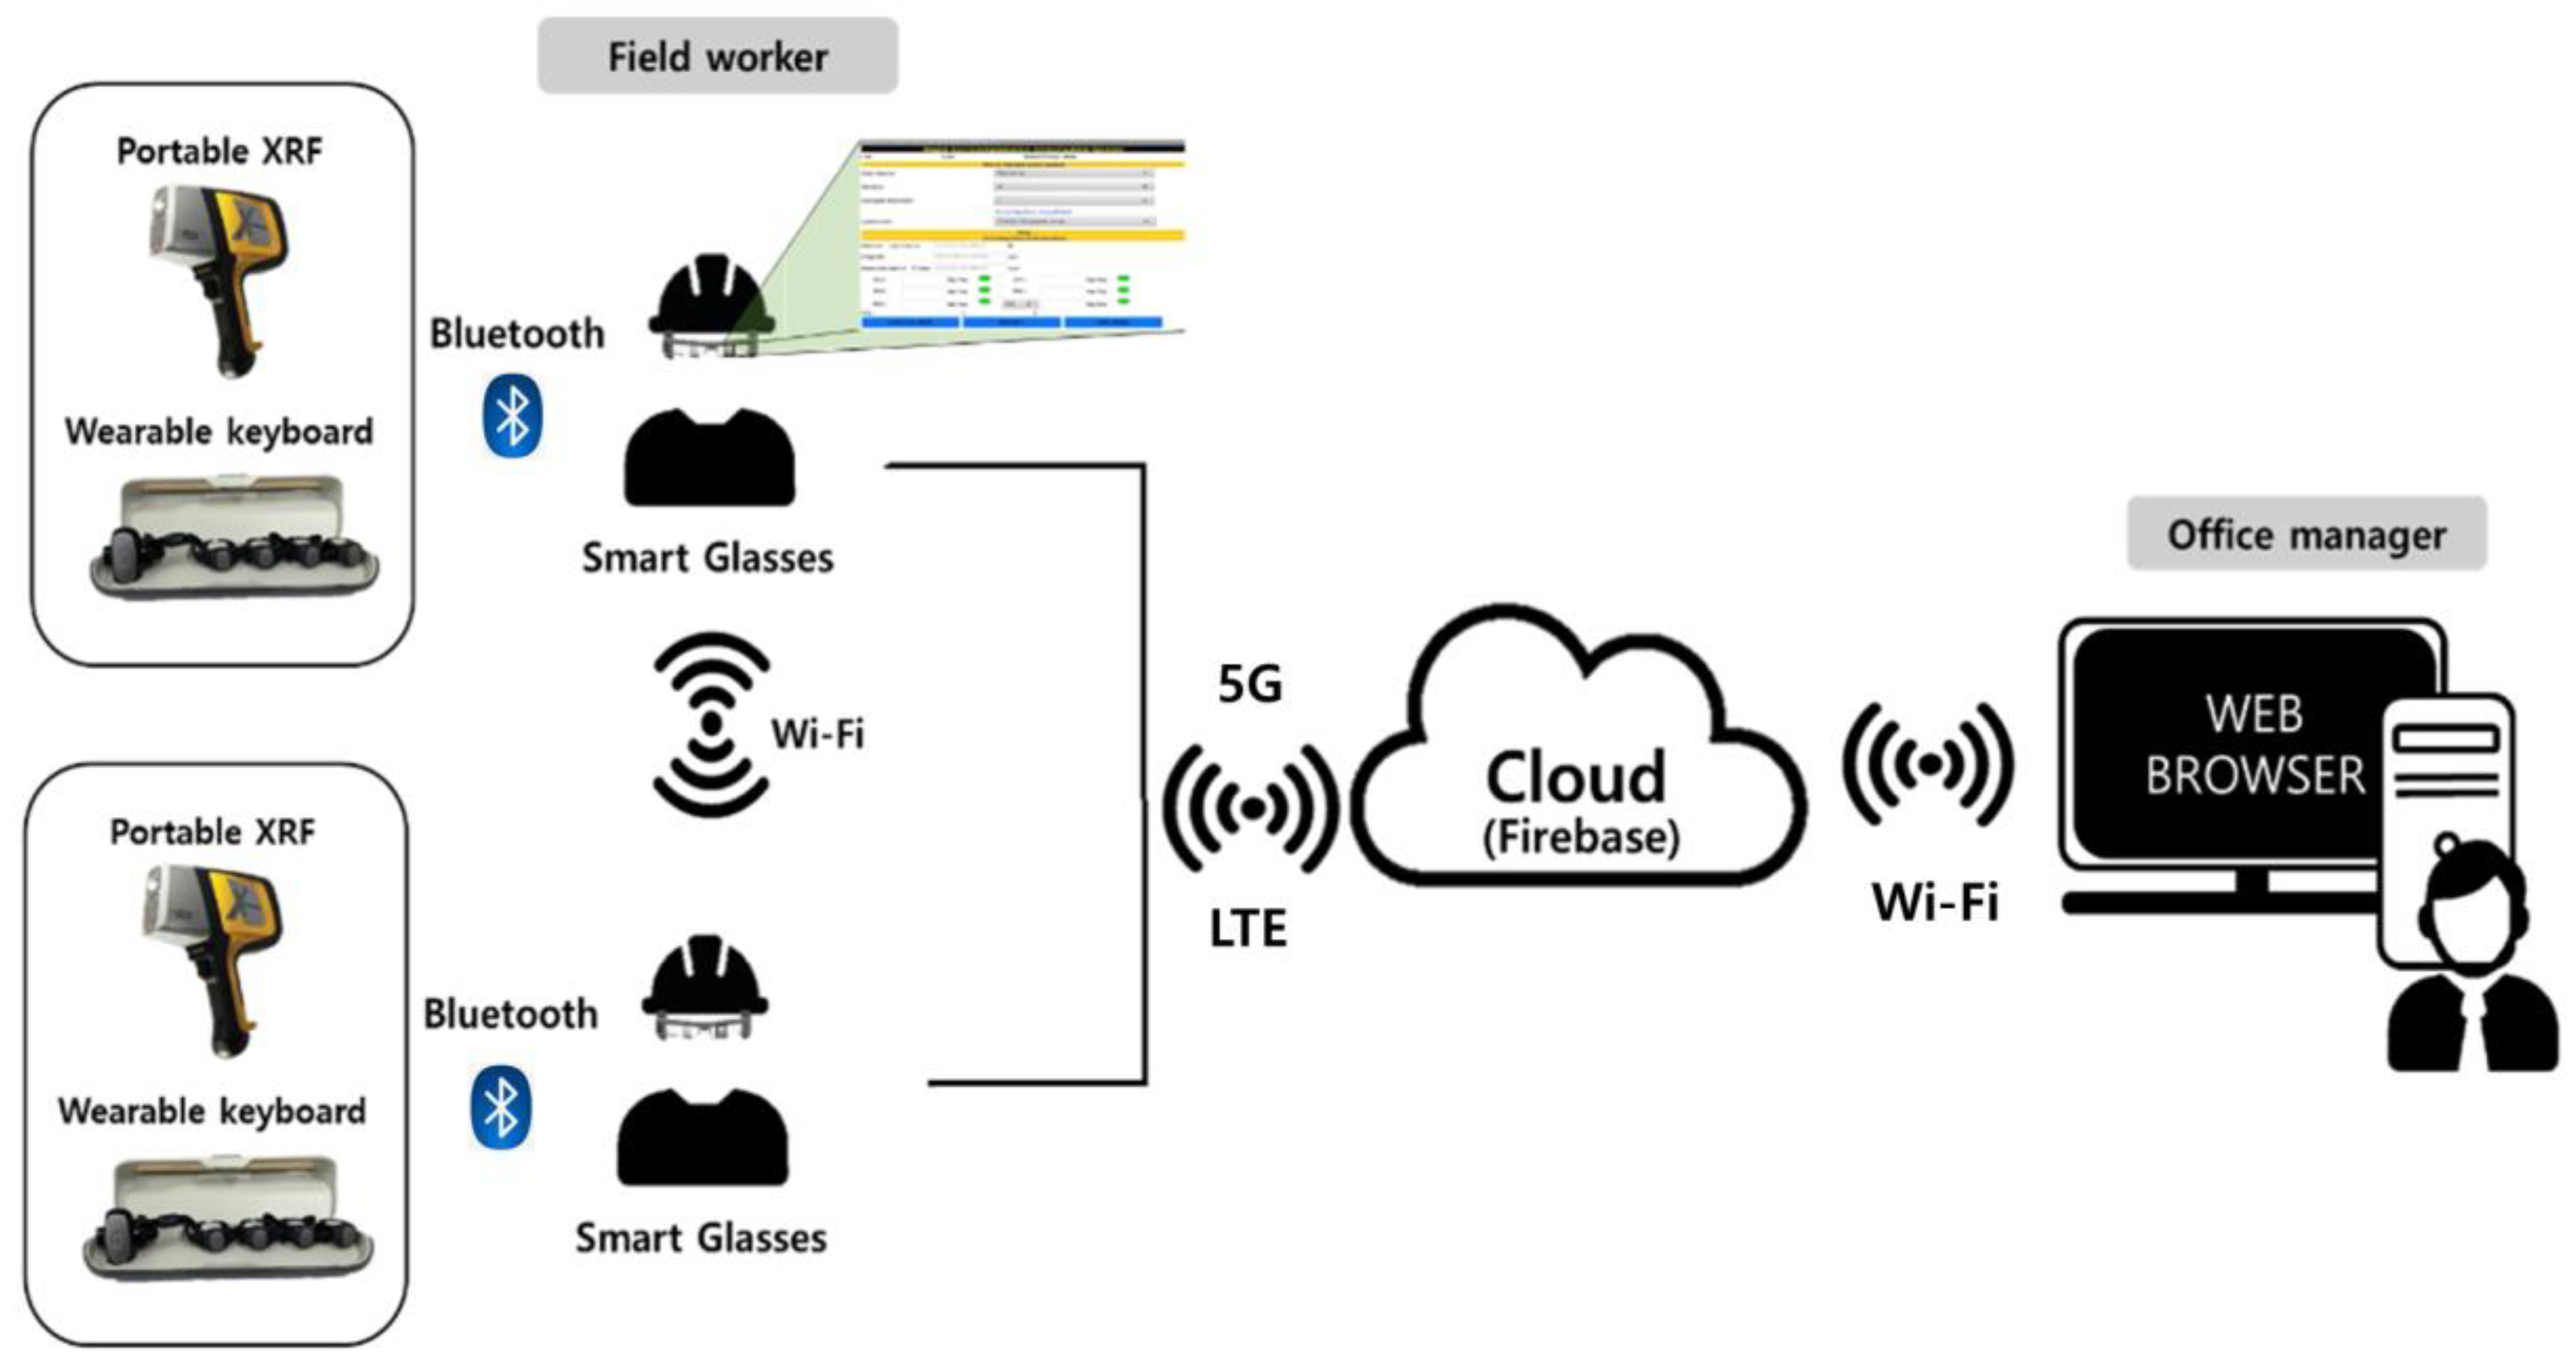
Figure 1. Overall structure of smart glasses-based mine field worker support (MFWS) system.
Sustainability 14 12370 g001
Figure 2. Plot showing correlation between transformed PXRF analysis values and ICP-AES analysis values for the five validation samples [30].
Sustainability 14 12370 g002
Figure 3. Image of smart glasses and data input device: (a) Smart glasses; (b) wearable keyboard.
Sustainability 14 12370 g003
Figure 4. Image of smart glasses-based apps developed to support field workers.
Sustainability 14 12370 g004
Figure 5. Study area with sampling point: aerial view of the IlGwang mine, Busan, Korea (Korea National Geographic Information Institute).
Sustainability 14 12370 g005
Figure 6. View of mine field worker with handheld instrument and the MFWS system. (a) Worker wearing a smart glasses; (b) map displayed on smart glasses screen; (c) worker performing a measurement with both hands; (d) point of view of a worker performing measurement with both hands; (e) worker entering data using a wearable keyboard; and (f) point of view of a worker entering data.
Sustainability 14 12370 g006
Figure 7. Checking real-time data according to the completion of the task shown to the manager.
Sustainability 14 12370 g007
Figure 8. Histogram of the amount of heavy metal element by sample point. Measured value by sampling point for Cu, Pb, Zn, and As resultant value.
Sustainability 14 12370 g008aSustainability 14 12370 g008b
Figure 9. Value of pollution index (PI) for each point.
Sustainability 14 12370 g009
Figure 10. Results of rating six workload factors of NASA-TLX.
Sustainability 14 12370 g010
Table 1. Heavy metal contamination tolerance level (mg/kg).
Heavy metalCuCdPbZnNiAsCr
Permissible limit10031003005020100
Table 2. Comparison of heavy metal content measurement and data sharing time without and with smart glasses-based application.
CaseTotal Measurement Time of Heavy Metal Content
(Including Soil Sample Preparation, min)
Total Data Sharing Time (min)
Previous study without smart glasses-based application57.526.8
This study with smart glasses-based application35.02.4
Publisher’s Note: MDPI stays neutral with regard to jurisdictional claims in published maps and institutional affiliations.