Article

Elastic Wave Denoising in the Case of Bender Elements Type Piezoelectric Transducers

1
School of Civil Engineering, Xijing University, Xi’an 710123, China
2
Quanzhou Institute of Equipment Manufacturing Haixi Research Institute, Chinese Academy of Sciences, Quanzhou 362000, China
*
Author to whom correspondence should be addressed.
Sustainability 2022, 14(19), 12605; https://doi.org/10.3390/su141912605
Submission received: 19 August 2022 / Revised: 30 September 2022 / Accepted: 2 October 2022 / Published: 4 October 2022
(This article belongs to the Section Sustainable Engineering and Science)

Abstract

:
The accuracy of the wave signal is key to studying physical information inside the soil using bender-element-type piezoelectric transducers. There is too much noise during the elastic wave signal collected by bender elements, which is caused by factors such as fluid current and infiltration. At present, the mainstream method is the superposition method, which superposes multiple tested waveform data to obtain a clear waveform. However, the superposition method is limited by the number of signals during the collection, and the denoised waveform still contains high-frequency noise. A combination method combining superposition and the wavelet threshold is proposed in this work to improve the accuracy of the elastic waveform signal. Three different signal denoising simulation tests and one model box test are conducted to verify the method’s feasibility from two aspects. The results show that the combined method can effectively remove high-frequency noise and display clear waveforms based on overcoming the number of signals. This work provides a new means of signal denoising in the case of studying soil properties by bender-element-type piezoelectric transducers.

1. Introduction

Bender elements have been used widely [1,2] due to one of their great advantages, which is that they can be incorporated into existing apparatuses [3]. There is a large amount of physical information about internal soil that can be determined by an elastic wave signal [4,5,6,7]. Many researchers have worked with bender-element-type piezoelectric transducers to collect wave signals to characterize soil properties, which are instrumental in soil [8]. The bender-element-type piezoelectric transducers have been rapidly developed for the safety of civil engineering structures and soil slopes [9,10,11]. However, it has always been a challenging task to analyze the wave signals collected by the bending elements.
There is some noise in the elastic wave signal received by bender-element-type piezoelectric transducers due to the interference of many factors [12,13,14,15]. These high-frequency noises usually lead to errors in analyzing information such as wave velocity, amplitude, and frequency. Yulong Chen and Irfan et al. have studied the change in the elastic wave velocity during rainfall-induced soil slope instability by the bender-element-type piezoelectric transducers to collect elastic wave signals [16,17]. During this continuous dynamic monitoring, they superimposed the waveform data from 20 signals to obtain a clear waveform for further analysis of the elastic wave [18,19]. Superimposed denoising (SD), averaging multiple measurement waveforms to obtain a clear waveform, avoids the accident with one individual signal. However, this method is limited by the number of elastic waves. When the Signal–Noise Ratio (SNR) is too high, SD cannot effectively remove high-frequency noise and obtain a smooth waveform. Thus, it is necessary to develop more effective denoising techniques for the elastic wave signals collected by the bender elements to ensure the reliability of the data analysis.
Fourier transform [20], Wavelet transform [21,22], Empirical Modal Decomposition [23], etc., are common contemporary methods for signal analysis. Fourier transform was the first signal analysis tool developed, and researchers have implemented many signals or image denoising applications based on it [24,25,26]. However, the Fourier transform has natural limitations for working with non-smooth signals [27]. It is better at general frequency analysis of a signal segment and has shortfalls in the time domain. Most smooth signals are artificially created, and many natural signals are almost always non-smooth, so the Fourier transform noise reduction of dynamically collected elastic wave signals is obviously out of touch. The wavelet transform is a signal resolution tool developed based on the Fourier transform [28]. Compared with the Fourier transform, the wavelet transform reveals the detailed changes of the signal through the scaling of the local basis [29], and has a mature theoretical system and noise reduction method.
The wavelet threshold denoising (WTD) proposed by Donoho and Johnstone in 1992 is of great significance in signal denoising [30,31]. The WTD is the most widely used denoising method because it is easy to calculate and can remove noise to a large extent while retaining the characteristics of singular information of the original signal [32,33]. Yangfeng Zhang et al. proposed a WTD method with an Artificial Neural Network (ANN)-optimized threshold for vibration sensor data in 2019, which has an ideal filtering effect on vibration sensor signals [34]. Jiangchao Liu and Wenhua Gao combined WTD and the Hilbert–Huang Transform (HHT) to denoise blast vibration signals in 2020. The results showed that the wavelet threshold method could effectively eliminate the high-frequency noise in blast vibration signals and retain the information carried by the vibration signals themselves [35]. Soltani and Shahrtash combined a Decision Tree (DT) and WTD to denoise partial discharge (PD) signals of high-voltage equipment in 2020. The results showed the superiority of the method in PD signal noise reduction for both simulated and field measurement signals [36].
This work combined SD and WTD to denoise the elastic wave signal, using wavelet threshold denoising after superposition with five signals. The work was designed for three different signal denoising simulation tests and one model box test of the elastic wave signals collected by the bender-element-type piezoelectric transducers. The results of the study will optimize the denoising technique of the elastic wave signals collected by the bender elements. It can more accurately extract information that reflects the mechanical state of the soil, such as the wave amplitude, from the elastic wave signals collected by the bender-element-type piezoelectric transducers.

2. Digital Signal Processing

2.1. Superposition Denoising (SD)

SD superimposes multiple sets of noise-containing data waveforms and repeatedly measures the average value of the waveforms to achieve noise reduction:
y i = i = 1 m S i m
where y is the denoised signal, S is the original signal, and m is the number of datasets.
The MATLAB code for the SD is provided in the literature [20].

2.2. Wavelet Threshold Denoising (WTD)

2.2.1. Signal Decomposition and Reconstruction

The decomposition and reconstruction of the wavelet are based on the tower multi-scale analysis and reconstruction of the signal proposed by Mallat in 1989 [37]. From the perspective of the frequency domain, the decomposition and reconstruction of the wavelet is a band-pass filter. If the discrete sampling data of the signal f(t) ∈ L2(R) are fk, and fk = c0,k, the wavelet orthogonal decomposition formula of signal f(t) is:
{ c j , k =   c j 1 , n h n 2 k d j , k =   d j 1 , n g n 2 k k = 0 , 1 , 2 , , N 1
where cj,k is the coefficient scale, dj,k is the wavelet coefficient, h and g are a pair of orthogonal mirror filter banks, j is the number of levels, and N is the number of discrete sampling points.
The inverse operation of the decomposition process is the wavelet reconstruction process, and its formula is:
c j 1 , n =   c j , n h k 2 n +   d j , n g k 2 n
Signal S undergoes wavelet transformation to output high-frequency components and low-frequency components, namely, details and approximation. With the continued wavelet transformation of the low-frequency components, the second level of high-frequency components and low-frequency components is obtained, as shown in Figure 1.

2.2.2. Threshold Function

In the processing of data signals, noise often appears in the form of high frequencies, while useful signals often appear in the form of low frequencies. Therefore, the high-frequency wavelet coefficients are thresholds and the signal is reconstructed to eliminate noise. The soft and hard threshold method proposed by Donohn in 1992 can reduce noise simply and efficiently [30].
The hard threshold function is used to discard the wavelet coefficients smaller than the threshold in different-scale spaces and retain the wavelet coefficients larger than the threshold.
W s ( d j , k , λ j , k ) = { d j , k ( | d j , k | λ j , k ) 0 ( | d j , k | λ j , k )
where λj,k is the threshold of each level.
The soft threshold function is used to shrink the wavelet coefficients smaller than the threshold value at different scales to zero by a certain fixed amount, while retaining the wavelet coefficients larger than the threshold value.
W s ( d j , k , λ j , k ) = { s g n ( d j , k ) ( | d j , k | λ j , k ) ( | d j , k | λ j , k ) 0 ( | d j , k | λ j , k )
Compared with the hard threshold function, the soft threshold function processes the signal more smoothly. This study selects the soft threshold function to process the data signal.

2.2.3. Threshold

The choice of threshold λj,k is also a key factor affecting the denoising effect. If λj,k is too large, it will cause the removal of useful parts and signal distortion; on the contrary, it will lead to the signal containing too much noise and failing to achieve the denoising effect.
This study selects the fixed threshold:
λ j , k = σ j , k 2 ln ( N j , k )
where σj,k is the standard deviation of noise and Nj,k is the length of each scale signal.
In the actual denoising process, the standard deviation of the noise of the signal is unknown. So, when selecting the threshold, the estimation method is used to determine the standard deviation of the noise.
σ j , k = m e d i a n ( | c j , k | ) 0.6745
where median(|cj,k|) is the middle value of the selected scale factor.

2.3. Evaluation Indicators

The Signal-to-Noise Ratio (SNR) and the Mean Square Error (MSE) are quoted as the evaluation indexes of the denoising effect.

2.3.1. Signal-to-Noise Ratio (SNR)

SNR is the ratio of the original signal to the noise:
S N R = 10 l o g 10 ( P s i g n a l P n o i s e )
where Psignal is the original signal power and Pnoise is the noise power.
P s i g n a l = 1 N i = 1 N f ( x i ) 2
P n o i s e = 1 N i = 1 N n ( x i ) 2  
where N is the signal length, f(xi) is the individual element of the original signal, and n(xi) is the individual element of the noise.
The higher the signal-to-noise ratio, the more significant the denoising effect, and the lower the signal-to-noise ratio, the less effective the denoising effect.

2.3.2. Mean Square Error (MSE)

MSE is used to measure the deviation of the denoised signal from the original signal:
M S E = i = 1 N | f ( x i ) y i | 2 N
where yi is the denoised signal.
The smaller the MSE, the more significant the denoising effect, and the larger the MSE, the less effective the denoising effect.

3. Tests and Results

In this work, three sets of signal simulation tests were designed. Gaussian noise or Gaussian white noise with different signal-to-noise ratios was added for three different original signals (heavy sine signal, bumps signal, and doppler signal). Gaussian noise is a class of noise whose probability density function obeys the Gaussian distribution (that is, Normal distribution) [38]. If the amplitude distribution of a noise obeys the Gaussian distribution, and its power spectral density is uniformly distributed, it is called Gaussian white noise [39]. They are all common noises in the communication process.
The noisy signals were denoised using the superposition denoising with 20 signals (SD-20), the superposition method with 5 signals (SD-5), the wavelet threshold denoising (WTD), and the wavelet threshold denoising after superposition with 5 signals (SD-5-WTD). The four denoising methods were compared according to the SNR and MSE, and the optimal denoising results were selected:
  • Randomly generate 20 sets of noise-added signals.
  • Denoising by the superposition method using the 20 sets of signals and calculating the SNR and MSE.
  • Five groups of signals from the 20 groups were randomly selected for denoising by the superposition method and calculating the SNR and MSE.
  • Wavelet threshold denoising was performed by randomly selecting 1 group from 20 groups of signals, and the SNR and MSE were calculated.
  • Performing wavelet threshold denoising based on the results of step (b) and calculating the SNR and MSE.
  • Select the denoising method with the largest SNR and smallest MSE.

3.1. Heavy Sine Signal Test

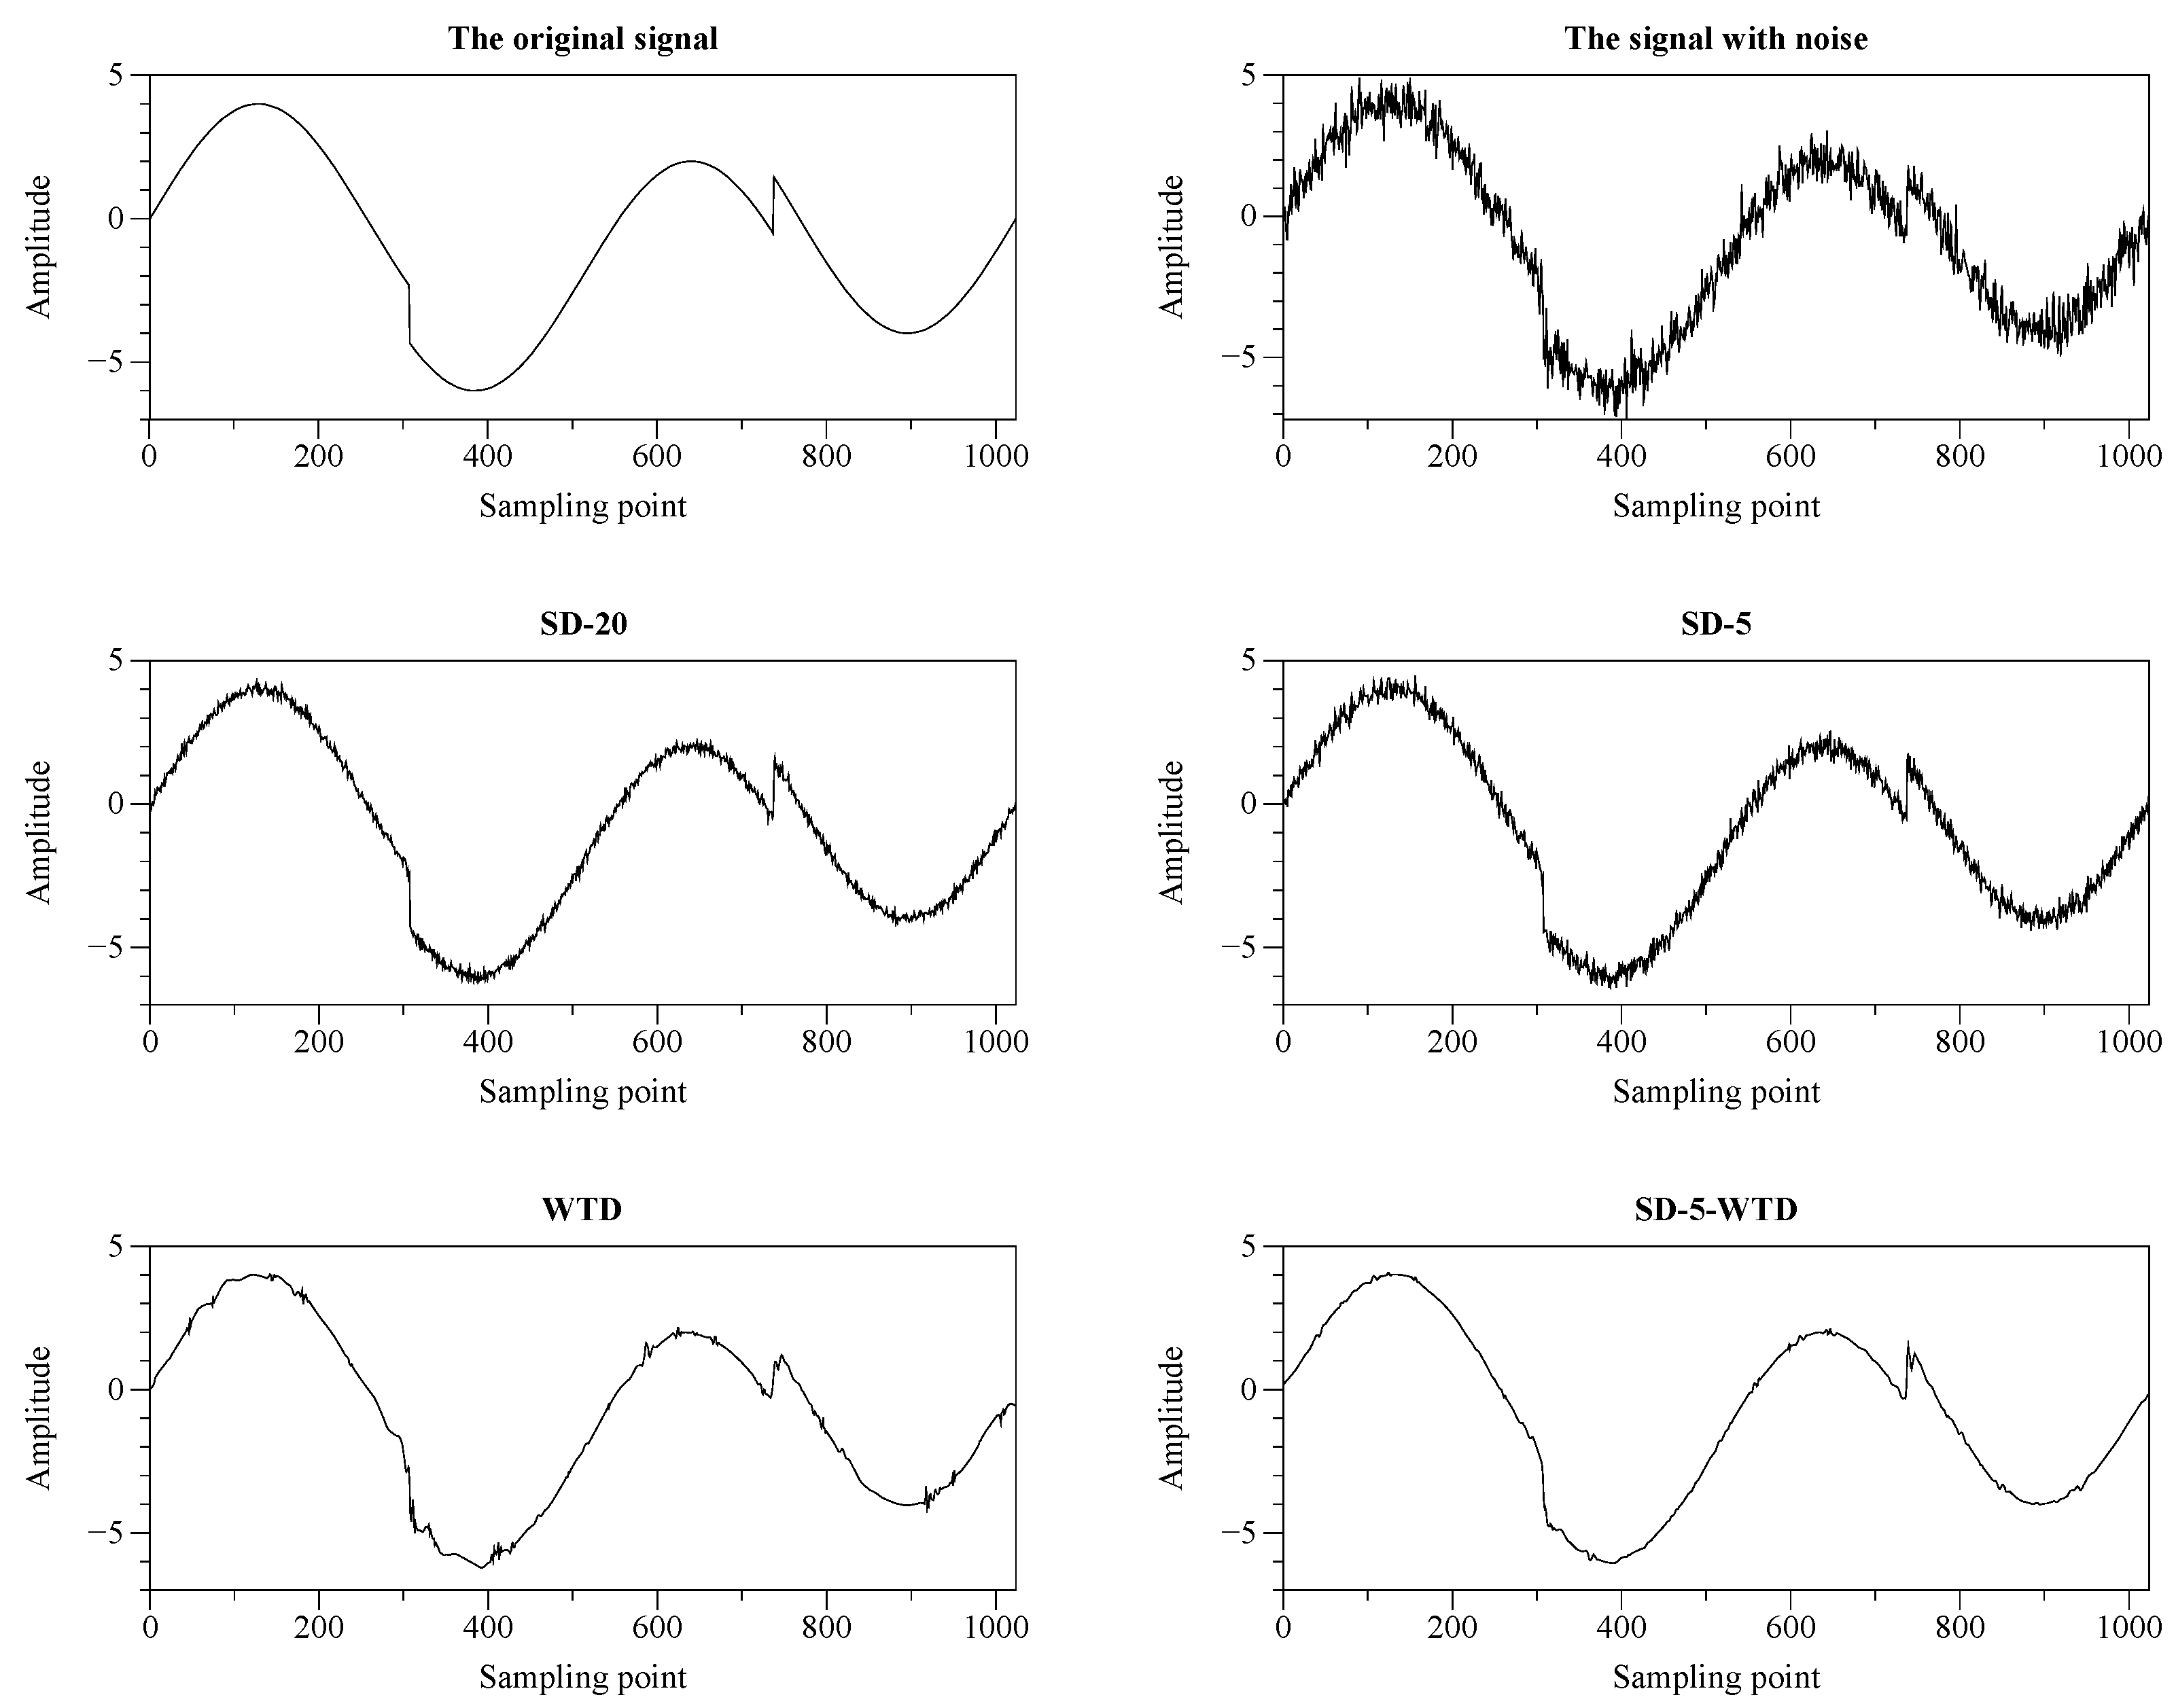
We added Gaussian noise with SNR = 15 for the Heavy Sine signal. The decomposition level of wavelet threshold denoising was chosen to be six layers, and the wavelet base was “db4”.
Figure 2 shows the original Heavy Sine signal, the noisy Heavy Sine signal, and the Heavy Sine signal denoised by each of the four methods. The SD-5-WTD can reveal a smoother Heavy Sine signal and retain many signal details. Other methods reduce the noise to varying degrees, but the SD-5-WTD is closest to the original signal. Table 1 shows the SNR and MSE of each method for the denoising of Heavy Sine signals. The results show that the SD-5-WTD has the highest SNR and smallest MSE, which is the most effective method among the four denoising methods.

3.2. Bumps Signal Test

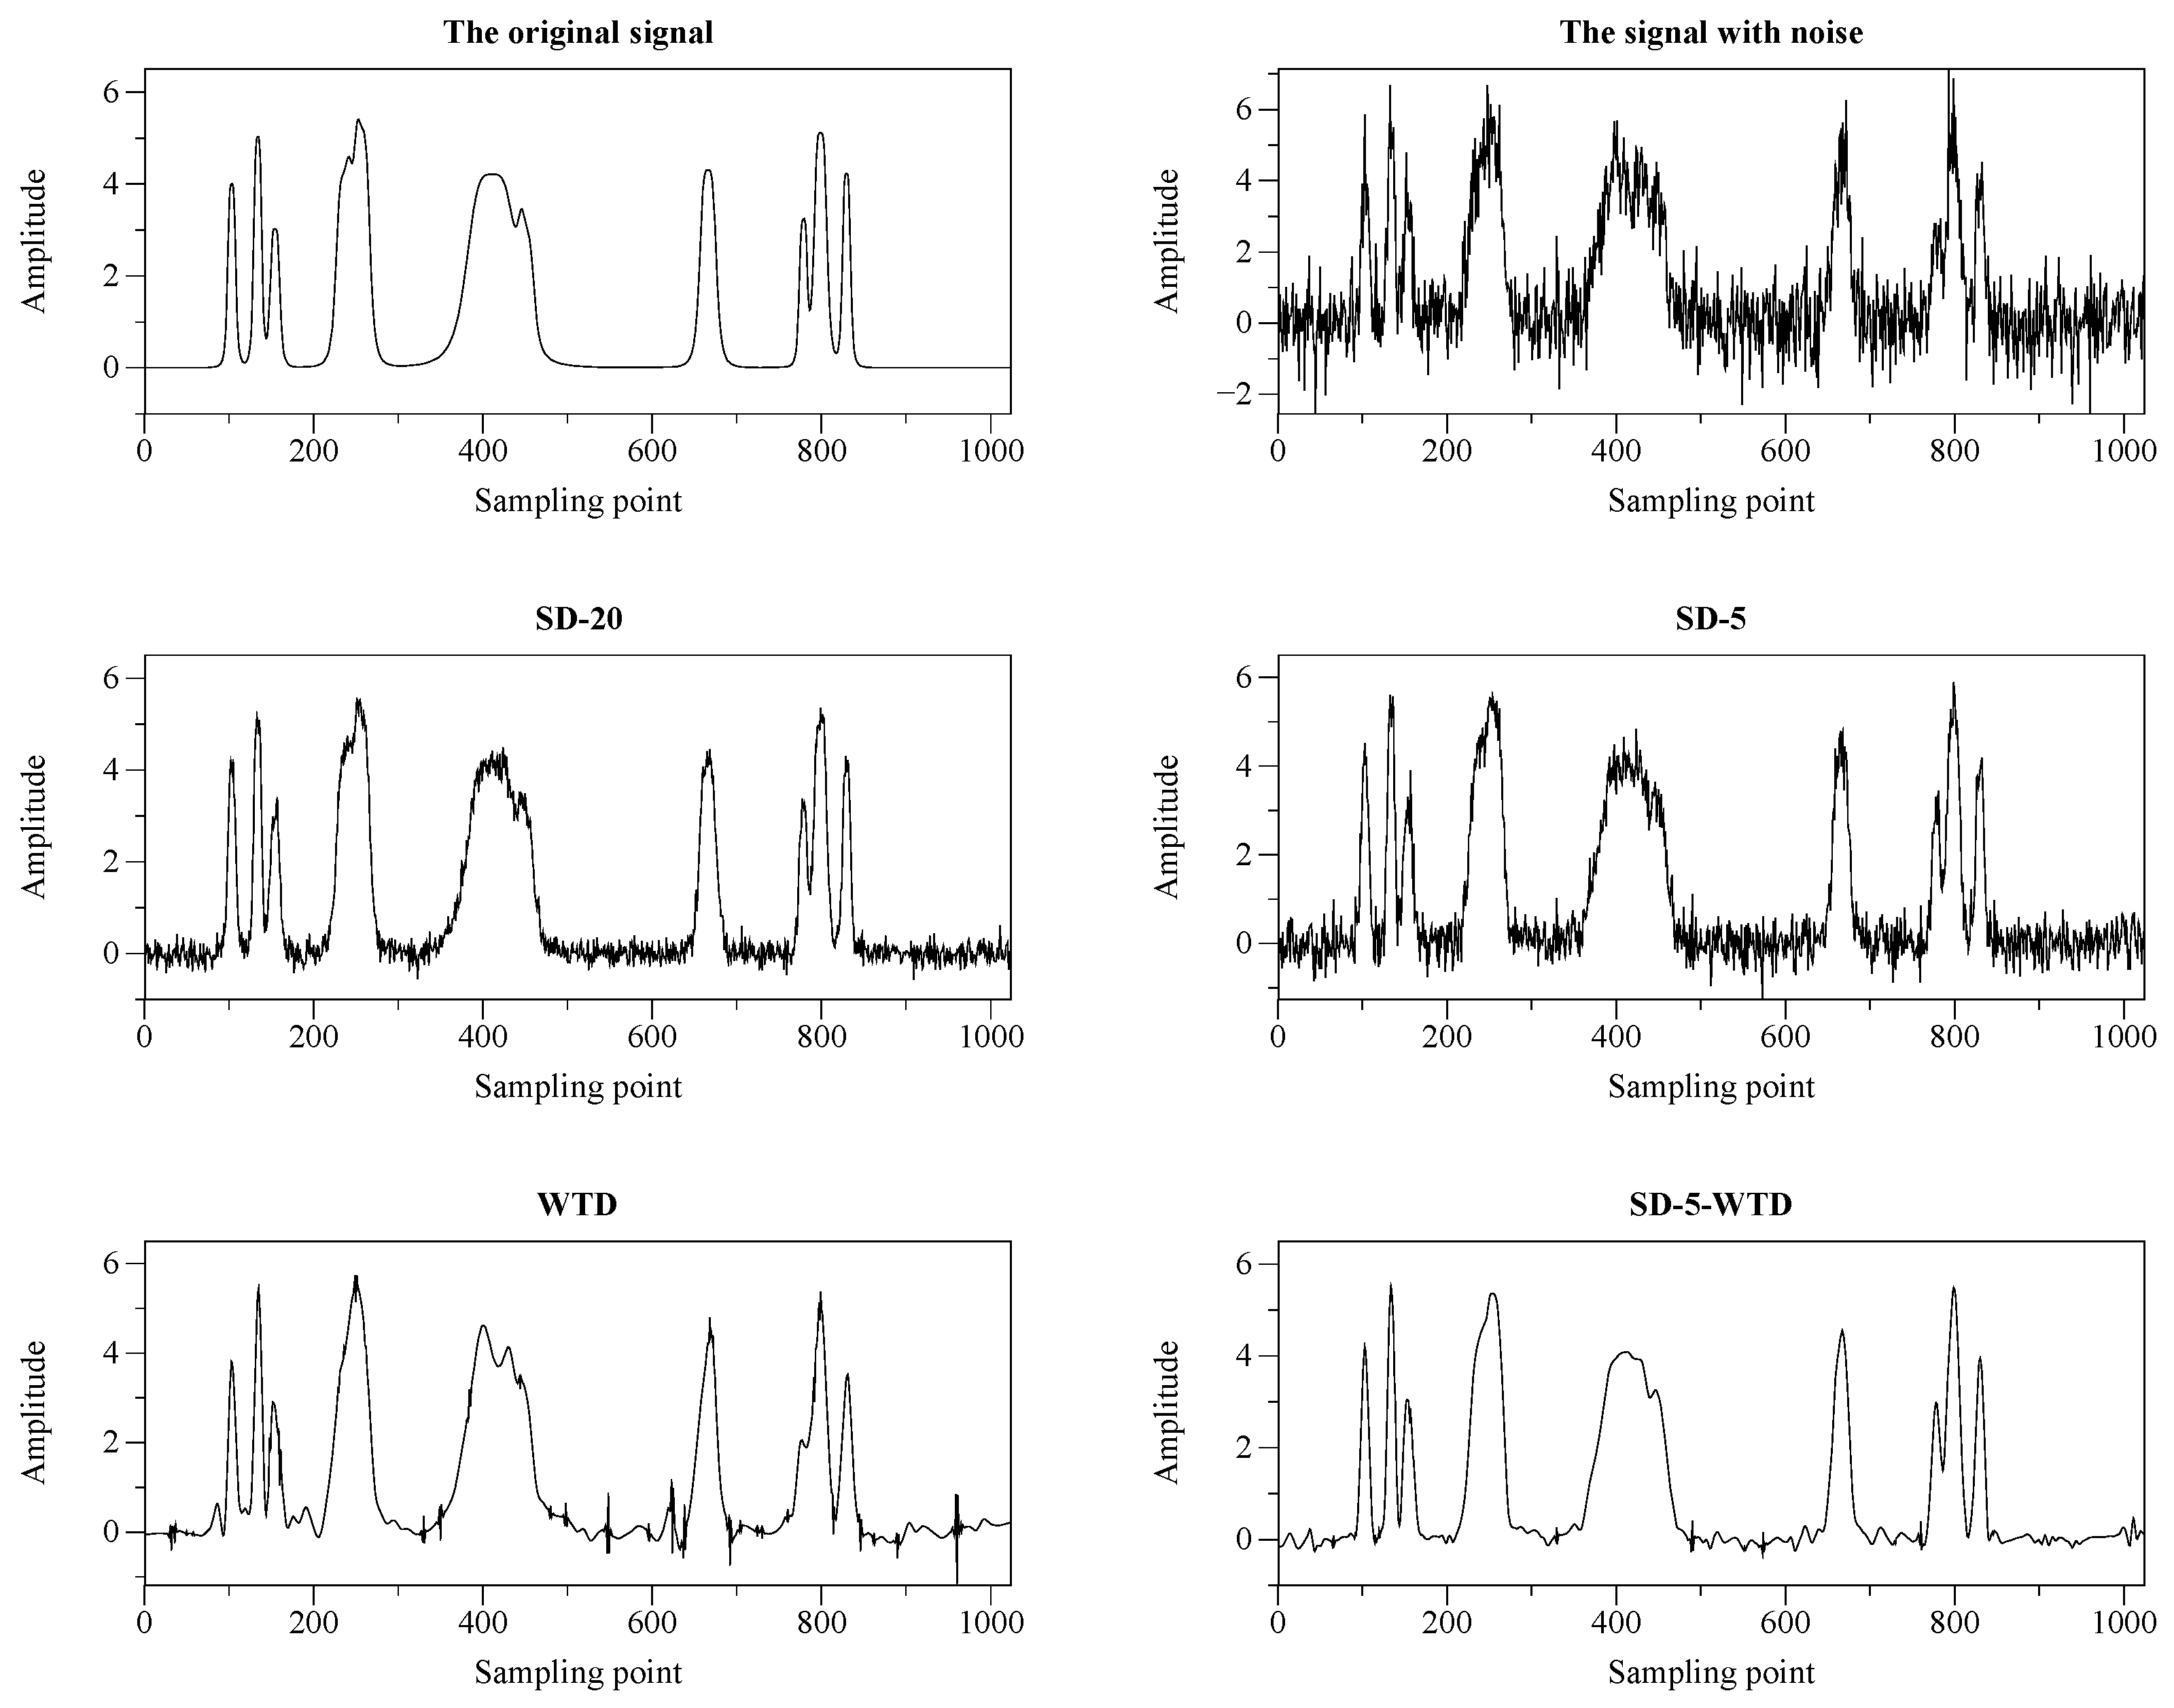
We added Gaussian white noise with SNR = 7 for the Bumps signal. The decomposition level of wavelet threshold denoising was chosen to be six layers, and the wavelet base was “coif4”.
Figure 3 shows the original Bumps signal, the noisy Bumps signal, and the Bumps signal denoised by each of the four methods. Due to the excessive noise added, the fluctuation of the noisy signal is obvious. However, SD-5-WTD achieved the best performance as well. The characteristics of the original signal are restored more realistically. Although SD-20 restores the overall trend of the signal, there is still too much high-frequency noise. Table 2 shows the SNR and MSE of each method for the denoising of Bumps signals. The results show that the SD-5-WTD has the highest SNR and the smallest MSE, which is the most effective method among the four denoising methods. Combined with Figure 3, the superimposed SD-5-WTD has the most obvious denoising effect.

3.3. Doppler Signal Test

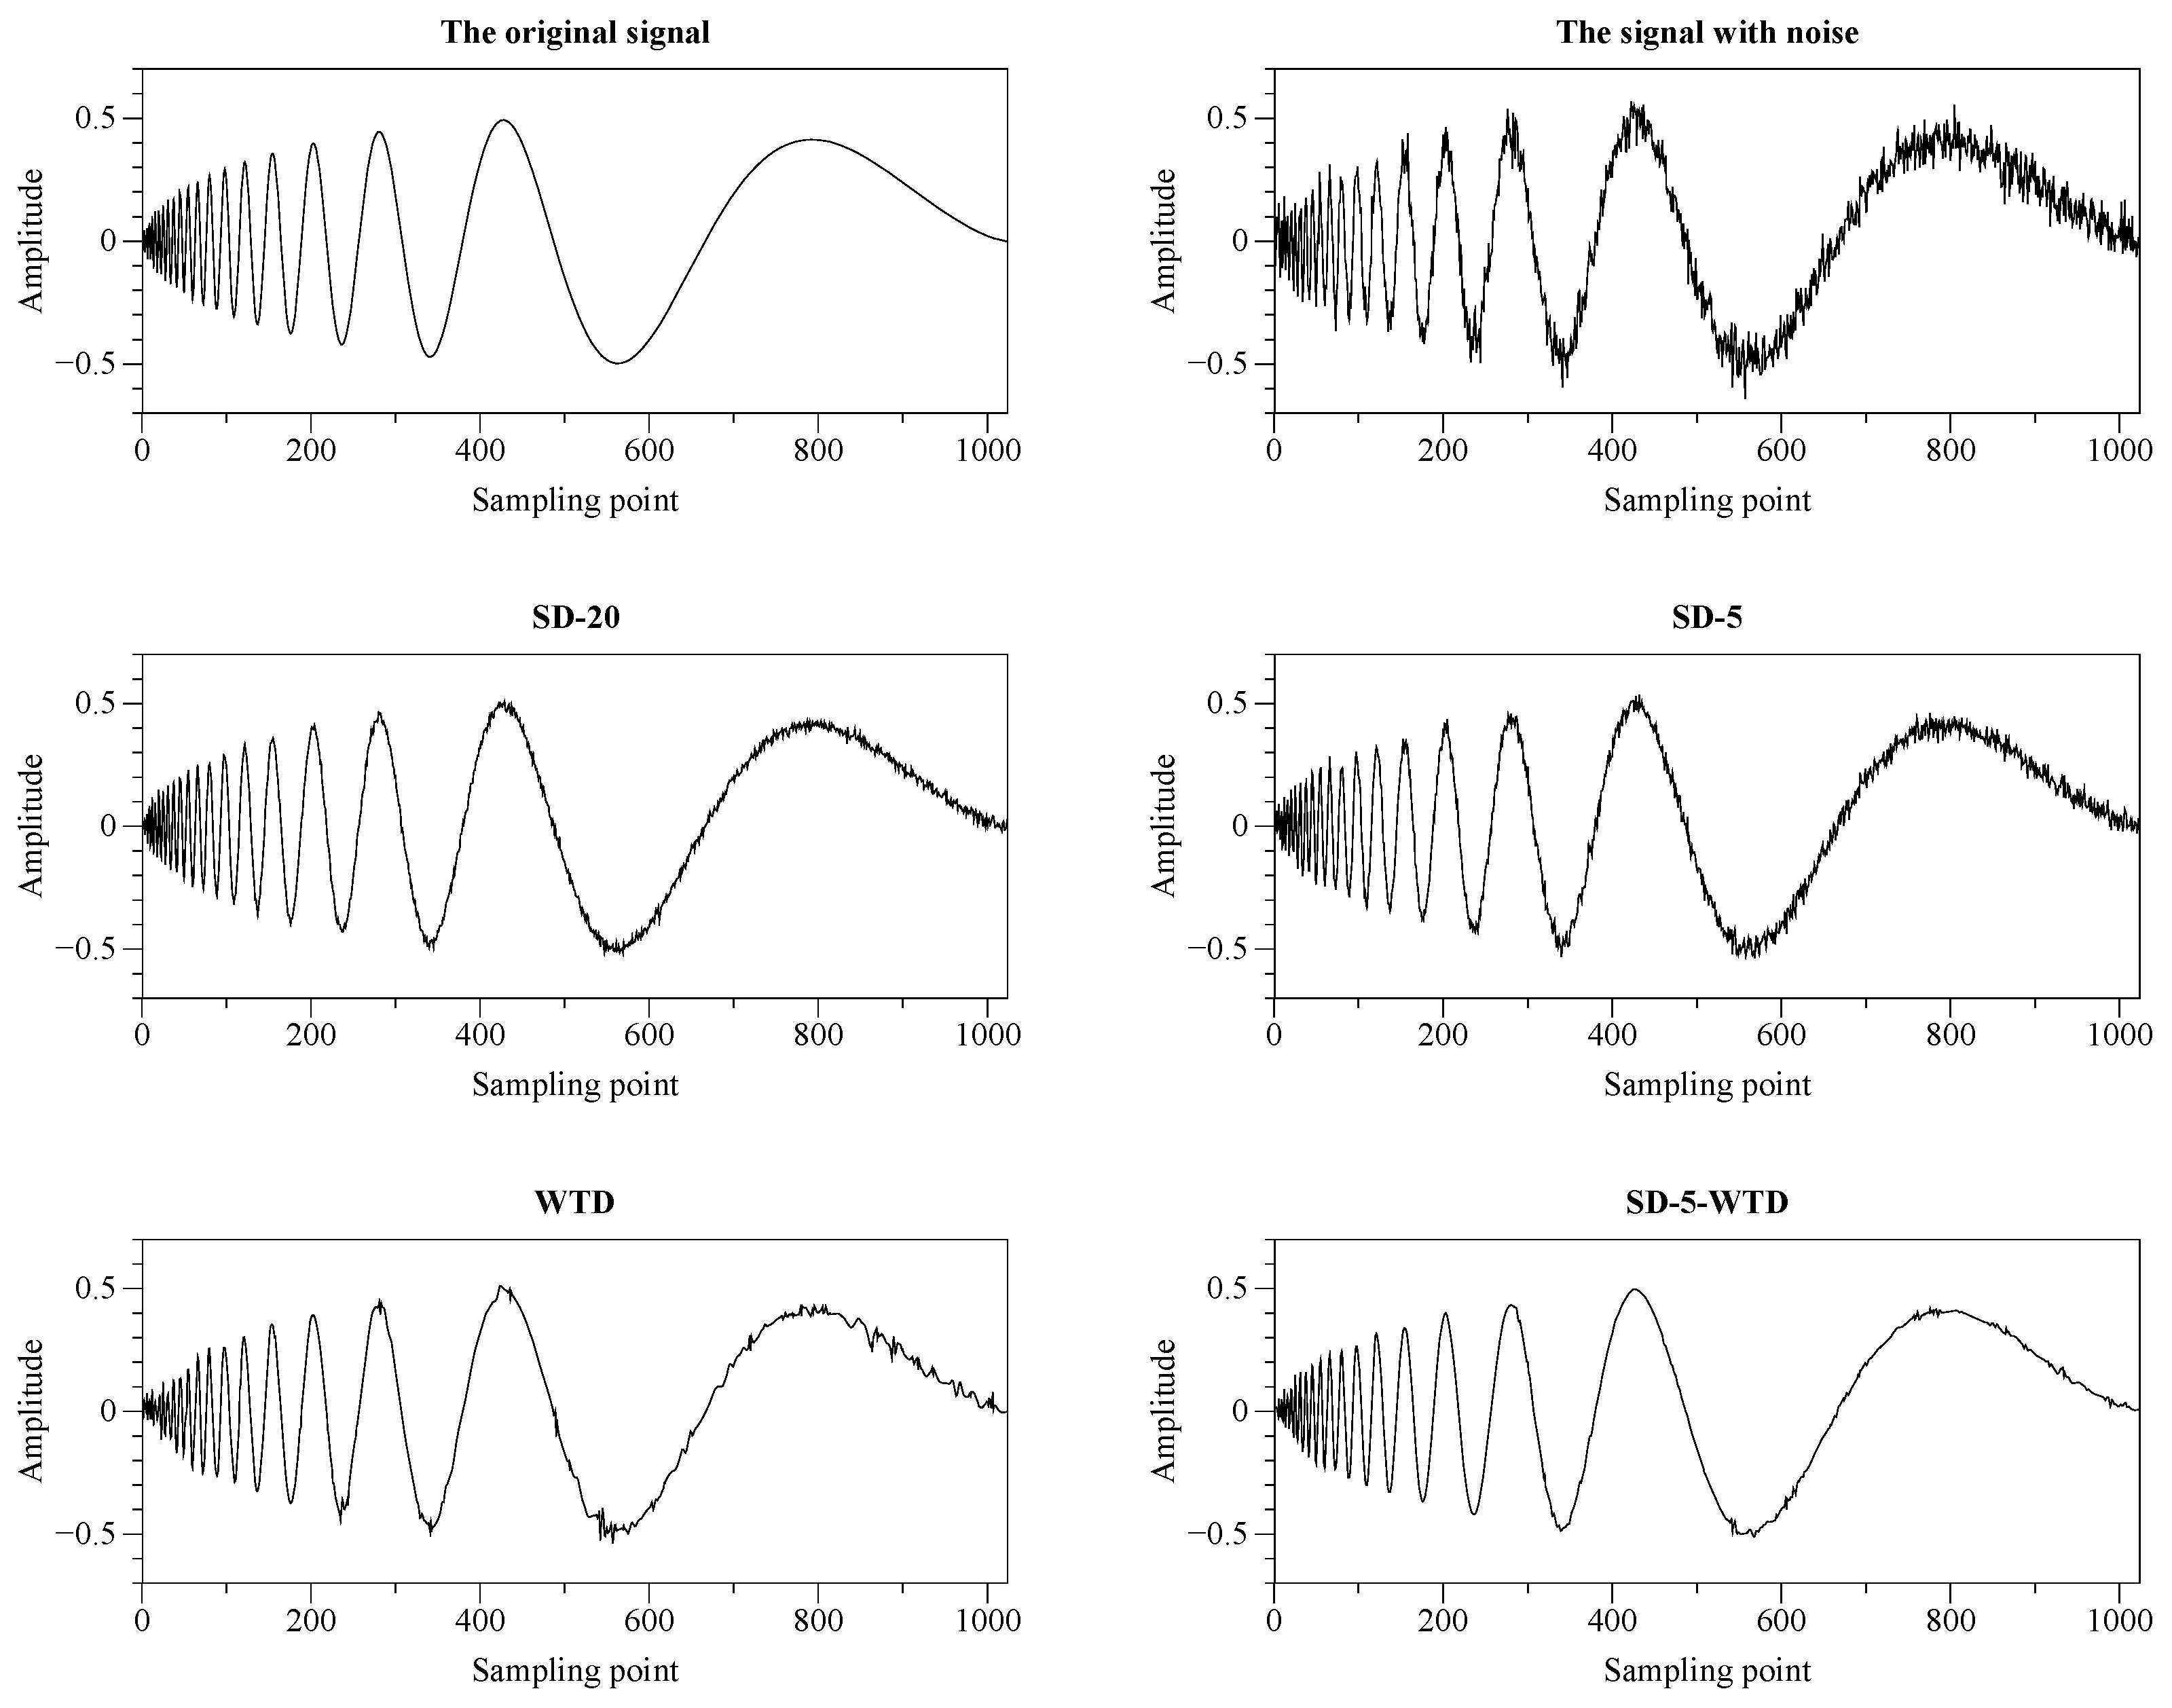
We added Gaussian white noise with SNR = 15 for the Doppler signal. The decomposition level of wavelet threshold denoising was chosen to be six layers, and the wavelet base was “sym8”.
Figure 4 shows the original Doppler signal, the noisy Doppler signal, and the Doppler signal denoised by each of the four methods. The Doppler signal has much high-frequency information, which overlaps with the noise after adding noise, and the superposition denoising retains this high-frequency information to a certain extent. As the number of superimposed signals increases, the denoising effect becomes more obvious, but this is not compatible with the actual application process. The signal obtained by denoising with SD-5-WTD is relatively smooth but missing in the high-frequency part. Table 3 shows the SNR and MSE of each method for the denoising of Doppler signals. The results show that the SD-5-WTD has the highest SNR and smallest MSE. Combined with Figure 4, the SD-5-WTD has significant advantages in denoising low-frequency signals, and the overall denoising effect is better than superposition denoising. However, it is slightly inadequate for high-frequency signals.

3.4. Elastic Wave Signal Test

According to the propagation characteristics of elastic waves, the wave amplitude of elastic waves decreases with the volumetric water content [40,41,42,43]. To test the practical application of the SD-5-WTD for the elastic wave signal, a model box test was performed with these characteristics as evaluation indicators. Rainfall infiltration was simulated by artificial rainfall, during which soil water content and elastic wave signals were collected. The SD-5-WTD was adopted to denoise the elastic wave signal, extract the relevant information (one sample point per minute), and detect whether it conforms to the elastic wave theory.
The model in the model box tests was 400 mm in length, 300 mm wide, and 300 mm high, and the container was made of plexiglass 5 mm thick. A stable source of the elastic wave was located at the bottom of the model, in which the plunger movement direction was perpendicular to the level. The receiver was placed 100 mm above the exciter. The bender-element-type piezoelectric transducer and moisture sensor amount to one, respectively, and the bender elements were limited to the measurement area of the moisture sensors. Figure 5 shows the diagram of the model box test. The model was created by layered accumulation and compaction, and the dry density was 1.3 g/cm3. The working interval of the source was 5 times/min, and the sampling frequency of the elastic wave signal was adjusted to 5 kHz. Artificial rainfall was 100 mm/h for 6 min.
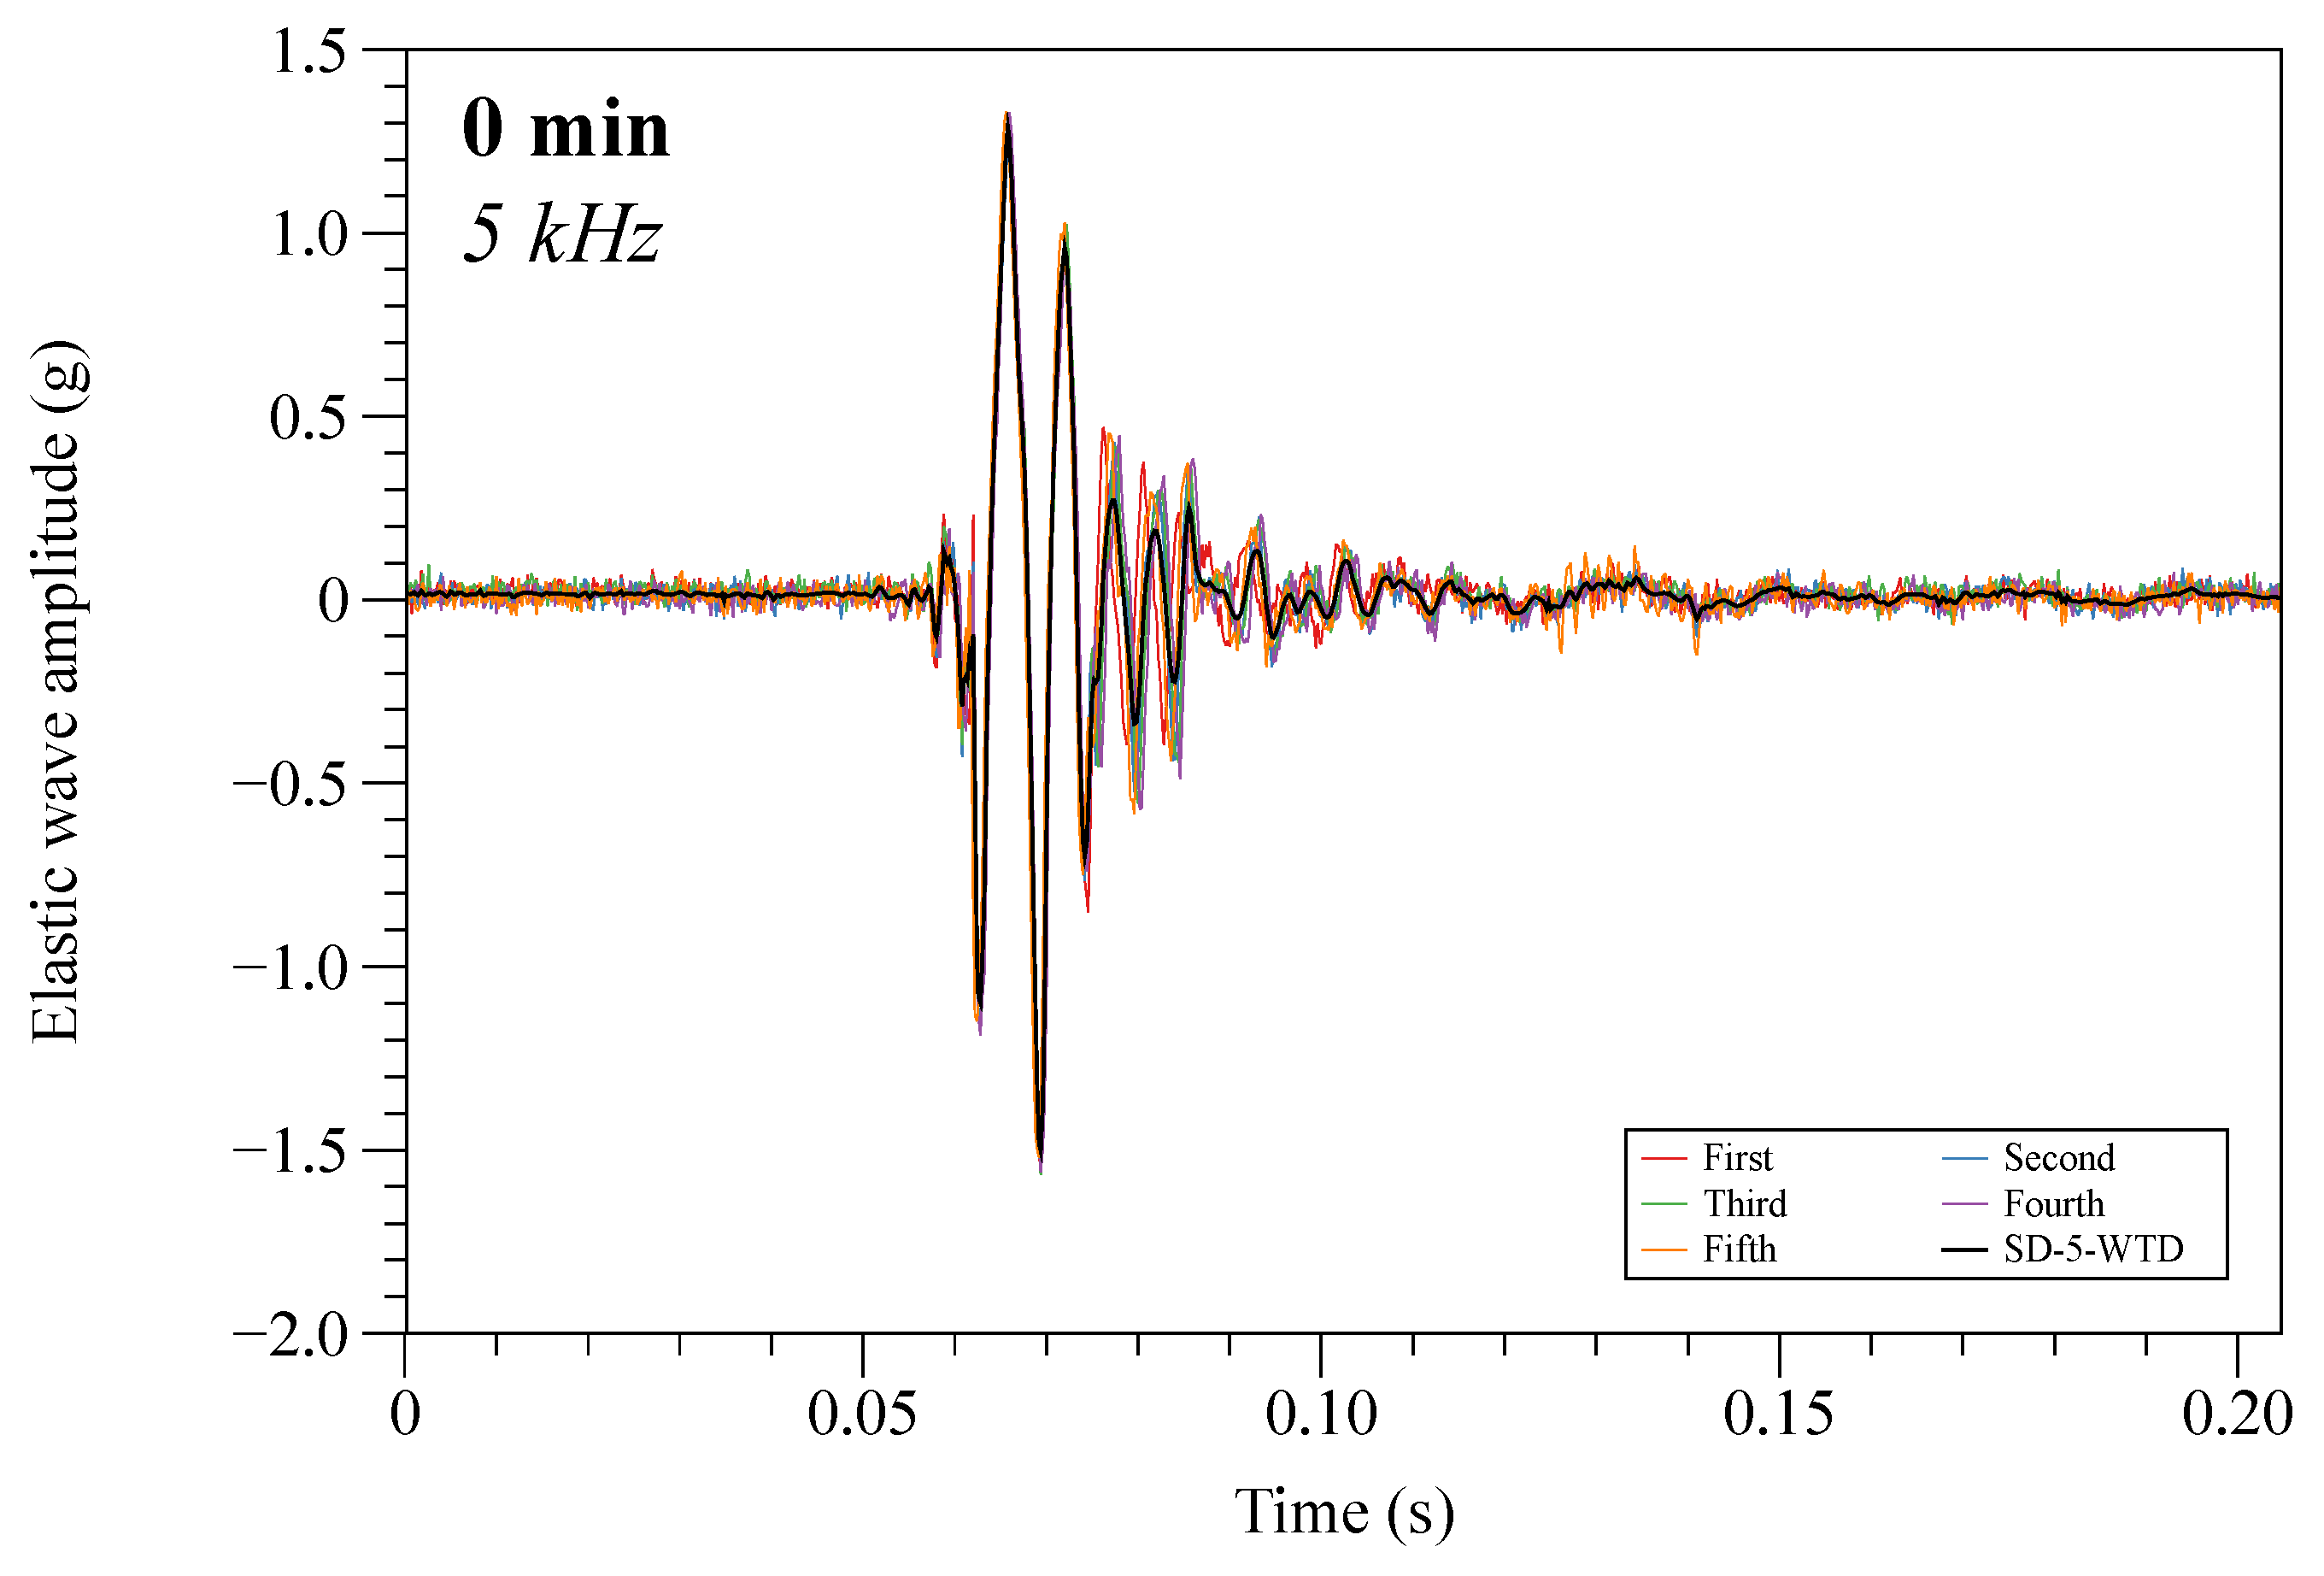
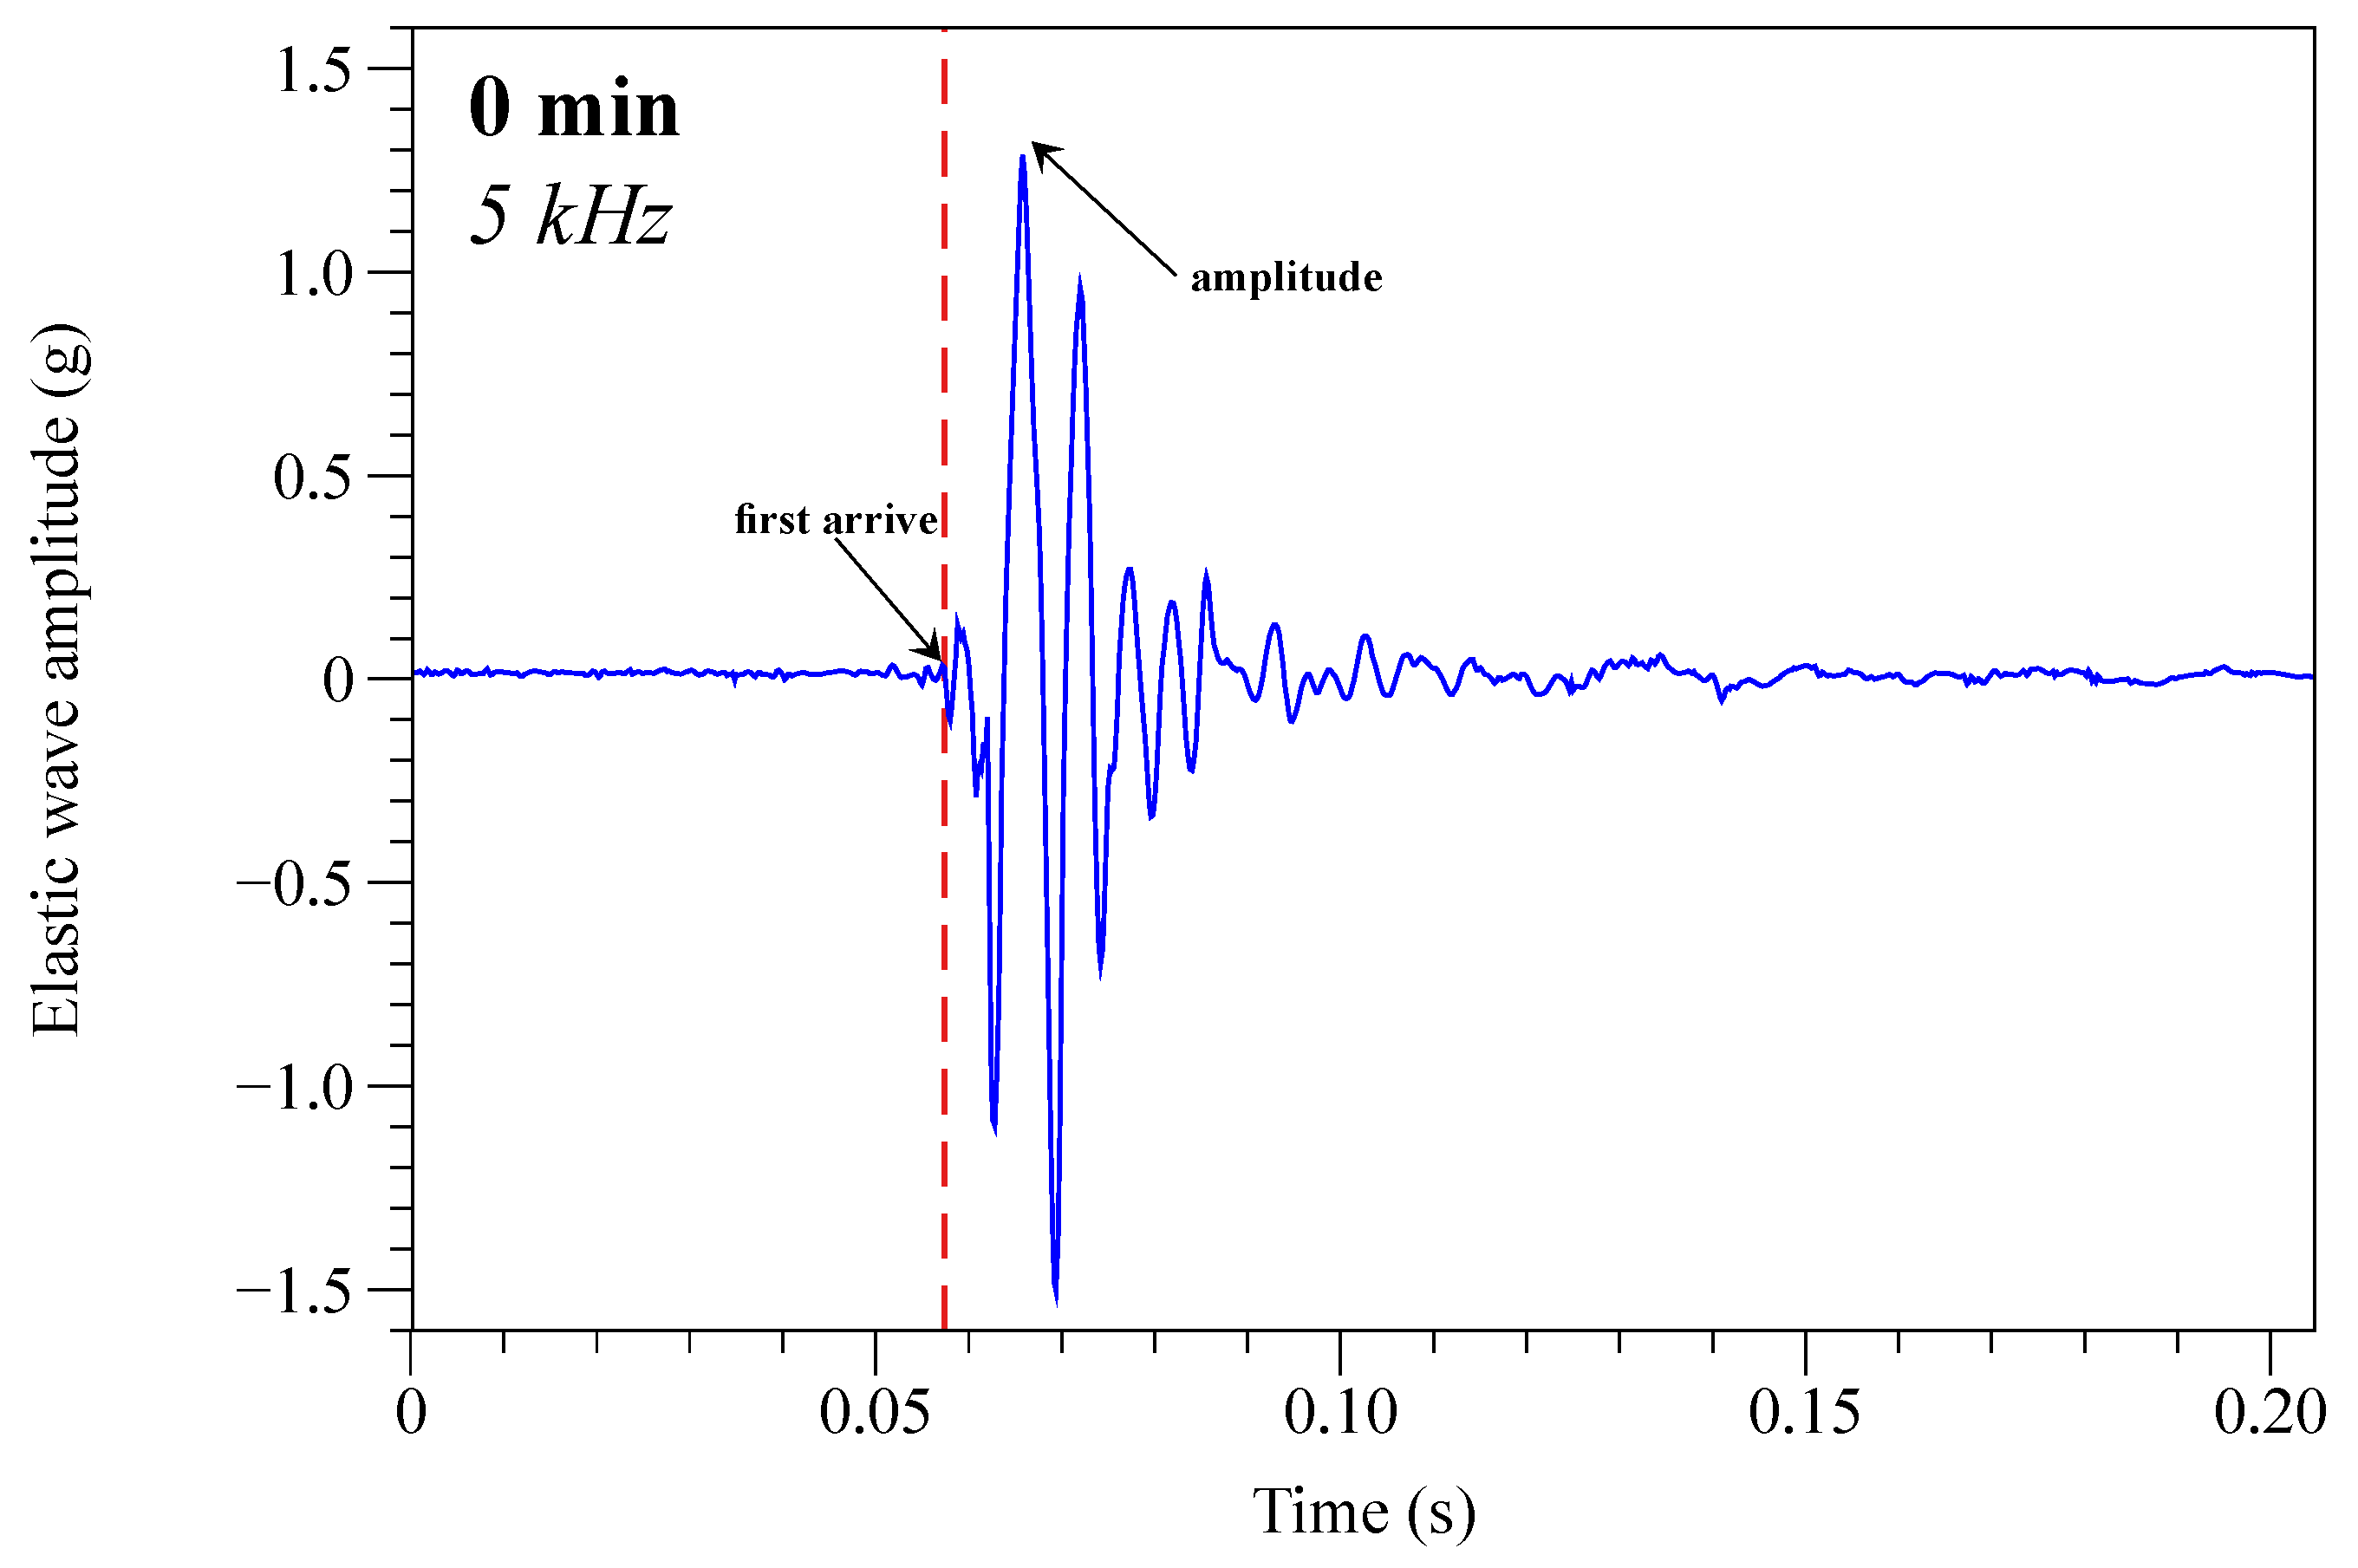
Figure 6 depicts the five-band elastic wave signal collected for 0 min and the denoised signal with the SD-5-WTD. There is a huge amount of noise in the elastic wave signal collected by the bending-element-type piezoelectric sensor. The waveform cannot be clearly described. It is a considerable challenge to obtain the first arrival point of the elastic wave from the waveform data. The denoised elastic wave signal by SD-5-STD eliminates the high-frequency useless information in some detail. It keeps the original signal characteristics of the elastic wave. The change in wave amplitude represents the energy loss of the elastic wave, and it was the maximum of the elastic wave crest. Figure 7 shows the positive amplitude of the elastic wave signal with the SD-5-WTD for 0 min.
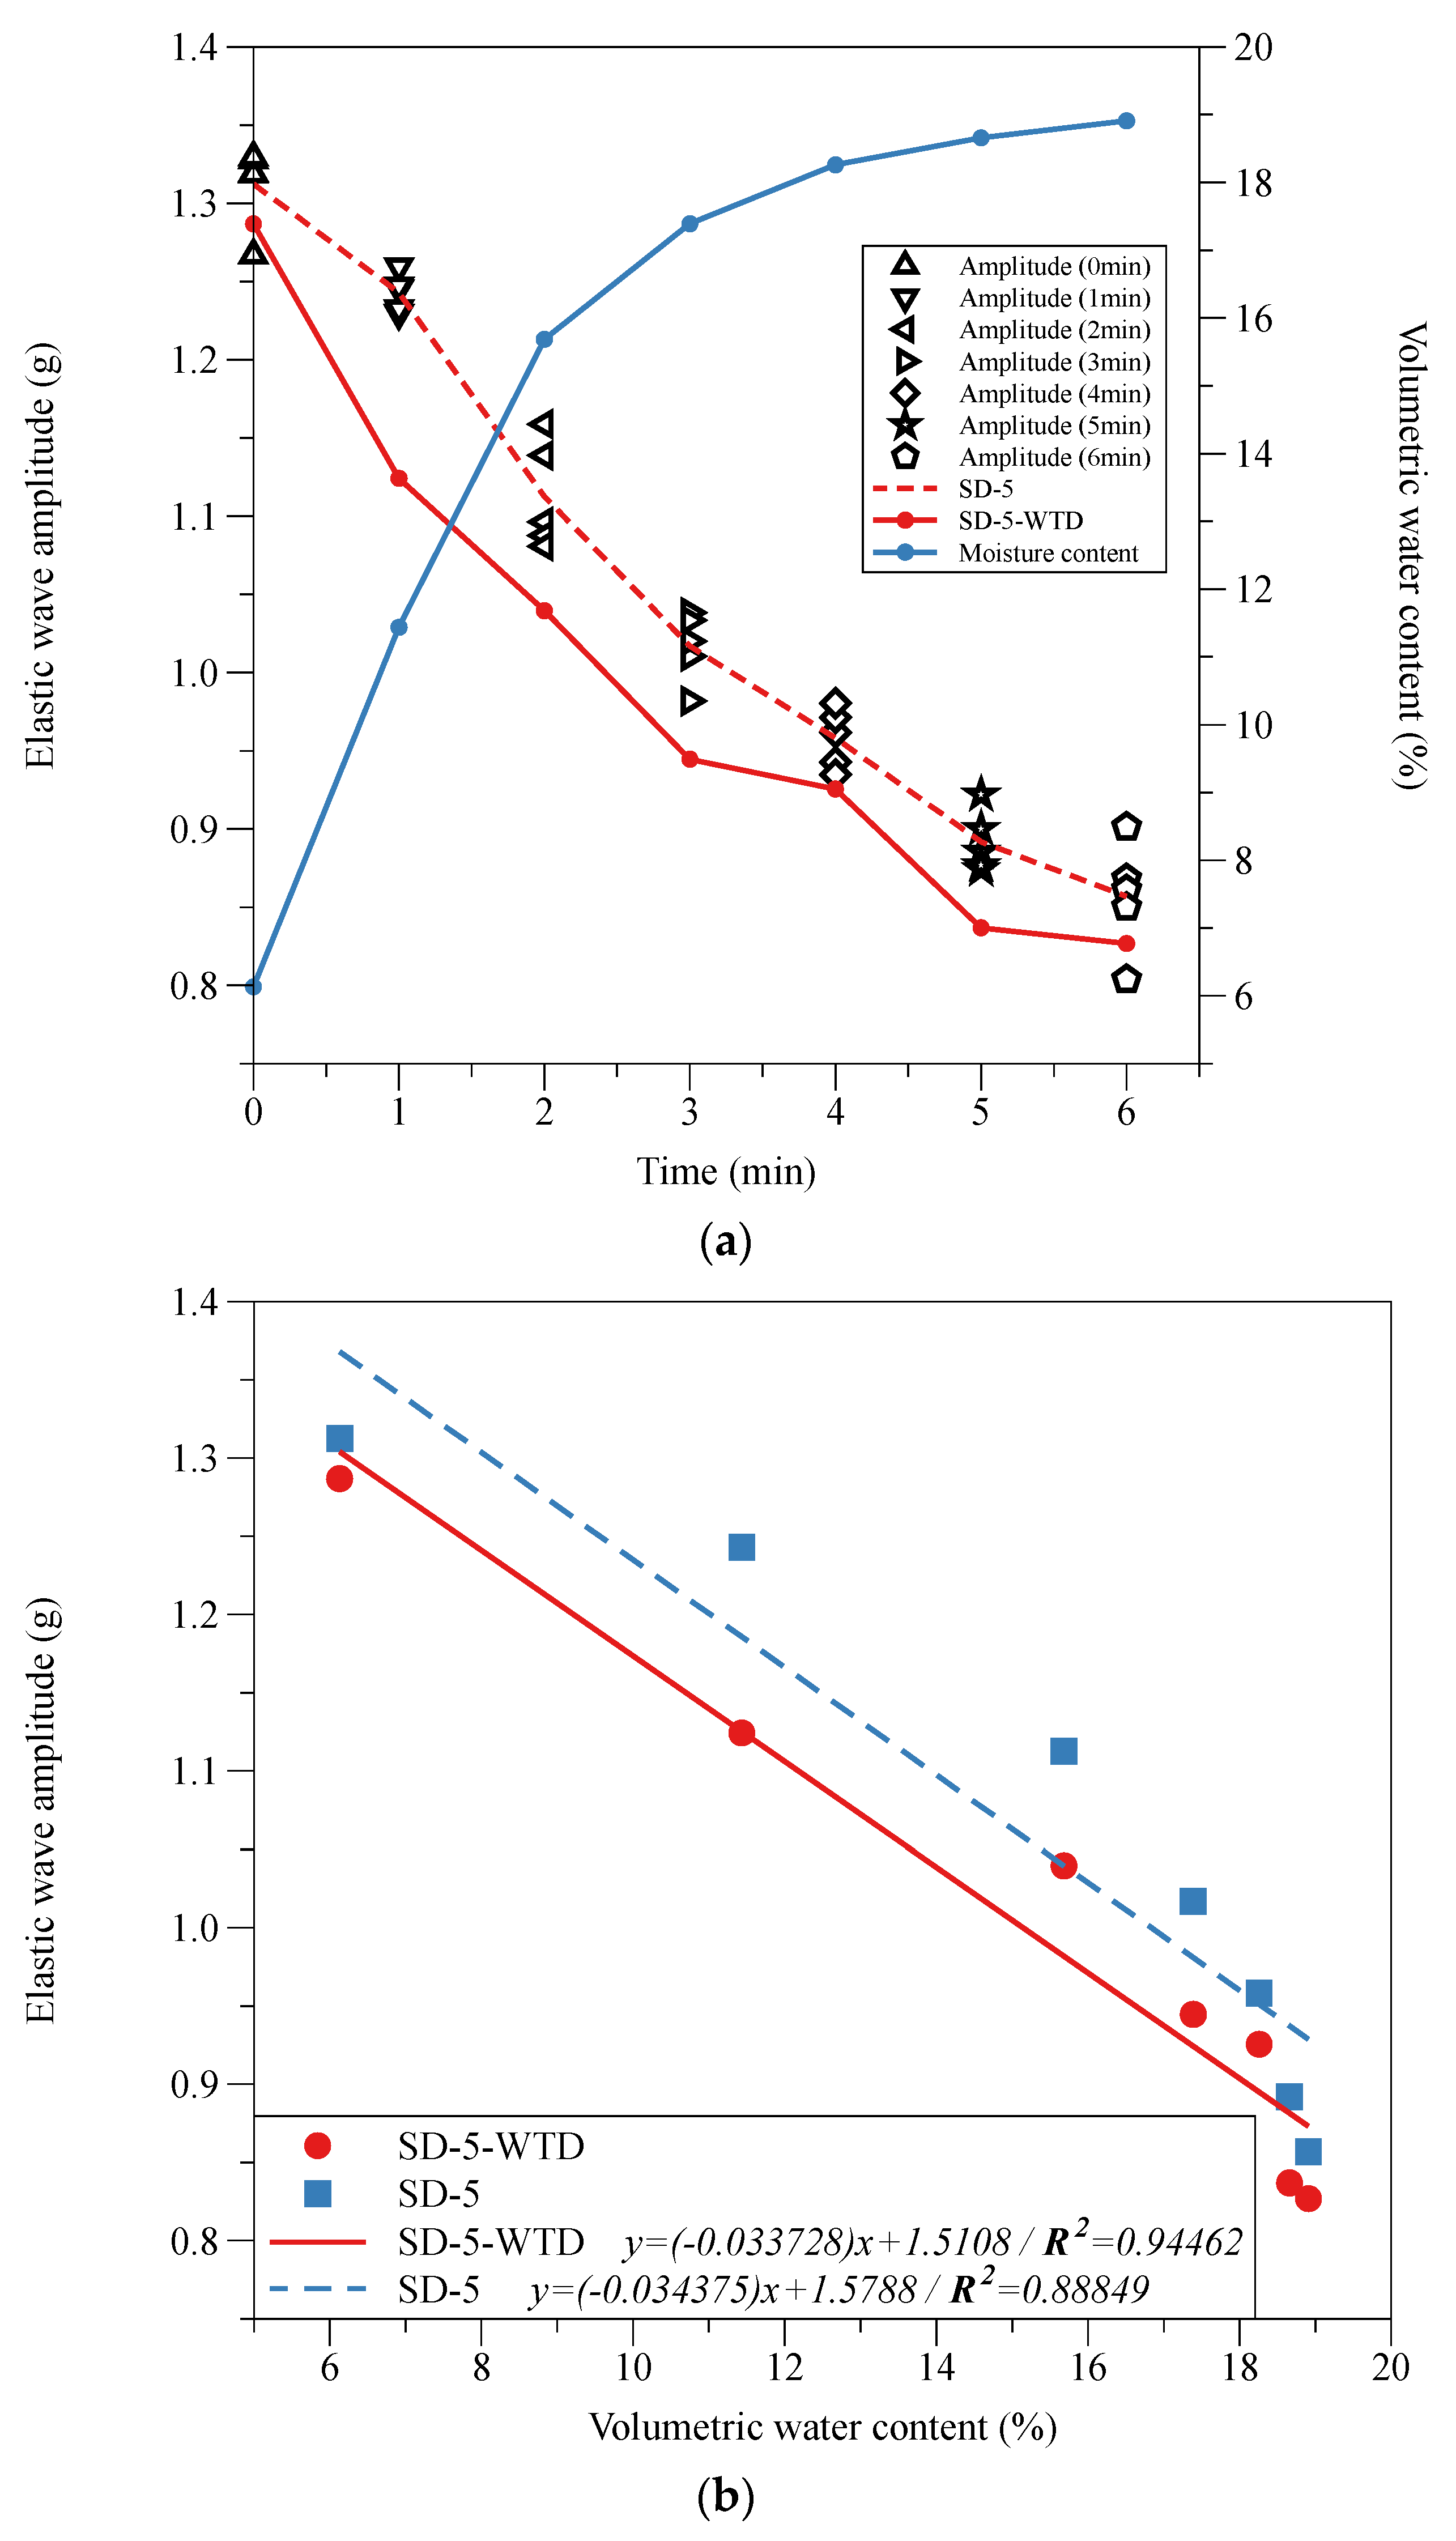
There was no deformation of the soil during the test. According to the elastic wave theory, the wave amplitude decreased with the volumetric water content. The infiltration of rainfall led to the increase in water in the soil pore space, the soil became loose, and the energy lost during the propagation of the elastic wave greatly increased. Figure 8a illustrates the changes in water content and elastic wave amplitude during the model box test. After denoising using WTD and SD on the test data, respectively, the elastic wave amplitude data showed a decreasing trend but differed in detail. This is explained in Figure 8b by the fitted curve between the volumetric water content and the elastic wave amplitude. The Goodness of Fit between the amplitude and the water content after denoising using SD-5-WTD is higher than that of SD. Furthermore, the relationship between the wave amplitude and water content after SD-5-WTD denoising is more relevant to the linear change.
When the signal collected by the bender elements contains a great deal of noise, SD-5-WTD can obtain a clear elastic waveform and it is more suitable for practical situations than SD. This technique enhances the accuracy of further analysis of the elastic wave signals.

4. Conclusions

In this paper, we added Gaussian noise or Gaussian white noise with different SNR to three signals with different characteristics in the simulation test phase and used four denoising methods to denoise the noise-containing signals separately. The SD has a better denoising effect and clearer waveform as the number of signals increases, but it is limited by the number of signals in the actual warning process. The WTD effect of a single signal is limited, and the detailed processing of the signal is not perfect. Wavelet threshold denoising after superimposing five signals can provide a complete response to the waveform change trend and eliminate useless high-frequency noise. According to the calculation results of the SNR and MSE, the SD-5-WTD has the best effect. In the model box tests, rainfall infiltration was simulated, and the elastic wave signals in the soil were collected by the bender elements. Elastic wave data were denoised by the WTD-5-SD. The results show that the SD-5-WTD can display clear waveforms based on overcoming the number of signals. The relationship between the wave amplitude obtained from the denoised signals and the volumetric water content was in close accordance with the elastic wave theory.
The means bender-element-type piezoelectric transducers optimize elastic wave denoising. They display clear and smooth waveform data on the basis of reducing the number of elastic waves. This opens up a new way of thinking for researchers to study the relationship between elastic waves and physical information inside the soil. Future work will consider the stability of the elastic wave generator to generate more stable elastic signals.

Supplementary Materials

The following supporting information can be downloaded at: https://www.mdpi.com/article/10.3390/su141912605/s1, Analysis and Raw Data.

Author Contributions

Methodology and supervision, M.X., J.L. and S.L.; methodology, J.L. and M.X.; writing—original draft, J.L.; writing—review and editing, M.X. and S.L. All authors have read and agreed to the published version of the manuscript.

Funding

This research received no external funding.

Institutional Review Board Statement

Not applicable.

Informed Consent Statement

Not applicable.

Data Availability Statement

The data presented in this study are available in the Supplementary Materials.

Conflicts of Interest

The authors declare no conflict of interest.

References

  1. Lee, J.-S.; Santamarina, J.C. Bender Elements: Performance and Signal Interpretation. J. Geotech. Geoenviron. Eng. 2005, 131, 1063–1070. [Google Scholar] [CrossRef] [Green Version]
  2. Leong, E.C.; Yeo, S.H.; Rahardjo, H. Measuring Shear Wave Velocity Using Bender Elements. Geotech. Test. J. 2005, 28, 488–498. [Google Scholar] [CrossRef]
  3. Cheng, Z.; Leong, E.C. Determination of Damping Ratios for Soils Using Bender Element Tests. Soil Dyn. Earthq. Eng. 2018, 111, 8–13. [Google Scholar] [CrossRef]
  4. Yang, J.; Wu, S.; Cai, Y. Characteristics of Propagation Elastic Waves in Saturated Soils. J. Vib. Eng. 1996, 9, 128–137. [Google Scholar] [CrossRef]
  5. Huang, W.; Rokhlin, S.I. Elastic-Wave Scattering and Stoneley Wave Localization by Anisotropic Imperfect Interfaces between Solids. Geophys. J. Int. 1994, 118, 285–304. [Google Scholar] [CrossRef] [Green Version]
  6. Hiremath, M.S.; Sandhu, R.S.; Morland, L.W.; Wolfe, W.E. Analysis of One-Dimesional Wave Propagation in a Fluid-Saturated Finite Soil Column. Int. J. Numer. Anal. Methods Geomech. 1988, 12, 121–139. [Google Scholar] [CrossRef]
  7. Zhang, Z. Research on Elastic Wave Propagation Characteristics and Rockburst Monitoring and Early Warning under Complex Medium Conditions. Ph.D. Thesis, China University of Mining and Technology, Beijing, China, 2018. [Google Scholar]
  8. Ingale, R.; Patel, A.; Mandal, A. Numerical Modelling of Bender Element Test in Soils. Measurement 2020, 152, 107310. [Google Scholar] [CrossRef]
  9. Bartake, P.; Patel, A.; Singh, D. Instrumentation for Bender Element Testing of Soils. Int. J. Geotech. Eng. 2008, 2, 395–405. [Google Scholar] [CrossRef]
  10. Guldur, B.; Sheahan, T.C. Indication of Clay Structure Restoration in Laboratory Testing Using Bender Element Measurements. In Proceedings of the Deformation Characteristics of Geomaterials, Pts 1 and 2, Seoul, Korea, 1–3 September 2011; Chung, C.K., Kim, H.K., Lee, J.S., Jung, Y.H., Kim, D.S., Eds.; Ios Press: Amsterdam, The Netherlands, 2011; pp. 258–265. [Google Scholar]
  11. Chen, Y.; Irfan, M.; Uchimura, T.; Zhang, K. Feasibility of Using Elastic Wave Velocity Monitoring for Early Warning of Rainfall-Induced Slope Failure. Sensors 2018, 18, 997. [Google Scholar] [CrossRef] [Green Version]
  12. Finas, M.; Ali, H.; Cascante, G.; Vanheeghe, P. Automatic Shear Wave Velocity Estimation in Bender Element Testing. Geotech. Test. J. 2016, 39, 557–567. [Google Scholar] [CrossRef]
  13. Chen, G.; Wang, F.-T.; Li, D.-Q.; Liu, Y. Dyadic Wavelet Analysis of Bender Element Signals in Determining Shear Wave Velocity. Can. Geotech. J. 2020, 57, 2027–2030. [Google Scholar] [CrossRef]
  14. Irfan, M.; Uchimura, T.; Chen, Y. Effects of Soil Deformation and Saturation on Elastic Wave Velocities in Relation to Prediction of Rain-Induced Landslides. Eng. Geol. 2017, 230, 84–94. [Google Scholar] [CrossRef]
  15. Chen, Y.; Irfan, M.; Uchimura, T.; Cheng, G.; Nie, W. Elastic Wave Velocity Monitoring as an Emerging Technique for Rainfall-Induced Landslide Prediction. Landslides 2018, 15, 1155–1172. [Google Scholar] [CrossRef]
  16. Irfan, M.; Uchimura, T. Development and Performance Evaluation of Disk-Type Piezoelectric Transducer for Measurement of Shear and Compression Wave Velocities in Soil. J. Earthq. Eng. 2018, 22, 147–171. [Google Scholar] [CrossRef]
  17. Chen, Y.; Uchimura, T.; Irfan, M.; Huang, D.; Xie, J. Detection of Water Infiltration and Deformation of Unsaturated Soils by Elastic Wave Velocity. Landslides 2017, 14, 1715–1730. [Google Scholar] [CrossRef]
  18. Irfan, M. Elastic Wave Propagation through Unsaturated Soils Concerning Early Warning of Rain-Induced Landslides. Ph.D. Thesis, The University of Tokyo, Tokyo, Japan, 2014. [Google Scholar]
  19. Chen, Y. Changes in Elastic Wave Velocity in a Slope Due to Water Infiltration and Deformation. Ph.D. Thesis, The University of Tokyo, Tokyo, Japan, 2016. [Google Scholar]
  20. Ding, X.; Wang, Z.; Hu, G.; Liu, J.; Zhang, K.; Li, H.; Ratni, B.; Burokur, S.N.; Wu, Q.; Tan, J.; et al. Metasurface Holographic Image Projection Based on Mathematical Properties of Fourier Transform. PhotoniX 2020, 1, 16. [Google Scholar] [CrossRef]
  21. Akyol, E.; Erzin, E.; Tekalp, A.M. Robust speech recognition using adaptively denoised wavelet coefficients. In Proceedings of the IEEE 12th Signal Processing and Communications Applications Conference, Kusadasi, Turkey, 30 April 2004; pp. 407–409. [Google Scholar]
  22. Bhutada, G.G.; Anand, R.S.; Saxena, S.C. Edge Preserved Image Enhancement Using Adaptive Fusion of Images Denoised by Wavelet and Curvelet Transform. Digit. Signal Process. 2011, 21, 118–130. [Google Scholar] [CrossRef]
  23. Yang, H. Empirical Mode Decomposition and Its Application in Water Acoustics Signal Processing. Ph.D. Thesis, Northwestern Polytechnical University, Xi’an, China, 2015. [Google Scholar]
  24. Fan, Y.; Sun, J.; Chen, Q.; Wang, M.; Zuo, C. Adaptive Denoising Method for Fourier Ptychographic Microscopy. Opt. Commun. 2017, 404, 23–31. [Google Scholar] [CrossRef]
  25. Wang, Z.; Wan, F.; Wong, C.M.; Zhang, L. Adaptive Fourier Decomposition Based ECG Denoising. Comput. Biol. Med. 2016, 77, 195–205. [Google Scholar] [CrossRef]
  26. Jiang, S.; Hao, X. Hybrid Fourier-Wavelet Image Denoising. Electron. Lett. 2007, 43, 1081. [Google Scholar] [CrossRef]
  27. Ran, Q. Wavelet Transform and Fractional Fourier Transform Theory and Applications; Harbin Institute of Technology Press: Harbin, China, 2002. [Google Scholar]
  28. To, A.C.; Moore, J.R.; Glaser, S.D. Wavelet Denoising Techniques with Applications to Experimental Geophysical Data. Signal Process. 2009, 89, 144–160. [Google Scholar] [CrossRef]
  29. Li, L. A Study of Wavelet Analysis Method for Stress Wave Propagation in Viscoelastic Rod. Ph.D. Thesis, Southwest University of Science and Technology, Mianyang, China, 2015. [Google Scholar]
  30. Donoho, D.L. De-Noising by Soft-Thresholding. IEEE Trans. Inform. Theory 1995, 41, 613–627. [Google Scholar] [CrossRef] [Green Version]
  31. Don, D.L.; Johnstone, I.M. Ideal Spatial Adaptation by Wavelet Shrinkage. Biometrika 1994, 81, 425–455. [Google Scholar]
  32. Wenzhu, H.; Wentao, Z.; Tengkun, Z.; Fusheng, Z.; Fang, L. π-Phase-Shifted FBG for High-Resolution Static-Strain Measurement Based on Wavelet Threshold Denoising Algorithm. J. Lightwave Technol. 2014, 32, 4294–4300. [Google Scholar] [CrossRef]
  33. Wu, S.; Shen, Y.; Zhou, Z.; Lin, L.; Zeng, Y.; Gao, X. Research of Fetal ECG Extraction Using Wavelet Analysis and Adaptive Filtering. Comput. Biol. Med. 2013, 43, 1622–1627. [Google Scholar] [CrossRef]
  34. Zhang, Y.; Wei, S.; Deng, N.; Wang, W. Vibration Sensor Data Analysis Based on Wavelet Denoising. Comput. Sci. 2019, 46, 537–565. [Google Scholar]
  35. Liu, J.; Gao, W. Vibration Signal Analysis of Water Seal Blasting Based on Wavelet Threshold Denoising and HHT Transformation. Adv. Civ. Eng. 2020, 2020, 1–14. [Google Scholar] [CrossRef] [Green Version]
  36. Soltani, A.A.; Shahrtash, S.M. Decision Tree-based Method for Optimum Decomposition Level Determination in Wavelet Transform for Noise Reduction of Partial Discharge Signals. IET Sci. Meas. Technol. 2020, 14, 9–16. [Google Scholar] [CrossRef]
  37. Mallat, S. A Theory for Multiresolution Signal Decomposition-the Wavelet Representation. IEEE Trans. Pattern Anal. Mach. Intell. 1989, 11, 674–693. [Google Scholar] [CrossRef] [Green Version]
  38. Shi, M.; Zhang, J.; Zhu, X.; Zhang, X. A Method of Image Gauss Noise Filtering Based on PCNN. Comput. Appl. 2022, 22, 1–4. [Google Scholar]
  39. Shin, D.-H.; Park, R.-H.; Yang, S.; Jung, J.-H. Block-Based Noise Estimation Using Adaptive Gaussian Filtering. IEEE Trans. Consum. Electron. 2005, 51, 218–226. [Google Scholar] [CrossRef]
  40. Han, B.; Zhang, T. A Study on the Amplitude of Elastic Wave Transmission in Inhomogeneous Media. Trans. Beijing Inst. Technol. 2006, 26, 383–387. [Google Scholar]
  41. Cai, Y.-Q.; Ding, G.-Y.; Xu, C.-J. Amplitude Reduction of Elastic Waves by a Row of Piles in Poroelastic Soil. Comput. Geotech. 2009, 36, 463–473. [Google Scholar] [CrossRef]
  42. Wu, H.-X.; Zhang, X.-C.; Liu, Y. Assessment on Speed and Amplitude of Elastic Wave Propagation in Square-Packed Circular Honeycombs. J. Strain Anal. Eng. Des. 2021, 56, 18–28. [Google Scholar] [CrossRef]
  43. Liu, X.L.; Han, M.S.; Li, X.B.; Cui, J.H.; Liu, Z. Elastic Wave Attenuation Characteristics and Relevance for Rock Microstructures. J. Min. Sci. 2020, 56, 216–225. [Google Scholar] [CrossRef]
Figure 1. Diagram of wavelet decomposition.
Sustainability 14 12605 g001
Figure 2. Results of Heavy Sine signal processing.
Sustainability 14 12605 g002
Figure 3. Results of Bumps signal processing.
Sustainability 14 12605 g003
Figure 4. Results of Doppler signal processing.
Sustainability 14 12605 g004
Figure 5. The schematic of the model box: (a) 3D illustration, (b) scaled 2D model (mm).
Sustainability 14 12605 g005
Figure 6. Elastic wave denoising by the SD-5-WTD for 0 min.
Sustainability 14 12605 g006
Figure 7. The elastic wave of travel time and amplitude for 0 min. (The red line represents the first arrival point of the elastic wave).
Sustainability 14 12605 g007
Figure 8. Relationship between volumetric water content and elastic wave amplitude. (a) Time series data of volumetric water content and elastic wave amplitude; (b) the fitting curve of volumetric water content and elastic wave amplitude.
Sustainability 14 12605 g008
Table 1. Results of SNR and MSE for Heavy Sine signal denoising.
Denoising MethodSNRMSE
SD-2028.89000.0123
SD-522.56220.0528
WTD27.20850.0181
SD-5-WTD32.33930.0056
Table 2. Results of SNR and MSE for Bumps signal denoising.
Denoising MethodSNRMSE
SD-2020.16960.0311
SD-514.25780.1215
WTD15.16720.0985
SD-5-WTD21.81020.0213
Table 3. Results of SNR and MSE for Doppler signal denoising.
Denoising MethodSNRMSE
SD-2015.08850.00266
SD-527.96150.00014
WTD21.93640.00055
SD-5-WTD23.12330.00042
Publisher’s Note: MDPI stays neutral with regard to jurisdictional claims in published maps and institutional affiliations.