Article

Utilising MYTILUS for Active Learning to Compare Cumulative Impacts on the Marine Environment in Different Planning Scenarios

by
Ida Maria Bonnevie
1,*,
Henning Sten Hansen
1,
Lise Schrøder
1 and
Aurelija Armoškaitė
2
1
Department of Planning, Aalborg University, A.C. Meyers Vænge 15, 2450 Copenhagen SV, Denmark
2
Latvian Institute of Aquatic Ecology, Voleru Str. 4, LV-1007 Riga, Latvia
*
Author to whom correspondence should be addressed.
Sustainability 2022, 14(19), 12606; https://doi.org/10.3390/su141912606
Submission received: 9 August 2022 / Revised: 12 September 2022 / Accepted: 19 September 2022 / Published: 4 October 2022

Abstract

:
Spatial tools to calculate cumulative impact assessments on the environment (CIA) are important contributors to the implementation of an ecosystem-based approach to maritime spatial planning (MSP). Ecosystem dynamics are increasingly important to understand as the activities and pressures in marine areas increase. Results from the application of a new training set for the CIA tool MYTILUS, developed in capacity-building MSP projects for active learning environments, illustrate important points on how the CIA method can be used in systematic scenario design. The feedback from its use in an online PhD course outlines how the training set successfully enables researchers from different disciplines and different parts of the world to meet the CIA approach with such interest and understanding that it enables them to highlight the strengths as well as the shortcomings of the tool interface, tool capabilities, and CIA method, even when none of these researchers are CIA experts. These promising results are presented in this paper and advocate for the increasing use of MYTILUS and similar CIA tools in MSP stakeholder sessions where no preliminary CIA expertise can be expected. The key strengths and challenges of training CIA with MYTILUS are discussed to point out focus points for how to make its approaches increasingly fit for participatory and decision-making processes in MSP to utilise its promising abilities for supporting ecosystem-based management.

1. Introduction

The competition for marine space and the pressures on our ecosystems at sea are increasing due to rapidly expanding ocean activities and climate change dynamics [1]. Marine and coastal areas have become more industrialised and crowded with growing sectors such as renewable energy [2]. Climate change impacts the intensities and locations of future human activities, causes increasing conflicts due to its effects on marine ecosystem services, but also increases the need for adaptive management and planning at sea for solving conflicts between human activities [2], for ecological conservation, and for climate mitigation and adaptation [1]. Around the globe, marine spatial planning (MSP) has evolved within the last two decades as a new framework to plan our seas in holistic, integrative ways [3] whilst facing multiple challenges including not only climate change and ecological degradation but also transboundary, cross-country, stakeholder, and institutional integration challenges [4,5]. MSP is by definition an adaptive, cross-sectoral process which includes ecological, social, and economic objectives, stakeholder interests, and political and legal processes [6]. In Europe, this framework was implemented into law in 2014 with the Maritime Spatial Planning Directive (MSPD) which requires all coastal member states to plan their marine waters. The deadline was in March 2021 to have one or more maritime spatial plans in place for all EU marine areas [7]. Despite this deadline, MSP is an iterative and ongoing process, requiring maritime spatial plans to be updated regularly (at least every 10th year) and ensuring minimum requirements. Among other things, these minimum requirements include considering the environmental, economic, and social impacts of planning decisions, as well as considering risks and safety aspects, using the best available data in planning, including stakeholders in the process, cross-border cooperation, and applying an ecosystem-based approach [7], as defined in the Marine Strategy Framework Directive (MSFD) from 2008 [8]. The minimum requirements support each other in different ways. For example, the MSPD requirements for cross-border planning and best available data are highly relevant for understanding the dynamics of ecosystems in whole sea basins as part of an ecosystem-based approach [9]. The ecosystem-based approach requires human activities at sea to be planned in a way that allows for the use of ecosystem goods and services without causing cumulative impacts on the environment from human activities that are so severe that they destroy the capacity of the ecosystems to sustain themselves [10,11].
To balance the many different interests at stake in MSP and to find shared goals for the spatial plan, successful stakeholder inclusion is essential [12]. The MSPD does not setup any requirements regarding how to include stakeholders but highlights the need to select and include relevant stakeholders early in the MSP process [7]. The questions of who, why, how, and when to include different people remain highly important for any MSP process [13]. Benefits from including stakeholders in MSP consist, for example, of reaching support for MSP outcomes among sectors and locals, increasing stakeholder feelings of fairness and empowerment, finding shared goals and synergies in solutions, mobilising local, place-based, and qualitative knowledge, and facilitating transparency of MSP processes [2,13,14]. Spatial decision support tools (DSTs) are useful to utilize existing knowledge by presenting it on maps and to facilitate discussions among stakeholders in online and/or physical workshop settings. Spatial DSTs can enable politicians, planners, and stakeholders to present and discuss different evidence and planning scenarios with different environmental, socioeconomic, and cultural synergy–conflict outcomes of relevance for MSP processes [15]. Whether they are used in MSP depends on these tools being easily accessible, easily understandable, and not too resource demanding [16]. A comprehensive survey in the Baltic Sea region highlights the need among MSP practitioners for improved user guidelines and online training on how to use spatial DSTs [17]. With online tutorials and webinars, more users are likely to use the tools [18].
One type of spatial DST is CIA tools that can be used to calculate and visualise cumulative impact assessments (CIA) on maps, showing a weighted distribution of where the cumulative pressures from human activities to a lesser or higher degree affect ecosystem components [19]. CIA tools are very useful in assisting MSP at large planning scales with estimating pressures on ecosystem components based on best available knowledge and best available geographic data and have in Europe been included in Swedish MSP processes for which purpose the SYMPHONY CIA tool was developed [20]. They enable planners to choose planning scenarios with fewer environmental conflicts, discuss trade-offs between human use and protection, and implement an ecosystem-based approach [21]. Their planning scale depends on the quality and resolution of existing data, often resulting in larger case study areas with a rough spatial-temporal solution for such tools [22].
Collaboration projects across the European Sea basins have enabled capacity building and tools development to support the maritime spatial planning processes [23]. MYTILUS is an example of a newer CIA tool, the development of which was originally initiated by the needs in the Interreg NSR NorthSEE project (www.northsee.eu, accessed on 23 August 2022), where the need for a freely available CIA tool became obvious. SYMPHONY, for instance, was quite costly [20]. MYTILUS is also faster and more advanced than older CIA tools such as EcoImpactMapper [18]. MYTILUS has been further extended during the BONUS BASMATI project to include various tools for scenario building in addition to CIA to support MSP processes.
Pınarbaşı et al. (2017) [15] argued how “education and training should be a prerequisite to introducing a DST into the MSP process” and that the “importance of educating and training non-technical users, including marine planners and stakeholders may be underestimated by DST developers and advocates”, points supported by Schumacher et al. (2020) [17] who recommended the development of “user-friendly guidelines” for end-users in public authorities regarding applying spatial DSTs. This research presents the systematic building stones of a new MYTILUS training set developed for a workshop in December 2021 in the Interreg BSR Capacity4MSP project and tested as part of an online PhD course in January 2022 in the ERASMUS+ project Knowledge Flows in MSP in active learning environments. In the following chapter, the theory and methods are presented, followed by the results, discussion, and conclusions.

2. Materials and Methods

2.1. MYTILUS and Its Newest Improvements

MYTILUS is a CIA tool which is inspired by the widely cited CIA method developed by Halpern et al. (2008) [24]. The CIA method includes three types of data categories; spatial pressures from human activities, spatial ecosystem components, and expert-derived sensitivity scores that evaluate each pressures’ effect on each ecosystem component [24]. The main CIA mathematical formula, as adapted from Halpern et al. (2008) [24] in Hansen (2019) [21], is to calculate a spatial raster with the normalized distribution of the cumulative impacts (Ia) of each pressure (Pi)—out of n pressures—on each ecosystem component (Ej)—out of m ecosystem components—using each specific ecosystem-pressure sensitivity score (Ui,j) and applying an additive approach (a) of the multiplication results:
I a = i = 1 n j = 1 m P i × E j × u i , j
Other mathematical formulas that can be derived from the above include the removal of the ecosystem component element to calculate a cumulative pressure index that evaluates the additive average pressure impact and the removal of the pressure and sensitivity score elements to calculate an ecological diversity/complexity index—see in Hansen (2019) [21] for these formulas.
While spatial decision support tools need to be scientifically based and advanced enough to capture ecosystem complexity, they need at the same time to be transparent and simple enough to be understood and accepted by the targeted users [19]. It was an important priority in the design of MYTILUS to provide an intuitive, easy-to-learn interface and improve the usability found in other well-known CIA tools [21,25]. MYTILUS uses the Delphi 10.1 Integrated Development from Embarcadero5 to provide fast calculations to better support iterative explorations in MSP workshops. Furthermore, it is “freeware with full accessibility to the source code”, and its use of the ESRI ASCII raster data format ensures easy exchange of data back and forth between MYTILUS and traditional GIS software [21]. The easy access and easy usability of the tool is expected to improve the user interest and user experience of the tool.
Since the first versions of the MYTILUS tool described in Hansen (2019) [21] and Hansen and Bonnevie (2020) [25], the tool has been expanded with a new functionality that improves the support of planning scenario designs. More specifically, the tool now offers options to calculate statistics overall for the whole case area as well as for sub-areas. The statistics are shown in graphs with the relative distribution of pressures and the relative distribution of ecosystem components in the chosen (sub-)area. These graphs can be used to explore what pressures could potentially be interesting to target, and what ecosystem components could be interesting to protect, in a new planning scenario. The baseline scenario can then be copied, and the targeted pressures adjusted accordingly in the new scenario with a new function called ‘Adapt pressure’ that allows a pressure in a sub-area to be easily changed. The differences in the resulting cumulative impact maps of the two scenarios (baseline scenario vs. adapted scenario) can be visually compared with a new ‘Compare scenarios’ function. This compare-function locks the two scenario map windows to enable zooming in on specific sub-areas in both maps at the same time. In MSP, options for co-locating some activities, for example, offshore windfarms and aquaculture in close spatial temporal proximity also need to be considered for the purpose of optimising human uses of marine space, freeing more space for environmental and nature protection, and decreasing conflicts between ocean sectors [26]. MYTILUS therefore also includes scenario design facilities for exploring potential synergies and potential conflicts between different human activities, a setup not yet fully implemented in but preliminary designed in Hansen and Bonnevie (2020) [25]. The presented MYTILUS functionality is visualised in Figure 1, separated out depending on whether it was introduced in older MYTILUS versions or in the current version.

2.2. Current Data and Data Requirements

The design of MYTILUS was based on a Baltic Sea baseline scenario that includes spatial pan-Baltic Sea data from HELCOM Data and Map Service and uses ecosystem-pressure sensitivity scores derived from a comprehensive Baltic Sea expert survey. The data processing is presented and described in HELCOM (2017) [27], including descriptions of how spatial data of pressures such as, for example, physical disturbance, inputs of phosphorous, and extraction of cod are normalized on a scale from 0 to 100, how spatial data of ecosystem components such as, for example, coastal lagoons, reefs, and grey seal abundance are normalized or described with binary presence, and how the expert survey is carried out and validated against an external literature review. In total, 81 experts from nine Baltic Sea countries contributed to the expert survey with pressures vs. ecosystem component sensitivity score inputs ranked on a scale of ‘high’/’medium’/’low’ sensitivity and converted to a numeric scale from 0.0 (low sensitivity) to 2.0 (high sensitivity). The sensitivity scores were in this process checked for their expert-stated tolerance and recoverability scores to estimate a consistency level among the individual experts and checked for confidence level by considering the number of expert inputs per score and the variability among the obtained responses [27]. The final input scores are listed in table 8 in HELCOM (2017) [27]. The Baltic Sea region makes up a well-suited demonstration area, since the many international MSP projects that have taken place in this region have made the region a frontrunner regarding MSP process experience and case-based data [5]. Even though harmonised data are available for the whole Baltic Sea Region, the spatial-temporal resolution of this—particularly the temporal resolution—makes the data insufficient for actual MSP decisions [21]. However, the data were considered sufficient for training sessions to gain an overall impression of the ecosystem conditions in different sub-areas and the advantages and challenges of the CIA methodology. It is possible to update the data in MYTILUS and add data for other areas to expand the usability of MYTILUS, and thereby the calculations in the MYTILUS tool can be improved in the future following the improvements in data availability.

2.3. Development of the Training Set

A training set for learning when and how to apply MYTILUS was developed for a workshop on cumulative impacts assessments targeted experienced planners. The physical workshop took place at Aalborg University Copenhagen in December 2021 and was a part of a series of transnational workshops organised during the Capacity4MSP project with the aim of supporting the cross-sectoral dialogue within the MSP community. Due to the many COVID-19-related restrictions between 2020 and 2022 in Europe, only two national MSP planners were able to participate in the workshop. The training set was developed to include two exercises per workshop day, making up four exercises in total with a gradual introduction to MYTILUS and its Baltic Sea demonstration data. The first exercise ‘Maps and Data’ focused on exploring examples of the spatial input maps of the distribution of individual ecosystem components and individual pressures in the Baltic Sea. It was based on the necessity of understanding the input data before one can understand the outputs [28]. The second exercise ‘Impacts’ focused on calculating the different CIA indexes and explore the spatial outputs of cumulative impacts. The visual explorations were supplemented with explorations of statistical graphs for the relative distribution of pressures and of ecosystem components in the Baltic Sea overall and in some of its sub-areas. The third exercise ‘alternative scenario’ focused on copying the existing scenario and adapting it to pose a ban of sprat fishing in the Bornholm Basin to explore the effects on the cumulative impacts for this specific sub-area. The fourth exercise ‘use-use interactions’ focused on exploring spatial patterns of potential conflicts and potential synergies between activities, based on methodology presented in Bonnevie et al. (2020) [29]. A key principle of the synergy–conflict methodology is to additively add up expert-derived conflict-synergy scores for pairwise combinations of activities in the same area [29].
The informal written and oral feedback received from the workshop participants was largely positive, stating the intention of the participants to continue discussing the topic of cumulative impacts and explore the CIA method further and the motivation to do something similar for their home country, likely using MYTILUS. Based on this feedback, the exercises were adjusted to become part of the course material for an online PhD course as part of the winter school in the Erasmus+ project Knowledge Flows in MSP in January 2022 taking place at Aalborg University, a university known for its own learning model called the AAU model based on principles for Problem Based Learning (PBL principles). Following the AAU model, students are encouraged to work actively and collaboratively with authentic, real-world problems of relevance outside of academia in practical, theoretical, and potentially cross-disciplinary ways. The AAU model follows constructivist education theory to promote student-centred, active learning rather than teacher-centred learning [30]. These active learning attributes of using real-world cases and demanding a high reflection level are visible in the adjustments that were made to the training set through the addition of multiple reflective questions with the answers to these being required to be provided through PhD course deliverables, one per exercise. The reflective character of the questions and thus of the exercises and deliverables is revealed through the use of verbs from the highest or next-highest level of ‘evaluation’ in Bloom’s Taxonomy [31], for example, including the words ‘compare’, ‘assess’, ‘explain’, and ‘present arguments’. The PhD students were encouraged to use the online Microsoft Teams forum to discuss with each other and the teachers regarding the purposes of the assignments as well as their results. Written feedback was received from the seven PhD students that participated in the course. The PhD course was initially intended to be a physical course, which was announced almost a year before through the Knowledge Flows in MSP network and through a webpage listing all officially announced PhD courses in Denmark (https://phdcourses.dk/, accessed on 23 August 2022). Due to the COVID-19 pandemic, the course was postponed several times, and finally transformed into the digital setting and announced as an online course. Seven is quite a few respondents, although the relatively low number of participants might be related to the field of MSP being new and upcoming compared to coastal and terrestrial spatial planning [32], but also to the fact that the topics of the course are quite technical. The PhD participants came from different parts of the world with various backgrounds, with different levels of knowledge of and/or experience with MSP as well as less and more GIS-technical and/or CIA-technical experience. Although the PhD students were allowed to choose their own sub-area to mainly focus on in the exercises and potentially provide a closer link to their own working areas and PhD interests for a higher motivation level, the sub-area called the Bornholm basin—included as the focus sub-area in the Capacity4MSP workshop—demonstrates well the flow of the exercises.

3. Results

3.1. Maps and Data

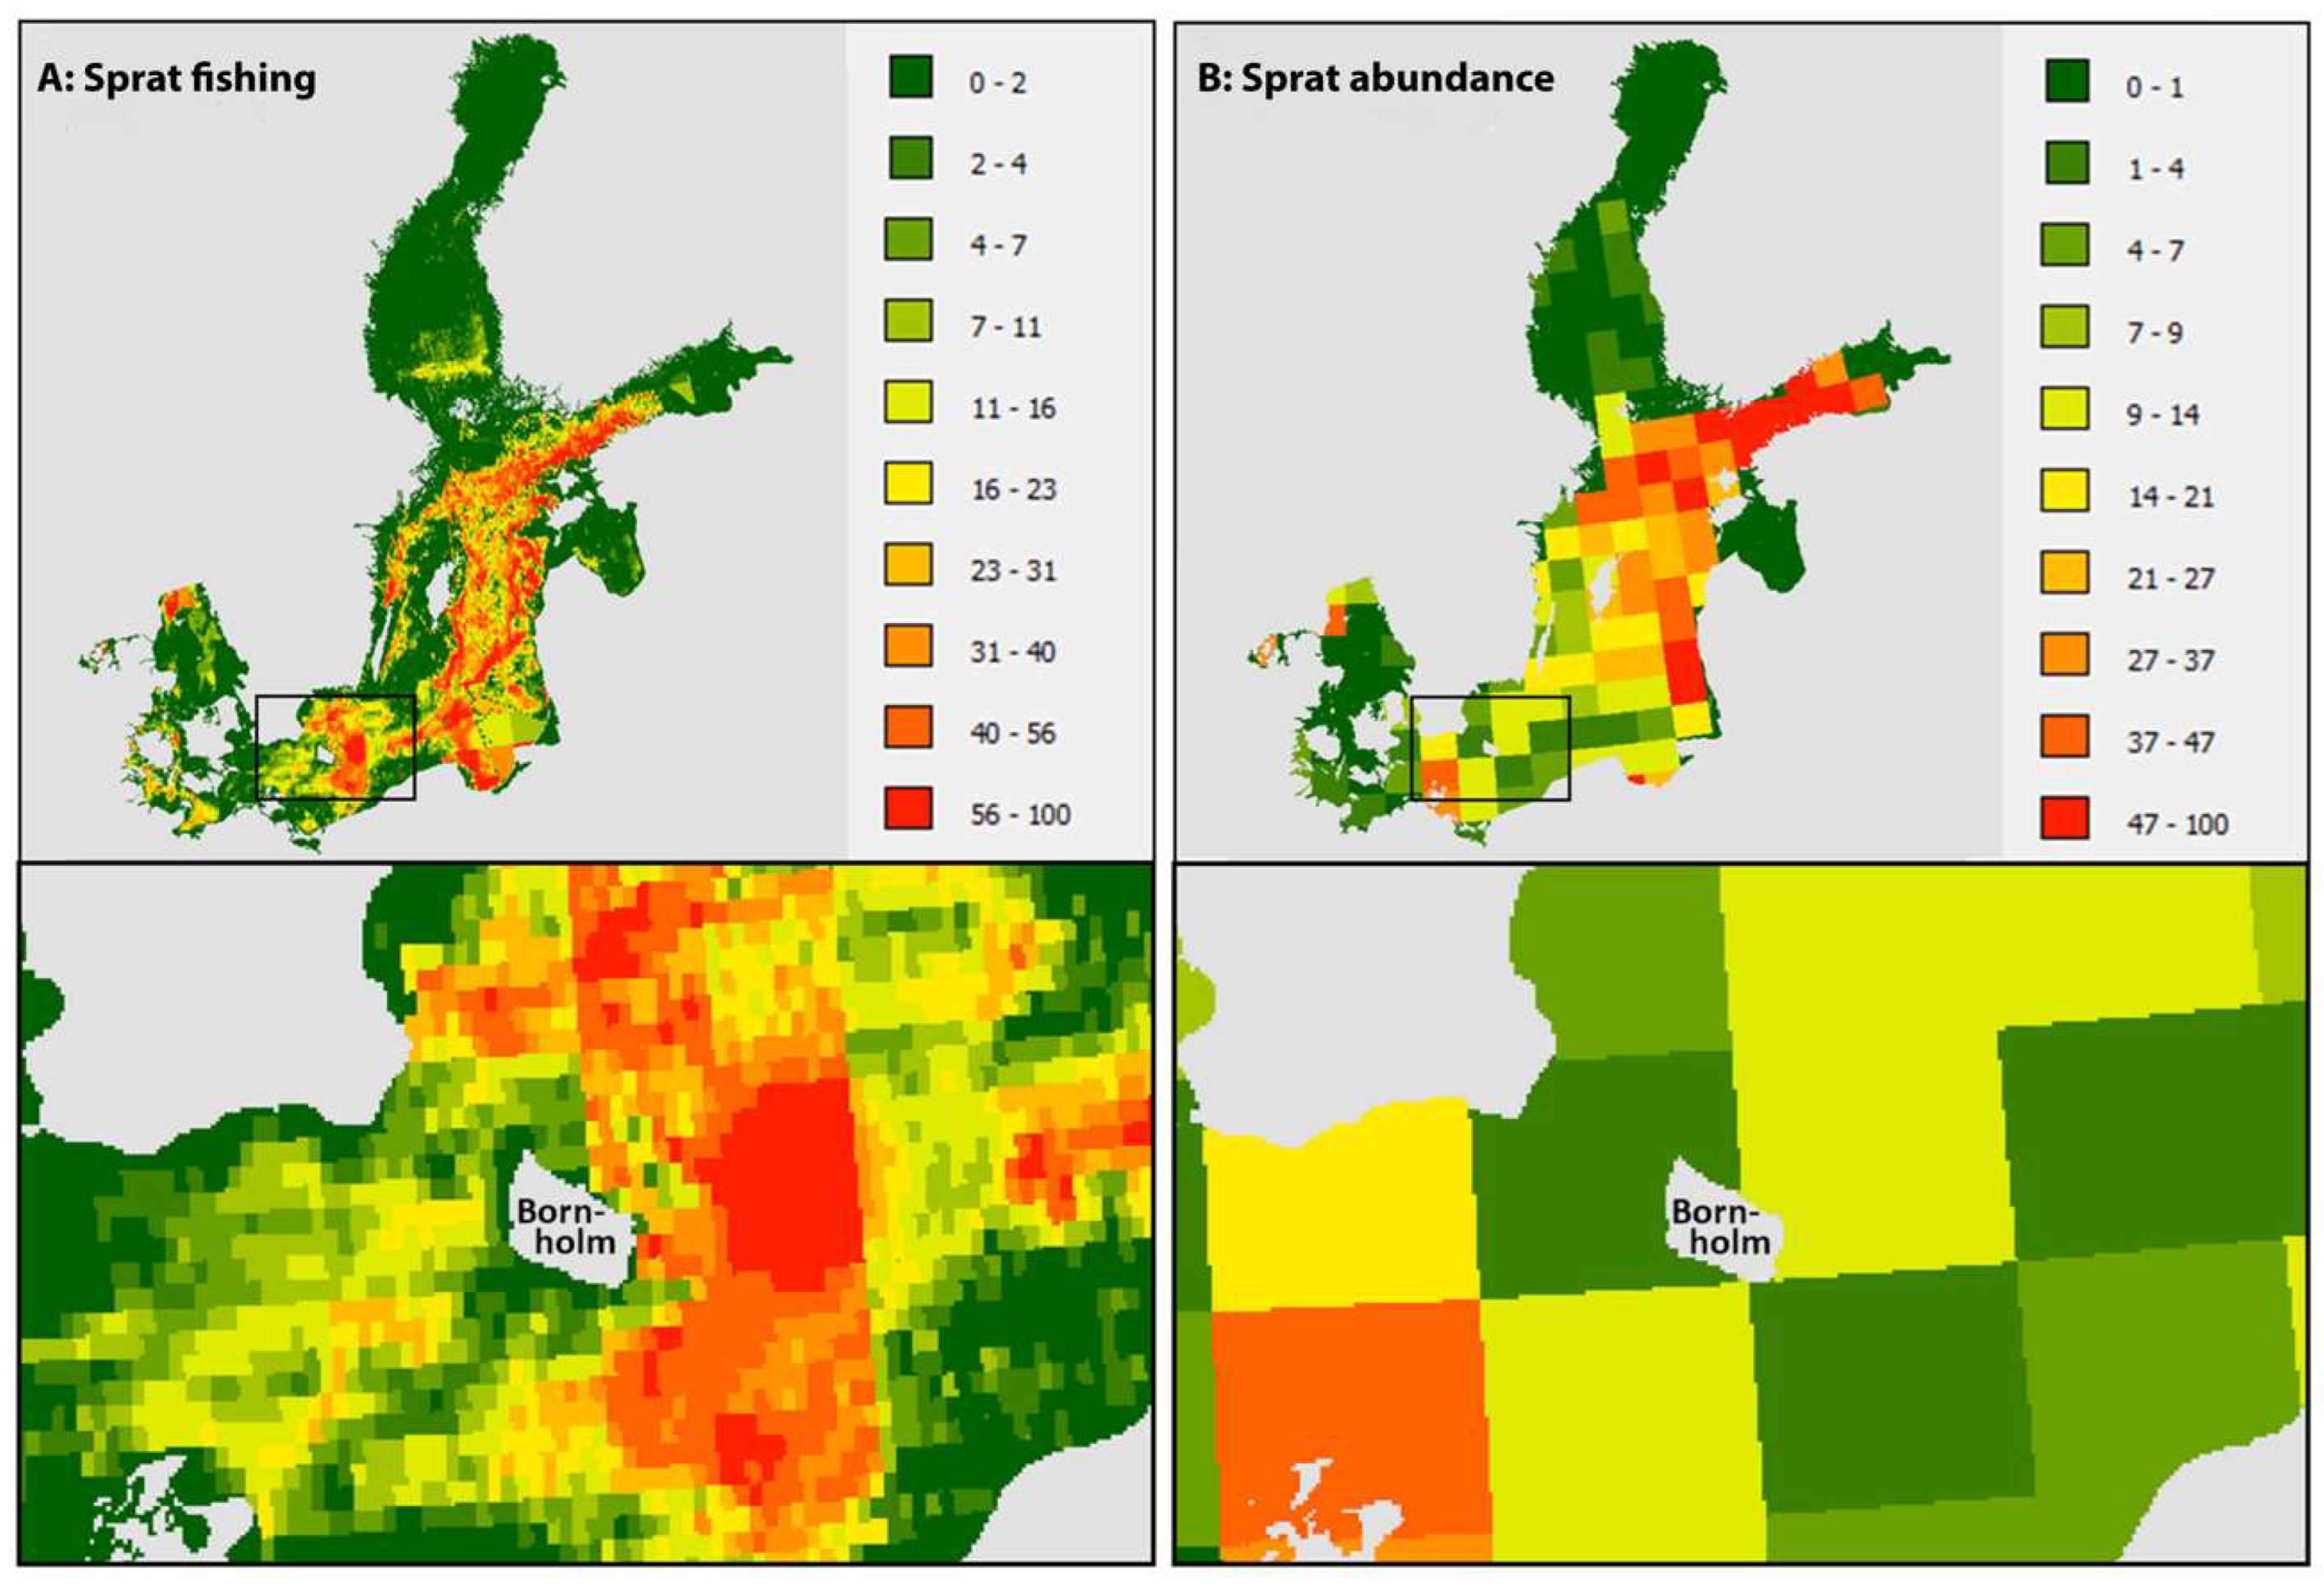
Each individual ecosystem component and individual pressure layer can be explored visually. Zooming in on the Bornholm Basin indicates whether that ecosystem component or pressure layer is particularly present in this area. For example, the pressure of sprat fishing (see Figure 2A) and the ecosystem component of sprat abundance (see Figure 2B) were highly present in the Bornholm Basin. Sprat abundance was particularly high northeast and southwest of Bornholm, and sprat fishing took place to a high degree east of Bornholm with an overlap of the area with high sprat abundance. The sensitivity matrix was also possible to view from the MYTILUS interface, showing a score distribution from 0 to 20.

3.2. Impacts

The cumulative impact distribution based on the additive CIA approach is presented in Figure 3A. The highest impact was observed in the southern Baltic Sea, the southern coast of Finland, and at the Swedish coast from Stockholm towards the south. A zoom to the Bornholm Basin showed lower cumulative impacts close to the Bornholm coastline. However, a little east from Bornholm, a relatively large ‘red’ area was present with a high cumulative impact.
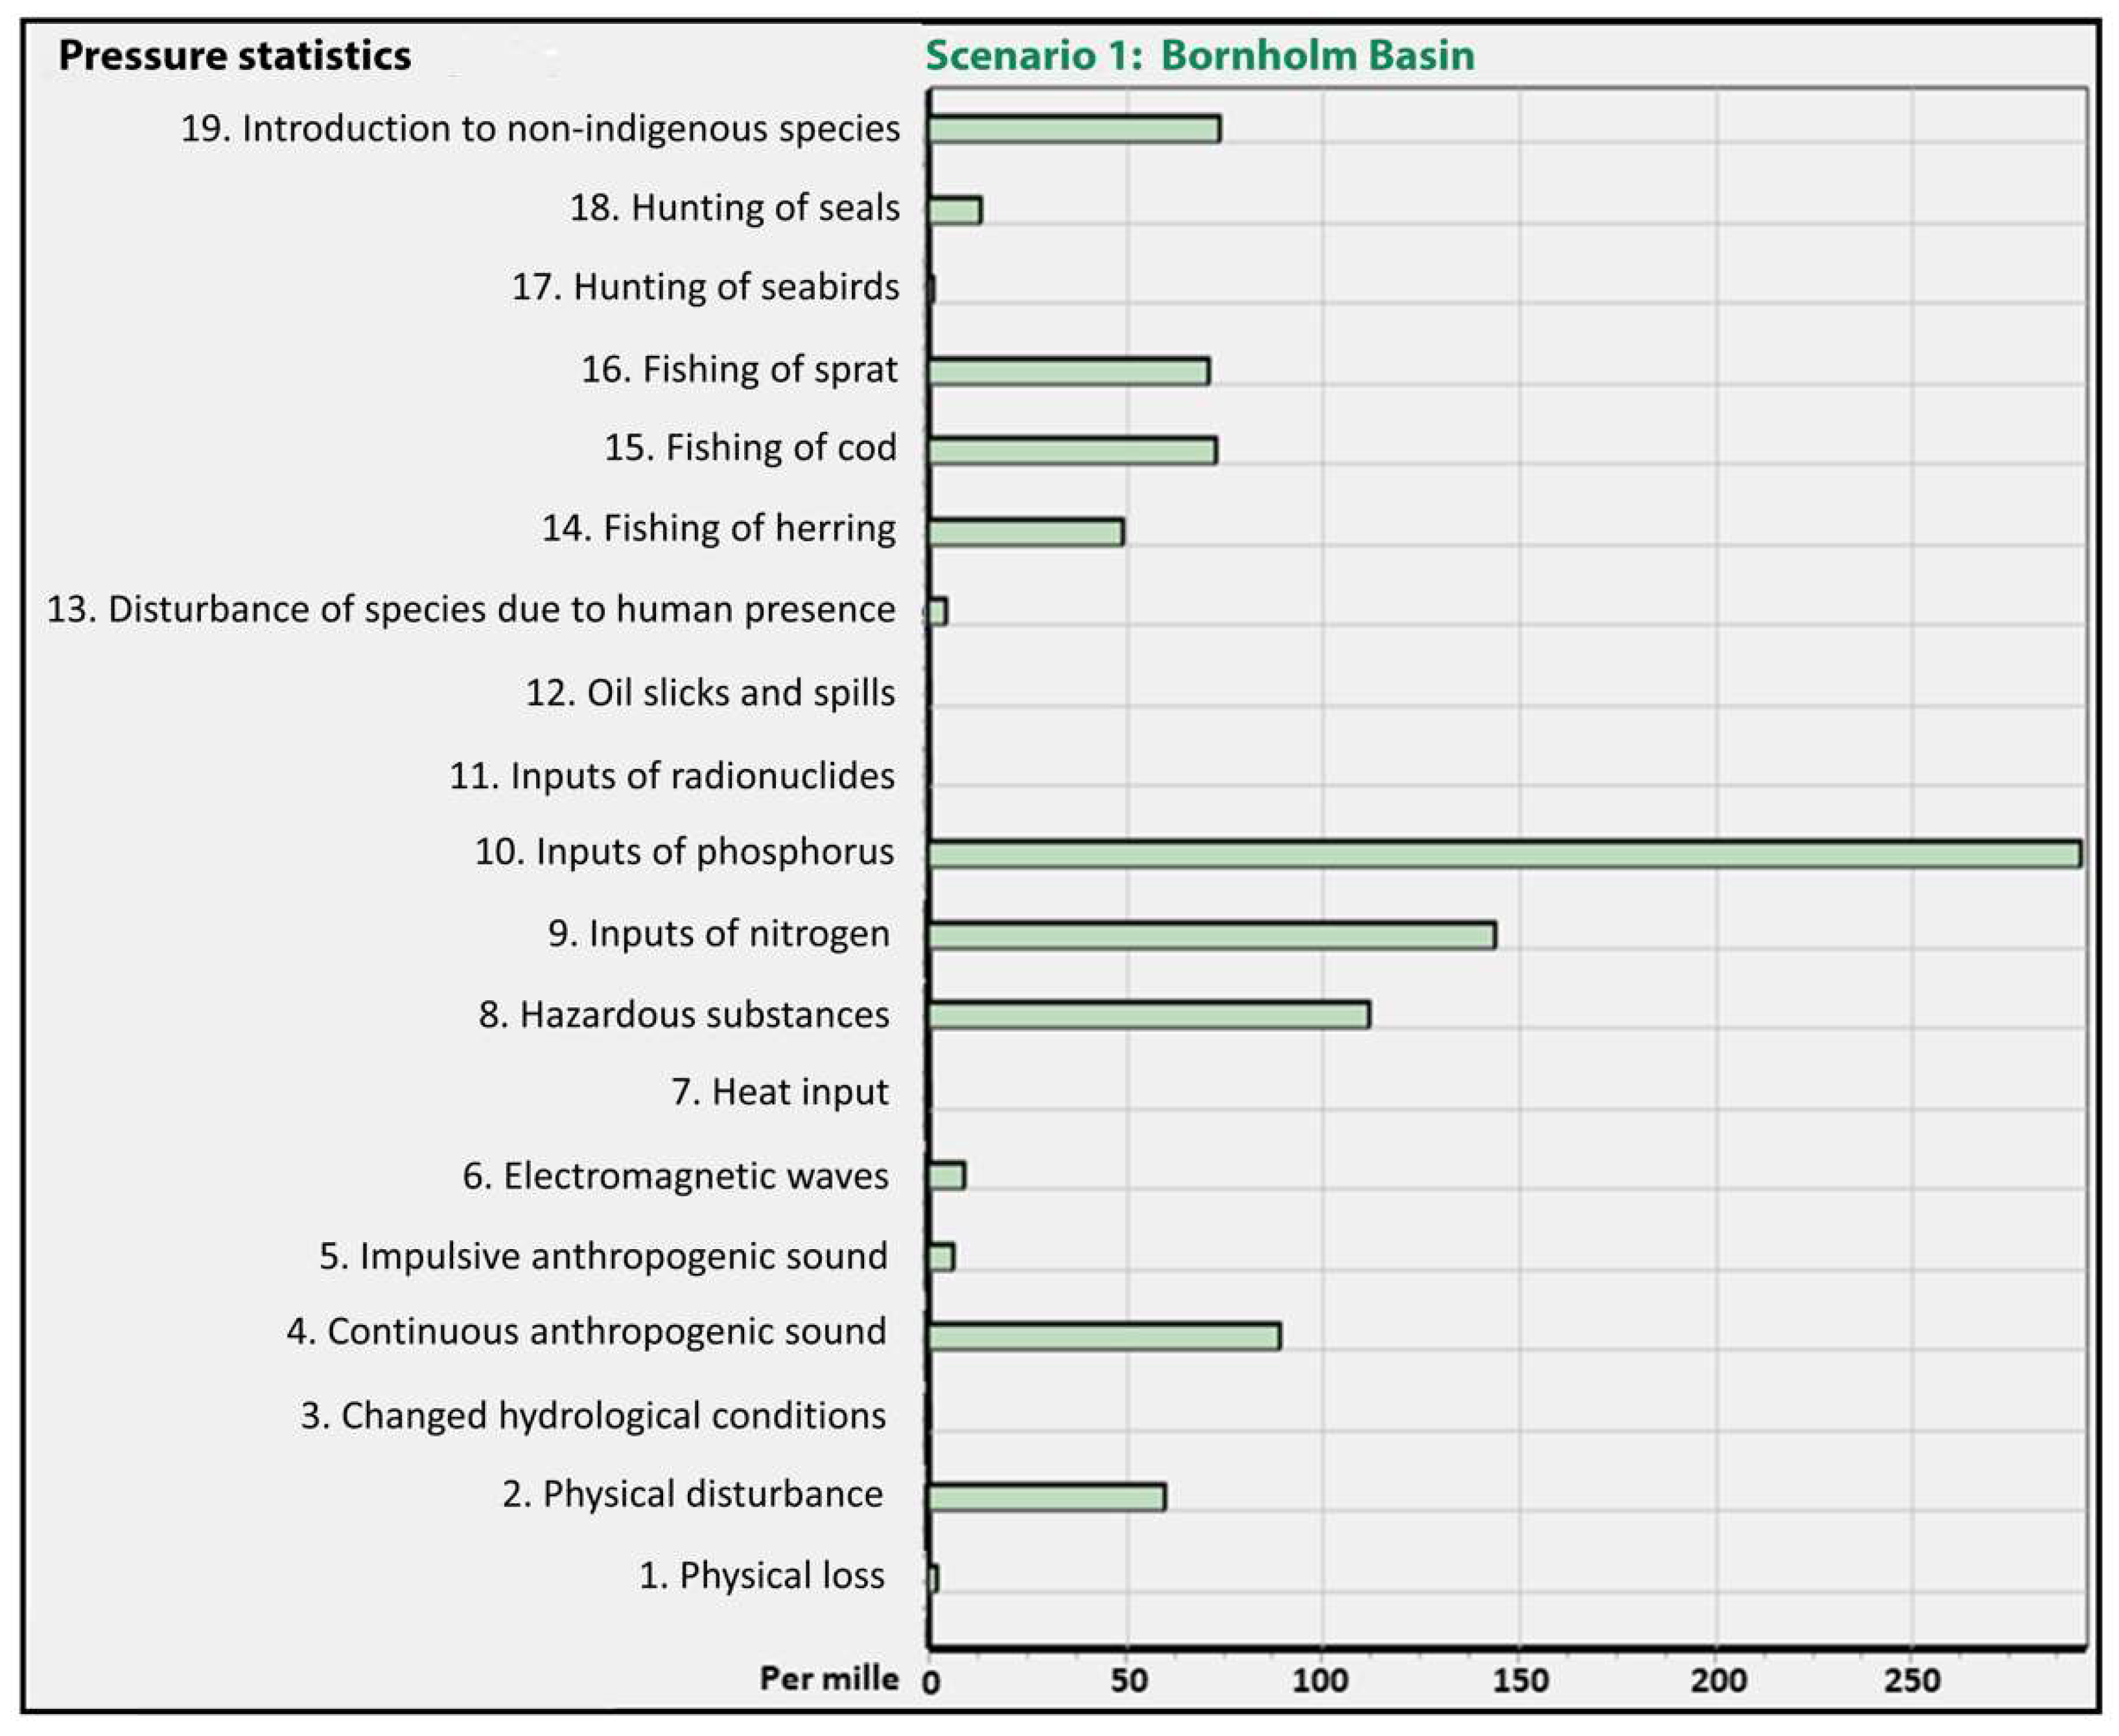
By browsing a map over the maximum pressure, as presented in Figure 3B, which pressure contributed most to the cumulative impact in each raster cell could be identified. The brown colour which represents phosphorous dominated a larger share of the Baltic Sea, but the main sources of phosphorous were inland activities such as agriculture and households. A zoom to the Bornholm Basin showed a turquoise spot east of the island which represented sprat fishing. Sprat fishing was thus not only highly present near Bornholm but was even the maximum pressure in an area east of Bornholm. However, the pressure statistics for the Bornholm Basin in Figure 4 showed that sprat fishing was not the only pressure in this area. In fact, phosphorous and nitrogen with mostly land-based sources were the main contributors to the cumulative impact for this area. Such an impact diagram in this way showed more detail in relation to the pressure–ecosystem relationship.

3.3. Alternative Scenario

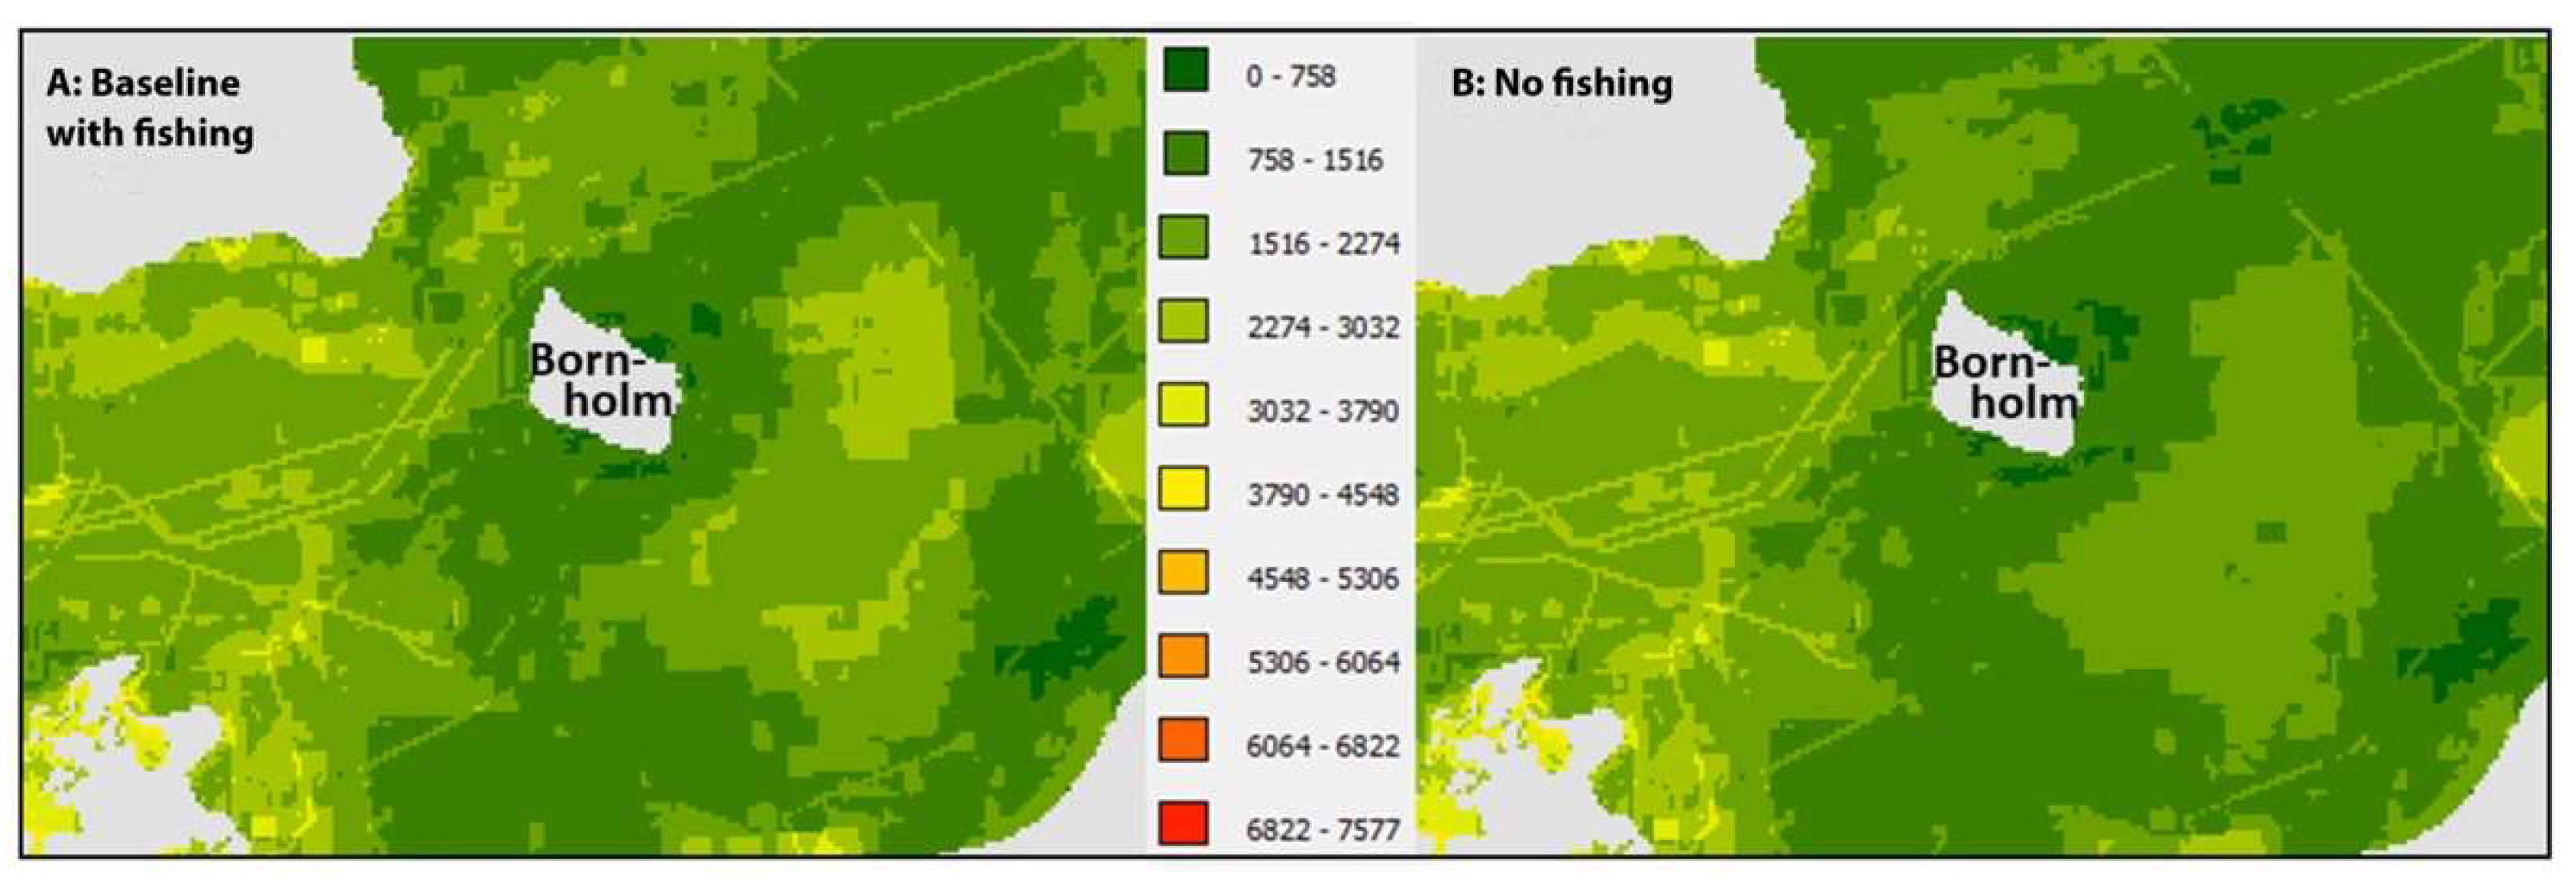
Sprat plays an important role in the Baltic Sea ecosystem and food-web; however, it is also one of the main commercial fish species [33]. Restricting sprat fishing can be a maritime spatial planning means to lowering the cumulative impact in the Bornholm basin. To assess the effect of reducing sprat fishery, an alternative scenario was developed by copying the baseline scenario. With the ‘adapt pressure’ functionality, the pressure coming from the sprat fishery can be reduced in the alternative scenario—in this case it was set to zero. Zero represents that sprat fishery would be forbidden in this area. To assess the overall effect of the reduction in sprat fishery, the cumulative impact was recalculated. The pressure statistics revealed how the impact score was thereby reduced for the Bornholm Basin. This was also visible when comparing the cumulative impacts map of the two scenarios for the Bornholm Basin, as shown in Figure 5A,B, where the cumulative impacts were remarkably lower (more “green”) after sprat fishing had been banned.

3.4. Use–Use Interactions

The use–use interaction map in Figure 6 shows that there were certain areas with potential synergies between different human uses/activities near Bornholm, for example, close to the Bornholm coastline as well as in some of the sprat fishing area. These synergy areas could be explored for the potential to create multi-use constellations that could optimise the use of space to save space elsewhere for ecosystem protection among other things [29].

4. Discussion of Strengths and Weaknesses

Despite the number of respondents being low, the written feedback from the PhD students provided valuable insights into the strengths and challenges regarding how to utilise the MYTILUS tool as an advanced decision support tool in the MSP processes for enabling capacity building and mutual learning within the cross-cultural and interdisciplinary MSP community, drawing on an active learning setting. PhD students are not representative of all end-users of CIA tools. In fact, in the surveys presented in Schumacher et al. (2020) [17], only researchers and not end-users from public authorities expressed a demand for DSTs to increasingly cover ecosystem-based management. Schumacher et al. (2020) [17] pointed out a potential reason for this, which was that the concept of ecosystem-based management has only recently been adopted in newer, holistic legislation and policy documents. The authors did, however, notice an increasing mentioning of this concept in recent policy documents and therefore, they soon expect to see an increasing awareness for the needs to include such complex analyses in scientific, systematic tool approaches among end-users in public authorities [17]. Thus, the feedback from PhD researchers from multiple disciplines and cultures on the training set presented here could thereby be argued to provide useful insights on the further road to improve the integration of CIA into actual MSP through learning-based participatory processes, despite PhD researchers not being representative of all end-users in society.

4.1. Expressed Strengths of MYTILUS—Related to the Training Design

The feedback from the PhD students clearly demonstrated that the training set was useful in increasing knowledge on ecosystem dynamics. For example, one PhD student wrote “I better understand the cumulative impacts”, and another wrote “learning how to interpret and assess impacts […] has also been very insightful”, and a third wrote “This visualisation process has given me a deeper understanding of many abstract concepts” and “the courage to learn ecosystem modelling”. A fourth wrote that MYTILUS “can […] generate a better understanding of what is happening and why it is happening”. Overall, the MYTILUS training set thus seemed to successfully present the CIA approach and MYTILUS in a positive light, increasing the knowledge on ecosystem dynamics. The strong visual communication of MYTILUS through graphs and maps—reflected in the strong use of maps and visuals in the training set as well—was clearly viewed as an advantage.
The increased understanding might very well be linked to the positive feedback on high usability with sentences such as “MYTILUS itself was a tool rather easy to learn”, “impressed by the setup”, “a well-developed tool”, “user-friendly interfaces”, and “most people can follow”. One PhD student even recommended MYTILUS for MSP-related participatory processes: “could well also be applied into participatory processes to promote the engagement of the different MSP stakeholders/actors while favouring reaching consensus among them” and others claimed MYTILUS to be relevant for political decision-making: “[MYTILUS] can be especially helpful for political decision makings” and “can have positive impacts on the information out-flow for political decision-makers”. The fast calculations of MYTILUS might play an important role for this praise of the usability of MYTILUS. As Bagstad et al. (2013) [34] stated, a tool should not take too long to run, since it would make it unsuitable for interactive stakeholder sessions. The training set was successful in communicating the user-friendly aspects of MYTILUS, since it utilised the iterative strengths of the fast MYTILUS calculations to explore systematic changes to overall patterns and sub-statistics.
Furthermore, users need to understand how to use a tool—as well as what it does—to avoid viewing it as a “black box” where its processing steps cannot be followed [28]. It seemed to be easy to follow the steps of the MYTILUS training set: “seeing how to use these assessment tools to both gain knowledge of certain areas, but also, interpret it for new areas, have been highly useful”, and another wrote how MYTILUS: “helped me to imagine MSP scenarios that could guide planning responses beyond the symptoms and towards the root causes of the socioecological system’s issues”. Thus, the training set seemed to have succeeded in providing a learning flow that was easy to follow where inputs were explored before the spatial outputs, and spatial outputs were linked to more detailed sub-statistics. As one PhD participant wrote, “the course delivery encouraged active participation” through which all participants were able to find the course relevant for their research, as they all evaluated the course to be relevant or very relevant for their own PhD project.
Another strength of MYTILUS that was highlighted in the feedback of the training set was the successful implementation of multiple tools: “impressed by […] how you have implemented various tools to systematise such challenging layers as different pressure and ecosystems” and “The integration of all […] tools (and each of them separately too) looks like a relatively easy way forward to translate complex and wicked issues into more affordable planning terms”. This fits well with the need stated in Pınarbaşı et al. (2017) [15] for “integrated and multi-functional tools” to support MSP processes. According to Pınarbaşı et al. (2017) [15], limited functionality of spatial DSTs is one of the main reasons for the infrequent use of them in MSP processes. The training set in this way managed to successfully integrate various functionalities of MYTILUS—including cumulative impacts, spatial scenario adaptation, and multi-use potentials—into a systematic training flow, embracing the need for beginning the road towards more integrative tools, tool presentations, and training setups.

4.2. Expressed Challenges of MYTILUS—Related to the Training Design

A challenge from applying the active and student-oriented learning environment to the development of this training design was the required dedication needed to understand and apply the training material. Some PhD participants found the material to be a bit too resource-demanding but also rewarding regarding the results. For example, one wrote “I had to spend some time understanding the material, but once I had the key points, I found it interesting and not too difficult” and another wrote that the material was “easy to follow, but also challenging”. The PhD participants expressed a need for discussions among each other and with the teachers as well as options to ask questions and provide feedback to support the learning process, but they also evaluated the time dedicated to this to be sufficient. For example, one participant highlighted how there was “enough time for us to ask questions and give feedback” and another praised the “timely discussions on our tasks” and stated how it “really helped us a lot to follow the course”. Such discussions were enabled by the technical inclusion of the online Microsoft Teams forum to host oral discussions, indicating the relevance of such an online communication platform to enable timely/immediate academic exchanges across the world to reach active, collaborative learning as part of an online learning environment. Despite the successful perception of the amount of time distributed for collaborative support, the feedback indicated that active learning requires time for dedication which makes dedication time an important condition for allowing such learning material to foster knowledge.
Despite the apparent, overall success of the MYTILUS training set in providing an easy-to-follow flow and appreciated understanding of the complex topic of ecosystem dynamics, the topic complexity posed some difficulties. One PhD student pointed out how the CIA approach does not consider horizontal neighbour interactions across raster cells: “the effects concerning distance are not considered”. Another remark on the simplicity of the approach was how “it would be nice to include more [biological] levels and try to construct the ecosystem in a more complex and realistic way”. A PhD student pointed out how there was no proven cause–effect relationships between spatial patterns for which reason the MYTILUS setup requires difficult investigations of cause-effect relationships of the inputs and linkages: “one does not know why the ecosystems adjust unless one goes into the baseline and analyse the cause-effect relationships”. While these comments pose some requested improvements of MYTILUS, they also demonstrate how the training set managed to communicate important limitations of MYTILUS. Understanding not only the usefulness of a tool but also its limitations, demonstrates an important overview of the scope of the learning, here acquired through applying the training set to a research-inspired planning area and focus of own choice.
The different requests for more complexity in the methods were closely tied to requests for a better resolution of the spatial-temporal data: “In terms of temporal measures and spatial variance, more complex baseline data is needed to achieve a real-life scenario of ecosystem responses”. Three of the PhD students directly requested seasonal data to be included to cover seasonal changes. A PhD student, for example, expected “more severe changes” “during the summer month” “which affect the ecosystems and their service supplies”, all “relevant for important tipping points”. However, as one PhD student pointed out, improvements in data details “might not be easy because it also depends on the available data.” One PhD student suggested how “having a direct connection with the ongoing projects would create a more efficient and detailed way of having a good baseline of data”. A challenge from using project-dependent data is the dependency on often time-consuming harmonisation processes to harmonise data for the whole study area—in this case: The Baltic Sea region—which is needed for the data to be comparable across the area in focus [15].
The findings here indicate that for a training set to be fully successful in encouraging the use of a spatial decision support tool such as MYTILUS, the training setup needs to be more easily transferable to other spatial areas and spatial scales, when users—such as these PhD students—come from outside the tool case study area and/or need different spatial-temporal detail levels. The high requirements in for the CIA data quality from both the spatial-temporal data and the expert-derived sensitivity scores complicates the process of transferring MYTILUS to other geographic areas than the Baltic Sea [27]. A solution to the challenge in finding data could be to iteratively include the best available data and allow for user inputs to the data through a mixed-method approach as suggested in Koski et al. (2021) [16]. In this process, the uncertainty of data is a necessity to deal with and communicate to the users, due to the complexity of the CIA method that deals with socio-ecological interactions through an ecosystem-based approach to planning [16]. As one PhD participant points out, it needs to be considered whether the varying uncertainty of the datasets and the uncertainty overall can be communicated better in the training set without complicating the MYTILUS setup too much: “to improve the communication of uncertainty for the operationalisation of the ecosystem-based approach into MSP”.

5. Conclusions

The MYTILUS training set presented here was developed through capacity-building MSP projects and tested among PhD students with different backgrounds and expertise. Future research with testing of the training material among more respondents could advantageously provide further inputs to support these first impressions of applying MYTILUS in an online active learning environment. The findings demonstrate how an online training set applied as part of an active learning environment can bring together users from different parts of the world. None of the PhD students were CIA experts, but the training set provided them with knowledge to point out strengths of MYTILUS, of the CIA approach, and of the training set as well as some important challenges to MYTILUS and its data.
Important strengths of the training set design consist of its online format to bring discussions across disciplines and cultures and its abilities to utilise the strong visual communication of MYTILUS by including to a high degree its graphs and maps, the iterative setup from the fast tool calculations, potential options for adapting the material content to own area of research, and a systematic, easy-to-follow structure of the training set starting with exploring input data before outputs and providing a tight connection between spatial patterns and sub-statistics. Additionally, the training set feedback demonstrated the need to combine multiple functionalities in tools and training materials for more integrative planning. These characteristics could be relevant goals for spatial DST training materials to follow.
At the same time, a training set needs to target the important challenges that MYTILUS—similarly to other spatial DSTs, are facing. Challenges exist for spatial DSTs and their training materials to improve their inclusion into actual MSP and reaching end-users and practitioners. An active learning approach can increase the perception of relevancy of the methods among users including planners and stakeholders, but such an approach requires dedication time and thus resources to enable learning. The findings here point towards the need for spatial DSTs to increase the support of spatial-temporal data with seasonal changes, improve ecosystem complexity management, and improve the transferability to other spatial areas than what the example datasets cover by including functionality for users to add their own data to the calculations, amongst other things. Flexibility of tools and user choices followed by clear guiding material might enable MSP planners and stakeholders to see the necessity for spending their valuable time to apply scientific tools and approaches.
Based on the insights of this paper, some recommendations for developing spatial DSTs training material are the following:
  • Make strong use of visuals such as maps and statistics, make use of fast calculations, and amplify user-friendly aspects of the tool interface;
  • Consider the learning flow where inputs are explored before spatial outputs, and spatial outputs are linked to more detailed sub-statistics, and where the tasks build on top of each other in a systematic way;
  • Combine multiple tool approaches to support an integrative tool setup;
  • Enable time and technical setups for engaging with the material alone and as part of cross-student online discussions, especially for complicated tasks, to enable students to actively find strengths and limitations of the approaches and data;
  • Allow for user inputs to the data and for students to link the material to their own research.
The development of MYTILUS will continue to expand its tool portfolio to input better data over time and to expand the ecosystem methodology to account for its complexity. In close future, such improvements will include the addition of methods for ecosystem service assessments to better consider the full scale of ecosystem components as well as the values attached to these by humans. This is to strengthen the link within MYTILUS to human activities and human wellbeing. This is one of the key routes for further development of MYTILUS, as humans are causing the pressures but also benefitting from the ecosystems, and such links need more focus in scenario design and MSP. With improved scenarios, methods, capacity-building, and active learning material for cross-sectoral and ecosystem-based planning, we can move towards better futures for our ecosystems and seas in more inclusive ways that utilise participatory and active learning processes.

Author Contributions

Conceptualization, I.M.B., H.S.H., L.S. and A.A.; Methodology, I.M.B., H.S.H., L.S. and A.A.; Software, H.S.H.; Validation, I.M.B., H.S.H., L.S. and A.A.; Formal analysis, I.M.B., H.S.H., L.S. and A.A.; Investigation, I.M.B.; Resources, I.M.B., H.S.H., L.S. and A.A.; Data curation, I.M.B., H.S.H. and A.A.; Writing—original draft preparation, I.M.B.; Writing—review and editing, I.M.B., H.S.H., L.S. and A.A.; Visualization, I.M.B. and H.S.H.; Supervision, I.M.B., H.S.H., L.S. and A.A.; Project administration, I.M.B., H.S.H., L.S. and A.A.; Funding acquisition, H.S.H. and L.S.. All authors have read and agreed to the published version of the manuscript.

Funding

This research has partly been carried out within the Capacity4MSP project co-funded by the European Regional Development Fund of the the European Union through the INTERREG Baltic Sea Region 2014–2020 programme (Project number C009)) and partly within the Knowledge Flows in MSP project funded by the Erasmus+ Programme of the European Union (Project number KA203-2019-011).

Institutional Review Board Statement

Not applicable.

Informed Consent Statement

Informed consent was obtained from all subjects involved in the study and their responses have been anonymised.

Data Availability Statement

The PhD feedback is confidential data and thus not published. The training set makes up study material that belongs to the material portfolio of Aalborg University. We plan to soon create a webpage to make the MYTILUS software available for download. Meanwhile, a copy of the MYTILUS software can be acquired by contacting Professor Henning Sten Hansen at Aalborg University Copenhagen: [email protected].

Acknowledgments

In addition to the acknowledgement of the projects that have made this research possible (see Funding), many thanks to the Capacity4MSP partners providing valuable inputs for the current research.

Conflicts of Interest

The authors declare no conflict of interest. The funders had no role in the design of the study; in the collection, analyses, or interpretation of data; in the writing of the manuscript; or in the decision to publish the results.

References

  1. Santos, C.F.; Agardy, T.; Andrade, F.; Calado, H.; Crowder, L.B.; Ehler, C.N.; García-Morales, S.; Gissi, E.; Halpern, B.S.; Orbach, M.K.; et al. Integrating climate change in ocean planning. Nat. Sustain. 2020, 3, 505–516. [Google Scholar] [CrossRef]
  2. Kyriazi, Z. From identification of compatibilities and conflicts to reaching marine spatial allocation agreements. Review of actions required and relevant tools and processes. Ocean. Coast. Manag. 2018, 166, 103–112. [Google Scholar] [CrossRef]
  3. Ntona, M.; Morgera, E. Connecting SDG 14 with the other Sustainable Development Goals through marine spatial planning. Mar. Policy 2018, 93, 214–222. [Google Scholar] [CrossRef]
  4. Santos, C.F.; Agardy, T.; Andrade, F.; Crowder, L.B.; Ehler, C.N.; Orbach, M.K. Major challenges in developing marine spatial planning. Mar. Policy 2021, 132, 103248. [Google Scholar] [CrossRef]
  5. Moodie, J.R.; Kull, M.; Morf, A.; Schrøder, L.; Giacometti, A. Challenges and enablers for transboundary integration in MSP: Practical experiences from the Baltic Scope project. Ocean. Coast. Manag. 2019, 177, 1–21. [Google Scholar] [CrossRef]
  6. Ehler, C.; Douvere, F. Marine Spatial Planning: A step-by-step approach toward ecosystem-based management. In Intergovernmental Oceanographic Commission and Man and the Biosphere Programme; IOC Manual and Guides; UNESCO: Paris, France, 2009; pp. 1–99. [Google Scholar]
  7. EC. Directive 2014/89/EU Establishing a framework for maritime spatial planning. 2014. Available online: https://eur-lex.europa.eu/legal-content/EN/TXT/PDF/?uri=OJ:L:2014:257:FULL&from=PT (accessed on 23 August 2022).
  8. EC. Directive 2008/56/EU Establishing a framework for community action in the field of marine environmental policy (Marine Strategy Framework Directive). 2008. Available online: https://eur-lex.europa.eu/legal-content/EN/TXT/?uri=celex%3A32008L0056 (accessed on 23 August 2022).
  9. Jay, S.; Alves, F.L.; O’Mahony, C.; Gomez, M.; Rooney, A.; Almodovar, M.; Gee, K.; de Vivero, J.L.S.; Gonçalves, J.M.S.; Fernandes, M.d.L.; et al. Transboundary dimensions of marine spatial planning: Fostering inter-jurisdictional relations and governance. Mar. Policy 2016, 65, 85–96. [Google Scholar] [CrossRef]
  10. Hassler, B.; Blažauskas, N.; Gee, K.; Luttmann, A.; Morf, A.; Piwowarczyk, J.; Saunders, F.; Stalmokaitė, I.; Strand, H.; Zaucha, J. New generation EU directives, sustainability, and the role of transnational coordination in Baltic Sea maritime spatial planning. Ocean. Coast. Manag. 2019, 169, 254–263. [Google Scholar] [CrossRef]
  11. Borja, A.; Elliott, M.; Andersen, J.H.; Berg, T.; Carstensen, J.; Halpern, B.S.; Heiskanen, A.-S.; Korpinen, S.; Lowndes, J.S.S.; Martin, G.; et al. Overview of Integrative Assessment of Marine Systems: The Ecosystem Approach in Practice. Front. Mar. Sci. 2016, 3. [Google Scholar] [CrossRef] [Green Version]
  12. Morf, A.; Moodie, J.; Gee, K.; Giacometti, A.; Kull, M.; Piwowarczyk, J.; Schiele, K.; Zaucha, J.; Kellecioglu, I.; Luttmann, A.; et al. Towards sustainability of marine governance: Challenges and enablers for stakeholder integration in trans-boundary marine spatial planning in the Baltic Sea. Ocean. Coast. Manag. 2019, 177, 200–212. [Google Scholar] [CrossRef]
  13. Saunders, P.F.; Gilek, M.; Tafon, R. Adding People to the Sea: Conceptualizing Social Sustainability in Maritime Spatial Planning. In Maritime Spatial Planning: Past, Present, Future; Zaucha, J., Gee, K., Eds.; Palgrave McMillan: London, UK, 2019. [Google Scholar]
  14. Gee, K.; Kannen, A.; Adlam, R.; Brooks, C.; Chapman, M.; Cormier, R.; Fischer, C.; Fletcher, S.; Gubbins, M.; Shucksmith, R.; et al. Identifying culturally significant areas for marine spatial planning. Ocean. Coast. Manag. 2017, 136, 139–147. [Google Scholar] [CrossRef]
  15. Pınarbaşı, K.; Galparsoro, I.; Borja, Á.; Stelzenmüller, V.; Ehler, C.N.; Gimpel, A. Decision support tools in marine spatial planning: Present applications, gaps and future perspectives. Mar. Policy 2017, 83, 83–91. [Google Scholar] [CrossRef]
  16. Koski, C.; Rönneberg, M.; Kettunen, P.; Armoškaitė, A.; Strake, S.; Oksanen, J. User experiences of using a spatial analysis tool in collaborative GIS for maritime spatial planning. Trans. GIS 2021, 25, 1809–1824. [Google Scholar] [CrossRef]
  17. Schumacher, J.; Bergqvist, L.; van Beest, F.M.; Carstensen, J.; Gustafsson, B.; Hasler, B.; Fleming, V.; Nygård, H.; Pakalniete, K.; Sokolov, A.; et al. Bridging the Science-Policy Gap—Toward Better Integration of Decision Support Tools in Coastal and Marine Policy Implementation. Front. Mar. Sci. 2020, 7, 587500. [Google Scholar] [CrossRef]
  18. Stock, A. Open source software for mapping human impacts on marine ecosystems with an additive model. J. Open Res. Softw. 2016, 4, 1–7. [Google Scholar] [CrossRef] [Green Version]
  19. Menegon, S.; Depellegrin, D.; Farella, G.; Sarretta, A.; Venier, C.; Barbanti, A. Addressing cumulative effects, maritime conflicts and ecosystem services threats through MSP-oriented geospatial webtools. Ocean. Coast. Manag. 2018, 163, 417–436. [Google Scholar] [CrossRef] [Green Version]
  20. Hammar, L.; Molander, S.; Pålsson, J.; Crona, J.S.; Carneiro, G.; Johansson, T.; Hume, D.; Kågesten, G.; Mattson, D.; Törnqvist, O.; et al. Cumulative impact assessment for ecosystem-based marine spatial planning. Sci. Total Environ. 2020, 734, 139024. [Google Scholar] [CrossRef]
  21. Hansen, H.S. Cumulative impact of societal activities on marine ecosystems and their services. Lect. Notes Comput. Sci. LNCS 2019, 11621, 577–590. [Google Scholar] [CrossRef]
  22. Watts, M.E.; Ball, I.R.; Stewart, R.S.; Klein, C.J.; Wilson, K.; Steinback, C.; Lourival, R.; Kircher, L.; Possingham, H.P. Marxan with Zones: Software for optimal conservation based land- and sea-use zoning. Environ. Model. Softw. 2009, 24, 1513–1521. [Google Scholar] [CrossRef] [Green Version]
  23. Depellegrin, D.; Hansen, H.S.; Schrøder, L.; Bergström, L.; Romagnoni, G.; Steenbeek, J.; Gonçalves, M.; Carneiro, G.; Hammar, L.; Pålsson, J.; et al. Current status, advancements and development needs of geospatial decision support tools for marine spatial planning in European seas. Ocean. Coast. Manag. 2021, 209, 105644. [Google Scholar] [CrossRef]
  24. Halpern, B.S.; Walbridge, S.; Selkoe, K.A.; Kappel, C.V.; Micheli, F.; D’Agrosa, C.; Bruno, J.F.; Casey, K.S.; Ebert, C.; Fox, H.E.; et al. A global map of human impact on marine ecosystems. Science 2008, 319, 948–952. [Google Scholar] [CrossRef]
  25. Hansen, H.S.; Bonnevie, I.M. A toolset to estimate the effects of human activities in maritime spatial planning. Lect. Notes Comput. Sci. LNCS 2020, 12252, 521–534. [Google Scholar] [CrossRef]
  26. Klinger, D.H.; Eikeset, A.M.; Davíðsdóttir, B.; Winter, A.; Watson, J.R. The mechanics of blue growth: Management of oceanic natural resource use with multiple, interacting sectors. Mar. Policy 2018, 87, 356–362. [Google Scholar] [CrossRef]
  27. HELCOM. The Assessment of Cumulative Impacts Using the BSPI [Baltic Sea Pressure Index] and the BSII [Baltic Sea Impact Index]—Supplementary Report to the First Version of the HELCOM ‘State of the Baltic Sea’ Report. 2017. Available online: https://stateofthebalticsea.helcom.fi/about-helcom-and-the-assessment/downloads-and-data/ (accessed on 9 August 2022).
  28. Collie, J.S.; Adamowicz, W.L.V.; Beck, M.W.; Craig, B.; Essington, T.E.; Fluharty, D.; Rice, J.; Sanchirico, J.N. Marine spatial planning in practice. Estuar. Coast. Shelf Sci. 2013, 117, 1–11. [Google Scholar] [CrossRef]
  29. Bonnevie, I.M.; Hansen, H.S.; Schrøder, L. SEANERGY—A spatial tool to facilitate the increase of synergies and to minimise conflicts between human uses at sea. Environ. Model. Softw. 2020, 132, 104808. [Google Scholar] [CrossRef]
  30. Servant-Miklos, V. Problem-oriented Project Work and Problem-based Learning: “Mind the gap!”. Interdiscip. J. Probl.-Based Learn. 2020, 14. [Google Scholar] [CrossRef]
  31. Stanny, C.J. Reevaluating Bloom’s Taxonomy: What Measurable Verbs Can and Cannot Say about Student Learning. Educ. Sci. 2016, 6, 37. [Google Scholar] [CrossRef] [Green Version]
  32. Schupp, M.F.; Bocci, M.; Depellegrin, D.; Kafas, A.; Kyriazi, Z.; Lukic, I.; Schultz-Zehden, A.; Krause, G.; Onyango, V.; Buck, B.H. Toward a common understanding of ocean multi-use. Front. Mar. Sci. 2019, 6, 1–12. [Google Scholar] [CrossRef]
  33. Bossier, S.; Palacz, A.P.; Nielsen, J.R.; Christensen, A.; Hoff, A.; Maar, M.; Gislason, H.; Bastardie, F.; Gorton, R.; Fulton, E.A. The Baltic Sea Atlantis: An integrated end-to-end modelling framework evaluating ecosystem-wide effects of human-induced pressures. PLoS ONE 2018, 13, e0199168. [Google Scholar] [CrossRef] [Green Version]
  34. Bagstad, K.J.; Semmens, D.J.; Waage, S.; Winthrop, R. A comparative assessment of decision-support tools for ecosystem services quantification and valuation. Ecosyst. Serv. 2013, 5, e27–e39. [Google Scholar] [CrossRef]
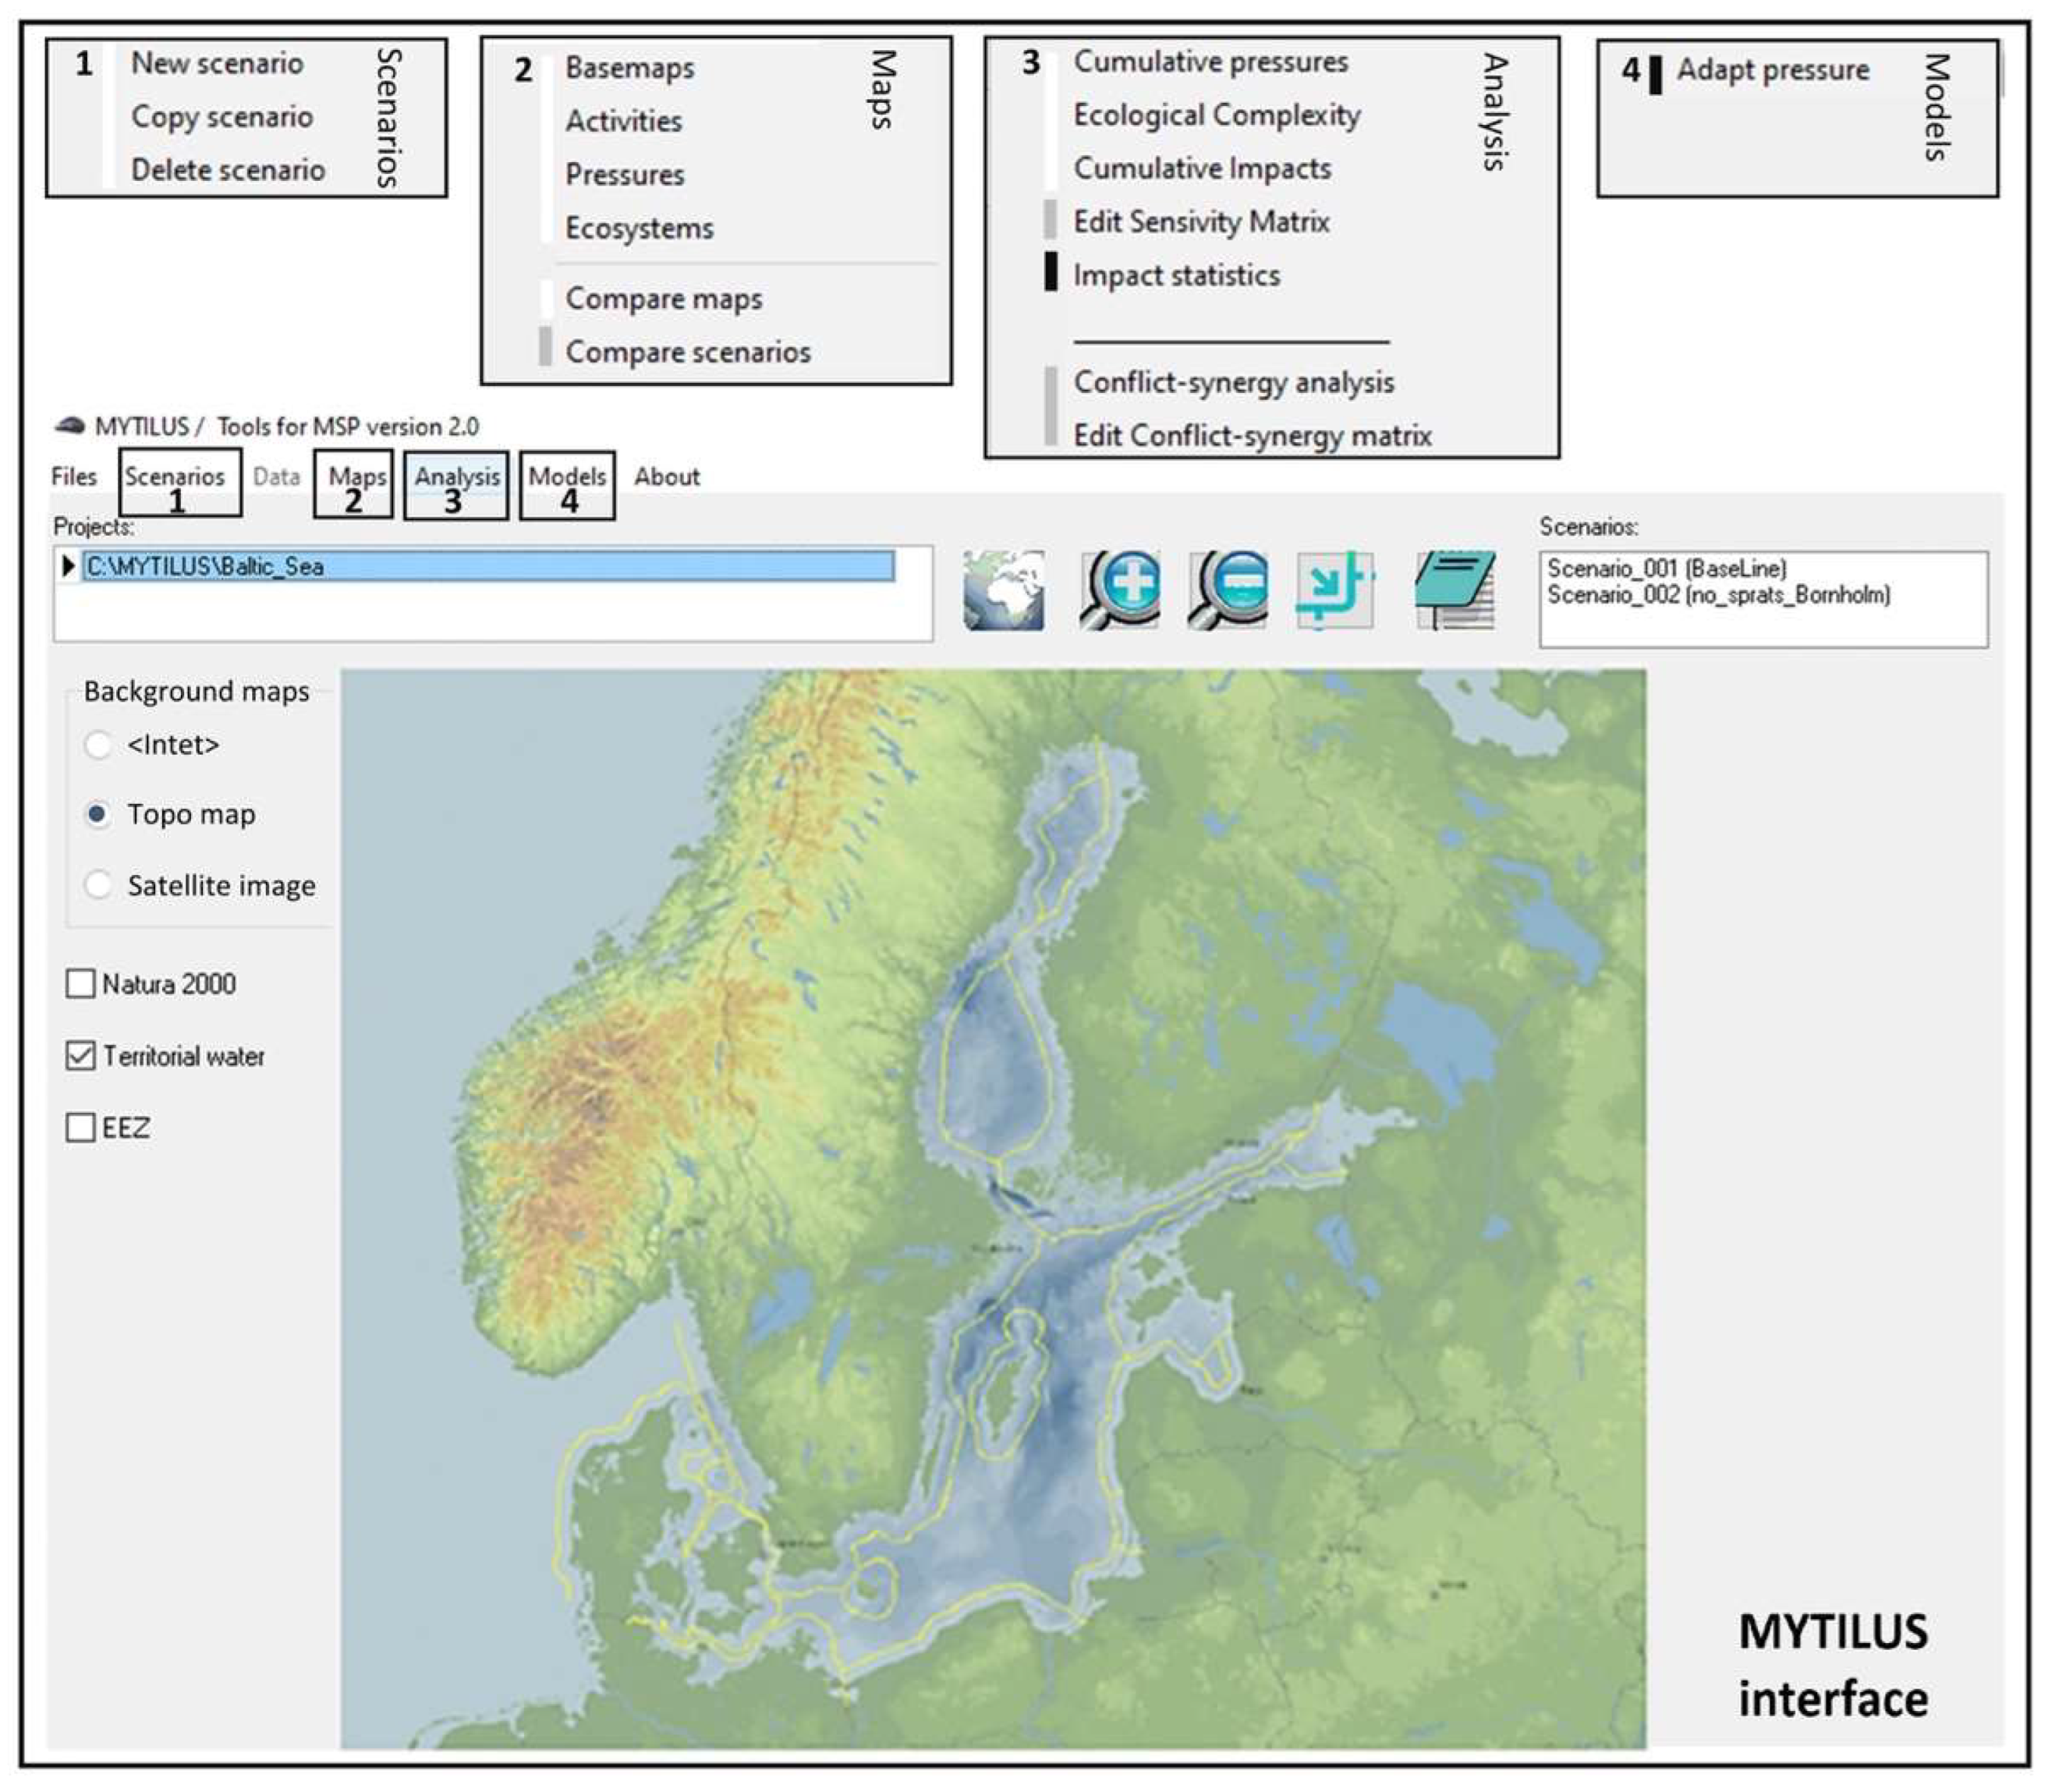
Figure 1. MYTILUS interface with its list of four different functionality groups: (1) Scenario, (2) Maps, (3) Analysis, and (4) Models. The functionalities with white-coloured squares were introduced in Hansen (2019) [21]. The functionalities with grey-coloured squares were preliminarily designed in Hansen and Bonnevie (2020) [25] but implemented as part of this paper. The functionalities with black-coloured squares are introduced in this paper.
Sustainability 14 12606 g001
Figure 2. (A) Quantile classification of sprat fishing normalized on a scale from 0 to 100 in the pan-Baltic Sea and Bornholm surroundings; (B) Quantile classification of sprat abundance normalized on a scale from 0 to 100 in the pan-Baltic Sea and Bornholm surroundings.
Sustainability 14 12606 g002
Figure 3. (A) Quantile classification of additive cumulative impacts of all pressures on all ecosystem components in the pan-Baltic Sea and Bornholm surroundings; (B) maximum pressure in each raster cell in the pan-Baltic Sea and Bornholm surroundings.
Sustainability 14 12606 g003
Figure 4. Pressure statistics for the Bornholm Basin.
Sustainability 14 12606 g004
Figure 5. Scenario comparison of additive cumulative impacts of all pressures on all ecosystem components in the Bornholm surroundings, shown with an equal classification method; (A) Baseline scenario with fishing; (B) New scenario with no fishing.
Sustainability 14 12606 g005
Figure 6. Potential conflicts (negative scores) and potential synergies (positive scores) between marine human uses in the Bornholm surroundings.
Sustainability 14 12606 g006
Publisher’s Note: MDPI stays neutral with regard to jurisdictional claims in published maps and institutional affiliations.