1. Introduction
In the past, humankind has made efforts to increase productivity in a limited resource situation and to improve the quality of life through the output. As part of that effort, labor and capital were used to increase productivity to lead economic growth [
1]; however, the world is now changing in the direction of inducing innovation and developing the economy based on knowledge [
2]. Knowledge can be not only a key factor to develop the economy, but it can also be a core resource of firms. Therefore, it is very important to transfer knowledge to the firm and to make the best use of it, and the supply of this knowledge can improve the quality of decision-making and the performance of firms. The global economy has shifted to a knowledge-based economy where knowledge plays a crucial role in economic activities [
3]. According to the OECD definition, the knowledge-based economy refers to an economy that is based on the creation, diffusion and utilization of knowledge and information [
4]. In a knowledge-based economy, knowledge is emphasized in all processes of value creation for the sustainable growth of firms. With a paradigm shift caused by the emergence of the knowledge-based economy, the importance of knowledge services (KSs) is increasing in innovation research. In general, KSs are defined as services that provide tangible and intangible knowledges for business operation of other companies or public institutions [
5]. The term knowledge-intensive business service (KIBS) is widely used in the literature instead of KS. Miles emphasized that KIBSs carry out economic activities that induce the generation, accumulation, or diffusion of knowledge [
6].
There are several definitions of KIBS in previous literatures. Muller and Doloreux defined a KIBS as a firm that has high levels of differentiated knowledge and routinely provides services to other firms or institutes [
7]. According to Bettencourt et al., KIBSs refer to major value-added activities consisting of accumulating, creating, or disseminating knowledge to develop customized services or product solutions tailored to customer needs [
8]. Hertog defined a KIBS as a firm that relies on expertise related to a particular area to provide knowledge-intensive business services [
9]. Hipp defined a KIBS as a firm with the ability to absorb external knowledge and convert it into a service that is useful to customers along with the company’s technology base [
10]. Most researchers defined a KS as a company which provides external knowledge to customers for their sustainable growth. However, in our study, Bettencourt’s definition of KSs has been adopted.
In the age of the knowledge economy, there is so much information that it is difficult to understand issues and make decisions. This phenomenon is called information overload [
11,
12]. According to Speier et al., as decision-makers have significantly limited cognitive processing capabilities, information overload is likely to lead to a degradation in decision quality [
12]. It has been difficult for executives of small and medium-sized enterprises (SMEs) to make proper decisions due to information overload [
13]. Therefore, it is necessary for SMEs to utilize external knowledge sources as an open innovation strategy to contribute to the business performance, such as increasing profits, reducing costs, increasing exports, and increasing employment. KISTI (Korea Institute of Science and Technology Information), which is a public research institute of South Korea, provides various KSs to maximize the business performance of SMEs. KISTI’s KSs consist mainly of data analysis systems, consulting services and communities. SMEs can obtain industry and market information, perform technology valuations and explore promising business items in the data analysis system. Through consulting services, SMEs can introduce external knowledge sources and find opportunities relating to technology, markets, patents, and commercialization. In addition, KISTI establishes and operates various communities for industry–academic cooperation. In these cooperative communities, SMEs can discover key information that can affect business performance.
The objective of our study is to elucidate the effect of KSs on organizational performance by using the concept of balanced scorecards (BSCs) and to find valuable insights into business operations for the sustainable growth of firms. BSCs are a traditional management tool to consider both non-financial and financial perspectives of organizational performances [
14,
15,
16]. The concept of BSCs was first suggested by Kaplan and Norton, who took previous performance metrics and adapted them by including the non-financial information [
14]. BSCs involve measuring four main aspects of a business: learning and growth (LG), internal business processes (IBP), customers (CUS), and finance (FP). The LG perspective is used to identify intangibles that can be used as an important strategy for the sustainable growth of firms. The goal of this perspective is to identify which professions (human capital), which systems (information capital), and which organizational state (organizational capital) are needed in order to deliver a value proposition to customers and shareholders [
17,
18]. The IBP perspective focuses on the technique or procedure that the organization should utilize and excel at for implementing desired products or services [
18]. This perspective aims to identify innovation and operating processes to create the customer value proposition and to improve the quality of internal operating processes [
17]. The CUS perspective concentrates on the relationship of an organization and its customers including customer profitability, customer satisfaction, new customer acquisition, and customer retention that are regarded as drivers of revenue growth in firms [
17,
19]. This perspective is very important as it helps organizations achieve financial performances by linking their operating processes with customers [
20]. The FP perspective refers to the tangible outcomes in traditional financial terms [
21] and uses generic accounting indicators that have been widely used in the past to evaluate the financial situation of a company [
22]. The most commonly used indicators include revenue growth, profit margin, cash flow, operating income, return on equity (ROE), economic value added (EVA), return on investment (ROI) and so on [
19].
Most of the studies, including our previous ones, preferred to address the financial aspects of organizational performance. This is because financial performance is regarded as the representation of the ultimate goal that firms should achieve for their sustainable growth. However, non-financial performance also should be considered to deepen the insights of the effect of KSs on organizational performance. Our study, when considering the effect of KSs on organizational performance, confirmed what kinds of non-financial performances were achieved as an intermediate stage of organizational performance before reaching financial performance as a final goal.
The achievement of organizational performances of firms is closely related to the sustainable growth of firms. CEOs or senior executives have the greatest interest in the sustainable growth of firms, and for this purpose, they should think about where to focus the firm’s capabilities in order to achieve organizational performances. Our study addressed crucial factors to consider for the sustainable growth of firms. In addition, a management strategy based on the BSC framework was suggested by developing a causal relationship between the four BSC perspectives: LG, IBP, CUS and FP. This study will provide various insights that can be helpful for the sustainable growth of firms, including the introduction of KSs as an open innovation strategy.
The following sections are composed of literature reviews, methods, results and discussion, and a conclusion. The next section presents the overview of previously reported literatures and the suggested hypotheses. Then, our methodology is introduced, the empirical results are provided, and key insights are discussed. Finally, the study findings are concluded.
2. Literature Reviews
- A.
Knowledge absorptive capacity and decision making
Cohen and Levinthal first conceptualized absorption capacity and defined it as “a firm’s ability to recognize the value of new information, assimilate it, and apply it to commercial ends” [
23]. Absorption capacity can be beneficial to the business administration of firms as it can be applied to recognize and absorb the valuable information acquired from internal and external knowledge sources and to support decision-making [
23,
24]. Our previous studies reported that the knowledge absorption capacity was positively associated with the decision-making of firms [
3,
13,
25,
26]. One of these studies reported that this trend was higher in innovative firms than in non-innovative firms [
3]. Another of our studies showed that the trend was stronger for startups than for companies that are in the company growth stages of growth or maturity [
25]. Excluding our previous research results, there were few studies which addressed the effect of knowledge absorption capacity on the decision-making of firms. Neirotti et al. discussed algorithms for operational decision-making in the process of converting data into useful knowledge from the perspective of absorptive capacity [
27]. Cao et al. investigated the relationship between information processing capabilities for business analytics and the decision-making of firms. They found that information processing capabilities had a positive and significant effect on both decision-making effectiveness and data-driven decision-making [
28]. Wang and Byrd addressed the relationship between business analytics capabilities and decision-making effectiveness in the field of health care [
29]. Absorptive capacity was used as a mediating variable in their research. They showed that absorptive capacity had a significantly positive effect on decision-making effectiveness. Jun and Seo investigated the effect of positive psychological capital on the quality of decision-making of firms [
30]. Absorptive capacity had a fully mediating role in the relationship between positive psychological capital and the quality of decision-making. In summary, absorption capacity influences the decision-making of firms, and the affected decision-making enables the organization to expect positive outcomes. In our study, absorption capacity was redefined as knowledge absorption capacity (KAC) as it is closely related to knowledge. Hence, the following hypothesis was proposed:
Hypothesis 1 (H1):
Knowledge absorption capacity has a significantly positive effect on decision-making of firms.
- B.
Decision-making and organizational performance
Several studies showed that decision-making had a significant relationship with firm performance. Goll and Rasheed discussed the moderating effect of environmental dynamism when addressing the relationship between decision-making and firm performance. They found that decision-making was highly relevant to firm performance and environmental dynamism positively moderated the effect of decision-making on firm performance [
31]. Baum and Wally investigated a relationship between strategic decision speed and firm performances. They showed that the strategic decision speed had a significant and positive effect on firm growth and profit [
32]. Brynjolfsson investigated the effect of decision-making supported by business analytics on firm performances. They revealed that data-driven decision-making was highly relevant to greater market value and higher productivity [
33]. Awan et al. examined the relationship between big data analytics capabilities and circular economy performance by discussing the mediating effect of big data decision-making quality [
34]. They found that decision-making quality had a significantly positive effect on circular economy performance. Samson and Bhanugopan elucidated the effect of strategic human capital analytics on organizational performance and examined the mediating effect of managerial decision-making [
35]. They reported that managerial decision-making played a fully mediating role in the relationship between human capital analytics and organizational performance. In addition, our previous studies also showed that the contribution degree to the decision-making of firms was significantly and positively relevant to achievement of organizational performances [
3,
13,
25,
26]. One study in particular reported that the path coefficient, which is from decision-making to firm performance, was stronger for innovative firms than for non-innovative firms [
3]. Another study showed that technology and market dynamism significantly and positively moderated the effect of decision-making on organizational performance of firms [
26]. On the other hand, some studies insisted that decision-making of firms had no significant effect on firm performances. Wieder et al. discussed the interrelationships between business intelligence (BI), managerial decision-making, and firm performances [
36,
37]. They showed that data quality significantly mediated the effect of BI management quality on managerial decision-making. However, they reported that managerial decision-making was not significantly associated with firm performances [
37].
In order to examine the effect of decision-making on organizational performance in more detail, organizational performance has been divided into non-financial performance and financial performance, and non-financial performance has been classified into learning and growth, internal process, and customers, according to the scheme of BSCs. In this study, non-financial performance was considered as an intermediate stage to finally reach financial performance. Hence, the following set of hypotheses was proposed:
Hypothesis 2 (H2):
Decision-making has a significantly positive effect onlearning and growth of non-financial performances.
Hypothesis 3 (H3):
Decision-making has a significantly positive effect on the internal process of non-financial performances.
Hypothesis 4 (H4):
Decision-making has a significantly positive effect on customers for non-financial performances.
- C.
BSCs-based organizational performance
In a BSC, the aforementioned four perspectives can be correlated by cause and effect relationships. A set of hypotheses with cause and effect relationships can be an organizational strategy. Kaplan and Norton [
15] argued that all the performance measures should be connected to financial goals. They reported two case studies which translated the strategic objectives of Metro Bank and National Insurance into BSCs [
15]. The Metro Bank strategy assumed the following causal paths: LG → IBP → CUS → FP. Several other studies also discussed the causal linkages of four BSC perspectives [
38,
39,
40,
41]. Elbanna et al. investigated the causal links of a BSC conceptual framework by using structural equation modeling [
41]. They found a statistical significance in the following structural paths: LG → IBP → CUS → FP, LG → IBP → FP. Khan et al. developed hypotheses that discuss the following correlations of non-financial perspectives: LG vs. IBP, IBP vs. CUS, and LG vs. CUS [
38]. They also dealt with the effect of the non-financial BSC perspectives on financial performance. Bento et al. discussed a direct effect of non-financial perspectives on the financial perspective by using stepwise regression analyses [
39]. Independent variables were customer retention and satisfaction, and the perspectives of IBP and LG. On the other hand, a dependent variable was the FP perspective. All the independent variables had a significantly positive effect on the FP perspective. In particular, the FP perspective had a strong relationship with the non-financial perspectives in the order of CUS, IBP, and LG. Elola et al. developed the strategic maps for public and private universities based on the BSC concept [
40]. In the strategy map of private universities, the financial perspective was the final goal, whereas in the case of public universities, the customer perspective was set as the final objective. It could be seen that there was a difference in the BSC strategy maps between the for-profit and the non-profit organizations.
Several studies have been conducted to analyze the relationship between the perspectives of LG and the FP. The LG perspective focuses on the intangibles such as human capital, information capital, and organizational capital. Indicators related to this perspective include the method of leadership, employee satisfaction, organizational learning, problem solving capability, resource management capability, organizational understanding capability, employee competency, corporate culture, and so on [
18]. Heskett et al. insisted that employee satisfaction ultimately contributed to the growth and profitability of firms through the links in the following service–profit chain: employee satisfaction → employee loyalty → employee productivity → external service value → customer satisfaction → customer loyalty → growth and profitability [
42]. On the other hand, Johnson emphasized that the true source of organizational competitiveness can be found in exploring the value delivered to customers and the capability of excellent employees to create successful ideas for process improvement [
43]. From his study, it could be seen that in order for a company to continuously grow and survive through the achievement of financial performance in the future, competitiveness must be developed through recruitment, education and training of competent employees. These competent employees are resources that can preserve, maintain, and promote corporate values [
44], and true competitiveness stems from exploring and developing the outstanding ability of employees to generate successful ideas that can improve the value and process perceived by customers [
45]. Berková et al. verified a correlation between perspectives of LG and FP [
46]. Corporate culture and its diagnosis were selected as indicators for the LG perspective. They revealed that the uncertainty avoidance index (UAI) as a dimension of corporate culture was significantly relevant to earnings after taxes (EAT) and earnings before interest and taxes (EBIT). From their research results it could be found that companies can achieve better financial performances when they make an effort to avoid uncertainty. On the other hand, several researchers investigated the effect of organizational learning on financial performance [
47,
48,
49,
50,
51,
52,
53]. Abiola discussed the relationship between organizational learning components and financial performance of firms [
49]. Organizational learning components have four dimensions: systems orientation (SO), organizational climate for learning orientation (CLO), knowledge acquisition and utilization orientation (KAU), and information sharing and dissemination orientation (ISD) [
54]. She showed that financial performances were significantly relevant to SO, KAU, and ISD. And AlMulhim elucidated the impact of tacit knowledge and organizational learning on financial performance of firms in the service industry [
48]. He found that there was a significant association between organizational learning and financial performance. Jiang and Li investigated the relationship organizational learning and financial performance of firms [
51]. They also found that organizational learning had a significant effect on the financial performance of firms. As reported in the aforementioned studies, the LG perspective obviously has a significant association with the FP perspective of firms. Hence, the following hypothesis was established based on the above discussion.
Hypothesis 5 (H2a):
Learning and growth has a positive and significant impact onfinancial performance.
There are also some studies that addressed the relationship between the aspect of IBP and FP. The IBP perspective mainly focuses on how business processes of firms are effectively operating and whether their products or services are developed and provided to satisfy customer requirements [
55]. Kaplan and Norton argued that innovation in the IBP leads to changes in product or service quality that can meet customer needs, resulting in a significant impact on FP [
16]. Indicators related to the perspective of IBP could be process efficiency variance, manufacturing lead time, defect rate, introduction of new products, and so on [
19]. McNair et al. and Elbanna et al. discussed the direct and indirect effect of the perspective of internal business processes on the financial performances mediated by the customer perspective [
41,
56]. Although the perspective of IBP significantly and directly affected the FP perspective, the indirect effect by CUS perspective was higher than the direct effect. Meanwhile, Elola et al. showed that the CUS perspective fully mediated the effect of IBP on the financial performance [
40]. On the other hand, Bento et al. revealed the direct and significant impact of IBP on the FP perspective [
39]. Wolff and Pett investigated the relationship between product and process improvements and firm performances [
57]. They showed that product improvement had a significant effect on financial performances of firms; however, process improvement was not significantly associated with them. Aydiner et al. discussed the mediating role of business process performance in the relationship between adoption of business analytics and firm performance [
58]. They found that business process performance showed a fully mediation in that relationship. In addition, in another study they discussed the mediating role of business process performance in the relationship between information system capabilities and financial performance of firms [
59]. They found a significantly positive effect of business process performance on financial performance of firms. Hence, the following hypothesis was established based on the above discussion.
Hypothesis 6 (H3a):
Internal business processes have a positive and significant impact onfinancial performance.
There are several studies that analyzed the relationship between CUS and FP. The CUS perspective focuses on the relationship between a firm and its customers [
60]. The indicators of this perspective can be customer acquisition, customer retention, customer profitability, customer satisfaction, and so on [
19]. Gupta and Zeithaml investigated the relationship between customer metrics and financial performance [
61]. They addressed both unobservable customer metrics (e.g., customer satisfaction and loyalty) and observable customer metrics (e.g., customer acquisition and retention). As business competition intensifies, the successful achievement of company’s goals come from customer satisfaction. It was reported that customer satisfaction inspires their purchase intentions, induces repurchases, and improves customer profitability [
62,
63,
64]. Some studies reported that customer satisfaction as a non-financial measure had a positive and significant effect on financial indicators such as profitability, return on investment, and net profit [
62,
64,
65,
66,
67,
68]. Anderson et al. showed that a 1% change of the ACSI (American Customer Satisfaction Index) was related to a 1.016% change in Tobin’s q [
67]. Ittner and Larcker also revealed that a one unit increase in ACSI was significantly related to
$240 million increase in market value [
62]. Additionally, Gruca and Rego reported that a one-point increase in ACSI led to
$55 million increase in the cash flow of firms [
68]. It was said that when customer satisfaction increases, customers pay less attention to competitors’ products and advertisements, and eventually improve the company’s financial performance by purchasing other products from the same company [
69]. On the other hand, there are some reports that addressed the relationship between observable customer metrics and financial performance [
70,
71,
72]. Gupta et al. showed that a 1% improvement in customer retention increased firm value by 5% by using open data for Amazon, Ameritrade, Etrade, Capital One, and eBay [
70]. Similarly, Reichheld and Sasser reported that a 5% improvement in customer retention was associated with 25%~85% improvement in firms’ profit for several service industries [
71]. In addition, Reinartz et al. revealed that 25% underspending on customer retention and acquisition was related to a 55% and 3% drop in ROI, respectively [
72]. Hence, the following hypothesis was established based on the above discussion.
Hypothesis 7 (H4a):
Customers have a positive and significant impact onfinancial performance.
3. Methods
The data used in our study were obtained through a survey method. A questionnaire for the survey was sent via e-mail to a total of 1306 SMEs who received the KISTI KSs more than once and used it. Details of the questionnaire can be found in the
Appendix A (
Table A1). The online survey had been carried out for two months and 246 firms responded to the survey with a response rate of 18.8%. As shown in
Table 1, the revenue and the number of employees of respondents’ firms were 0–12 million USD and 1–50 persons, respectively. The survey respondents were CEOs, senior managers, or middle managers. This indicates that most respondents had a sufficient understanding of their firms and the quality of survey data is assured.
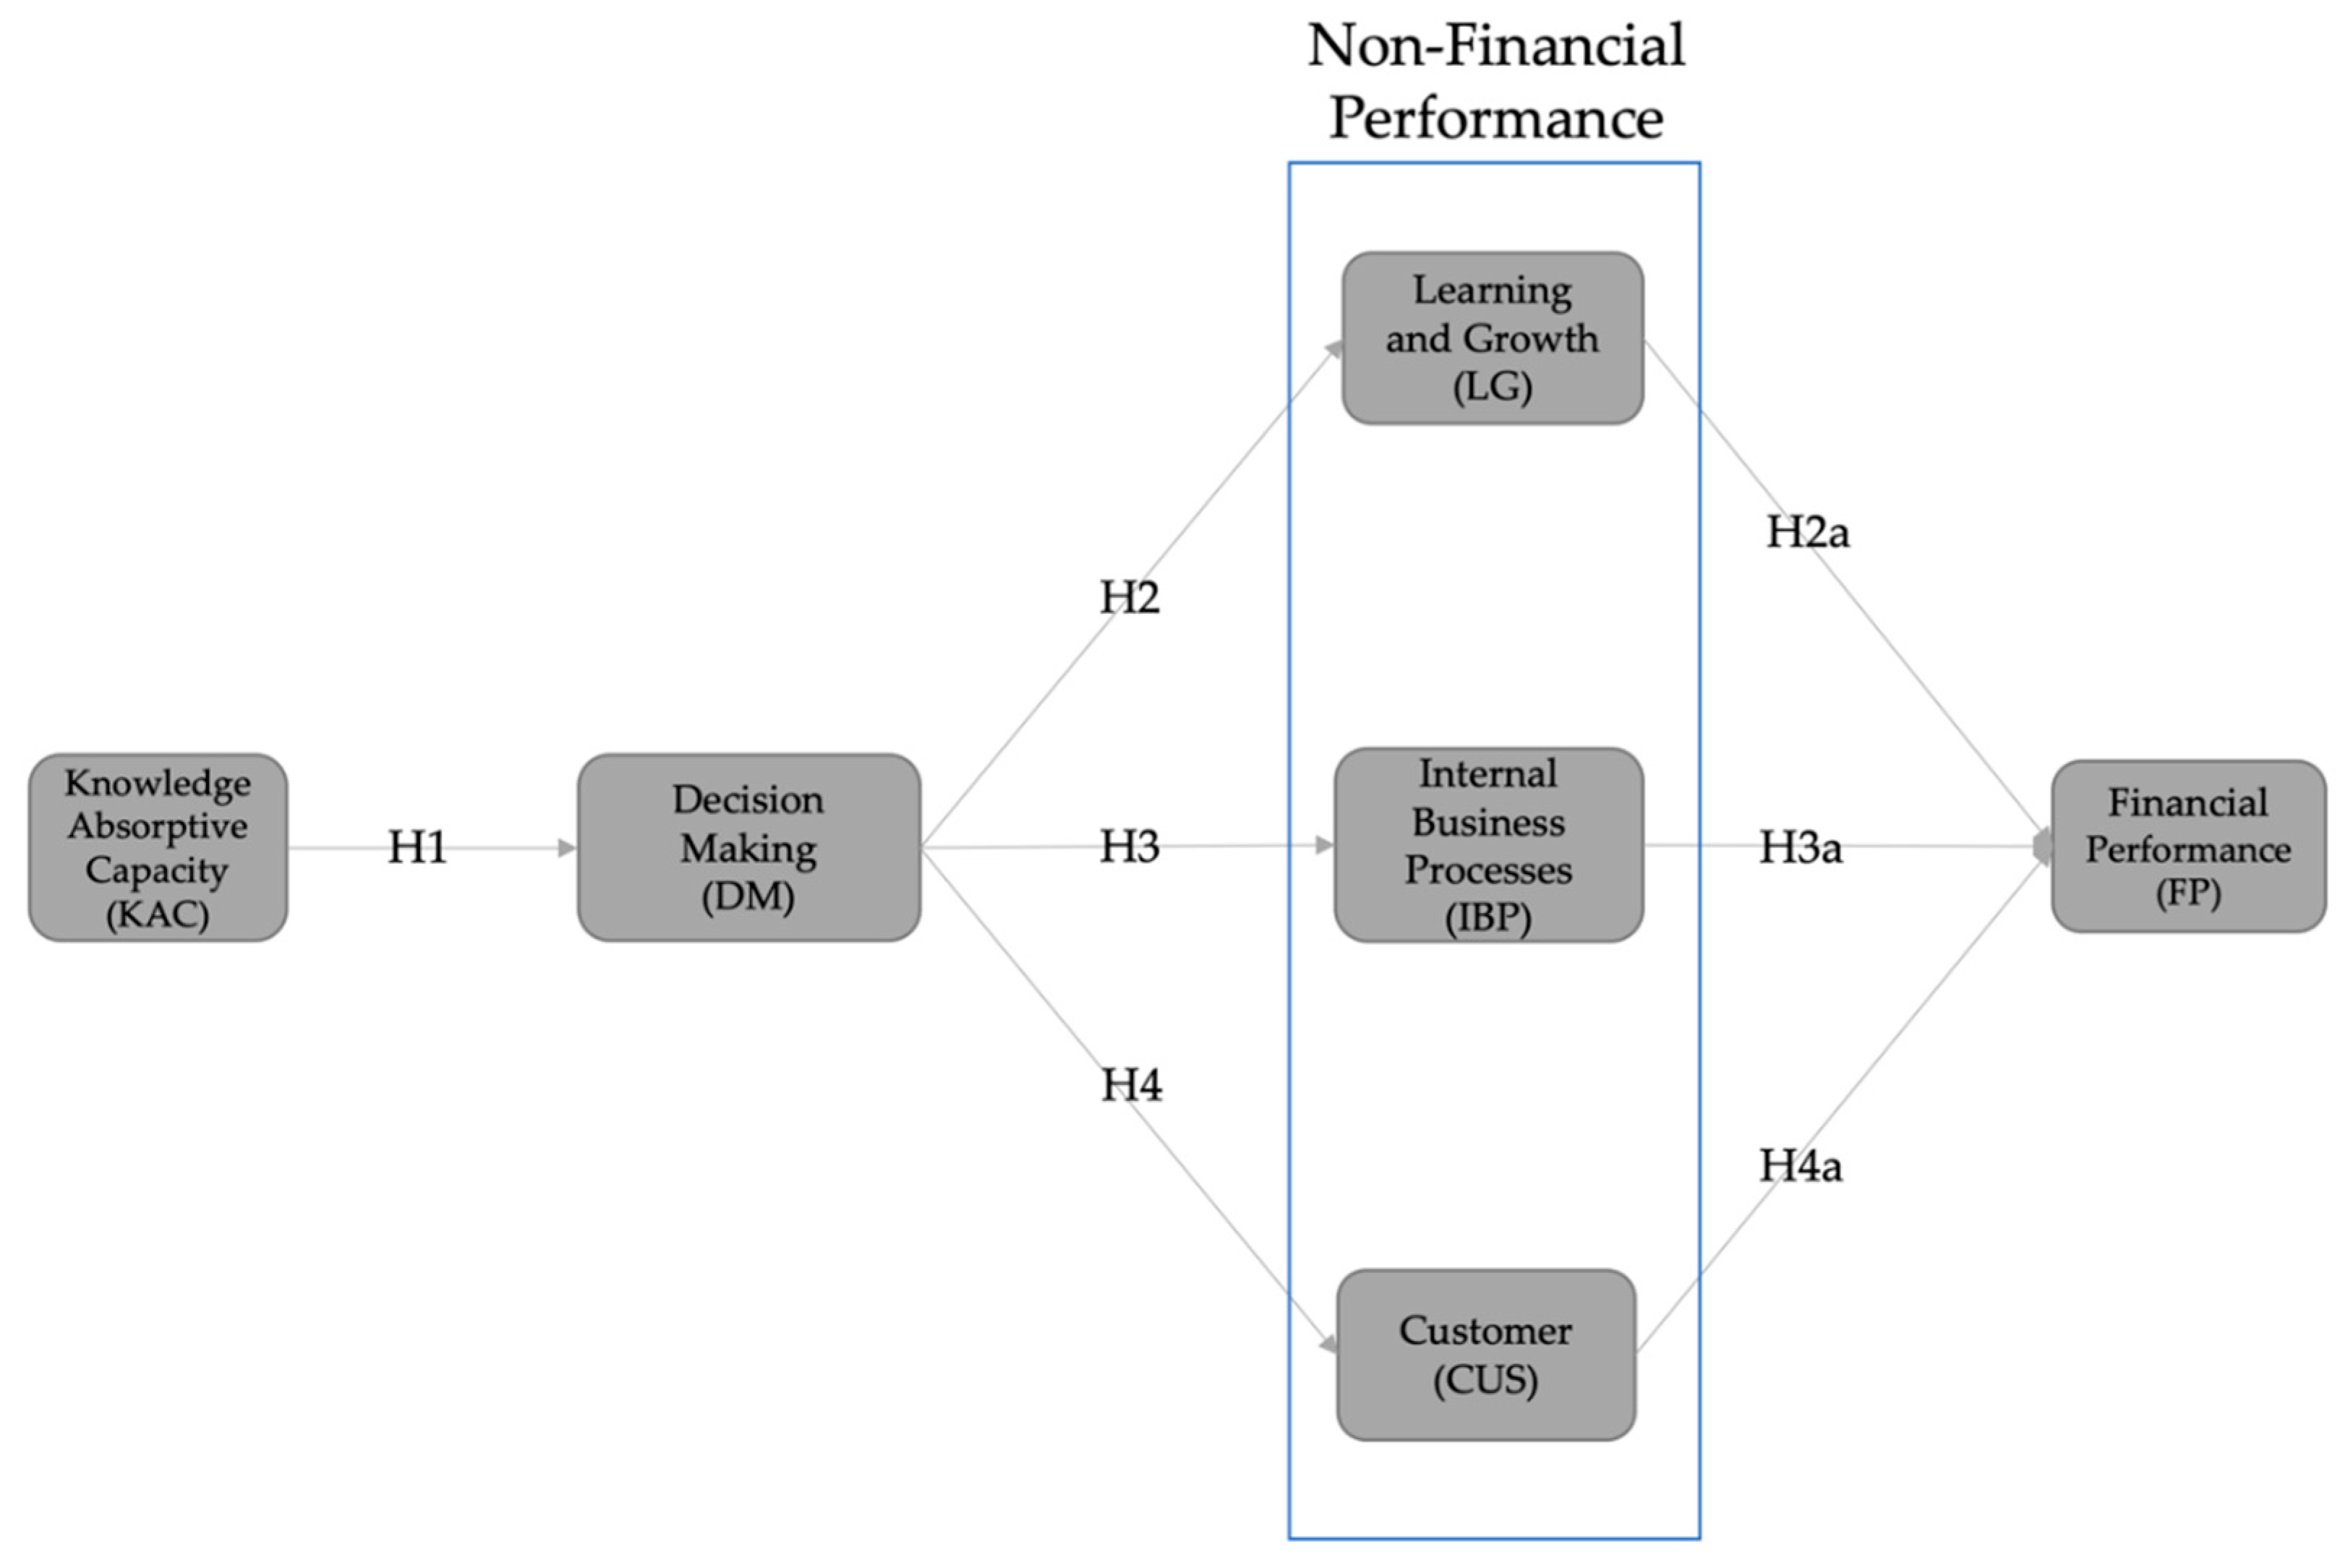
The proposed research model in our study is described in
Figure 1. KAC was selected as an independent variable and organizational performances based on the concept of the BSCs were chosen as dependent variables. Our study addressed both financial and non-financial aspects of organizational performances that were composed of two sequential stages. The non-financial performances were placed in the first stage of organizational performance, and the financial performance was positioned in the next stage. The purpose of this study is to analyze the structural path from KAC to the financial performance through non-financial performances. The perspectives of LG, IBP and CUS were used as variables which represent non-financial performances. Additionally, decision-making (DM) was introduced as a mediating variable. Our previous studies [
3,
25,
26] discussed the direct and indirect effects of KAC on FP through DM of SME executives and showed that the direct effect was statistically non-significant or very weak compared with the indirect effect. This study assumed that DM plays a fully mediating role in the relationship between KAC and organizational performances of firms.
PLS-SEM (partial least squares–structural equation modeling) was used to analyze the research model and the SmartPLS program was used to perform this process. SEM (structural equation modeling) is a popular statistical technique to estimate path models with latent variables and to identify their relationships. There are two typical SEM methods: covariance-based SEM (CB-SEM) and PLS-SEM. CB-SEM estimates parameters of the suggested research model by using covariance matrix of data and only considering common variance [
73]. On the other hand, PLS-SEM estimates the parameters for structural equations in the path model by combining principle component analysis with OLS (ordinary linear regression)-based path analysis [
74]. CB-SEM has been a dominant method which analyzes the interrelationships of constructs. However, recently articles published using PLS-SEM increased substantially compared to CB-SEM. PLS-SEM is now being applied to the various fields of social science, including accounting, entrepreneurship, family business, knowledge management, strategic management, marketing, psychology, and supply chain management [
75,
76]. PLS-SEM is preferred for a study when the purpose of the study is theory development or construct prediction; when the path model is complicated and includes many latent variables and indicators; when the data distribution lacks normality or when the sample size is small. PLS-SEM was selected as our study was closer to exploratory research and the collected data was not normally distributed.
PLS-SEM results can be evaluated in two stages: measurement model assessment and structural model assessment [
74,
75,
77]. The measurement model assesses indicator loadings, internal consistency reliability, convergent validity, and discriminant validity. The recommended value of indicator loadings is over 0.708 indicating that the indicator’s variance can be explained by the construct more than 50%. Internal consistency reliability can be assessed by using composite reliability and Cronbach’s alpha. The acceptable values of composite reliability and Cronbach’s alpha are over 0.7. Convergent validity of constructs can be assessed by using the average variance extracted (AVE). AVE values over 0.5 are highly recommended to satisfy convergent validity as they indicate that more than 50% of the indicators’ variance can be explained by the constructs. Discriminant validity can be assessed by using a criterion suggested by Fornell and Larcker [
78]. Each construct’s AVE values are compared to the squared inter-correlation of constructs. AVE values should be larger than the squared values of inter-correlations to satisfy the discriminant validity of constructs. After the measurement model assessment has been satisfied, then the structural model should be evaluated. Structural model assessment includes estimating statistical relevance and significance of the structural paths, the coefficient of determination (R
2), and the cross-validated redundancy (Q
2). The first step of structural model assessment is to examine the statistical relevance and significance of structural paths. The path coefficients’ significance can be determined by performing a bootstrapping procedure and calculating t-values or
p-values of path coefficients. The standardized path coefficients are usually in the range of −1 and +1. The path coefficients closer to +1 represent strong positive relationships, and those closer to −1 represent strong negative relationships. Then, R
2 values for all endogenous constructs should be examined to estimate the structural model’s explanatory power. Higher R
2 values indicate a greater explanatory power. Finally, Q
2 values can be examined through a blindfolding procedure to assess the model’s predictive accuracy. Q
2 values should be larger than zero for all constructs to ensure the predictive accuracy.
4. Results and Discussion
The descriptive statistics and correlations matrix for latent variables are presented in
Table 2. A 10-point Likert scale for all questionnaire items has been used to obtain data of indicators for each construct. Among six constructs, the mean value was highest in the order of DM, KAC, IBP, LG, FP, and CUS. The contribution of KSs to enhancement of KAC and improvement of DM was approximately 66%. On the other hand, the contribution of KSs to organizational performance was around 60%. In the correlation matrix, all the constructs had significant and positive correlations with each other. KAC was positively correlated with DM with a correlation coefficient of 0.870. This means that DM increases in proportion to the enhancement of KAC. Next, DM was positively correlated with non-financial performances such as LG, IBP, and CUS with correlation coefficients of 0.795, 0.802 and 0.723, respectively. It can be confirmed that improvement of DM has a significant effect on the achievement of non-financial performances. Lastly, there were significantly positive correlations between non-financial perspectives (LG, IBP, and CUS) and FP. FP had strong correlations with non-financial performances in the order of CUS, IBP, and LG.
Table 3 and
Table 4 show the results of the measurement model assessment in PLS-SEM. Construct reliability and validity for the constructs were represented in
Table 3. All indicator loadings were well above the threshold value of 0.708. This indicates that all the constructs can explain the indicator’s variance by more than 50%. Composite reliabilities for all the constructs were over the recommended value of 0.7, satisfying the internal consistency reliability. The convergent validity of the constructs was also satisfied as all AVE values were higher than 0.5.
Table 4 shows the results of the discriminant validity of the constructs. Diagonal values are square roots of AVE values and data below the diagonal are correlation coefficients. According to the criterion proposed by Fornell and Larcker [
78], square roots of AVE should be larger than inter-correlation values for the constructs to satisfy discriminant validity. As diagonal values in
Table 4 were larger than all the correlation coefficients, it can be seen that the discriminant validity for the constructs was satisfied.
Table 5 represents the results of structural model assessment in PLS-SEM. KAC had a significantly positive effect on DM with a path coefficient of 0.870 supporting hypothesis 1. This indicates that the enhancement of KAC contributes to improving DM of firms. In addition, DM was significantly relevant to LG, IBP, and CUS with path coefficients of 0.795, 0.802, and 0.723, respectively. This means that the improved quality of decision-making of firms has a positive effect on the achievement of non-financial performances supporting hypothesis 2, 3, and 4. These results are quite similar to those of our previous studies [
3,
13,
25,
26]. On the other hand, LG and CUS had significantly positive impacts on FP supporting hypothesis 2a and 4a; however, IBP showed no significance in Path VI rejecting hypothesis 3a. Among non-financial performances, the perspectives of LG and CUS significantly affected FP, but the aspect of IBP was not significantly relevant to FP.
KAC can be represented by four distinct dimensions: (1) knowledge acquisition, (2) knowledge assimilation, (3) knowledge transformation, and (4) knowledge exploitation [
23,
79,
80,
81]. Firstly, knowledge acquisition refers to a firm’s capability to recognize and acquire external knowledge which is beneficial and important in its operation. Secondly, knowledge assimilation refers to a firm’s capacity to interpret and comprehend the obtained knowledges from external sources. Thirdly, knowledge transformation represents a firm’s capability to create a new schema by combining the existing knowledge and the newly acquired knowledge. Finally, knowledge exploitation denotes the capacity to apply and integrate the transformed knowledge in the firm’s operations. KSs improve the KAC of the organization, which enhances the overall capabilities related to the four areas mentioned above. Citroen reported that the information obtained from KSs helps to effectively derive alternatives in the process of decision-making and contributes to rational decision-making by reducing uncertainty in the dynamic environment of the business [
82]. Furthermore, all findings from the literature review supported that KAC was significantly relevant to the DM of firms. In conclusion, in this study, it can be seen that if the capacity to acquire, absorb, transform, and utilize the external knowledge is enhanced, the decision quality of the firms can also be improved in their operations.
This study suggested a fully mediating role of DM to address the effect of KAC on the organizational performances of firms. On the other hand, our previous studies dealt with both direct and indirect effect of DM [
3,
25,
26]. One of those studies showed that the indirect effect of KAC on organizational performances through DM was stronger than its direct effect [
26]. Another study revealed that DM had a fully mediating role for innovative firms and played a partial mediating role for non-innovative firms [
3]. The effect of KAC on DM was stronger for innovative firms than for non-innovative firms. Recently, a study reported that DM had a fully mediating role for all firms in the company growth stages of startup, growth and maturity [
25]. The path coefficient from KAC to DM showed the highest values in the order of startup, growth and maturity from the perspective of the company growth stage of firms. The direct effect of KAC on organizational performances means that when firms introduce external KSs for their sustainable growth, they directly and immediately utilize it to achieve organizational performances of firms. In this effect, it can be said that the review process for the KSs is quite lacking. However, the indirect effect of KAC through DM indicates that the information obtained by the KSs is thoroughly reviewed by firm executives and is selectively utilized in the decision-making process, thereby contributing to organizational performances of firms. From our previous study it could be found that, in innovative firms, KSs were extensively reviewed by firm executives and contributed to organizational performances, whereas, in non-innovative firms, they were directly utilized for organizational performances [
3].
Citroen introduced a model of the decision-making process by splitting it into five phases: preparation, analysis, specification, limiting, and assessment [
82,
83]. Firstly, the preparation phase defines the decision issue and establishes the decision objectives. Secondly, the analysis phase gathers and studies the additional information from both internal and external knowledge sources. Sources of the information can be internal experts, external consultants, customers, suppliers, and so on. Thirdly, the specification phase deduces alternatives to solve the decision issue from the information obtained in the analysis phase. In this phase, detailed planning documents can be developed by overviewing the deduced alternatives. Fourthly, the limiting phase extracts alternatives with a high probability of success among the identified ones. Finally, the assessment phase analyzes and evaluates the outcome of the limited alternatives before a final decision. The qualitative enhancement of the decision-making processes elevates the success possibility of the solution selected from the limited alternatives by assessing them at the final decision. Ultimately, this contributes to the achievement of organizational performances.
Managerial decisions are complicated in nature due to the uncertainty and ambiguity in the decision-making environments [
84]. Scholars argue that there is a tradeoff between efficiency and consensus in decision-making, both of which are necessary to achieve effective outcomes [
85,
86,
87,
88,
89,
90,
91]. Therefore, it is an important managerial issue to capture both efficiency and consensus in the decision-making of firms. External KSs can elevate the quality of decision-making processes by addressing and improving this issue, as decision-making and knowledge are closely related [
3,
13,
25,
26]. Yim insisted that knowledge-based decision-making is preferred when the nature of decision-making is strategic or the decision-making environment is dynamic and uncertain [
92]. KSs play a crucial role in helping effective knowledge-based decision-making and finally contribute to the achievement of firm performance. As hypothesis 2, 3, and 4 in
Table 5 have been accepted from the PLS-SEM results, it can be seen that the qualitative improvement of firm’s decision-making have a significantly positive effect on the achievement of non-financial performances. These results are not significantly different from those of our previous studies [
3,
13,
25,
26] and other relevant researches [
31,
32,
33,
34,
35] although few studies reported that there is no significant relationship between decision-making and firm performance [
37]. Additionally, this study focused on the identifying the relationship between decision-making and non-financial performance whereas our previous studies [
3,
13,
25,
26] mainly analyzed the effect of decision-making on financial performance of firms. Some studies [
93,
94,
95], which addressed the relationship between decision-making and firm’s innovation, support the PLS-SEM results for hypothesis 2, 3, and 4 as non-financial performances are closely linked to innovation of firms. Therefore, it can be concluded that enhancing the quality of decision-making has a significant effect on the fulfillment of both non-financial and financial performances.
As mentioned before, in our study the organizational performance was divided into non-financial performance and financial performance, and the non-financial performance was regarded as a leading indicator for financial performance. The results of the structural model test supported hypothesis 2a and 4a; however, hypothesis 3a was rejected. The aspects of LG and CUS in the non-financial performance had a significantly positive effect on FP. In this study, LG refers to the enhancement of capabilities regarding problem solving, resource management, and understanding for organization. CUS represents the improvement of facility level or environmental condition and also capability enhancement for acquiring new customers. FP includes expanding new business, improving cost structure and increasing asset utilization. Furthermore, the coefficient of structural path VII was higher than that of structural path V. These results are similar to those of the study by Bento et al. [
39] and also indicate that the perspective of CUS in the non-financial performance was more important than that of LG in order to achieve FP. Although some previous studies reported that IBP had a significant effect on FP [
39,
41,
56], our study showed that there was no statistical significance in the relationship between IBP and FP. This means that IBP-related performances had little impact on financial performance for firms that introduce external KSs for their sustainable growth.
It can be seen that firms which utilize KSs as an open innovation strategy can finally achieve financial performance through the perspectives of LG and CUS of non-financial performances. Therefore, firms not only need to enhance the capabilities of problem solving, resource management, and a thorough understanding of their own organization, but also should focus on the improvement of customer-related environments and capability enhancement of new customer acquisition. In addition, as the CUS perspective had a greater impact on FP than the aspect of LG did, it can be said that firms need to concentrate on fulfilling customer-related performances in order to effectively achieve the financial performance. The widely used causal relationship between the BSC perspectives is as follows: LG → IBP → CUS → FP [
15,
41]. However, in this study, it was assumed that non-financial perspectives have a direct impact on the financial perspective in parallel [
39]. As the objective of this study is to identify which of the non-financial perspectives has a significant influence on the financial aspect, the interrelationship between the non-financial perspectives has been ignored in this study.
Table 6 shows R
2 and Q
2 values of endogenous constructs. The R
2 value refers to the coefficient of determination and generally ranges from 0 to 1. Its higher value indicates a greater explanatory power. The explanatory power with R
2 values of 0.75, 0.50 and 0.25 can be considered substantial, moderate and weak, respectively [
74,
75,
77]. The constructs of DM and FP had substantial explanatory powers. On the other hand, the other constructs of CUS, IBP and LG had moderate explanatory powers. Meanwhile, the Q
2 value represents the blindfolding-based cross-validated redundancy. Q
2 values should be larger than zero to secure the predictive accuracy of the structural model [
96,
97]. As all Q
2 values in
Table 6 were well above zero, it can be said that our structural model supported sufficient predictive accuracy for the endogenous constructs.
In this study, the BSC concept was introduced to investigate the effect of KSs on organizational performances for the sustainable growth of firms. Firms can establish various strategies for their sustainable growth by developing a causal relationship between four BSC perspectives: LG, IBP, CUS, and FP. This study suggested a strategy by arranging the non-financial perspectives in parallel as leading indicators to achieve the financial performance of firms. Addressing the various factors that affect organizational performances is closely related to the sustainable growth of firms [
98,
99,
100]. Nastiti et al. investigated the effect of working capital management on firms’ profitability and sustainable growth [
98]. They revealed that firms’ profitability was significantly associated with the sustainable growth of firms. Arora et al. showed that net profit margin drives the sustainable growth of firms by using panel data regression [
99]. Lockwood and Prombutr discussed the relationship between sustainable growth and stock returns from 1964 to 2007 [
100]. They found that the net profit margin is the most important factor for subsequent returns of firms.
From the research results, we could find some crucial points that need to be considered for the sustainable growth of firms. Firstly, the introduction of external KSs as an open innovation strategy can be helpful for the sustainable growth of firms. External KSs can give valuable information to the firms and support the decision-making processes of firms. Secondly, KAC needs to be enhanced in order to maximize the impact of KSs on organizational performances. KAC has four dimensions: knowledge acquisition, assimilation, transformation and exploitation. Although KSs play an important role in enhancing the four aforementioned dimensions of KAC, firms also should make efforts to increase the KAC to attain organizational performances effectively by using external KSs. Thirdly, firm capabilities regarding the perspectives of LG and CUS need to be enhanced to achieve the financial performance of firms. Additionally, more time and effort should be devoted to improving a firm’s capabilities related to the CUS perspective rather than the aspect of LG. This study did not directly derive factors related to the sustainable growth of firms. However, it is highly expected that this study will be of great help for firms to indirectly establish a business strategy for their sustainable growth by investigating factors related to the achievement of the financial performance of firms.
5. Conclusions
In this study, PLS-SEM was performed to clarify the effect of KSs on organizational performances by introducing the concept of BSCs for the sustainable growth of firms. As a result of the PLS-SEM, KAC had a significant and positive effect on the DM of firms [
3,
13,
25,
26]. Improved DM positively affected the non-financial performances of firms, and the non-financial performances ultimately affected the financial performance of firms [
39]. The perspectives of LG and CUS of non-financial performances showed a statistical significance on the financial performances. However, the aspect of IBP had a non-significant relationship with the FP perspective. Therefore, firms need to focus on enhancing capabilities with regard to the perspectives of LG and CUS to achieve financial performance for their sustainable growth. Furthermore, from PLS-SEM results, it could be found that the perspective of CUS was more important than that of LG when considering relationships with FP.
Our research results suggest some managerial implications for firms, investors, and policymakers. Decision-makers of firms can introduce external KSs as a way to achieve firm performances for their sustainable growth. Firms need to enhance the KAC to maximize the beneficial effect of the introduced KSs. As KAC includes knowledge acquisition, assimilation, transformation and exploitation [
23,
79], efforts should be made to develop capabilities related to these dimensions evenly. Additionally, firms need to consider both non-financial and financial aspects of organizational performances for their sustainable growth [
14,
15]. Our study showed that the perspectives of LG and CUS were significantly related to FP. Therefore, firms can elevate their potential for sustainable growth by concentrating on improving the aspects of LG (employee satisfaction, resource management, problem solving capacity, and so on) and CUS (customer satisfaction, retention, acquisition, and so on). In addition to the causal relationship model presented in our study, it is highly recommended that firms derive another model of the causal relationship for their sustainable growth by rearranging the four BSC perspectives [
15]. On the other hand, when selecting investment targets, investors need to consider firms that fully consider non-financial and financial performance metrics rather than those that establish a management strategy by consisting of fragmentary performance indicators only related to the FP perspective. Finally, policymakers need to check whether the CUS perspective is most considered among non-financial factors for firms to achieve financial performances when they design a KS-supporting government program and decide which firms to support.
Our study has some limitations that need to be improved in future work. In dealing with the effect of KSs on firm performances, the impact of various attributes of a firm, such as firm size [
101,
102,
103], company growth stage [
25,
104,
105], and R&D intensity [
3,
106,
107,
108], was not addressed in this study. Meanwhile, KAC has four dimensions such as knowledge acquisition, assimilation, transformation and exploitation [
23,
79]. However, the effect of four dimensions on firm performances was not addressed in this study. Considering the various attributes of a firm and detailed factors, KAC is expected to provide deeper managerial insights when investigating the effect of KSs on BSC-based firm performances. Furthermore, the correlation between the non-financial perspectives has been neglected in this study. Another BSC strategy reflecting the interrelationship of non-financial perspectives will be an important research topic for future work. Finally, panel data related to organizational performances of firms were not used in this study. It is highly expected that the crucial factors for the sustainable growth of firms can be more directly derived by using the panel data.


