Abstract
Rock quality designation (RQD) and permeability coefficient are important reference indexes for grouting application. Based on the readily available RQD, RQD is found to have no relationship with the depth of rock stratum, and a method for calculating the mean RQD (RQDm) of long stratum is proposed, which is applied to the calculation of RQD of grouting sections. Through Lugeon and grouting tests on the grouting sections, RQDm of the grouting sections is found to be directly related to the average permeability coefficient, permeability, and units of grouting per amount of rock mass. It is found that RQDm has a symmetrical relationship with permeability and grouting volume as well as a negative exponential correlation with unit grouting volume and average permeability coefficient. According to the curve of RQD varying with depth, the grouting amount at different depths can be obtained by using the fitting formula of unit grouting amount and RQDm.
1. Introduction
The mechanical parameters of rock mass are various characteristic values that describe the stress−strain curve obtained by the mechanical tests of rock mass, which can be used as the basis for predicting the deformation and failure behavior of rock mass and judging its engineering stability [1,2,3,4,5,6]. Since laboratory tests on small specimens cannot predict the deformability of rock masses, in situ tests that provide direct information on deformability are necessary. However, in situ tests are expensive and time-consuming. Rock quality designation (RQD) is one of the key parameters in rock classification [7,8,9]. Based on this, a large number of scholars have done extensive research on RQD.
As a directional property of rock mass, RQD had been used to define structural anisotropy. Based on the 3D fracture network model, Xu et al. [10] and Zhang et al. [11,12] found that RQD had a size effect, and the parameters in different directions varied greatly. Controlled by the structural plane, the mechanical properties of rock mass were often greatly different from those of rock blocks [13,14,15,16,17]. Alemdag et al. [18] carried out seismic refraction tomography (SRT) of rock mass. Through discontinuous frequency parameters, P wave velocity (Vp) was found to increase with an increase in RQD value, and the fitting equation of RQD and Vp was obtained. Xia et al. [19] established a quantitative expression of disturbance factor (D) and estimated the geological strength index (GSI) according to RQD and surface condition rating (SCR), which effectively explained the damage degree of rock mass caused by blasting or excavation disturbance. Qureshi et al. [20] found a negative logarithmic relationship between permeability and RQD in discontinuous sedimentary rocks through Lugeon tests of discontinuous sedimentary rocks, confirming the effect of stress on the permeability of discontinuous rocks. Afiri et al. [21] evaluated the permeability and the groutability of Souk Tleta dam via Lugeon test, RQD, and SPI, and grout diffusion radius was thus obtained. Fan et al. [22] established an evaluation model of curtain grouting efficiency of permeability, RQD, and crack filling rate, finding that grouting efficiency was directly related to permeability, RQD and filled fracture rate.
In order to further study the feasibility of grouting, this paper proposes a RQD calculation method for grouting sections and analyzes the in situ permeability of grouting sections via Lugeon test and permeability coefficient. According to the permeability by the Lugeon test and geological surveys, such as RQD and lithology analysis, the grout ratio was adjusted to conduct curtain grouting test. With the obtained data being compiled, the mean RQD of grouting sections is found to be directly related to the permeability coefficient, permeability, and units of grouting per amount of rock mass. This has certain reference significance for hydraulic structure design, construction site investigation, and amount of curtain grouting in the future.
2. Case Study
2.1. Engineering Overview
Gaofeng Phosphate Mine is located in Yuanan County, Hubei Province, China and has complex geological conditions. Faults and folds are in the mining area, which is located in the Dengying Fm. Rock fractures are extremely developed; solution cracks and irregular caves are developed, with good water conductivity and large karst water reserves. The ground rock strata of the wellbore are connected with the river and have a direct hydraulic connection. The hydrogeological type of the deposit is dominated by karst water filling, with direct water inflow from the roof and indirect water from the floor, which makes it a medium karst water filling deposit. The geological research completed through rock core drilling survey provides relevant rock mass lithology data, and a comprehensive geological columnar table is drawn (Table 1). It can be seen from Figure 1 that the rock strata are distributed in a complex manner; each lithological section is unconformity contacted, and water indirectly fills between the layers. The lithology of the rocks varies with depth, quality, and permeability. The rock cores are mostly broken and have the phenomenon of dissolved pores. The groundwater between the layers changes from indirect water filling to direct water filling through faults, karst caves, and other unfavorable geological structures. The deep aquifer has a long supply source with high water head, high water pressure, and prominent water inflow.

Table 1.
Comprehensive geological columnar table.
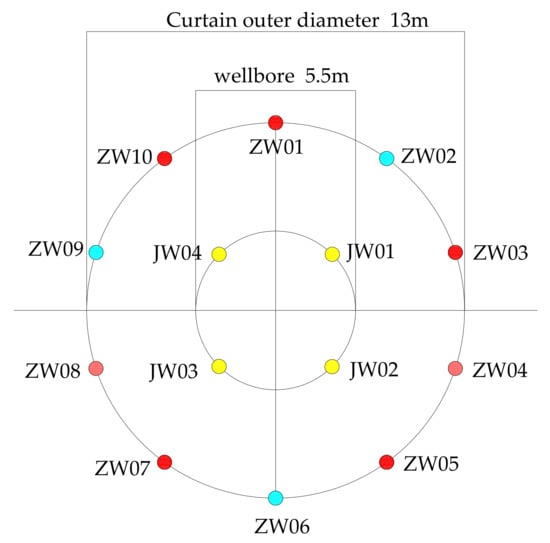
Figure 1.
Layout diagram of curtain grouting holes.
2.2. Grouting Holes’ Arrangement
In shaft construction, it is crucial to use curtain grouting to reduce the permeability of the rock mass and improve its consolidation ability. By injecting cement slurry into rock fractures, artificial underground impermeable grouting curtains can be formed, cutting off waterways and creating a dry environment in mining areas.
The grouting holes are based on the design of the geographical coordinate center of the shaft. The diameter of the shaft is 5.5 m, and the radius of the curtain hole is 6.5 m. A total of 10 grouting holes (ZW01, ZW02, ZW03, ZW04, ZW05, ZW06, ZW07, ZW08, ZW09, ZW10) are arranged. The spacing of grouting holes is 4.02 m, and the construction of interval holes is carried out. To ensure the quality of the project, four inspection holes (JW01, JW02, JW03, JW04) are arranged on the net diameter of the wellbore. The grouting holes’ layout is shown in Figure 1.
After the curtain grouting construction is completed, the segmented water pressure test is carried out on the four inspection holes. According to the “Code for Construction and Acceptance of Mining Pit Engineering”, the maximum water inflow of shaft construction is less than 20 m3/h.
3. Mean RQD
3.1. Definition of Mean RQD
The concept of RQD was first proposed by Deere [23], which is defined as the percentage of intact cores over 100 mm in total length to evaluate the integrity and quality of rock mass. RQD value can be calculated by the following formula [24]:
where, xi is the length of the ith intact core exceeding 100 mm in length, X is the total length of rock core.
Traditionally, the total length of the core is the length of a drill pipe, and the calculation of the RQD of long formation is more complicated. A method for calculating RQD of long strata is introduced in this paper. The formula is as follows:
where Li is the total length of rock core at the ith coring; RQDi represents the degree of rock fragmentation at the ith coring; L is the intersegment length; and RQDm is the mean RQD of the long strata.
In particular, RQDm cannot accurately represent the degree of fragmentation of a certain layer of rock mass, which is mainly used in long stratum. In the calculation of RQD of long formations, RQDm is simpler than the traditional cumulative calculation of RQD value and can calculate the fragmentation degree of rock mass in any section of stratum, which is more intuitive and flexible.
3.2. Calculation of RQD
In this study, a diamond bit with a diameter of φ95 mm and a double-layer core tube are used to drill in the rock, and rock cores with a core diameter of 64.5 mm are continuously taken. According to the rock core samples, the distributions of RQD of holes ZW02, ZW06 and ZW09 at different depths are obtained, as shown in Figure 2.
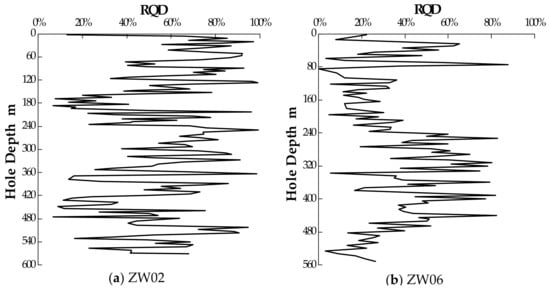
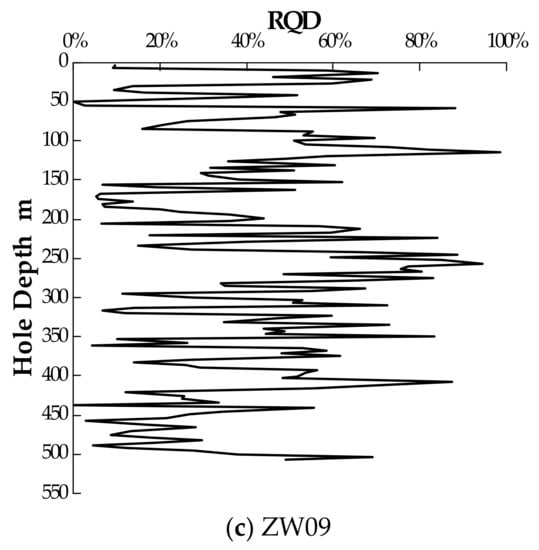
Figure 2.
RQD distribution maps of grouting holes at different depths.
It can be seen from Figure 2 that at the same depth, RQD calculated by coring in holes ZW02, ZW06, and ZW09 are quite different, showing great discreteness. The distribution of RQD is limited. At 0–160 m, the RQD of hole ZW02 is mainly concentrated in 60–80%; at 320–450 m, the RQD of hole ZW02 is mainly concentrated in 40–80%; at 200–430 m, hole ZW02 is mainly concentrated in 10–70%. At 200–400 m, the RQD of holes ZW02, ZW06 and ZW09 is basically consistent with the change trend of depth, which is concentrated in 20% to 80%.
RQD is affected by many factors and constraints, and its size depends not only on the location of rock core, but also on the direction of rock core [25,26,27]. When samples are extracted from cores with different drilling directions, it will produce different values for a given location. In addition, factors such as drilling and logging quality, rock strength and core size, hydrologic condition, joint aperture, alteration, and roughness can all affect RQD values.
3.3. Calculation of Mean RQD of Grouting Section
The length of grouting sections is determined by the development of strata cracks exposed by actual drilling. The more developed karst cracks are, the shorter the grouting section is. In case of large karst cave, grouting can be carried out directly. The curtain section grouting method is adopted for grouting, and the grouting section length is set at 30–50 m. Hole ZW02 is divided into 15 grouting sections, hole ZW06 into 13 grouting sections, and hole ZW09 into 12 grouting sections.
According to Formula (2), RQDm of the grouting section is calculated, and the RQDm distribution diagrams of the grouting sections are obtained, as shown in Figure 3.
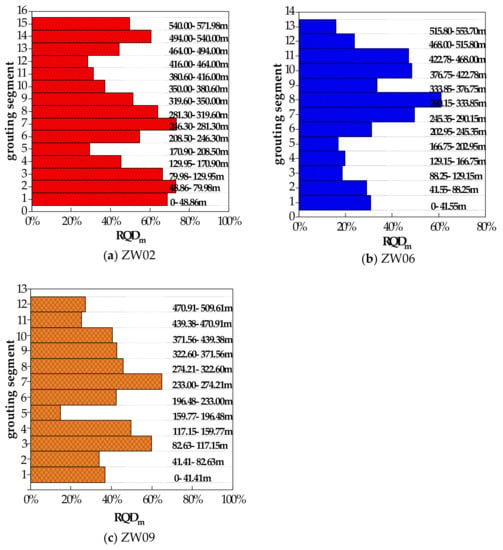
Figure 3.
RQDm distribution diagrams of the grouting sections.
It is found from Figure 3 that RQDm is not directly related to depth. The distribution of RQDm in the same hole is extraordinarily uneven, and the RQDm in different holes also varies greatly at the same depth. The maximum RQDm of hole ZW02 is 73.16% in the second grouting section, and the minimum is 28.37% in the 12th grouting section; the maximum RQDm of hole ZW02 is 60.98% in the eighth grouting section, and the minimum is 17.01% in the fifth grouting section; the maximum RQDm of hole ZW09 is 59.93% in the third grouting section, and the minimum is 14.89% in the fifth grouting section.
Both crack initiation and crack propagation require energy. In addition, different rock samples have different structures and stress directions, resulting in great differences in the ability of energy storage and release between rocks. Therefore, the RQDm is distributed differently in space.
4. Lugeon Test
4.1. Calculation of Permeability and Permeability Coefficient
Lugeon test adopts the orifice sealing method, and the pressure gauge is installed on the orifice return pipe. The pressure is set to 1.1–2.0 times of the hydrostatic pressure. After the pressure is stable, the pressurized-water flow is measured every 5 min. When the difference between the maximum value and the minimum value in four consecutive readings is less than 10% of the final value or the difference between the maximum value and the minimum value is less than 1.0 L/min, it is regarded as the end of stability, and the average value is taken as the flow value for calculating permeability.
The formula for the Lugeon and permeability conversion is as follows [28]:
where Q is the pressurized water flow of the grouting section, m3; p is the total pressure acting on the grouting section, MPa; r is the radius of the drill hole, m; L is the length of the grouting section, m; H is the height of the water head, m; q is the permeability of grouting section, Lu; K is the permeability coefficient of the rock mass, m/s.
4.2. Relationship between Mean RQD, Permeability q and Average Permeability Coefficient K
According to the Lugeon test, it can be found that the permeabilities of the grouting sections of holes ZW02, ZW06, and ZW09 are between 0.4 and 0.9, and the permeability coefficient is between 4 × 10⁻⁸ m/s and 10 × 10−8 m/s. The Lugeon test data are shown in Table 2, Table 3 and Table 4.

Table 2.
Parameters of Lugeon and curtain grouting tests of Hole ZW02.

Table 3.
Parameters of Lugeon and curtain grouting tests of Hole ZW05.

Table 4.
Parameters of Lugeon and curtain grouting tests of Hole ZW09.
The relationship between RQDm and permeability q of different grouting sections (Figure 4) and the average permeability coefficient -RQDm fitting curve (Figure 5) are obtained.
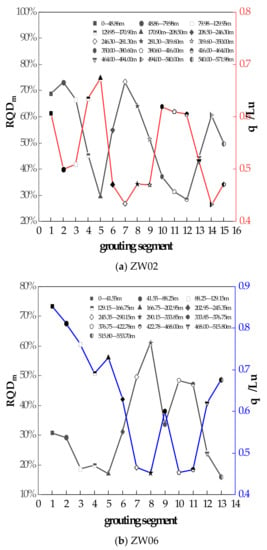
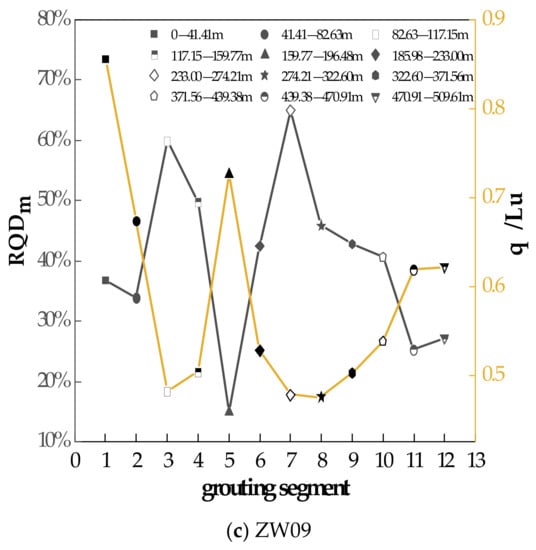
Figure 4.
The relationship between RQDm and permeability in different grouting sections.
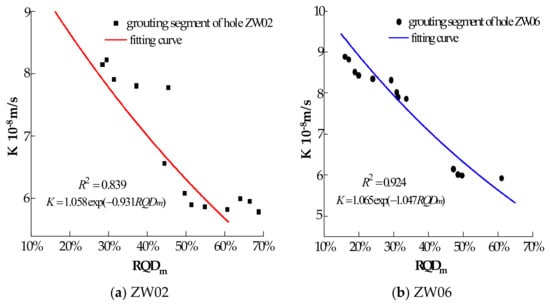
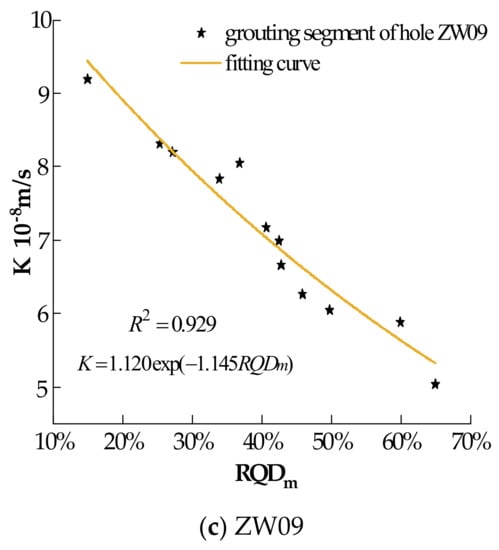
Figure 5.
Average permeability coefficient K—RQDm fitting curve.
It can be seen from Figure 4 that in the same grouting section, the mean RQD of holes ZW02, ZW06, and ZW09 have an obvious symmetrical relationship with the permeability but do not show the size relationship. Due to the different lengths of grouting sections, it is necessary to further study the average permeability coefficient and RQDm of rock mass.
Figure 5 shows the fitting curve and formula of average permeability coefficient and RQDm. The fitting formula is as follows:
In the formula: K is the average permeability coefficient, m/s; a and b are test fitting parameters.
It can be seen from Figure 5 that the correlation coefficients of the fitting equations of holes ZW02, ZW06 and ZW09 holes are 0.839, 0.924 and 0.929, respectively, indicating that the negative exponential function relationship (4) can well characterize the relationship between the average permeability coefficient K and RQDm. The coefficients a and b are related to the length of the grouting section and the geological characteristics of the rock stratum.
The larger the RQDm of rock, the higher the integrity of rock mass and the smaller the average permeability coefficient K. Therefore, it is feasible to estimate the average permeability coefficient using RQDm. The average permeability coefficient K has a negative exponential correlation with RQDm. In the seepage simulation of fractured rock mass, the permeability coefficient can be calculated indirectly according to the change of RQD with depth.
5. Curtain Grouting
5.1. Raw Materials
- Cement;
- Portland cement (type PC 42.5, in accordance with the relevant Chinese standard GB175-2007) is used for the curtain grouting;
- Water;
- The grouting water complies with both the appropriate Chinese “Concrete Water Standard” (JGJ63-2006) and “Hydraulic Concrete Construction Code” (DL/T5144-2015);
- Water-reducing agent;
- As the curtain grouting additive, high-performance PCA-I polycarboxylic acid with a water-reducing agent parameter of 0.3% was utilized.
5.2. Grouting Method
Curtain grouting is done by the grouting method of top-down, inner segmental blocking and segmental grouting.
5.3. Grouting Scheme
According to the permeability obtained by the Lugeon test [29], the appropriate slurry ratio is selected (in accordance with the relevant Chinese standard “Specification of mine curtain grouting” (DZ/T0285-2015)). The grouting water–cement ratios are designed to be 3:1, 2:1, 1:1, 0.8:1, 0.6:1, a total of five ratios. With the permeability greater than 10 Lu, the cement slurry with a water–cement ratio of 0.8:1 is used for grouting; for permeability less than 10 Lu, the cement slurry with the ratio of 3:1 is used for grouting. The slurry transformation is carried out on the principle of thickening slurry step by step after thinning slurry. When the slurry is continuously poured for 30 m3, the grouting pressure does not rise, the unit suction volume does not change, and the slurry proportion will be increased by one level.
The grouting pressure is set to 2.5–3.0 times of the hydrostatic pressure. In order to ensure that the slurry enters the cracks, the slurry flow is made to be about 8 m3/h by reducing the frequency and stabilizing the pressure. After the curtain grouting is completed, the cores are taken from the whole hole of the inspection holes (JW01, JW02, JW03, JW04), and a Lugeon test is carried out in sections. It is found that the water pressure flow is less than 20 m3/h, which meets the grouting requirements.
5.4. Relationship between Grouting Volume V and Mean RQD
The grouting amount of the grouting sections is sorted and compiled. The relationship between RQDm and grouting volume V in different grouting sections (Figure 6), and the fitting curve of unit grouting volume V- RQDm (Figure 7) is obtained. Curtain grouting data are shown in Table 2, Table 3 and Table 4.
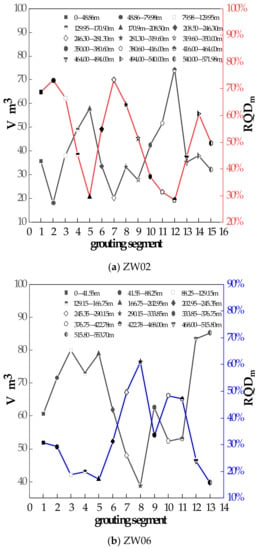
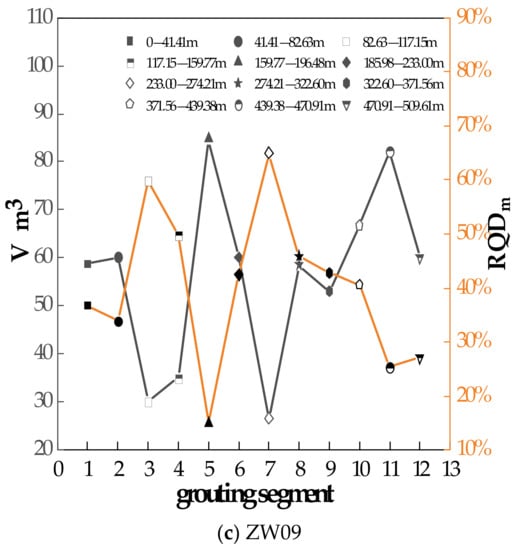
Figure 6.
Relationships between RQDm and grouting volume V in different grouting sections.
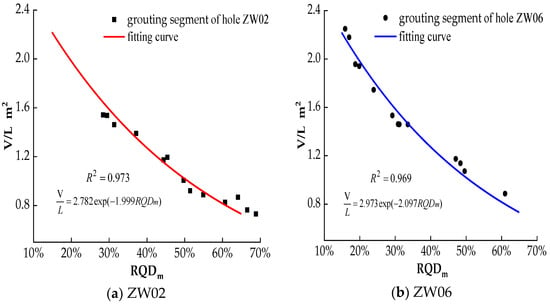
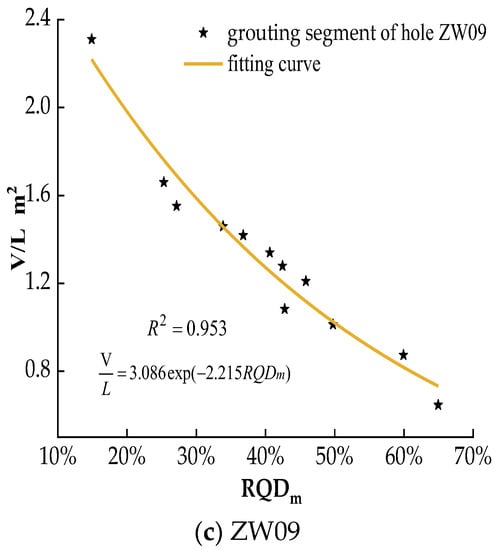
Figure 7.
Unit grouting amount—RQDm fitting curve.
It can be seen from Figure 7 that in the same grouting section, the RQDm of holes ZW02, ZW06, and ZW09 holes have obvious symmetrical relationships with the grouting volume V but do not show a size relationship. Due to the different lengths of grouting sections, the unit grouting amount and RQDm of rock mass must be further studied.
5.5. Relationship between Unit Grouting Volume and Mean RQD
It can be seen from Figure 7 that the unit grouting amounts in the grouting sections of holes ZW02, ZW06, and ZW09 are distributed between 0.4 m2 and 2.4 m2, and the fitting formula between the unit grouting amounts and RQDm is obtained. The fitting formula is as follows:
where is the unit grouting amount, m2, and c and d are the test fitting parameters.
It can be seen from Figure 7 that the unit grouting amount has a negative exponential correlation with RQDm. Additionally, the correlation coefficients of the fitting equations of holes ZW02, ZW06, and ZW09 holes are 0.973, 0.969, and 0.953, respectively. The coefficients c and d are related to the length of the grouting section and the geological characteristics of the rock stratum.
The larger the RQDm of the rock, the lower the degree of fracture development, the higher the integrity of the rock mass, and the smaller the average permeability coefficient K, which is more conducive to the diffusion of slurry—therefore, the smaller the unit grouting amount. According to the curve of RQD changing with depth, the grouting amount at different depths can be obtained by using the fitting formula of unit grouting amount and RQDm, which has certain reference significance for the grouting amount in the future.
6. Discussion
RQDm is established on the basis of RQD, which reflects the average fragmentation degree of rock mass in long strata. Compared with RQD, the length of rock stratum calculated by RQDm is larger, and it is not accurate enough to reflect the fragmentation of specific rock stratum. Both RQD and RQDm are obtained by coring. They are susceptible to human factors during coring, and there are certain errors in measuring the length.
In grouting engineering, the prediction of grouting amount through RQDm is not applicable to all cases. It is best suited for rock strata with large cracks and large permeability. Permeability coefficient and permeability are parameters that characterize the ability of soil or rock to transmit liquid. Cement slurry particles are set with large, for low-permeability rocks, cement slurry is difficult to enter.
Jiang et al. [24] discretized the obtained RQD and permeability coefficient and derived the RQD and permeability coefficient per meter. It was found that RQD was negatively exponentially correlated with the permeability coefficient. In this paper, the average RQD and the average permeability coefficient of the grouting section are fitted, and it is found that RQDm and the average permeability coefficient are also negatively correlated. This shows that RQDm is feasible to estimate the average permeability coefficient of rock mass at different depths. Niu et al. [30] found that there was a nonlinear relationship between unit grouting volume and permeability. However, this paper finds that the mean RQD has an obvious symmetrical relationship with the average permeability coefficient and permeability but does not show a size relationship, and a negative exponential correlation between the average permeability coefficient and RQDm is found. Therefore, the fitting formula of unit grouting amount and RQDm is used to obtain the grouting amount at different depths.
7. Conclusions
In addition to developed faults, folds, and irregular caverns, Gaofeng Phosphate Mine also has good water conductivity and large karst water reserves. In order to study the grouting characteristics of rock strata within the limited parameters of this study, according to RQD and Lugeon test and curtain grouting data, the following conclusions can be drawn:
- (1)
- It is found in this paper via coring that RQD has nothing to do with the depth of rock strata. Based on the concept of traditional RQD, this paper proposes a method to calculate the mean RQD (RQDm) of long strata and applies it to the calculation of RQD of grouting sections.
- (2)
- Permeability and average permeability coefficient are obtained via a Lugeon test. It is found that RQDm has a symmetrical relationship with rock mass permeability and that the average permeability coefficient has a negative exponential correlation with RQDm.
- (3)
- By analyzing the grouting amount of curtain grouting, grouting volume is found to have a symmetrical relationship with RQDm, and the unit grouting amount is found to be negatively correlated with RQDm. According to the curve of RQD varying with depth, the grouting amount at different depths can be obtained by using the fitting formula of unit grouting amount and RQDm.
Furthermore, this method is best suited for rock strata with large fissures and high permeability. For rock mass with low permeability, clay slurry can be used for grouting, but its law requires further study.
Author Contributions
Conceptualization, J.L., Q.L. and Y.L.; methodology, Y.Z.; investigation, S.R.; writing—original draft preparation, S.R.; writing—review and editing, J.L.; supervision, Q.L.; formal analysis, Y.L.; validation, Y.Z. All authors have read and agreed to the published version of the manuscript.
Funding
This research was funded by the National Natural Science Foundation of China (Grant No. 52274118) and Construction Project of Chenzhou National Sustainable Development Agenda Innovation Demonstration Zone (2021sfQ18).
Data Availability Statement
Not applicable.
Acknowledgments
The authors wish to acknowledge the support they received. The reviewers are gratefully acknowledged for their valuable comments on the manuscript.
Conflicts of Interest
The authors declare no conflict of interest.
References
- Zhao, Y.L.; Zhang, C.S.; Wang, Y.X.; Lin, H. Shear-related roughness classification and strength model of natural rock joint based on fuzzy comprehensive evaluation. Int. J. Rock Mech. Min. Sci. 2021, 137, 104550. [Google Scholar] [CrossRef]
- Chen, M.; Zang, C.W.; Ding, Z.W.; Zhou, G.L.; Jiang, B.Y.; Zhang, G.C.; Zhang, C.P. Effects of confining pressure on deformation failure behavior of jointed rock. J. Cent. South Univ. 2022, 29, 1305–1319. [Google Scholar] [CrossRef]
- Chen, M.; Yang, S.Q.; Ranjith, P.G.; Zhang, Y.C. Cracking behavior of rock containing non-persistent joints with various joints inclinations. Theor. Appl. Fract. Mech. 2020, 109, 102701. [Google Scholar] [CrossRef]
- Tang, J.Z.; Yang, S.Q.; Elsworth, D.; Tao, Y. Three-Dimensional Numerical Modeling of Grain-Scale Mechanical Behavior of Sandstone Containing an Inclined Rough Joint. Rock Mech. Rock Eng. 2021, 54, 905–919. [Google Scholar] [CrossRef]
- Tang, J.Z.; Yang, S.Q.; Zhao, Y.L.; Tian, W.L. Experimental and numerical modeling of the shear behavior of filled rough joints. Comput. Geotech. 2020, 121, 103479. [Google Scholar] [CrossRef]
- Liu, Q.; Zhao, Y.L.; Tang, L.M.; Liao, J.; Wang, X.G.; Tan, T.; Cheng, L.; Luo, S.L.; Wang, M. Mechanical characteristics of single cracked limestone in compression-shear fracture under hydro-mechanical coupling. Theor. Appl. Fract. Mech. 2022, 119, 103371. [Google Scholar] [CrossRef]
- Zhang, L.Y.; Einstein, H.H. Using RQD to estimate the deformation modulus of rock masses. Int. J. Rock Mech. Min. Sci. 2004, 41, 337–341. [Google Scholar] [CrossRef]
- Lucian, C.; Wangwe, E.M. The usefulness of rock quality designation (RQD) in determining strength of the rock. Int. Refereed J. Eng. Sci. 2013, 2, 36–40. [Google Scholar]
- Trivedi, A. Computing in-situ strength of rock masses based upon RQD and modified joint factor: Using pressure and damage sensitive constitutive relationship. J. Rock Mech. Geotech. Eng. 2015, 7, 540–565. [Google Scholar] [CrossRef]
- Xu, W.; Hu, X.L.; Huang, L. Research on RQD of rock mass calculated by three-dimensional discontinuity network simulation method and its accuracy comparison. Chin. J. Rock Mech. Eng. 2012, 31, 822–833. [Google Scholar]
- Zhang, W.; Wang, Q.; Chen, J.P.; Tan, C.; Yuan, X.Q.; Zhou, F.J. Determination of the optimal threshold and length measurements for RQD calculations. Int. J. Rock Mech. Min. Sci. 2012, 51, 1–12. [Google Scholar] [CrossRef]
- Zhang, W.; Chen, J.P.; Cao, Z.X.; Wang, R.Y. Size effect of RQD and generalized representative volume elements: A case study on an underground excavation in Baihetan dam, Southwest China. Tunn. Undergr. Space Technol. 2013, 35, 89–98. [Google Scholar] [CrossRef]
- Zhao, Y.L.; Wang, Y.X.; Wang, W.J.; Tang, L.M.; Liu, Q.; Cheng, G.M. Modeling of rheological fracture behavior of rock cracks subjected to hydraulic pressure and far field stresses. Theor. Appl. Fract. Mech. 2019, 101, 59–66. [Google Scholar] [CrossRef]
- Zhao, Y.L.; Zhang, L.Y.; ASCE, P.E.F.; Liao, J.; Wang, W.J.; Liu, Q.; Tang, L.M. Experimental study of fracture toughness and subcritical crack growth of three rocks under different environments. Int. J. Geomech. 2020, 20, 04020128. [Google Scholar] [CrossRef]
- Zhao, Y.L.; Liu, Q.; Zhang, C.S.; Liao, J.; Lin, H.; Wang, Y.X. Coupled seepage-damage effect in fractured rock masses: Model development and a case study. Int. J. Rock Mech. Min. Sci. 2021, 144, 104822. [Google Scholar] [CrossRef]
- Liu, J.H.; Zhao, Y.L.; Tan, T.; Zhang, L.Y.; Zhu, S.T.; Xu, F.Y. Evolution and modeling of mine water inflow and hazard characteristics in southern coalfields of China: A case of Meitanba mine. Int. J. Min. Sci. Technol. 2022, 32, 513–524. [Google Scholar] [CrossRef]
- Ren, S.; Zhao, Y.L.; Lin, H.; Wang, Y.X. Experimental Study on Mechanical Properties and Effective Stress Coefficient of Water-saturated Sandstone under Hydraulic-mechanical Coupling. Arab. J. Geosci. 2022, 15, 952. [Google Scholar] [CrossRef]
- Alemdag, S.; Sari, M.; Seren, A. Determination of rock quality designation (RQD) in metamorphic rocks: A case study (Bayburt-Krklartepe Dam). Bull. Eng. Geol. Environ. 2022, 81, 214. [Google Scholar] [CrossRef]
- Xia, K.Z.; Chen, C.X.; Wang, T.L.; Pang, H.S.; Liu, X.T. Quantification of the GSI and D values in the Hoek–Brown criterion using the rock quality designation (RQD) and discontinuity surface condition rating (SCR). Bull. Eng. Geol. Environ. 2022, 81, 4. [Google Scholar] [CrossRef]
- Qureshi, M.U.; Khan, K.M.; Bessaih, N.; Al-Mawali, N.; Al-Sadrani, K. An Empirical Relationship between In-situ Permeability and RQD of Discontinuous Sedimentary Rocks. Electron. J. Geotech. Eng. 2014, 19, 4781–4790. [Google Scholar]
- Afiri, R.; Smail, G.; Bouzelha, K.; Tabou, R. Evaluating permeability and groutability of Souk Tleta dam site based on Lugeon tests, RQD, SPI and trial grouting. J. Mater. Eng. Struct. 2020, 7, 339–357. [Google Scholar]
- Fan, G.H.; Zhong, D.H.; Yan, F.G.; Yue, P. A hybrid fuzzy evaluation method for curtain grouting efficiency assessment based on an AHP method extended by D numbers. Expert Syst. Appl. 2016, 44, 289–303. [Google Scholar] [CrossRef]
- Deere, D.U. Technical description of rock cores for engineering purpose. Rock Mech. Eng. Geol. 1964, 1, 17–22. [Google Scholar]
- Jiang, X.W.; Wan, L.; Wang, X.S.; Wu, X.; Zhang, X. Estimation of rock mass deformation modulus using variations in transmissivity and RQD with depth. Int. J. Rock Mech. Min. 2009, 46, 1370–1377. [Google Scholar] [CrossRef]
- Emery, X.; Séguret, S.A. Geostatistics for the Mining Industry: Applications to Porphyry Copper Deposits; CRC Press: Boca Raton, FL, USA, 2020. [Google Scholar]
- Sánchez, L.K.; Emery, X.; Sánchez, S.A. Geostatistical modeling of Rock Quality Designation (RQD) and geotechnical zoning accounting for directional dependence and scale effect. Eng. Geol. 2021, 293, 106338. [Google Scholar] [CrossRef]
- Sonmez, H.; Ercanoglu, M.; Dagdelenler, G. A novel approach to structural anisotropy classification for jointed rock masses using theoretical rock quality designation formulation adjusted to joint spacing. J. Rock Mech. Geotech. 2022, 14, 329–345. [Google Scholar] [CrossRef]
- Dou, J.X.; Zhang, G.J.; Zhou, M.X.; Wang, Z.L.; Gyatso, N.; Jiang, M.Q.; Safari, P.; Liu, J.Q. Curtain grouting experiment in a dam foundation: Case study with the main focus on the Lugeon and grout take tests. Bull. Eng. Geol. Environ. 2020, 79, 4527–4547. [Google Scholar] [CrossRef]
- Azimian, A.; Ajalloeian, R. Permeability and groutability appraisal of the Nargesi dam site in Iran based on the secondary permeability index, joint hydraulic aperture and Lugeon tests. Bull. Eng. Geol. Environ. 2015, 74, 845–859. [Google Scholar] [CrossRef]
- Niu, J.D.; Wang, B.; Chen, G.J.; Chen, K. Predicting of the unit grouting quantity in karst curtain grouting by the water permeability of rock strata. Appl. Sci. 2019, 9, 4814. [Google Scholar] [CrossRef]
Publisher’s Note: MDPI stays neutral with regard to jurisdictional claims in published maps and institutional affiliations. |
© 2022 by the authors. Licensee MDPI, Basel, Switzerland. This article is an open access article distributed under the terms and conditions of the Creative Commons Attribution (CC BY) license (https://creativecommons.org/licenses/by/4.0/).


