Article

Crop Identification and Analysis in Typical Cultivated Areas of Inner Mongolia with Single-Phase Sentinel-2 Images

1
Beijing Key Laboratory of High Dynamic Navigation, Beijing Information Science and Technology University, Beijing 100101, China
2
Airborne Remote Sensing Center, Aerospace Information Research Institute, Chinese Academy of Sciences, Beijing 100094, China
*
Author to whom correspondence should be addressed.
Sustainability 2022, 14(19), 12789; https://doi.org/10.3390/su141912789
Submission received: 23 July 2022 / Revised: 22 September 2022 / Accepted: 30 September 2022 / Published: 7 October 2022
(This article belongs to the Special Issue Regional Climate Change and Application of Remote Sensing)

Abstract

:
The Hetao Plain and Xing’an League are the major cultivated areas and main grain-producing areas in Inner Mongolia, and their crop planting structure significantly affects the grain output and economic development in Northern China. Timely and accurate identification, extraction, and analysis of typical crops in Xing’an League and Hetao Plain can provide scientific guidance and decision support for crop planting structure research and food security in ecological barrier areas in Northern China. The pixel samples and the neighborhood information were fused to generate a spectral spatial dataset based on single-phase Sentinel-2 images. Skcnn_Tabnet, a typical crop remote sensing classification model, was built at the pixel scale by adding the channel attention mechanism, and the corn, sunflower, and rice in the Hetao Plain were quickly identified and studied. The results of this study suggest that the model exhibits high crop recognition ability, and the overall accuracy of the three crops is 0.9270, which is 0.1121, 0.1004, and 0.0874 higher than the Deeplabv3+, UNet, and RF methods, respectively. This study confirms the feasibility of the deep learning model in the application research of large-scale crop classification and mapping and provides a technical reference for achieving the automatic national crop census.

1. Introduction

Food security lays a solid basis for national security. As the COVID-19 pandemic rages through the whole world, the international situation is severe and complex, and food security is at stake. During China’s “two sessions” in 2022, General Secretary Xi Jinping once again mentioned that “food security is the bottom-line task of comprehensively boosting rural revitalization, and it is imperative to keep the red line of 1.8 billion mu of arable land”. As a vital granary in Northern China, Inner Mongolia has an area of 6.713 million hectares of arable land [1], and the per capita arable land area is 0.24 hectares, ranking first in China [2]. Accordingly, research on the extraction and monitoring methods of grain crops in Inner Mongolia, accurate and timely crop type mapping plays a vital role in crop yield estimation, soil management, and food supply. Furthermore, it is of critical significance to ensure national food security and prevent the tendency of “non-grain” [3].
In the past few decades, remote sensing has gradually become an effective tool for crop identification due to its wide range and strong timeliness. With the enhancement of earth observation ability, much research on crop remote sensing identification have been spawned. Ibrahim et al. [4] used phenological and spectroscopic temporal metrics obtained from Sentinel-2 images for crop type mapping and cropping system mapping with an overall accuracy of 84%. You et al. [5] based on the long sequence Sentinel-2 image of the GEE platform and the Random Forest (RF) algorithm, produced three typical crops in Northeast China for years of classification products. In brief, the existing research methods for crop classification and extraction primarily comprise a hierarchical decision tree based on spectral features [6,7,8], threshold segmentation method based on time series normalized difference vegetation index (NDVI) [9,10,11], as well as feature index-based RF method [12,13,14,15], etc. The existing research scope is small and concentrated [16,17], and the data source requires multi-temporal images of the entire crop growth period [18,19]. However, continuous multi-temporal images during the crop growth cycle are often missing due to factors (e.g., cloud cover and rainy weather). In addition, data processing operations (e.g., registration and fusion of multi-source and multi-temporal image data) have certain technical thresholds, thus significantly affecting the accuracy of crop classification.
With the rapid development of remote sensing technology and the continuous expansion of application fields, users have increasing requirements for the efficiency and accuracy of crop mapping. Conventional crop identification methods are difficult to solve the data redundancy problem caused by remote sensing of big data. Deep learning has provided a novel idea for crop remote sensing identification for its powerful image feature extraction ability. To be specific, semantic segmentation technology [20] is capable of analyzing the deep semantic information of images and conducting pixel-level supervised classification [21] quickly, which has been favored by many scholars. For instance, Du et al. [22] extracted rice from Arkansas using a semantic segmentation model U-net based on time-series Landsat imagery and the Cropland Data Layer (CDL). Rice could be identified in the heading stage with an overall accuracy of 0.86. Der et al. [23] used drones to obtain high spatial resolution drone images in experimental farms. As well, the SegNet semantic segmentation network was used for crop extraction through the texture gap between different crops. The study achieved an overall classification accuracy of 89.44%. Wang et al. [24] adopted the optimized DeepLabV3+ network to efficiently identify glaciers, lakes, grasslands, and bare land on Sentinel-2 remote sensing images at the source of the Yangtze River, with mAP of 0.639, mIoU of 0.778, and Kappa of 0.825. Since semantic segmentation requires pixel-level sample labels, the production cost is high and the efficiency is difficult to meet the requirements. Thus, reducing the complexity of sample production and using more advanced deep learning methods to achieve rapid and accurate crop extraction is also an urgent problem to be studied.
As an essential ecological barrier in Northern China, Inner Mongolia is vast and sparsely populated. The cultivated land is concentrated in the Hetao Plain in the middle and the Xing’an League in the east, among which sunflower, maize, and rice account for the largest proportions, meeting the needs of crop monitoring based on remote sensing big data. Accordingly, the Hetao Plain and the southwestern part of the Xing’an League were selected as the study area in this study, and single-phase Sentinel-2 images and a small number of samples were employed for automatic identification and analysis of sunflower, maize, and rice based on the optimized Tabnet model. The aim is at solving the difficult problem of capturing optical images in the crop growth cycle, maximizing the timeliness of crop mapping, verifying the applicability of deep learning models in large-scale crop remote sensing identification applications, and providing technical references for the automation of national crop censuses.

2. Materials and Methods

2.1. Study Area

Xing’an League (Figure 1) is located in the transition zone between the Greater Xing’an Mountains and Songnen Plain in the Northeastern part of Inner Mongolia (42°25′–47°65′ N, 119°47′–123°62′ E), with 909,490 hectares of arable land, taking up 13% of the total arable land in the autonomous region [1]. The region exhibits a complex topography, with dense hills in the northwest, flat and thick soil in the southern plain, and sufficient water resources, thus providing convenience for water diversion and irrigation and agricultural machinery operations [25]. The area abounds with rice, maize, and sunflower, and is a vital agricultural production base in Inner Mongolia. Rice is sown in mid-April and harvested at the end of September. Sunflowers are sown in late May, bloom in early July, and harvest in mid-September. Corn is sown in mid-May and matures in mid-to-late September. Two counties in the southwest of Xing’an League (Horqin Right Wing Middle Banner and Tuquan County) were selected as the typical experimental areas to build a crop remote sensing classification model.
The Hetao Plain, a typical cultivated area in central Inner Mongolia, was selected for model application to verify the applicability of the model. The Hetao Plain is located in the south of Bayannaoer City, Inner Mongolia Autonomous Region of China (40°1′–40°4′ N, 106°1′–109°4′ E), which belongs to a typical continental monsoon climate, with hot and dry summers and cold winters, the annual rainfall is less than 250 mm, while the potential evaporation is 2011 to 2300 mm per year [26]. Although the region has an arid climate, the Yellow River that flows through the region provides valuable water resources for agricultural development. The total arable land area of the region is nearly 733,000 hectares [25], mainly planted with sunflower, maize, and rice. Sunflower and maize have the same phenological period, and they are both sown in May and harvested in September-October. In general, rice is one-season rice, sown in mid-May, and harvested at the end of September.

2.2. Data and Samples

2.2.1. Remote Sensing Data and Processing

This study was primarily based on Sentinel-2 L1C images for crop classification, and the data originated from the European Space Agency (ESA) Copernicus Data Center (https://scihub.copernicus.eu/, accessed on 20 April 2022).
Sentinel-2 comprises two satellites equipped with a Multispectral Imager (MSI) with a revisit period of 5 days and 13 bands (Table 1), including four 10 m resolution bands, six 20 m resolution bands, as well as three 60 m resolution bands. The Sen2Cor (http://step.esa.int/main/third-party-plugins-2/sen2cor/, accessed on 25 April 2022) plugin released by ESA was adopted to analyze the Sentinel-2 L1C raw images for radiometric calibration and atmospheric correction processing since the L1C-level data are not atmospherically corrected. Furthermore, the low-resolution band was resampled to 10 m resolution to acquire the image data for deep learning classification.

2.2.2. Samples

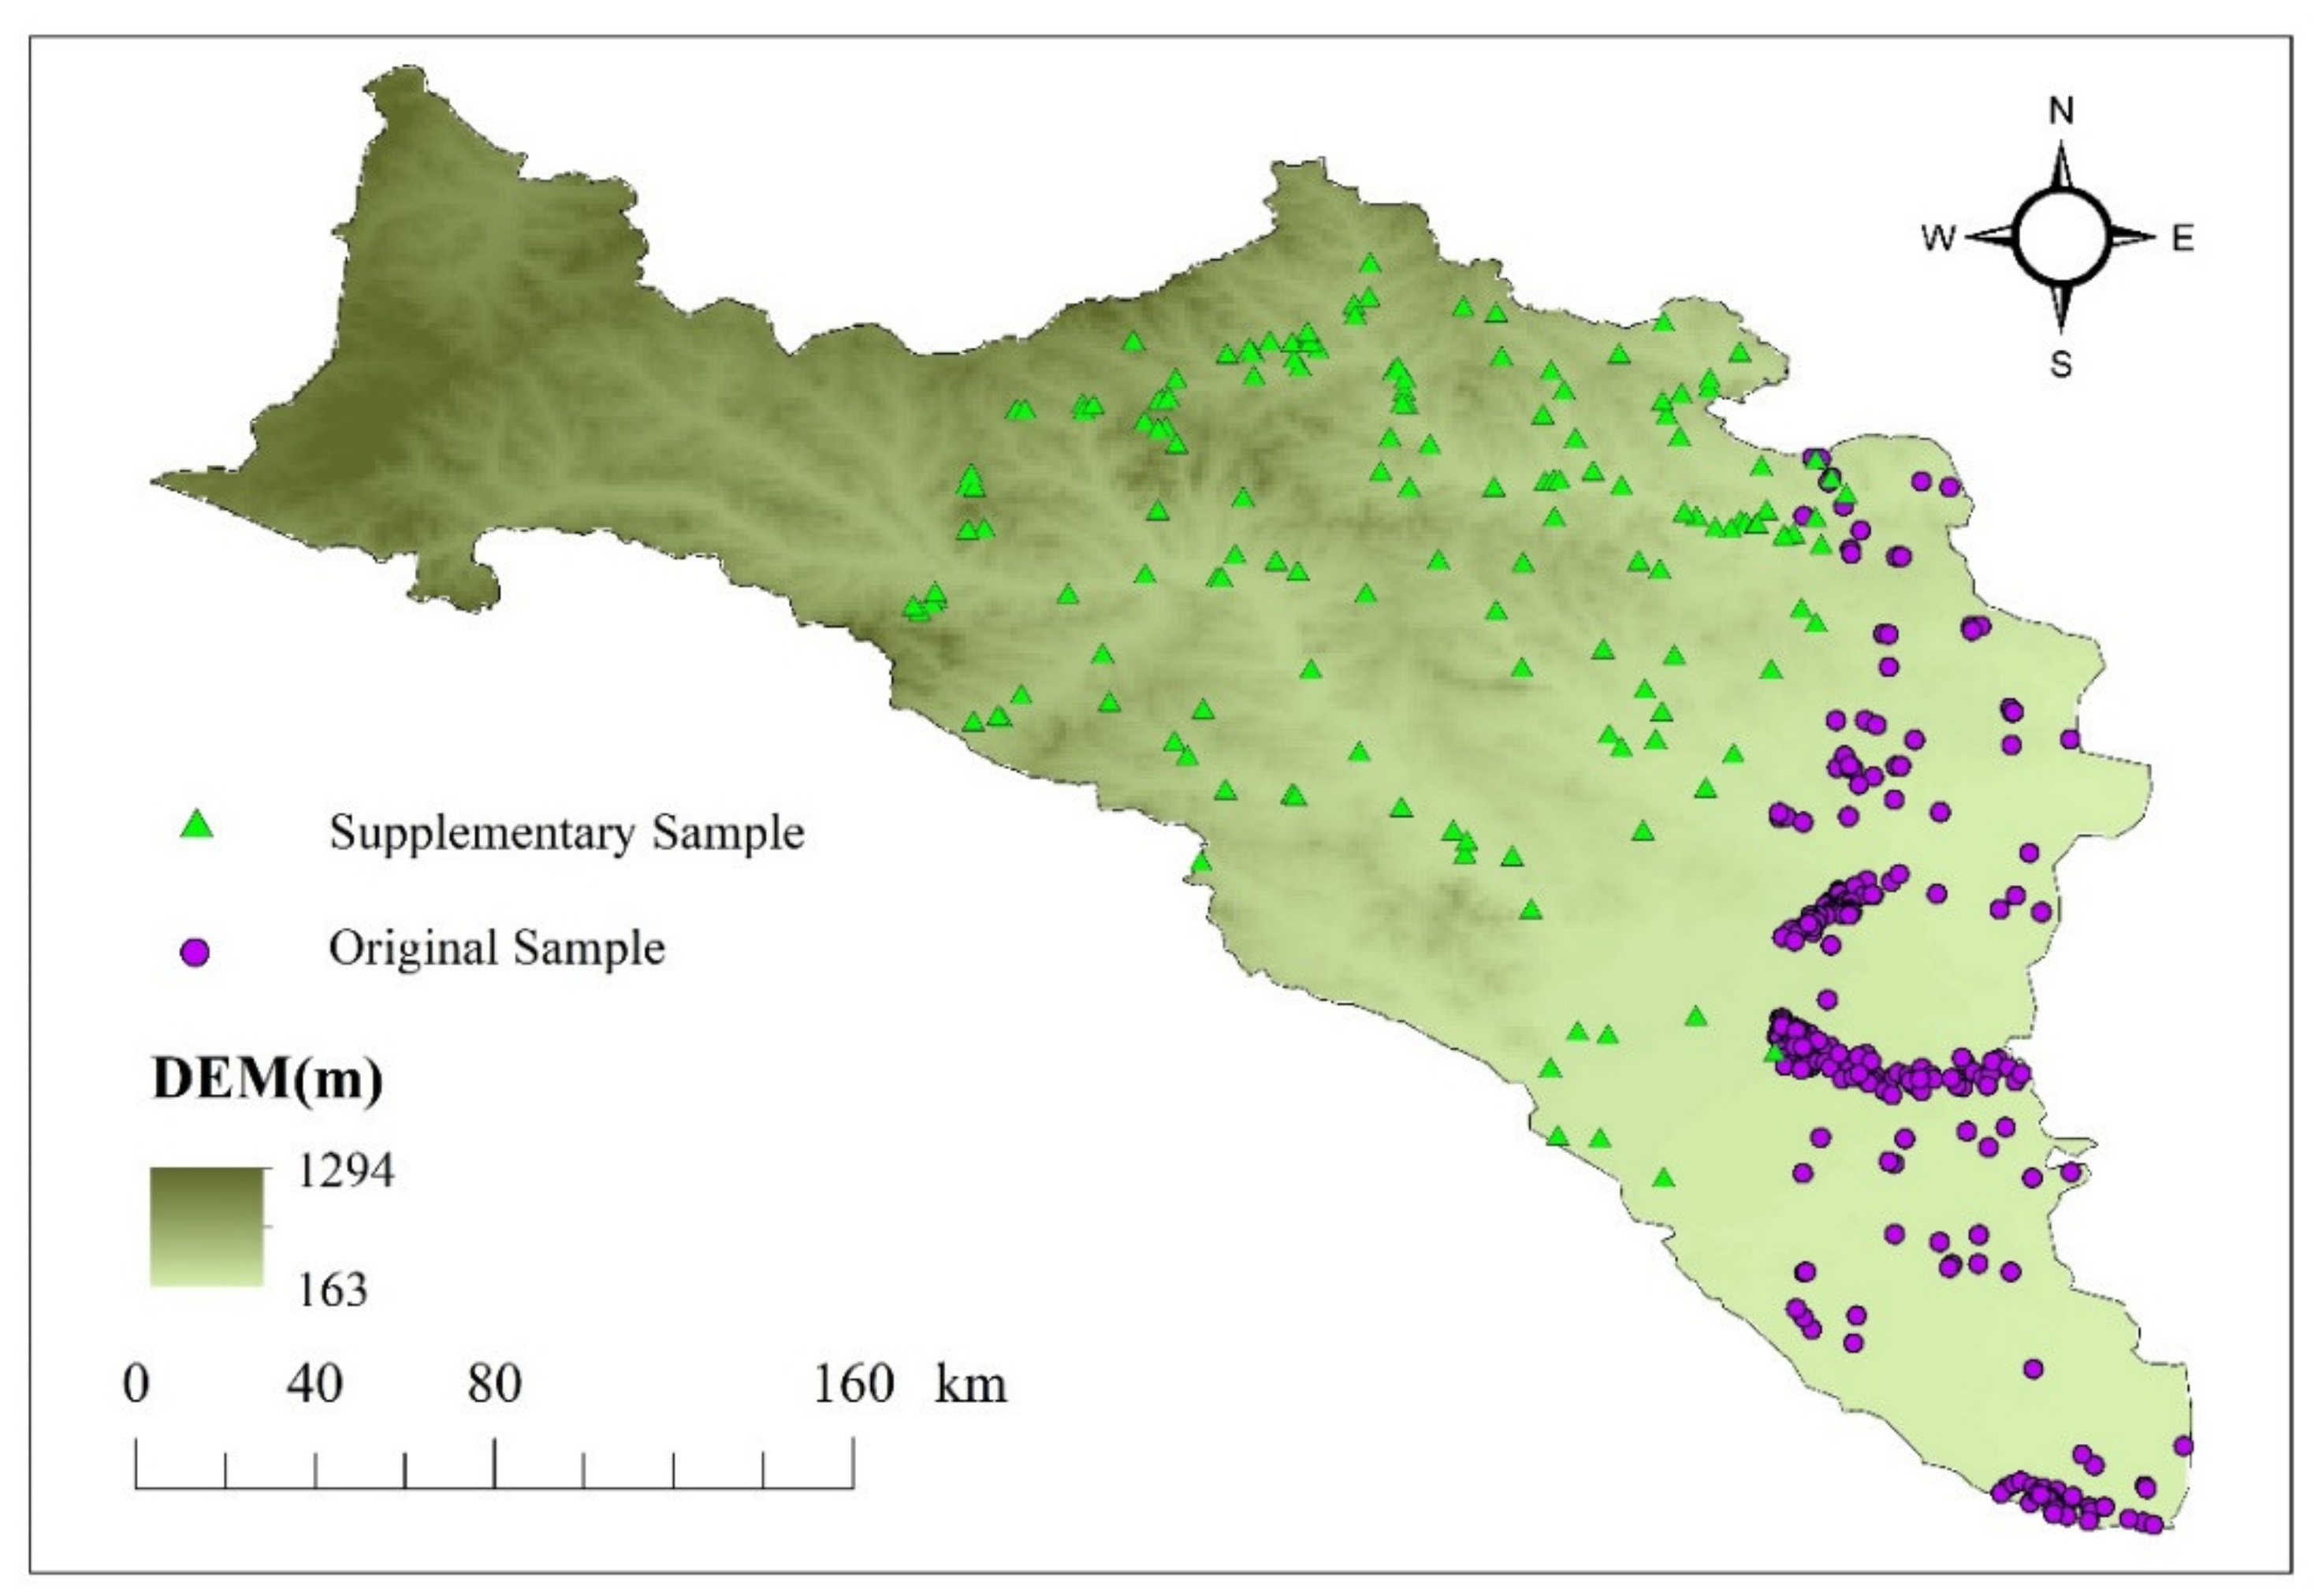
Real and reliable samples lay a basis for ensuring the accuracy of deep learning model training and classification results. From July 20 to August 30, 2019, a crop planting structure survey was carried out in the Xing’an League research area. A total of 60 corn sampling points, 25 rice sampling points, and 41 sunflower sampling points were acquired using the handheld Global Positioning System (GPS) (GARMIN ETREX 32 X). To avoid the appearance of mixed pixels, the area of the sampling points was greater than 100 m × 100 m. The spatial distribution of sampling points (Figure 3) suggests that sunflowers are largely distributed in the northeastern part of the study area, summer maize is mainly distributed in the southern part of the study area, and rice is distributed in the east along the river.
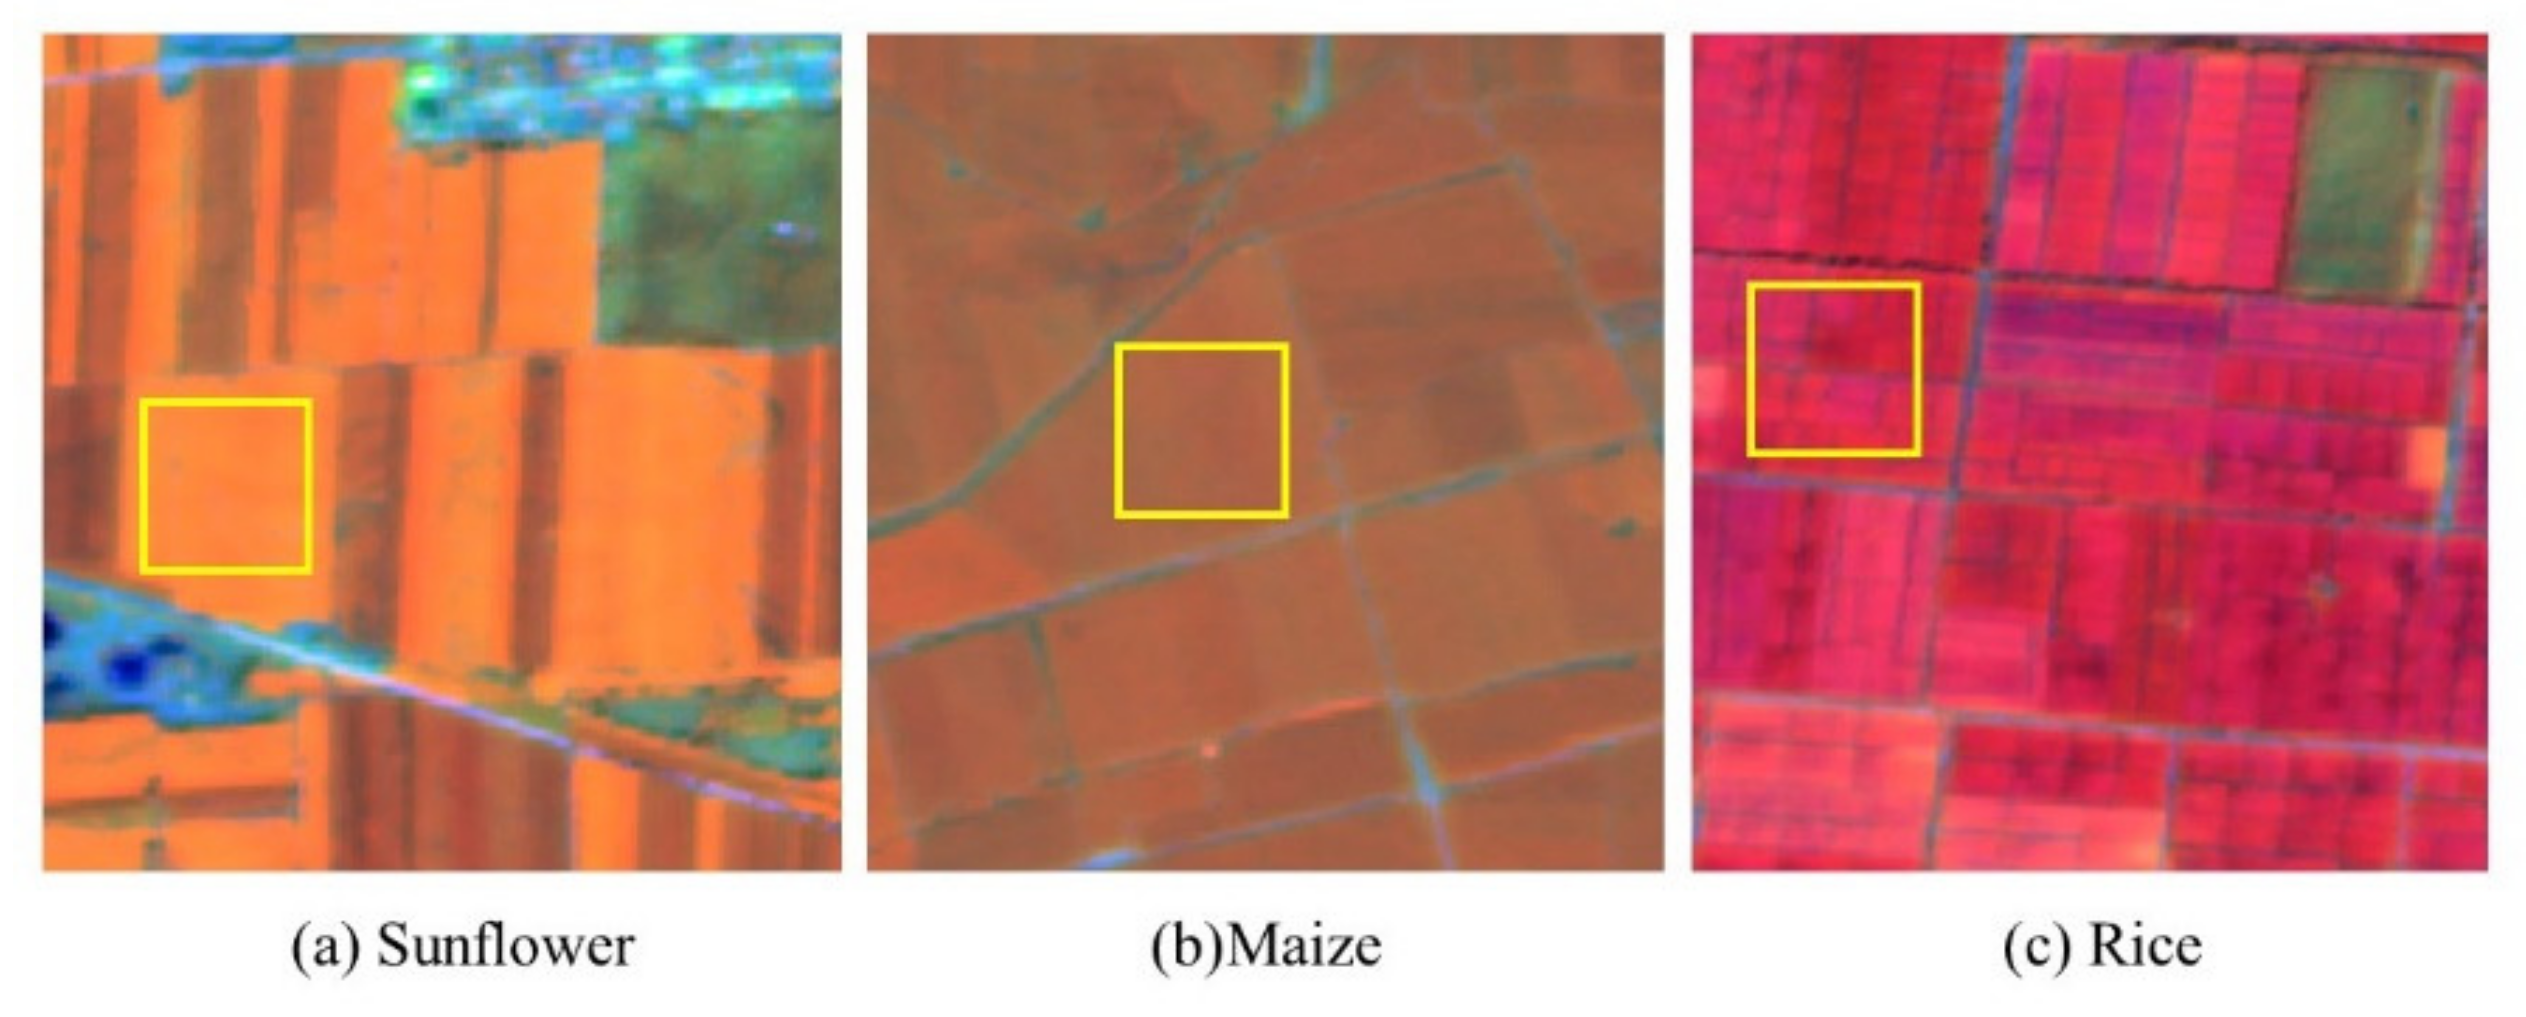
The optimal classification window was determined from 20 July to 25 August, 2019 in accordance with the phenological characteristics and NDVI index of local sunflower, corn, and rice. Sentinel-2 L1C images with a cloud cover of less than 5% in the study area were selected and downloaded, including five scenes in the Xing’an League study area (T51TVL, T51TVK, T51TUL, T51TUK, T51TUM) and four scenes in the Hetao Plain study area (T48TXK, T48TXL, T49TBF, T49TCF). In view of the problems of uneven distribution and offset of samples collected in the field, the data collected in the field were superimposed and displayed with Sentinel-2 images of the same period in this study. False color synthesis (band8, band11, and band4) of specific band combinations is used to enhance the discrimination between different target features, so as to carry out sample correction. In order to show clearer details, we use small tiles of 256 × 256 pixels for visual analysis of the image. Figure 2 presents the texture and color characteristics of sunflower, maize, and rice on false color images in the Xing’an League study area.
The detection and classification performance of a deep learning model is largely dependent on the type and quantity of training samples. The richer the types and number of samples, the better the performance of the model and the better the generalization performance will be [27]. In this study, the regions with the same features were visually interpreted, and the Region of Interest (ROI) was delineated to expand the samples based on the texture, color, and other features of existing samples on false color Sentinel-2 images. At the same time, the detailed information on the GF-1 images was used as auxiliary data, so that the boundary of the ROI falls within a pure crop field. To avoid the interference of the surrounding complex environment on the crop recognition effect, negative samples (e.g., water bodies and other crops) were added (Figure 3). In addition, manual plotting does not require pixel-level sample labeling, but only the interior of typical crop planting areas, and necessary negative samples are labeled with vector polygons. The expanded sample distribution was more uniform, which is beneficial to increase the stability of the model.
The number of ROIs and pixel points of a wide variety of samples is listed in Table 2.

2.2.3. Auxiliary Data

This study selects Google Earth images (spatial resolution of 1 m) as the direct verification data for the crop identification results in this study. Moreover, the 2019 Inner Mongolia Autonomous Region Statistical Yearbook (http://tj.nmg.gov.cn, accessed on 20 April 2022) was collected, which included data on the sown area and crop yield of a wide variety of crops at the county scale, which was used to indirectly verify the reliability of this study.

2.3. Methods and Models

The main ideas of this research mainly include the following three aspects: (1) The dataset was constructed, including sample data extraction, cleaning, and equalization, and the integration of neighborhood information into the sample; (2) Based on the divided dataset, a classification model was built for three crops of maize, sunflower, and rice; (3) The applicability of the crop extraction model was verified, the model was transferred to the Hetao Plain to identify crops in the same period, the crop distribution map of the Hetao Plain of 2019 was generated pixel by pixel, and Google Earth high-resolution images and statistical yearbook data were adopted to verify crop identification precision.

2.3.1. Sample Data Cleaning and Division

To reduce the labeling cost, the sketched samples are polygon vectors, inconsistent with the pixel-level samples required by the model. Thus, in this study, the ROI and the image corresponded one by one through the sample vector polygon and the geographic coordinates of the image. The ray method [28] was adopted to judge whether the pixel is in the vector polygon; if so, the value of each band of the pixel and the corresponding sample label value were recorded. Since there may be mixed pixels in remote sensing images, quartile box plots (Figure 4) were drawn in this study for three crops (maize, rice, sunflower) and water bodies to ensure the purity of the samples.
To increase the separability among crops, the reasonable range of spectral values of the respective band of crop samples was obtained, and abnormal samples (As long as one of the IQR values of all bands is out of range, it will be discarded.) beyond this range were deleted to reduce the classification complexity of the feature space. The specific operations are elucidated as follows.
The quartiles of each band of all samples were calculated, including the upper quantile Q1, the median Q2, and the lower quantile Q3. The center points were sorted by the numerical magnitude of each band to obtain the positions of the quartiles:
Q 1 = n + 1 4 Q 2 = n + 1 2       Q 3 = 3 n + 1 4
where n denotes the number of samples. The next step calculates the interquartile range:
I Q R = Q 3 Q 1
Subsequently, the reasonable range of each band of the sample is written as:
Q 1 1.5 I Q R ~ Q 3 + 1.5 I Q R
For model training, sample imbalance will negatively affect the training effect. To obtain the optimal model for crop identification, this study counts the number of samples to obtain the proportion of different crop samples. Proportional replication was performed for samples with a small proportion, and the samples were balanced before training.
To monitor the training situation of the model and verify the accuracy of the model, the sample dataset was randomly divided into a training set and a verification set according to 7:3. The training set was used to train the network, and the validation set was adopted to monitor training and evaluate model performance.

2.3.2. Sample Neighborhood Information Acquisition

Xing’an League is located in the transition zone between the Greater Xing’an Mountains and the Songnen Plain. The cultivated land is fragmented and the fields are scattered. Crop identification faces many interference factors. The existing crop remote sensing recognition algorithms often only employ the grayscale information of pixels without considering the spatial information. Often due to the effect of factors such as noise, partial volume effects, and artifacts, the classification results are inaccurate, and the “salt and pepper phenomenon” occurs.
Existing research suggested that the high correlation between pixels and their neighbors is an essential feature of images [29]. If the neighboring pixels around a pixel are assumed to belong to the same class, the pixel also belongs to this class. Integrating neighborhood information in the classification process can increase the separability between crops for areas with complex crop types and large differences in coverage. Accordingly, in this study, the spectral value and positional relationship of each pixel in the sample vector polygon and its k × k neighborhood of k2 pixels in total were saved as text in the order from top to bottom and from left to right. A sample dataset rich in grayscale and spatial information was generated, the anti-noise ability of image segmentation was enhanced, and the effect of crop recognition was effectively improved.

2.3.3. Crop Classification Model Construction

To solve the problem of low accuracy and poor timeliness in large-area crop recognition, this study proposes a crop recognition strategy Skcnn_Tabnet, which uses the tabular network Tabnet as a classifier. By adding the channel attention module to the Tabnet network in the feature extraction stage, the network can pay attention to the spectral features of crops, while placing more stress on the structure and texture of crops. With the use of the soft feature selection mechanism of the Tabnet network, the crop extraction model has a stronger generalization ability and a more reasonable classification effect at the feature classification stage. Moreover, the Convolutional Neural Network (CNN) was used to extract features of different scales, and they were fused with the features extracted by the Tabnet network. The universality of the network was enhanced on remote sensing images of different scales. Compared with conventional machine learning, the complex feature selection module was omitted, resulting in end-to-end training.
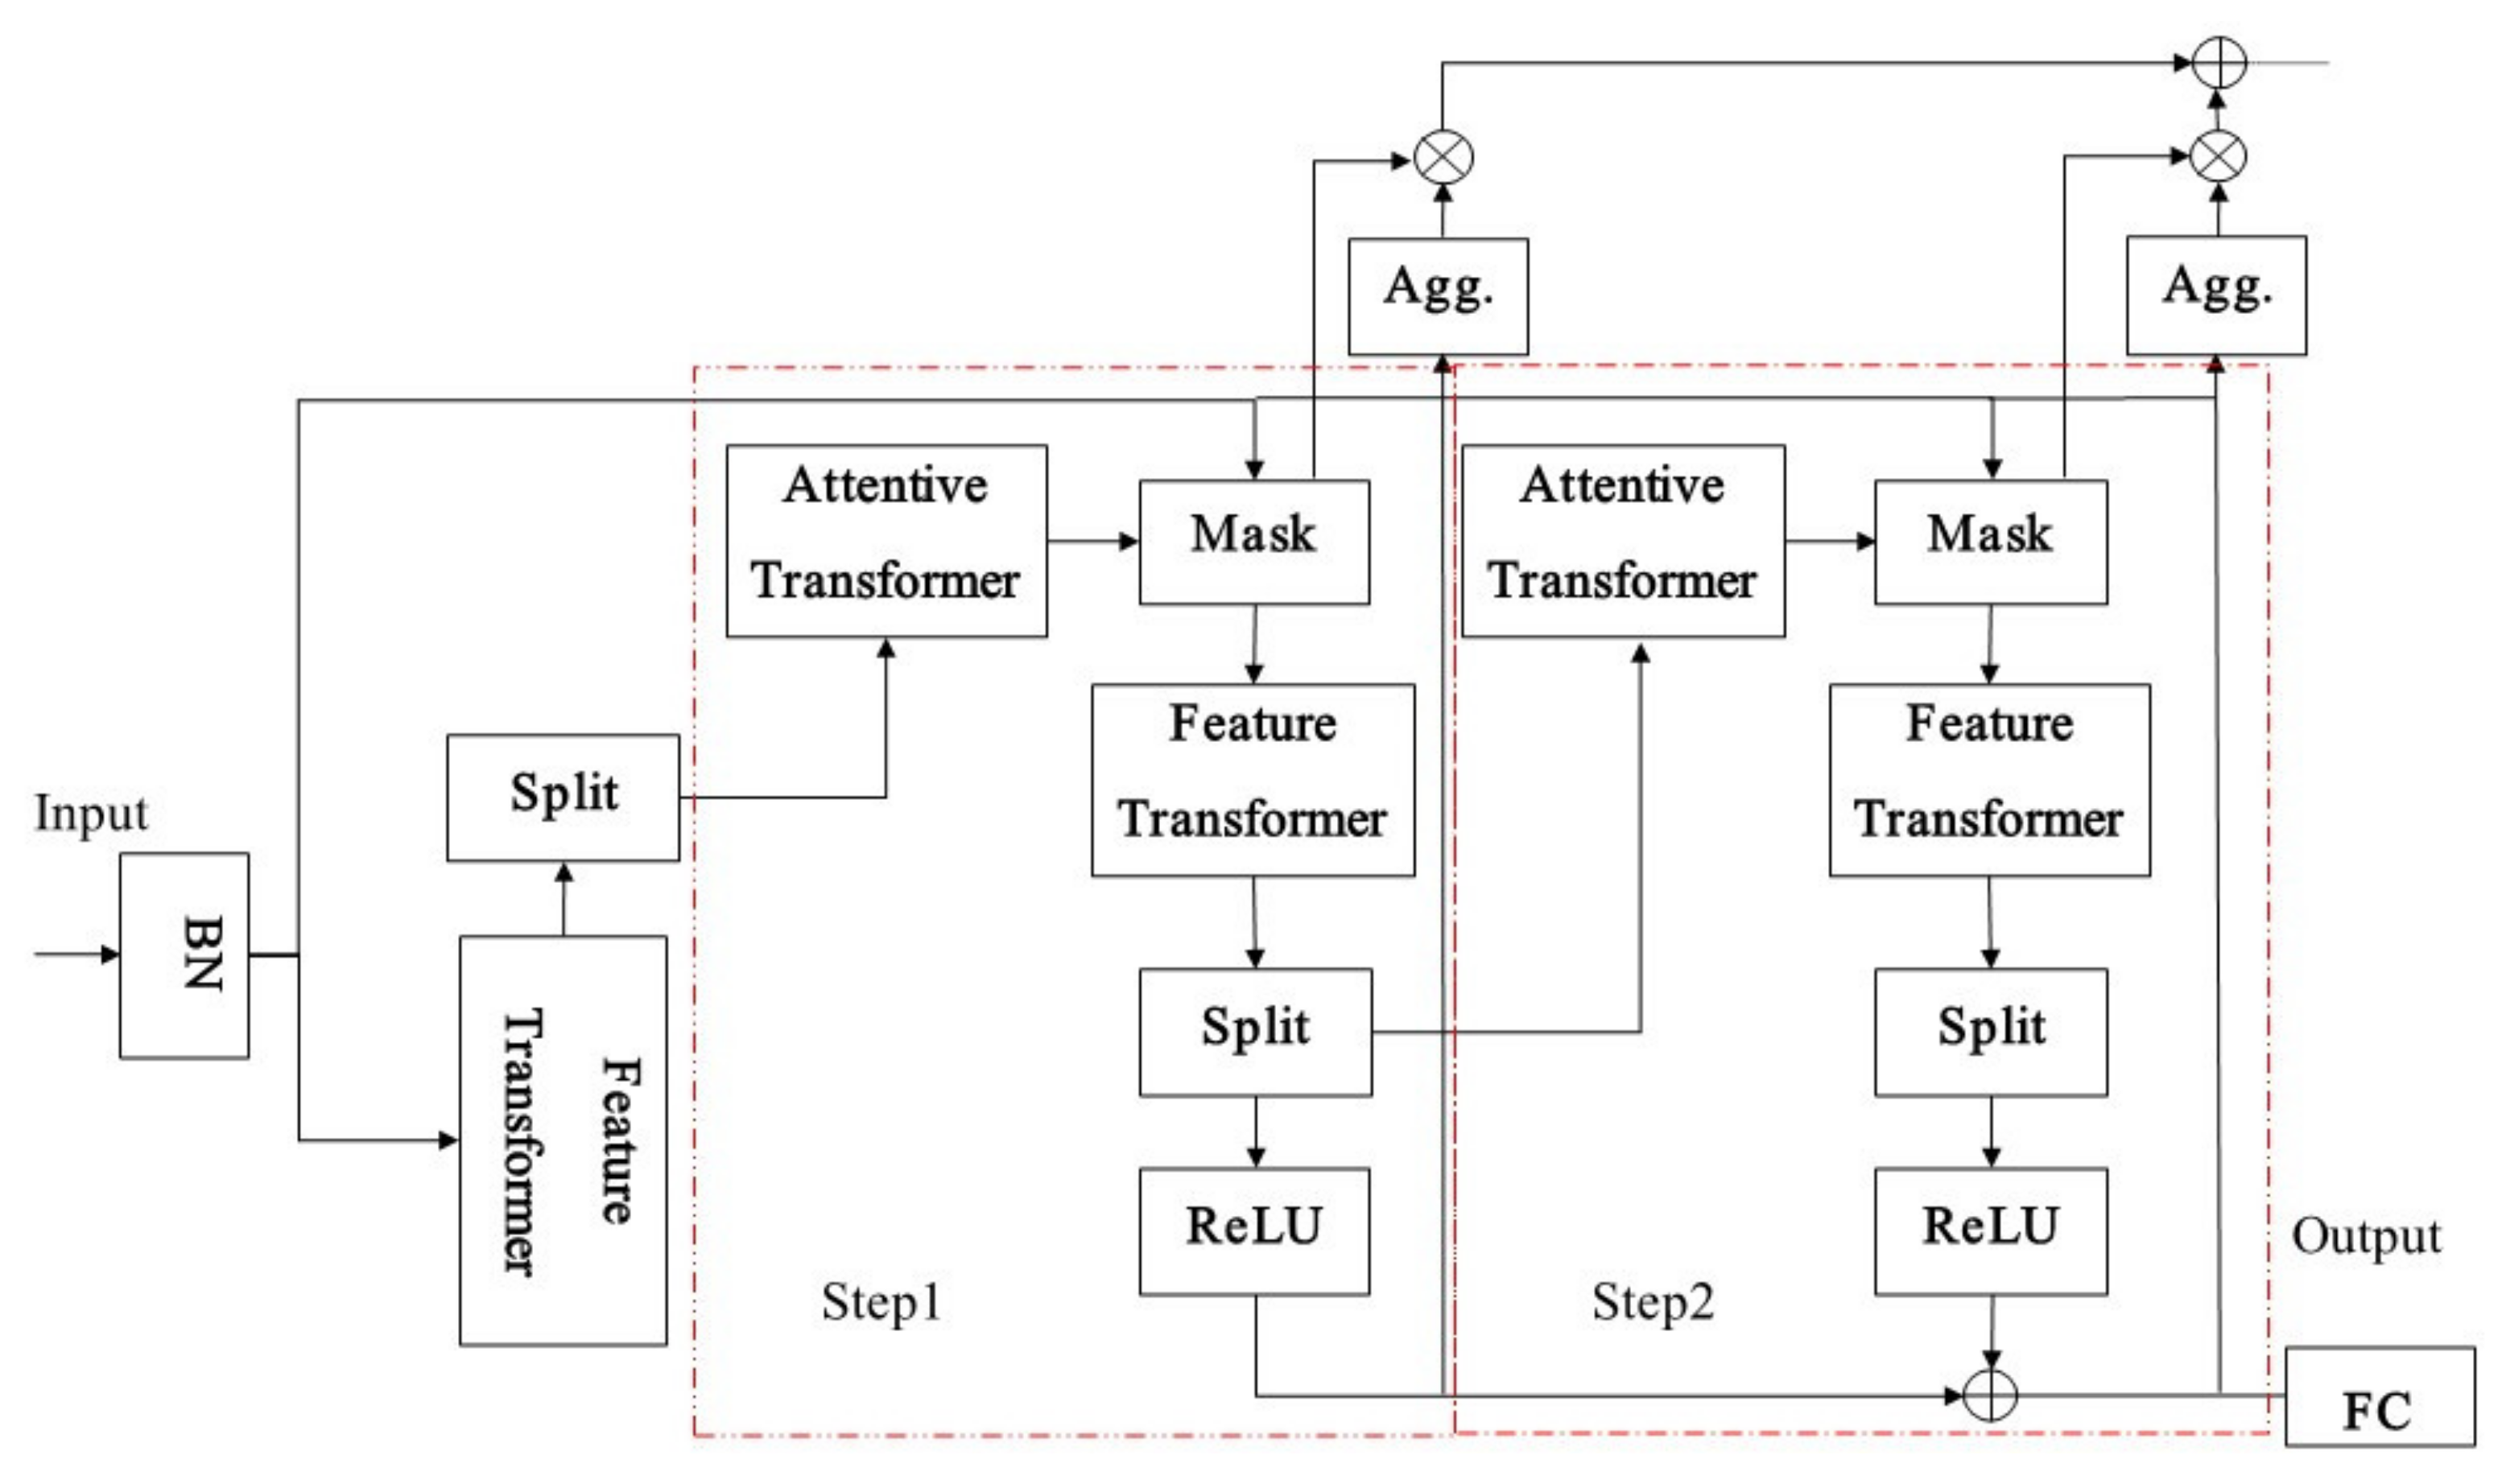
Tabnet was originally used to classify tabular data [30]. Based on the performance of decision trees, the network constructed a process with a hyperplane decision manifold similar to decision trees by determining the feature contribution coefficients in the decision-making process. Compared with conventional methods based on Deep Neural Networks (DNN), Tabnet has powerful soft feature selection capabilities in addition to controlling sparsity through sequential attention. For instance, in hyperspectral remote sensing crop classification, Tabnet considers multiple spectral features instead of only focusing on several important red-edge band features. Tabnet’s soft feature selection mechanism can avoid complex problems (e.g., “same substance, different spectrum, same spectrum foreign matter”) to a certain extent. The basic encoder structure of Tabnet is presented in Figure 5:
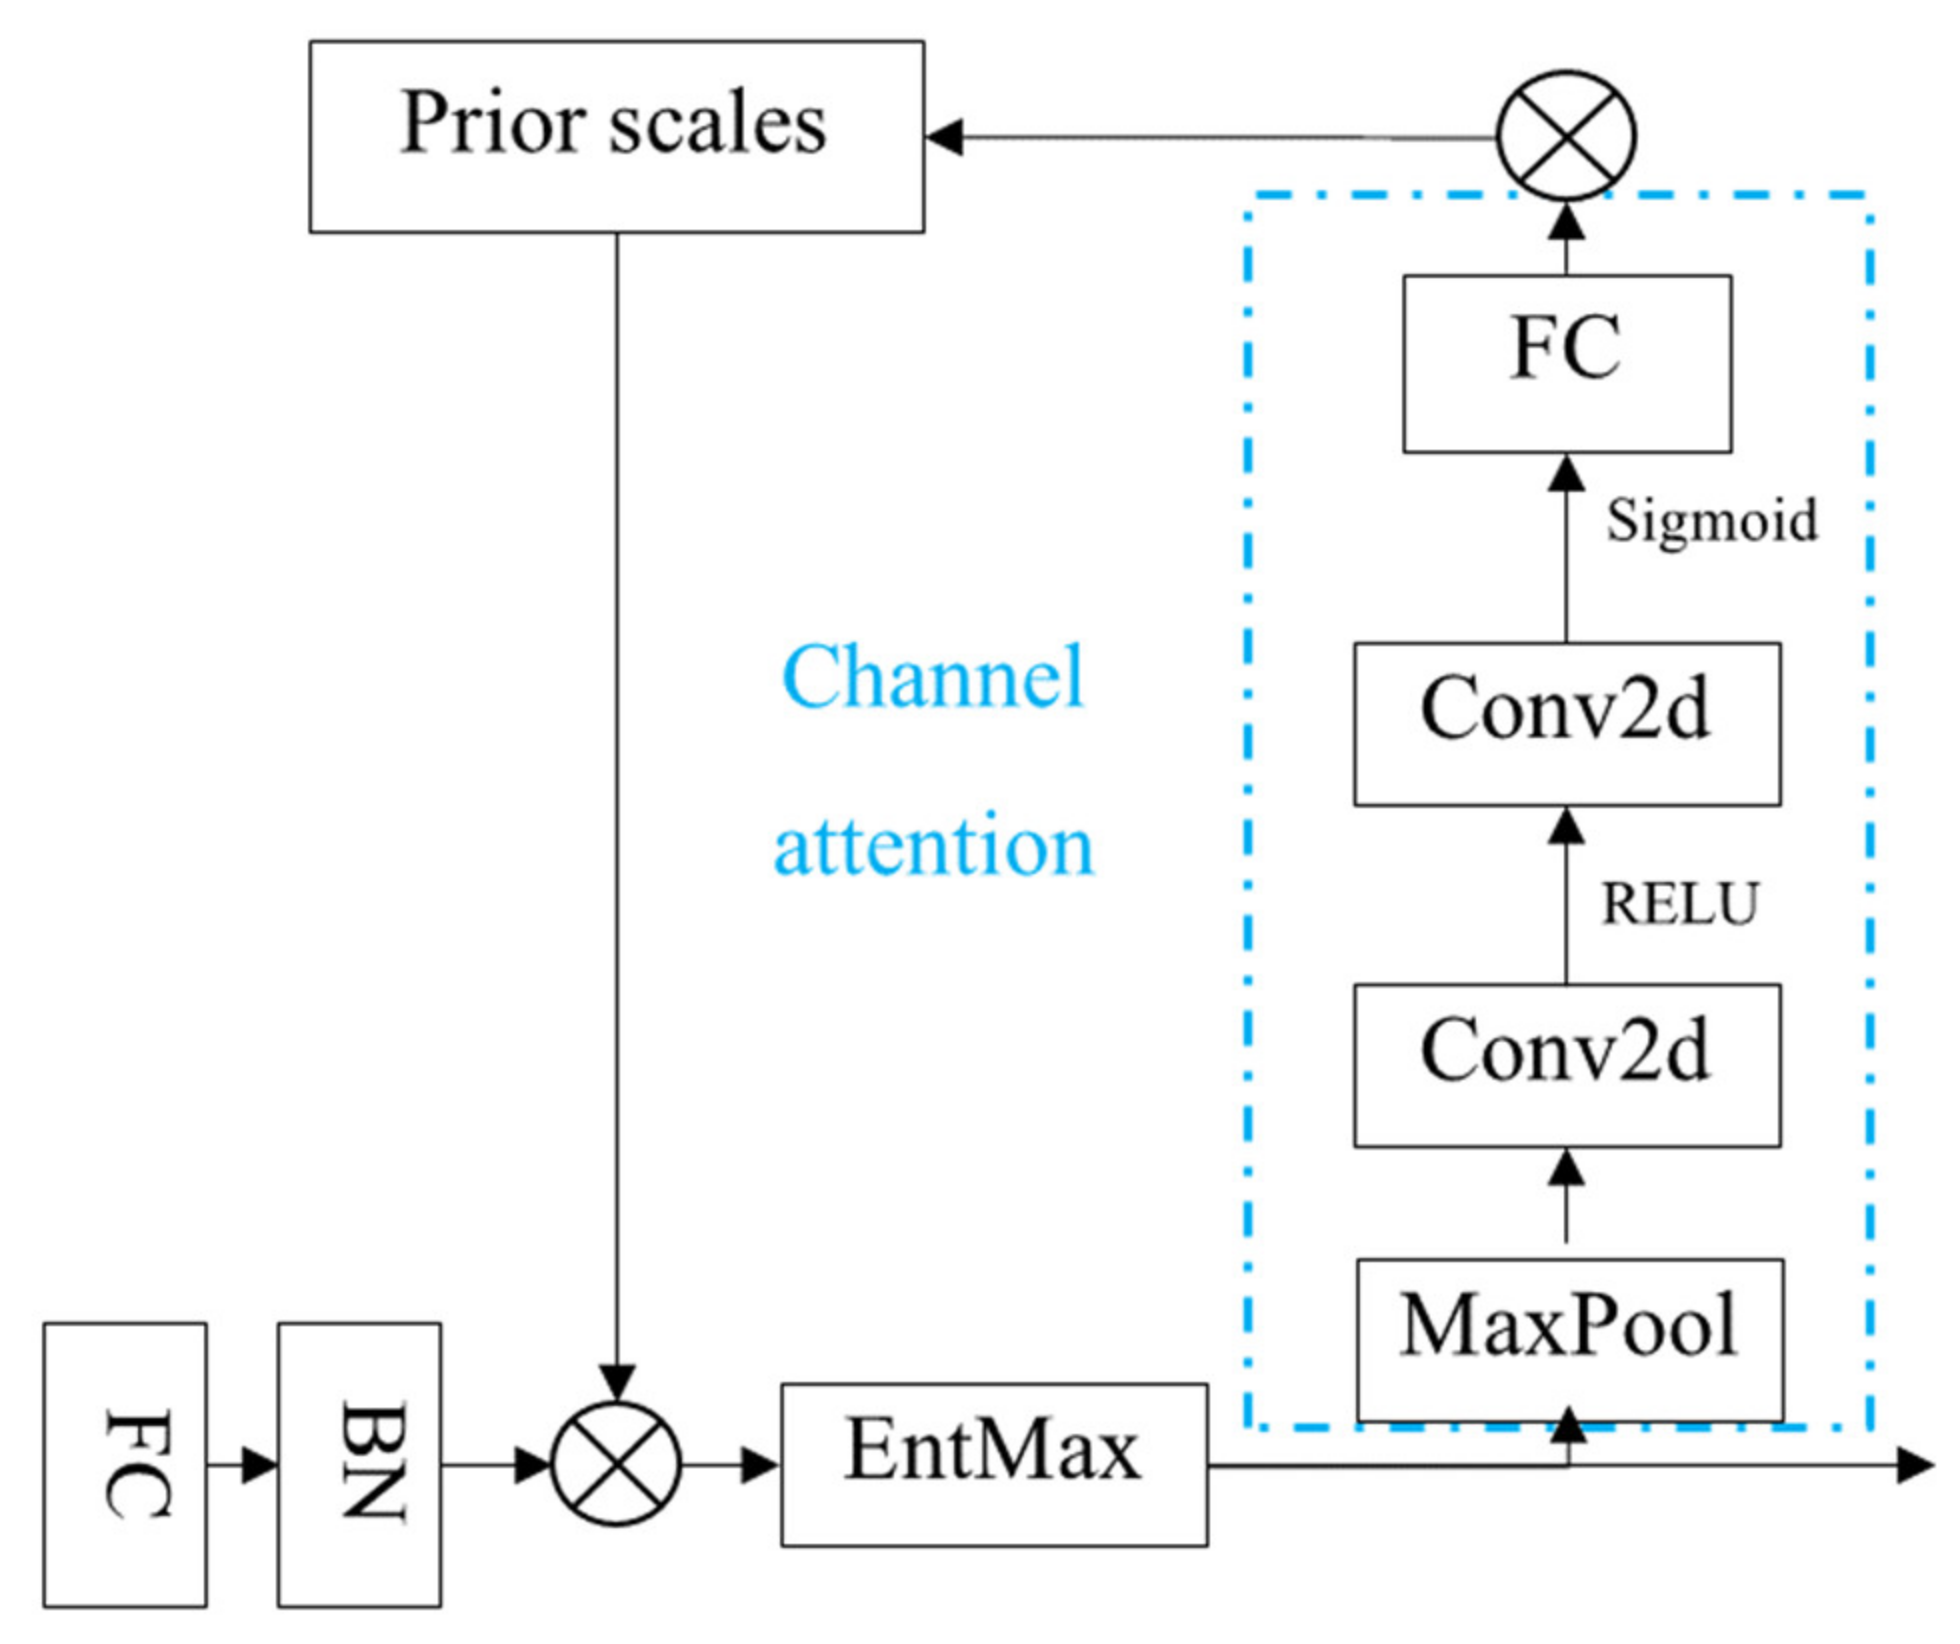
The improvement in this study is mainly to add channel attention to the Attentive transformer module (Figure 6). After the EntMax module, a channel attention module composed of a Maximum Pooling layer (MaxPool), a convolutional layer (Conv2d), and a Fully Connected layer (FC) was added respectively. Where the first convolution is used for channel compression, and the second convolution expanded the channel to input channel C. The sigmoid function was used to map the weights of the C channels between 0 and 1. The channel attention feature map was obtained after multiplying the input feature map with the weights. Lastly, the FC layer generates channel attention feature maps, which were used as input to prior scales to update the abstract features generated by the FC and BN layers within the Attentive transformer. The addition of channel attention reduces the limitations of local perception of convolutional neural networks to a certain extent. Extending single channel to multi-channel optimizes feature extraction and facilitates the improvement of model efficiency and accuracy, which is suitable for hyperspectral remote sensing crop extraction with complex spectral features.

2.3.4. Accuracy Evaluation

A total of 30% of the sample data were adopted to examine the classification accuracy of crop types. Four precision evaluation indicators could be obtained: F1 score, overall classification accuracy (OA), precision rate (Precision), and recall rate (Recall). They were adopted to evaluate the precision and compare the classification performance between different models. The specific calculation method is expressed in Equation (4):
O A = i = 1 n p i , i j = 1 n i = 1 n p i , j
where pi,i represents the pixel that is classified into the i-th crop and belongs to the i-th crop; pi,j denotes the pixel that belongs to the i-th crop and is classified into the j-th crop. OA more effectively represents the overall classification accuracy. By comparing with the sample labels, the total number of correct extractions of crop classification pixels-true positive (TP), total wrong extraction-false positive (FP) and total missing points-false negative (FN), Thus, the precision and recall rates of a wide variety of crops are calculated as:
P r e c i s i o n = T P T P + F P
R e c a l l = T P T P + F N
The F1 score is an indicator adopted in statistics to measure the accuracy of the classification model. This indicator considers the precision and recall of the classification model simultaneously. It is a harmonious evaluation of the precision and recall. The F1 score is expressed as follows:
F 1 = 2 P r e c i s i o n R e c a l l P r e c i s i o n + R e c a l l

3. Experiments and Results

3.1. Neighborhood Size Determination

The neighborhood information of an image has been found as a vital feature for crop recognition. Moreover, the choice of neighborhood size takes on a critical significance to the recognition effect. Excessive neighborhood information will reduce the effect of the central pixel, which may negatively affect the extraction of small fields and boundary points. If the neighborhood information is too small, it cannot be ensured that sufficient features are extracted. During the model building process, the neighborhood information of 3 × 3 pixels, 5 × 5 pixels and 7 × 7 pixels was adopted for the test based on the MLP network, and the model accuracy and the test effect were compared to select the most suitable neighborhood size. Lastly, the optimal neighborhood size was determined as 5 × 5 pixels (Figure 7).
The test results showed a considerable number of broken spots before the neighborhood information was added. When the neighborhood size was set to 3 × 3 pixels, the salt and pepper phenomenon was improved, whereas the boundary was still not significant. When the neighborhood size was set to 7 × 7 pixels, numerous sunflowers were mistakenly detected as maize, and the field boundary also showed a corrosion phenomenon. Only when the neighborhood size was 5 × 5 pixels, the sunflowers and maize were accurately distinguished, and the boundary information was effectively extracted.

3.2. Experiments

Three classification algorithms, including the common crop identification algorithm, RF, and two mainstream deep learning segmentation algorithms (UNet and Deeplabv3+), were selected in this study based on the same Sentinel-2 image data in the Xing’an League area to more comprehensively evaluate the performance of Skcnn_Tabnet. Model training was conducted, and the corresponding crop extraction results were predicted. RF is a classification method based on multi-decision tree voting proposed by Breiman [31]. Chen et al. [32] proposed the Deeplabv3+ method, which is a hybrid architecture based on a backbone network and codec, preserving the resolution of feature maps using atrous convolution and extracting features at different scales based on ASPP (atrous spatial pyramid pooling) module. The UNet method was proposed by Ronneberger et al. [33]. UNet is capable of retaining the features of the respective level in the encoder, up-sampling the feature map of the same size as the original image level by level in the decoder, and fusing it with the low-level features of the corresponding level in the encoder.
The software and hardware environment, parameter configuration, loss function, and optimization mechanism of the four network models in this study are consistent. The setting of the respective optimal parameter underwent several parameter adjustments and trials and had errors to ensure the reliability of the experiment. Lastly, the learning rates of the three deep learning models were determined based on the WarmUp strategy and the adaptive learning rate strategy. The initial learning rate was 1e-4 at the WarmUp stage, which was increased to 1e-3 after 10 epochs. At the adaptation stage, when the accuracy of the validation set no longer was increased for 10 consecutive epochs, the learning rate was multiplied by a factor of 0.3. The maximum training epoch was 300 epochs. The loss function was the sum of cross entropy and Lovasz Loss, and the optimizer employed Adam. The key parameter number of estimators for RF was set to 300 with a max depth of 25. To make the accuracy more objective, we randomly trained each model ten times. We computed the average accuracy of each model as the metric of the final accuracy comparison. We also presented the performance variation range (Absolute deviation) with ±.
The best overall accuracy and single-class accuracy of the extraction results corresponding to the four network models were calculated based on pixels in accordance with the accuracy evaluation method proposed in Section 2.3.4 (Table 3).
Deeplabv3+ optimizes the segmentation effect of objects of different scales by introducing ASPP convolution. However, the overall accuracy is low due to the low classification accuracy of sunflower and other categories. UNet retains more detailed information by fusing context information. Both the single-class accuracy and the overall accuracy of crop recognition have been increased to a certain extent. The accuracy scores of the classification results of Skcnn_Tabnet suggest that the soft feature selection mechanism and channel attention of the Skcnn_Tabnet network can significantly increase the accuracy of crop remote sensing classification results. The overall accuracy of these classification results reaches 0.9270, which is 0.1121, 0.1004, and 0.0874 higher than Deeplabv3+, UNet, and RF methods, respectively. For the single class, the average IoU and F1 Scores of Skcnn_Tabnet for five types of ground objects are 0.1818 and 0.1103 higher than Deeplabv3+, and 0.1543 and 0.0895 higher than UNet. The above analyses reveal that the Skcnn_Tabnet network is highly promising in the field of crop remote sensing classification.
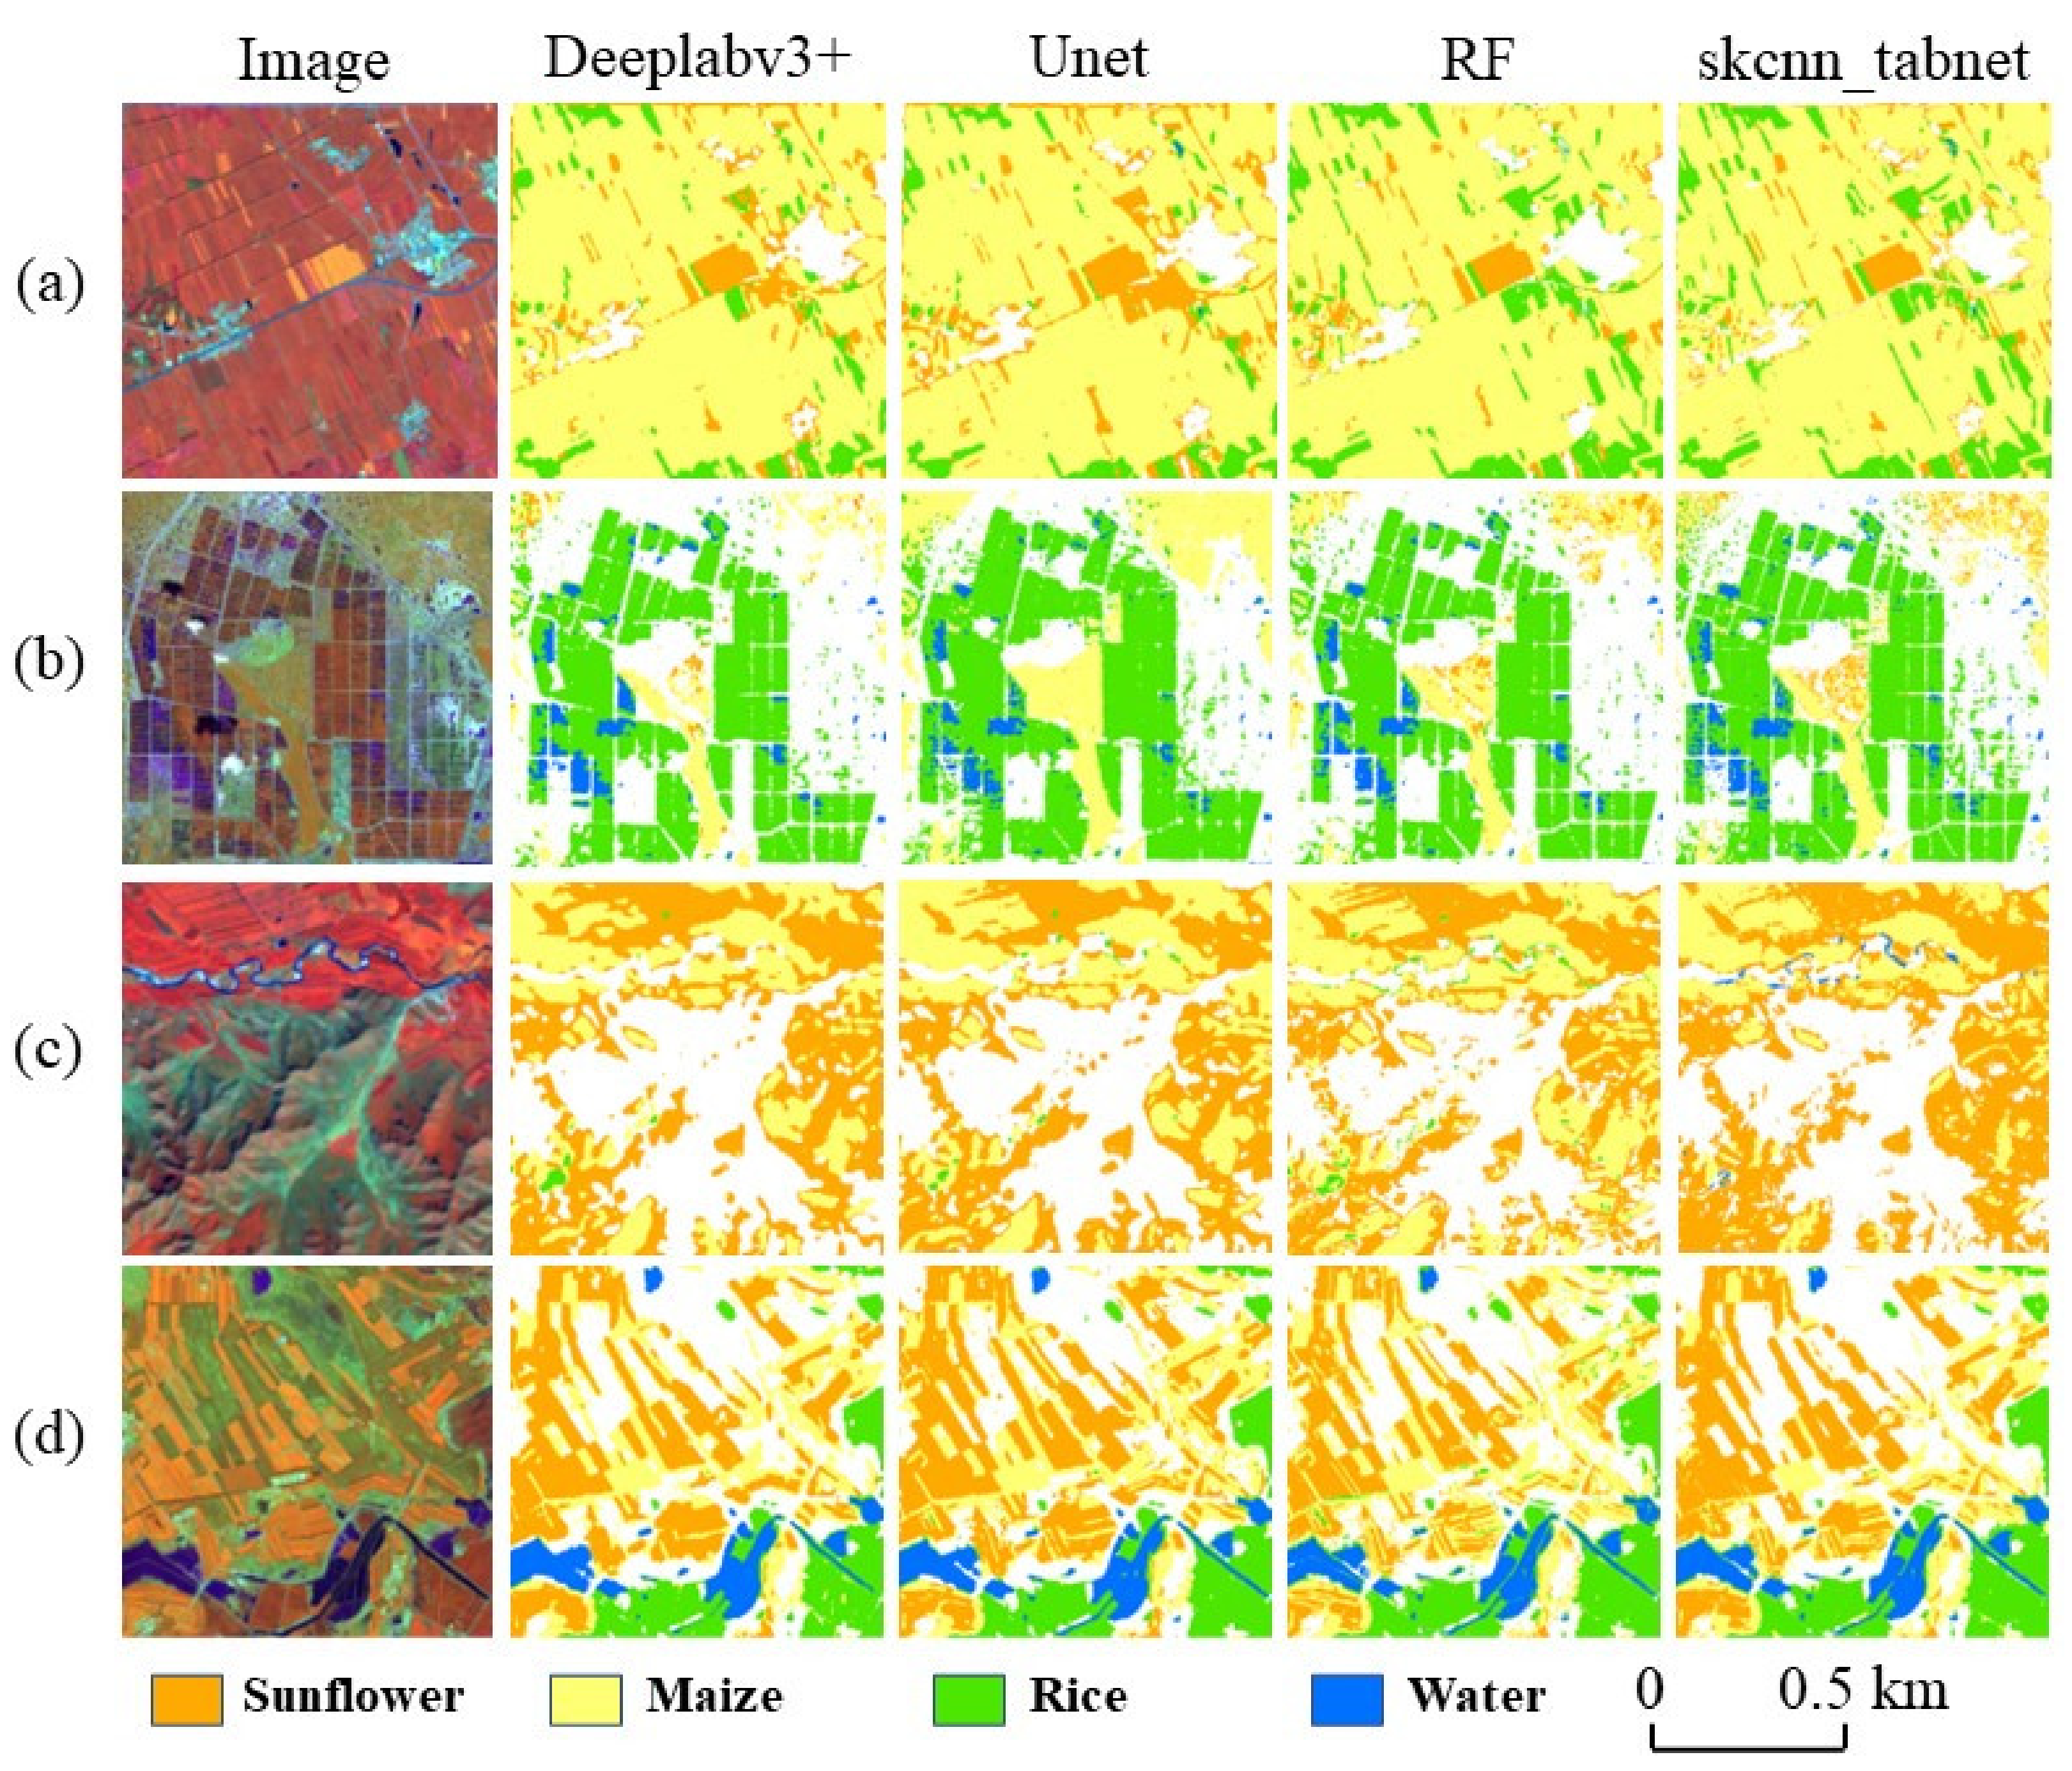
Four sets of local images in Xing’an League are selected in this study from the perspectives of multi-type mixed distribution, field size, and complex terrain to further evaluate and analyze the detailed characteristics of crop remote sensing classification results. The local results of the four network models in crop remote sensing classification (Figure 8) were compared and studied based on the standard false-color sentinel-2 images and referring to auxiliary data (e.g., Google Earth images). In order to show clearer details, we use small tiles of 512 × 512 pixels for visual analysis of the results. The first group of constituencies has a variety of crop types (e.g., sunflower, maize, and rice), and maize is primarily distributed in contiguous patches. The Skcnn_Tabnet method outperforms the other three methods to extract small plots of rice and sunflower mixed in the maize planting area. Deeplabv3+ and UNet misclassify rice as sunflower, whereas Skcnn_Tabnet is capable of accurately identifying rice. The second group of constituencies is relatively neat and has clear boundaries, mainly rice. The other three methods exhibit different degrees of corrosion in extracting field boundaries, and the field roads are wrongly divided into rice. In addition, the extraction effect of the detailed features of the field boundaries is significantly lower than that of Skcnn_Tabnet. The third group of constituencies is mountainous areas exhibiting complex topographies, of which a small amount of cultivated land and small water bodies are distributed in the valleys. The classification results showed that Deeplabv3+ misclassified numerous mountain shadows into sunflowers and maize, and the small water bodies between the valleys were not extracted. UNet and RF methods misclassified small water bodies as rice. The fourth group of constituencies is dominated by strip-shaped fields, in which some river water bodies and rice along the banks are also included. Except for the Skcnn_Tabnet classification results closest to the original images, the other three methods have significant errors in extracting field and water boundaries. The other three methods all misclassified a small number of unplanted or harvested fields as maize, and the details (e.g., the inner ridge of the field) are not as finely indicated as the Skcnn_Tabnet method.
In general, the cultivated land in the target area is complex, with sunflowers and corn staggered, and numerous small fields exist in the form of broken spots. The other three methods cannot effectively extract small fields. Notably, sunflowers in many corn fields were misclassified by the UNet model. Moreover, Skcnn_Tabnet is capable of extracting small fragmented fields. The reason for this finding is the addition of channel attention to the network, making the network more sensitive to the feature differences between corn and sunflower. Thus, the accuracy of crop remote sensing classification results is increased. In addition, the decoders in Deeplabv3+ and UNet networks lose boundary detail information during the upsampling process. As a result, the extraction results were gradually over-smoothed, and the tiny roads in some fields were corroded or misclassified as sunflowers. Skcnn_Tabnet is capable of extracting slender roads and ridges due to the soft feature selection mechanism and multi-scale feature extraction of the Tabnet network. The adaptive receptive field of the model is achieved, thus effectively increasing the overall classification accuracy.

3.3. Accuracy Verification

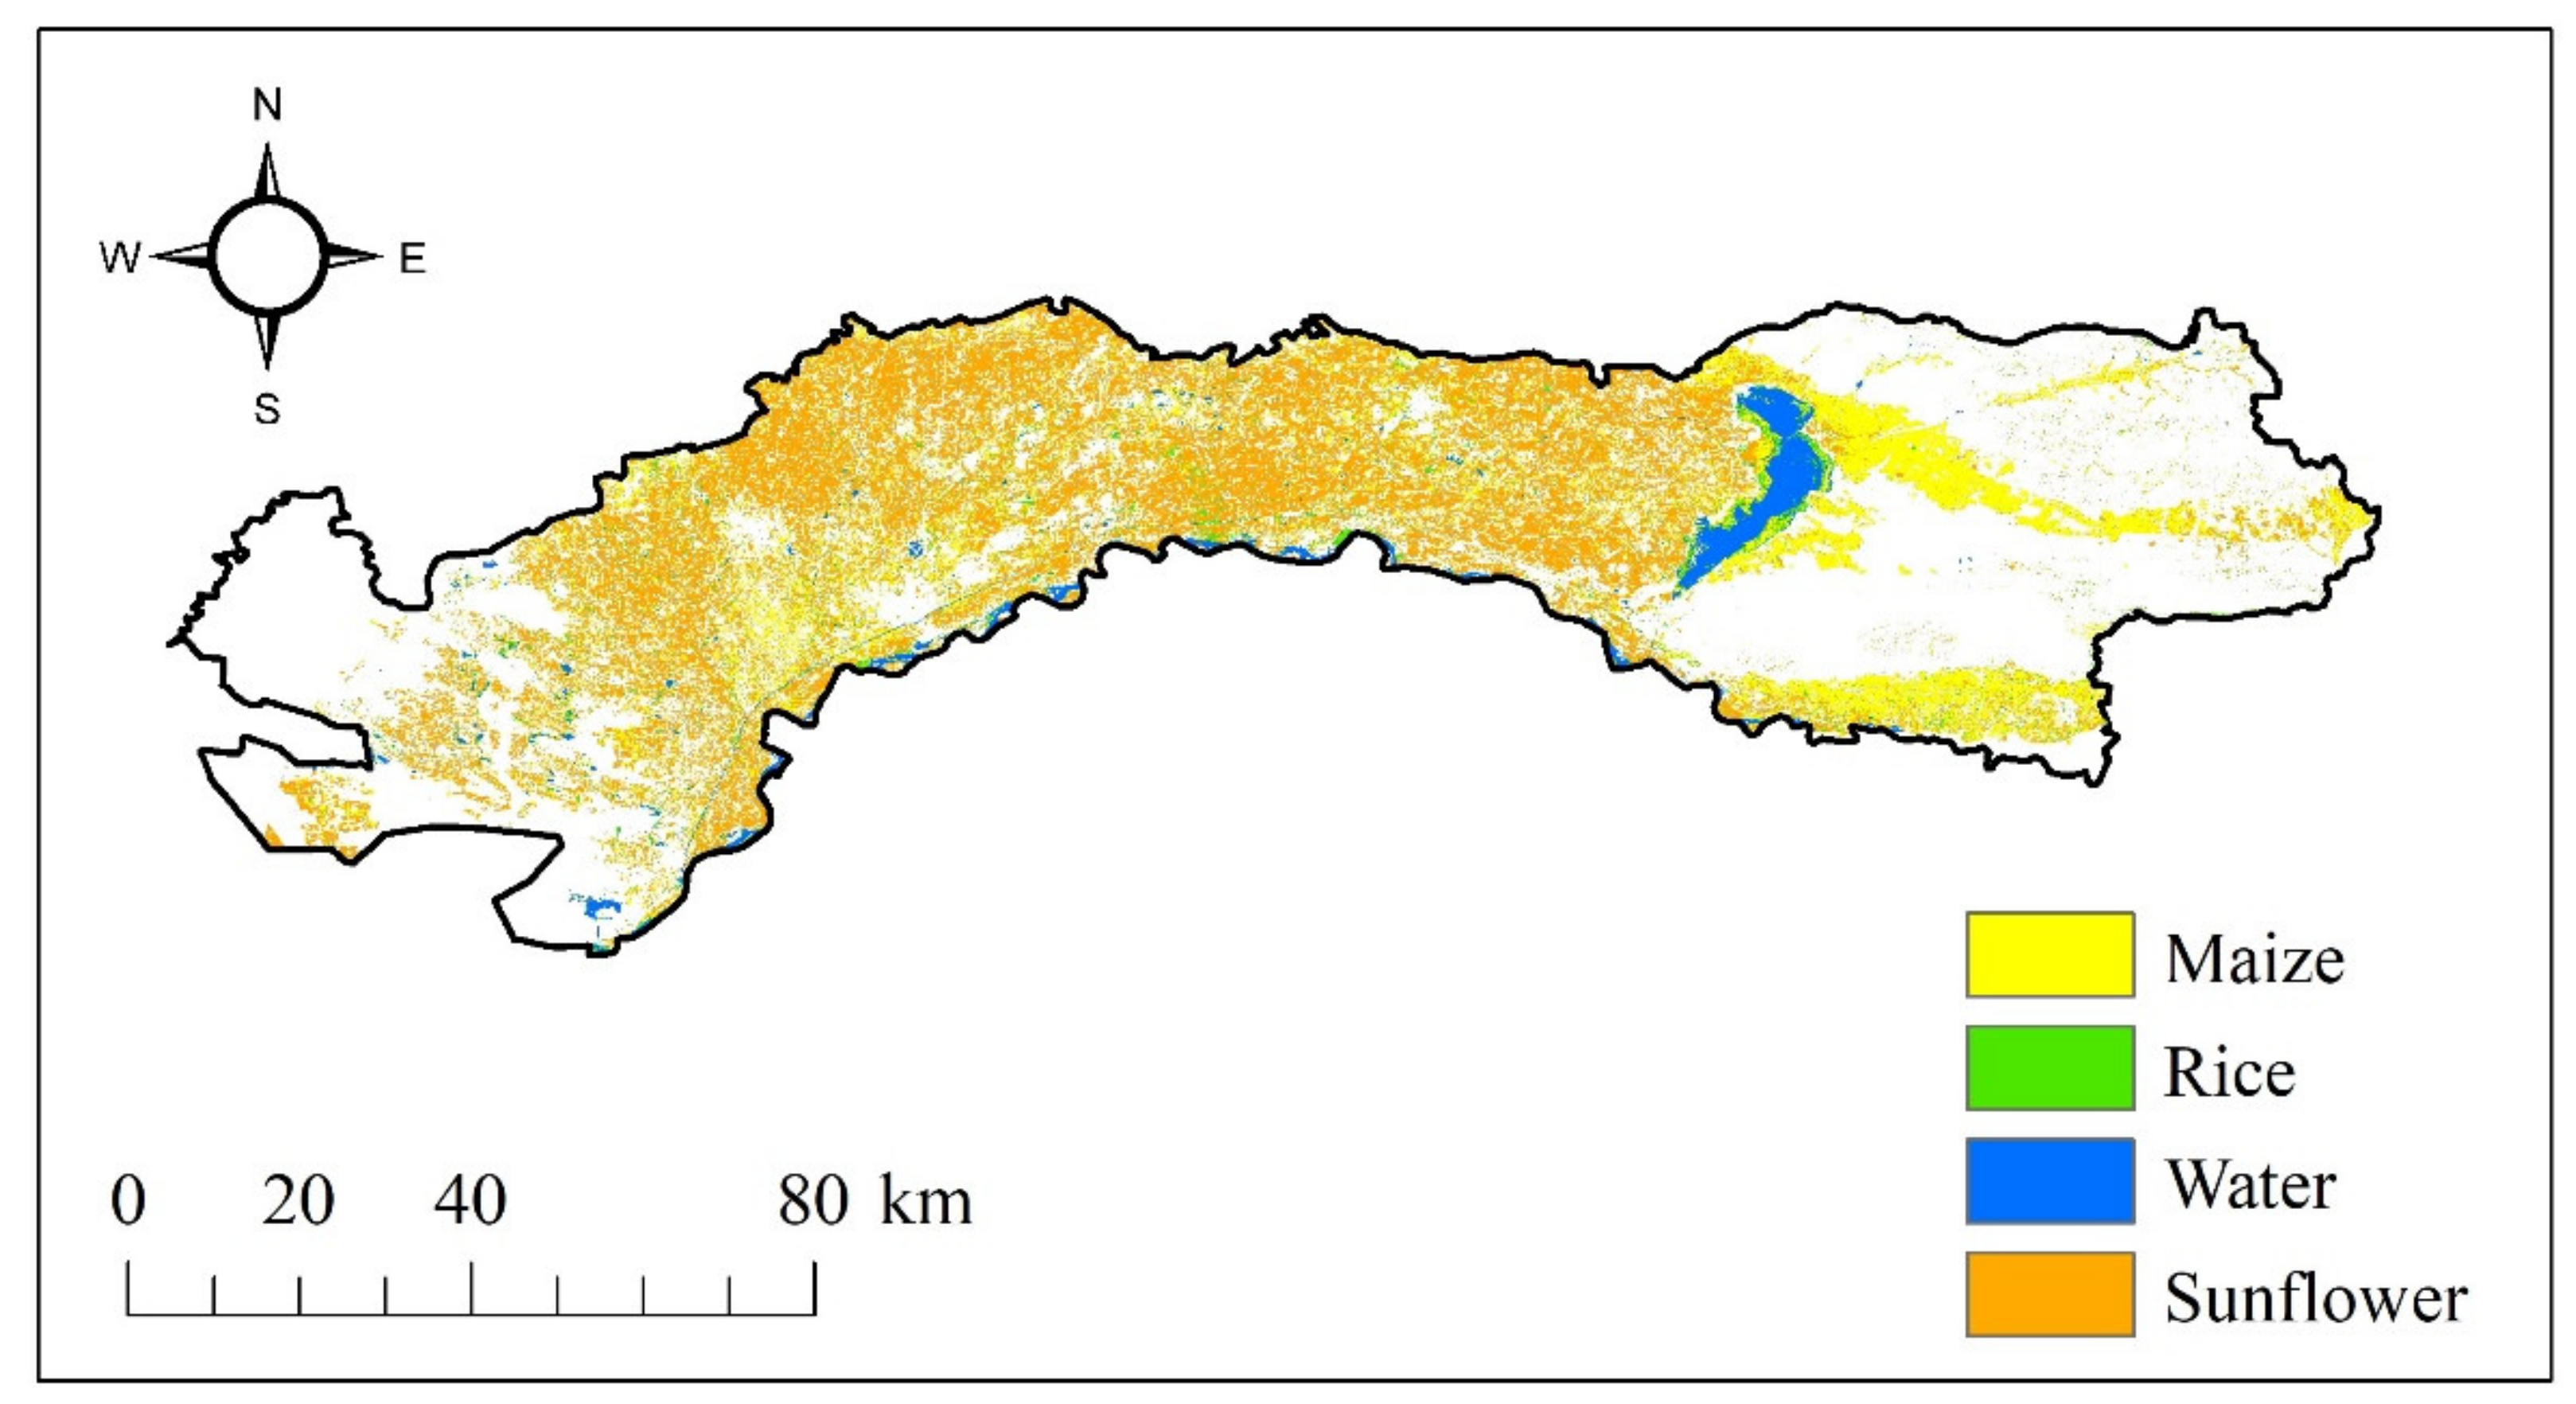
Five main grain-producing areas and counties (Dengkou County, Hangjinhou Banner, Linhe District, Wuyuan County, and Wulateqian Banner) in the Hetao Plain were selected for the crop extraction experiments in the same phenological period and verify the effect, so as to verify the application ability of Skcnn_Tabnet in large-scale space. The distribution and area of sunflower, maize, and rice in the Hetao area in 2019 were examined and compared with the spatial distribution of the crop statistical area. The extraction results are presented in Figure 9.
In general, sunflowers are planted in a large area, spread over the entire study area, primarily in connected plots, and some are cross-planted with corn. The corn planting areas are concentrated largely in the northern part of the Hetao Plain, the central part of the Linhe District, and the coast of Wuliangsuhai Lake. The rice planting area is small and relatively scattered in the Yellow River and its tributaries, lakes, and other water-rich basins (e.g., Shuanghe Town in Linhe District, Dengkou County, Fuxing Town in Wuyuan County, as well as other counties and cities). The planting areas of the three crops in the Hetao area were obtained as 1734.76 km2 for corn, 2743.38 km2 for sunflower, and 118.53 km2 for rice by calculating the pixel points of each crop in ArcGIS. To further verify the extraction accuracy, the data were found in this study (e.g., the 2019 Inner Mongolia Statistical Yearbook and the 2019 Bayannaoer City Statistical Yearbook (http://tjj.bynr.gov.cn, accessed on 15 June 2022)), thus indirectly verifying the validity of this study. The comparison result suggests that the regional proportions of rice and corn planting areas and statistical areas extracted by the Skcnn_Tabnet model are nearly the same. The sunflower area is 386.52 km2 more than the statistical area, and the relative error is slightly larger.
The survey suggests that Northeast China has implemented a policy of adjusting the planting area and structure of crops over the past few years, thus encouraging different crop rotation and interplanting patterns [34]. There are a considerable number of sunflower-soybean intercropping and intercropping patterns in Linhe District, Wuyuan County, and Wulateqian Banner. Considerable sunflowers may be misclassified as soybeans since the phenological and spectral characteristics of sunflowers and soybeans in the Hetao area are highly similar, thus reducing the accuracy of remote sensing classification.

4. Discussion

This study was based on single-phase Sentinel-2 images and a small number of samples. The optimal crop identification model was transferred to the Hetao Plain to identify crops in the same period. The crop distribution map of the Hetao Plain in 2019 was generated pixel by pixel. In addition, the statistical yearbook data verification suggests that the overall verification accuracy of the crop identification model in the Hetao area has reached 85%. In this paper, the single-phase Sentinel-2 image was used instead of the long-time series images, which provided a method reference for crop recognition, especially under long-term rainy weather in Southern China. For example, the flood disaster in Henan Province in 2020 caused a large area of crop disasters, and the compensation work of affected farmers often needs to be combined with remote sensing data statistics. However, the long-time rainy weather made it difficult to obtain the available long-time series remote sensing images. In this case, the advantages of the proposed method were reflected, which only needed remote sensing data of a single-phase to realize crop recognition. In terms of crop growth analysis, we often judged crop growth according to changes in NDVI data. However, it did not distinguish which crops were growing. This study can identify the crop species and grasp the growth situation of various crops. In agricultural insurance claims, this method can assist agricultural insurance companies to ensure the rationality and fairness of insurance claims by providing objective and real crop growth situations and area data.
Compared to the method that generates “training samples” based on historical information [35], our method uses the current year sample and its extended samples to ensure that the trained crop extraction model is more accurate. Due to the differences in inter-annual environment, inter-annual spectral curves of the same crop can be inconsistent. Applying the sample data of the classified years to this link can avoid the influence of the differences in the spectral curves. Compared with methods that only use spectral curves [36], our method considers both spectral information and neighborhood information, which can increase the discrimination of crops with similar spectral curves. We compared this paper with the research of You’s team [5], which produced three typical crop classification products in Northeast China based on GEE platform long-sequence Sentinel-2 images. In this study, the same recognition effect can be achieved without long sequence images, thus increasing crop recognition efficiency. Moreover, the effect of cloudy and rainy weather on the research was eliminated. During the production of the Dong Crop Map, 22,171 samples were used in Northeast China for model training and testing in 2019. Its classification process is highly complex and comprises a feature selection process, RF classifier training for the respective agroclimatic region, and then the identification of the farmland and the identification of the crops within the field. Although the overall validation accuracy of this study is slightly lower than the former (87%), 126 samples collected in the wild were only used, and one model was only trained to achieve multi-classification, which makes the classification process more concise, thus confirming the feasibility of the method proposed in this study for large-scale crop identification applications. This study provides a technical reference for achieving the automatic national crop census and the sustainable development of cultivated land resources.

5. Conclusions

Based on single-phase Sentinel-2 images and a small number of samples, this study applies the improved Skcnn_Tabnet network to crop classification mapping for the first time, and compared the crop mapping results of three different network models. The results show that: (1) The Skcnn_Tabnet method after adding channel attention has the optimal effect in the application of crop classification and extraction in the cultivated land area of Inner Mongolia. In this study, RF, DeepLabv3+, and Unet all have F1 less than 85%, whereas Skcnn_Tabnet’s F1 score and ACC accuracy are higher than 90%. (2) Crop recognition based on single-phase Sentinel-2 images confirmed that adding 5 × 5 pixels neighborhood information based on the spectral information can significantly increase the overall crop classification effect. (3) A small amount of training data was employed in this study for large-area crop recognition, verifying the spatial scalability and robustness of the Skcnn_Tabnet model. The result suggests that the county-level spatial scale exhibits high applicability in the Hetao area. The crop planting area obtained by the model is well consistent with the statistical data, which reveals that the classification method proposed in this study can meet the requirements of refined crop extraction in large areas. The research results achieved in this study can provide scientific, technical, and data support for the pattern of cultivated land resources and the optimization of agricultural structure in the floodplain.

Author Contributions

J.T. wrote the manuscript, designed the methodology, and conducted experiments; Z.C. and X.Z. supervised the study and reviewed the manuscript; Y.B. pre-processed the remote sensing images and municipal statistical data; J.T. made the datasets. All authors have read and agree to the published version of the manuscript.

Funding

This work is supported by China high-resolution earth observation system (Grant No. 03-Y30F03-9001-20/22) and the National Natural Science Foundation of China (Grant No. 42071407).

Institutional Review Board Statement

Not applicable.

Informed Consent Statement

Not applicable.

Data Availability Statement

Not applicable.

Acknowledgments

The authors thank the editors and anonymous reviewers for their valuable comments, which greatly improved the quality of the paper.

Conflicts of Interest

The authors declare no conflict of interest.

References

  1. Yu, B.; Shang, S. Multi-year Mapping of Maize and Sunflower in Hetao Irrigation District of China with High Spatial and Temporal Resolution Vegetation Index Series. Remote Sens. 2017, 9, 855. [Google Scholar] [CrossRef] [Green Version]
  2. Li, Z.; Bagan, H.; Yamagata, Y. Analysis of Spatiotemporal Land Cover Changes in Inner Mongolia Using Self-organizing Map Neural Network and Grid Cells Method. Sci. Total Environ. 2018, 636, 1180–1191. [Google Scholar] [CrossRef] [PubMed]
  3. Yang, Q.; Zhang, D. The Influence of Agricultural Industrial Policy on Non-grain Production of Cultivated Land: A Case Study of the “one Village, One Product” Strategy Implemented in Guanzhong Plain of China. Land Use Policy 2021, 108, 105579. [Google Scholar] [CrossRef]
  4. Ibrahim, E.S.; Rufin, P.; Nill, L.; Kamali, B.; Nendel, C.; Hostert, P. Mapping Crop Types and Cropping Systems in Nigeria with Sentinel-2 Imagery. Remote Sens. 2021, 13, 3523. [Google Scholar] [CrossRef]
  5. You, N.; Dong, J.; Huang, J.; Du, G.; Zhang, G.; He, Y.; Yang, T.; Di, Y.; Xiao, X. The 10-m Crop Type Maps in Northeast China During 2017–2019. Sci. Data 2021, 8, 1–11. [Google Scholar] [CrossRef] [PubMed]
  6. Tian, H.; Huang, N.; Niu, Z.; Qin, Y.C.; Pei, J.; Wang, J. Mapping Winter Crops in China with Multi-source Satellite Imagery and Phenology-based Algorithm. Remote Sens. 2019, 11, 820. [Google Scholar] [CrossRef] [Green Version]
  7. Li, X.; Sun, C.; Meng, H.; Ma, X.; Huang, G.; Xu, X. A Novel Efficient Method for Land Cover Classification in Fragmented Agricultural Landscapes Using Sentinel Satellite Imagery. Remote Sens. 2022, 14, 2045. [Google Scholar] [CrossRef]
  8. He, Z.; Li, S.; Wang, Y.; Dai, L.; Lin, S. Monitoring Rice Phenology Based on Backscattering Characteristics of Multi-temporal Radarsat-2 Datasets. Remote Sens. 2018, 10, 340. [Google Scholar] [CrossRef] [Green Version]
  9. Jiang, L.; Shang, S.; Yang, Y.; Guan, H. Mapping Interannual Variability of Maize Cover in a Large Irrigation District Using a Vegetation Index–phenological Index Classifier. Comput. Electron. Agric. 2016, 123, 351–361. [Google Scholar] [CrossRef]
  10. Ming, Z.; Qing, B.Z.; Zhong, X.C.; Jia, L.; Yong, Z.; Chongfa, C. Crop Discrimination in Northern China with Double Cropping Systems Using Fourier Analysis of Time-series Modis Data. Int. J. Appl. Earth Obs. Geoinf. 2008, 10, 476–485. [Google Scholar] [CrossRef]
  11. Johnson, M.D.; Hsieh, W.W.; Cannon, A.J.; Davidson, A.; Bédard, F. Crop Yield Forecasting on the Canadian Prairies by Remotely Sensed Vegetation Indices and Machine Learning Methods. Agric. For. Meteorol. 2016, 218, 74–84. [Google Scholar] [CrossRef]
  12. Abubakar, G.A.; Wang, K.; Shahtahamssebi, A.; Xue, X.; Belete, M.; Gudo, A.J.A.; Shuka, K.A.M.; Gan, M. Mapping Maize Fields by Using Multi-temporal Sentinel-1a and Sentinel-2a Images in Makarfi, Northern Nigeria, Africa. Sustainability 2020, 12, 2539. [Google Scholar] [CrossRef] [Green Version]
  13. You, N.; Dong, J. Examining Earliest Identifiable Timing of Crops Using All Available Sentinel 1/2 Imagery and Google Earth Engine. ISPRS J. Photogramm. Remote Sens. 2020, 161, 109–123. [Google Scholar] [CrossRef]
  14. Wang, S.; Azzari, G.; Lobell, D.B. Crop Type Mapping Without Field-level Labels: Random Forest Transfer and Unsupervised Clustering Techniques. Remote Sens. Environ. 2019, 222, 303–317. [Google Scholar] [CrossRef]
  15. Htitiou, A.; Boudhar, A.; Chehbouni, A.; Benabdelouahab, T. National-scale Cropland Mapping Based on Phenological Metrics, Environmental Covariates, and Machine Learning on Google Earth Engine. Remote Sens. 2021, 13, 4378. [Google Scholar] [CrossRef]
  16. Wang, X.; Zhang, J.; Xun, L.; Wang, J.; Wu, Z.; Henchiri, M.; Zhang, S.; Zhang, S.; Bai, Y.; Yang, S.; et al. Evaluating the Effectiveness of Machine Learning and Deep Learning Models Combined Time-series Satellite Data for Multiple Crop Types Classification Over a Large-scale Region. Remote Sens. 2022, 14, 2341. [Google Scholar] [CrossRef]
  17. Shelestov, A.; Lavreniuk, M.; Kussul, N. Large Scale Crop Classification Using Google Earth Engine Platform. In Proceedings of the 2017 IEEE International Geoscience and Remote Sensing Symposium (IGARSS), Worth, TX, USA, 23–28 July 2017; pp. 3696–3699. [Google Scholar]
  18. Zhang, C.; Di, L.; Lin, L.; Li, H.; Guo, L.; Yang, Z.; Yu, E.G.; Di, Y.; Yang, A. Towards Automation of In-season Crop Type Mapping Using Spatiotemporal Crop Information and Remote Sensing Data. Agric. Syst. 2022, 201, 103462. [Google Scholar] [CrossRef]
  19. Ofori-ampofo, S.; Pelletier, C.; Lang, S. Crop Type Mapping from Optical and Radar Time Series Using Attention-based Deep Learning. Remote Sens. 2021, 13, 4668. [Google Scholar] [CrossRef]
  20. Mo, Y.; Wu, Y.; Yang, X.; Liu, F.; Liao, Y. Review the State-of-the-art Technologies of Semantic Segmentation Based on Deep Learning. Neurocomputing 2022, 493, 626–646. [Google Scholar] [CrossRef]
  21. Chen, Y.; Song, X.; Wang, S. Impacts of Spatial Heterogeneity on Crop Area Mapping in Canada Using Modis Data. J. Photogramm. Remote Sens. 2016, 119, 451–461. [Google Scholar] [CrossRef]
  22. Du, M.; Huang, J.; Wei, P.; Yang, L.; Chai, D.; Peng, D.; Sha, J.; Sun, W.; Huang, R. Dynamic Mapping of Paddy Rice Using Multi-temporal Landsat Data Based on a Deep Semantic Segmentation Model. Agronomy 2022, 12, 1583. [Google Scholar] [CrossRef]
  23. Der, Y.M.; Tseng, H.H.; Hsu, Y.C. Real-time Crop Classification Using Edge Computing and Deep Learning. In Proceedings of the 2020 IEEE 17th Annual Consumer Communications & Networking Conference (CCNC), Las Vegas, NV, USA, 10–13 January 2020; pp. 1–4. [Google Scholar]
  24. Wang, C.; Zhang, R.; Chang, L. A Study on the Dynamic Effects and Ecological Stress of Eco-environment in the Headwaters of the Yangtze River Based on Improved Deeplabv3+ Network. Remote Sens. 2022, 14, 2225. [Google Scholar] [CrossRef]
  25. Yang, L.-T.; Zhao, J.-F.; Jiang, X.-P.; Wang, S.; Li, L.-H.; Xie, H.-F. Effects of Climate Change on the Climatic Production Potential of Potatoes in Inner Mongolia, China. Sustainability 2022, 14, 7836. [Google Scholar] [CrossRef]
  26. Zhang, X.; Guo, P.; Zhang, F.; Liu, X.; Yue, Q.; Wang, Y. Optimal Irrigation Water Allocation in Hetao Irrigation District Considering Decision Makers’ Preference under Uncertainties. Agric. Water Manag. 2021, 246, 106670. [Google Scholar] [CrossRef]
  27. Shen, H.; Lin, L.; Li, J.; Yuan, Q.; Zhao, L. A Residual Convolutional Neural Network for Polarimetric Sar Image Super-resolution. ISPRS J. Photogramm. Remote Sens. 2020, 161, 90–108. [Google Scholar] [CrossRef]
  28. Haines, E. Point in Polygon Strategies. Graph. Gems 1994, 4, 24–46. [Google Scholar]
  29. Zhang, L.; Zhang, Q.; Du, B.; Huang, X.; Tang, Y.Y.; Tao, D. Simultaneous Spectral-spatial Feature Selection and Extraction for Hyperspectral Images. IEEE Trans. Cybern. 2016, 48, 16–28. [Google Scholar] [CrossRef] [PubMed] [Green Version]
  30. Arik, S.Ö.; Pfister, T. Tabnet: Attentive Interpretable Tabular Learning. In Proceedings of the AAAI Conference on Artificial Intelligence, Vancouver, BC, Canada, 2–9 February 2021; pp. 6679–6687. [Google Scholar]
  31. Breiman, L. Random Forests. Mach. Learn. 2001, 45, 5–32. [Google Scholar] [CrossRef] [Green Version]
  32. Chen, L.; Zhu, Y.; Papandreou, G. Encoder-decoder with Atrous Separable Convolution for Semantic Image Segmentation. In Proceedings of the European Conference on Computer Vision (ECCV), Munich, Germany, 8–14 September 2018; pp. 801–818. [Google Scholar]
  33. Ronneberger, O.; Fischer, P.; Brox, T. U-net: Convolutional Networks for Biomedical Image Segmentation. In Proceedings of the Medical Image Computing and Computer-Assisted Intervention–MICCAI 2015, Munich, Germany, 5–9 October 2015. [Google Scholar]
  34. Yang, L.; Wang, L.; Huang, J.; Mansaray, L.R.; Mijiti, R. Monitoring Policy-driven Crop Area Adjustments in Northeast China Using Landsat-8 Imagery. Int. J. Appl. Earth Obs. Geoinf. 2019, 82, 101892. [Google Scholar] [CrossRef]
  35. Hao, P.; Wang, L.; Zhan, Y.; Wang, C.; Niu, Z.; Wu, M. Crop Classification Using Crop Knowledge of the Previous-year: Case Study in Southwest Kansas, USA. Eur. J. Remote Sens. 2016, 49, 1061–1077. [Google Scholar] [CrossRef] [Green Version]
  36. Siesto, G.; Fernández-Sellers, M.; Lozano-Tello, A. Crop Classification of Satellite Imagery Using Synthetic Multitemporal and Multispectral Images in Convolutional Neural Networks. Remote Sens. 2021, 13, 3378. [Google Scholar] [CrossRef]
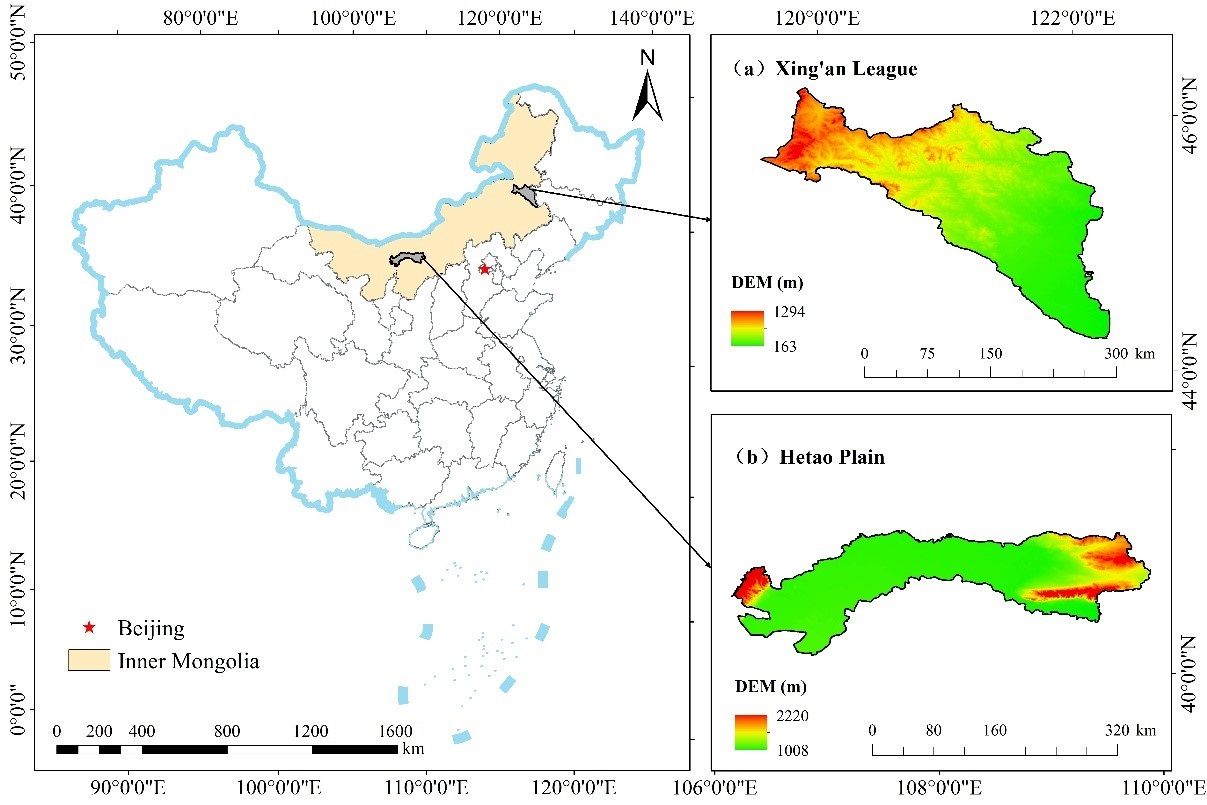
Figure 1. Study area overview map. The location of Inner Mongolia Autonomous Region of China, the study area in Inner Mongolia with two agroecological zones (Xing’an League (a) and Hetao Plain (b)).
Sustainability 14 12789 g001
Figure 2. Crop characteristics on false color synthesis Sentinel-2 images (band8, band11, and band4, the stretch type is standard deviations). We use small tiles of 256 × 256 pixels, and the size of the yellow box is 64 × 64.
Sustainability 14 12789 g002
Figure 3. Sample spatial distribution. Original Sample represents samples collected in the field. Supplementary Sample represents hand-plotted samples based on visual interpretation of crop features.
Sustainability 14 12789 g003
Figure 4. Spectral features of sunflower (a), rice (b), maize (c), and water (d). The x-axis represents bands. The y-axis represents the reflectance of each band.
Sustainability 14 12789 g004
Figure 5. Structure of the Tabnet encoder.BN stands for batch normalization. FC stands for fully connected.
Sustainability 14 12789 g005
Figure 6. Improved attentive transformer module. Conv2d stands for 2D convolution. EntMax stands for entmax normalization.
Sustainability 14 12789 g006
Figure 7. The segmentation effect of different neighborhood sizes based on the MLP network. The region refers to the neighborhood size. The image is 512 × 512 pixels, and is composited with false color of band8, band11, and band4.
Sustainability 14 12789 g007
Figure 8. Some examples of the results on the Sentinel-2 data. Comparison between our skcnn_tabnet and other methods. The image is 512 × 512 pixels, and is composited with false color of band8, band11, and band.4. (a) Multi-Type mixed distribution. (b) Neatly distributed area of fields. (c) Mountainous areas. (d) Strip distribution area of fields.
Sustainability 14 12789 g008
Figure 9. Distribution map of crop types in the Hetao Plain in 2019.
Sustainability 14 12789 g009
Table 1. Detailed information of 13 spectral bands of Sentinel-2.
BandsNameCentral Wavelength (nm)Band Width (nm)Spatial Resolution (m)
1Coastal aerosol442.72160
2Blue492.46610
3Green559.83610
4Red664.63110
5Vegetation red edge704.11520
6Vegetation red edge740.51520
7Vegetation red edge782.82020
8NIR 1832.810610
8ANarrow NIR864.72120
9Water vapor945.12060
10SWIR 2 Cirrus1373.53160
11SWIR1613.79120
12SWIR2202.417520
1 Near-infrared band. 2 Shortwave-infrared band.
Table 2. The number of selected regions of interest (ROI) and number of pixels.
TypeNumber of ROIsNumber of Pixels
Maize471209,720
Sunflower326153,489
Rice207130,193
Waters2956,079
Other Crops2047,701
Table 3. Accuracy comparison of classification results of four different methods.
MethodAccuracy CategoryMaizeSunflowerRiceWatersOthersAverage
Deeplabv3+IOU0.7258 (±0.028)0.6092 (±0.037)0.7254 (±0.030)0.9141 (±0.021)0.4172 (±0.044)0.6783
F1 score0.8462 (±0.039)0.7541 (±0.026)0.8368 (±0.029)0.9543 (±0.035)0.5834 (±0.026)0.7949
Overall accuracy0.8149 (±0.031)
UNetIOU0.7650 (±0.043)0.6476 (±0.046)0.7461 (±0.027)0.9226 (±0.033)0.4477 (±0.038)0.7058
F1 score0.8663 (± 0.029)0.7827 (± 0.032)0.8534 (± 0.050)0.9586 (± 0.027)0.6176 (±0.033)0.8157
Overall accuracy0.8266 (± 0.038)
RFF1 score0.7684 (±0.051)0.6798 (±0.060)0.7503 (±0.026)0.9244 (±0.031)0.6706 (±0.042)0.7587
Overall accuracy0.8396 (±0.043)
Skcnn_TabnetIOU0.9063 (±0.026)0.8432 (±0.027)0.8738 (±0.037)0.9822 (±0.036)0.6951 (±0.029)0.8601
F1 score0.9428 (±0.034)0.9103 (±0.029)0.9289 (±0.026)0.9878 (±0.031)0.7562 (±0.028)0.9052
Overall accuracy0.9270 (±0.026)
Publisher’s Note: MDPI stays neutral with regard to jurisdictional claims in published maps and institutional affiliations.