4.1. Co-Movements: Contagion or Interdependence?
There are different kinds of co-movements among oil prices and financial assets. This paper focuses on interdependence and contagion. According to Ref. [
20], the difference between these two concepts is that interdependence is defined as the relation among asset classes on average over the sample period, and contagion is defined as a change in the transmission mechanism among asset classes in times of crisis. Ref. [
20] found that interdependence is most notable across advanced and emerging economies in the case of the equity market, and contagion effects within the stock market are most evident in Latin America and Emerging Asia. The response to shocks differs according to the origin of the disturbance. Then, the methodologies for measuring contagion play important roles because globalization increases the interdependence across the markets in the international context.
According to Refs. [
81,
82], the terms contagion and interdependence are defined in terms of the frequency domain, that is, low scale (high frequency) and high scale (low frequency). Following Ref. [
83], a low scale can be defined as a period of less than one year (short term) and a high scale as a period greater than one year (long term). Therefore, an increase in co-movement on the low scale may be associated with contagion, while an increase in co-movement on the high scale may be associated with interdependence.
Ref. [
84] described five definitions for financial contagion: (i) financial contagion is a significant increase in the probability of a crisis in one country, conditioned by a crisis occurring in other countries; (ii) contagion is a transmission that occurs when volatility spills over from the country in crisis to the financial markets of other countries; (iii) contagion is a significant increase in co-movements on prices in different markets, affected by a crisis occurring in one market or group of markets; (iv) contagion occurs when a different channel causes the transmission of a crisis to those that occurred in the other market; and (v) the contagion happens when macroeconomic fundamental causes cannot explain ordinary movements of prices and quantities. Meanwhile, Refs. [
85,
86] argue that financial contagion can be defined as the transfer of a financial crisis from one country to another as a result of the interdependence present in non-crisis periods, which may be associated with any of the previous definitions, since according to the literature, the high association among the variables of the economies, without taking into account their origin, is what generates a high-dependency relationship between their markets and therefore the spread of the financial crisis. Thus, as mentioned above, supported by Refs. [
84,
85], financial contagion is defined as an increase in correlations between markets after an economic shock in an individual country or group of countries.
According to Ref. [
87], channels of contagion among economies can be commercial, financial, political, regional, and macroeconomic fundamentals. Thus, they argue that there are five possible transmission channels of contagion from one country to another: (i) being subjected to a common shock, such as movements in interest rates by the Federal Reserve in the U.S.; (ii) the similarity among the macroeconomic fundamentals of the economies; (iii) maintaining trade relations since the devaluation in one country would be reflected in the macroeconomic fundamentals of its trading partners; (iv) maintaining political ties among countries, as this may influence the actions of policy makers in both countries, e.g., policies of joint devaluation, which are also known as a channels for regional transmission of contagions; and (v) maintaining financial relations among countries such as having the same lender or maintaining foreign direct investment among countries, as this would be a channel of liquidity that could generate common financial behaviors. These common causes could explain why financial crises usually occur in clusters.
Ref. [
88] argued that there are two main channels through which financial series show interdependence with each other. Firstly, there are the macroeconomic benefits, linked to the effective management of the countries’ monetary policies, tending towards low inflation and stability of interest rates and exchange rates, which is why there is a transmission of monetary policies to the financial markets via asset prices. Secondly, due to the management of international portfolios, in the search for better returns with less exposure to risk, there is an increase in the integration of financial markets that gradually aligns international prices, thus reducing the benefits of portfolio diversification in the international context.
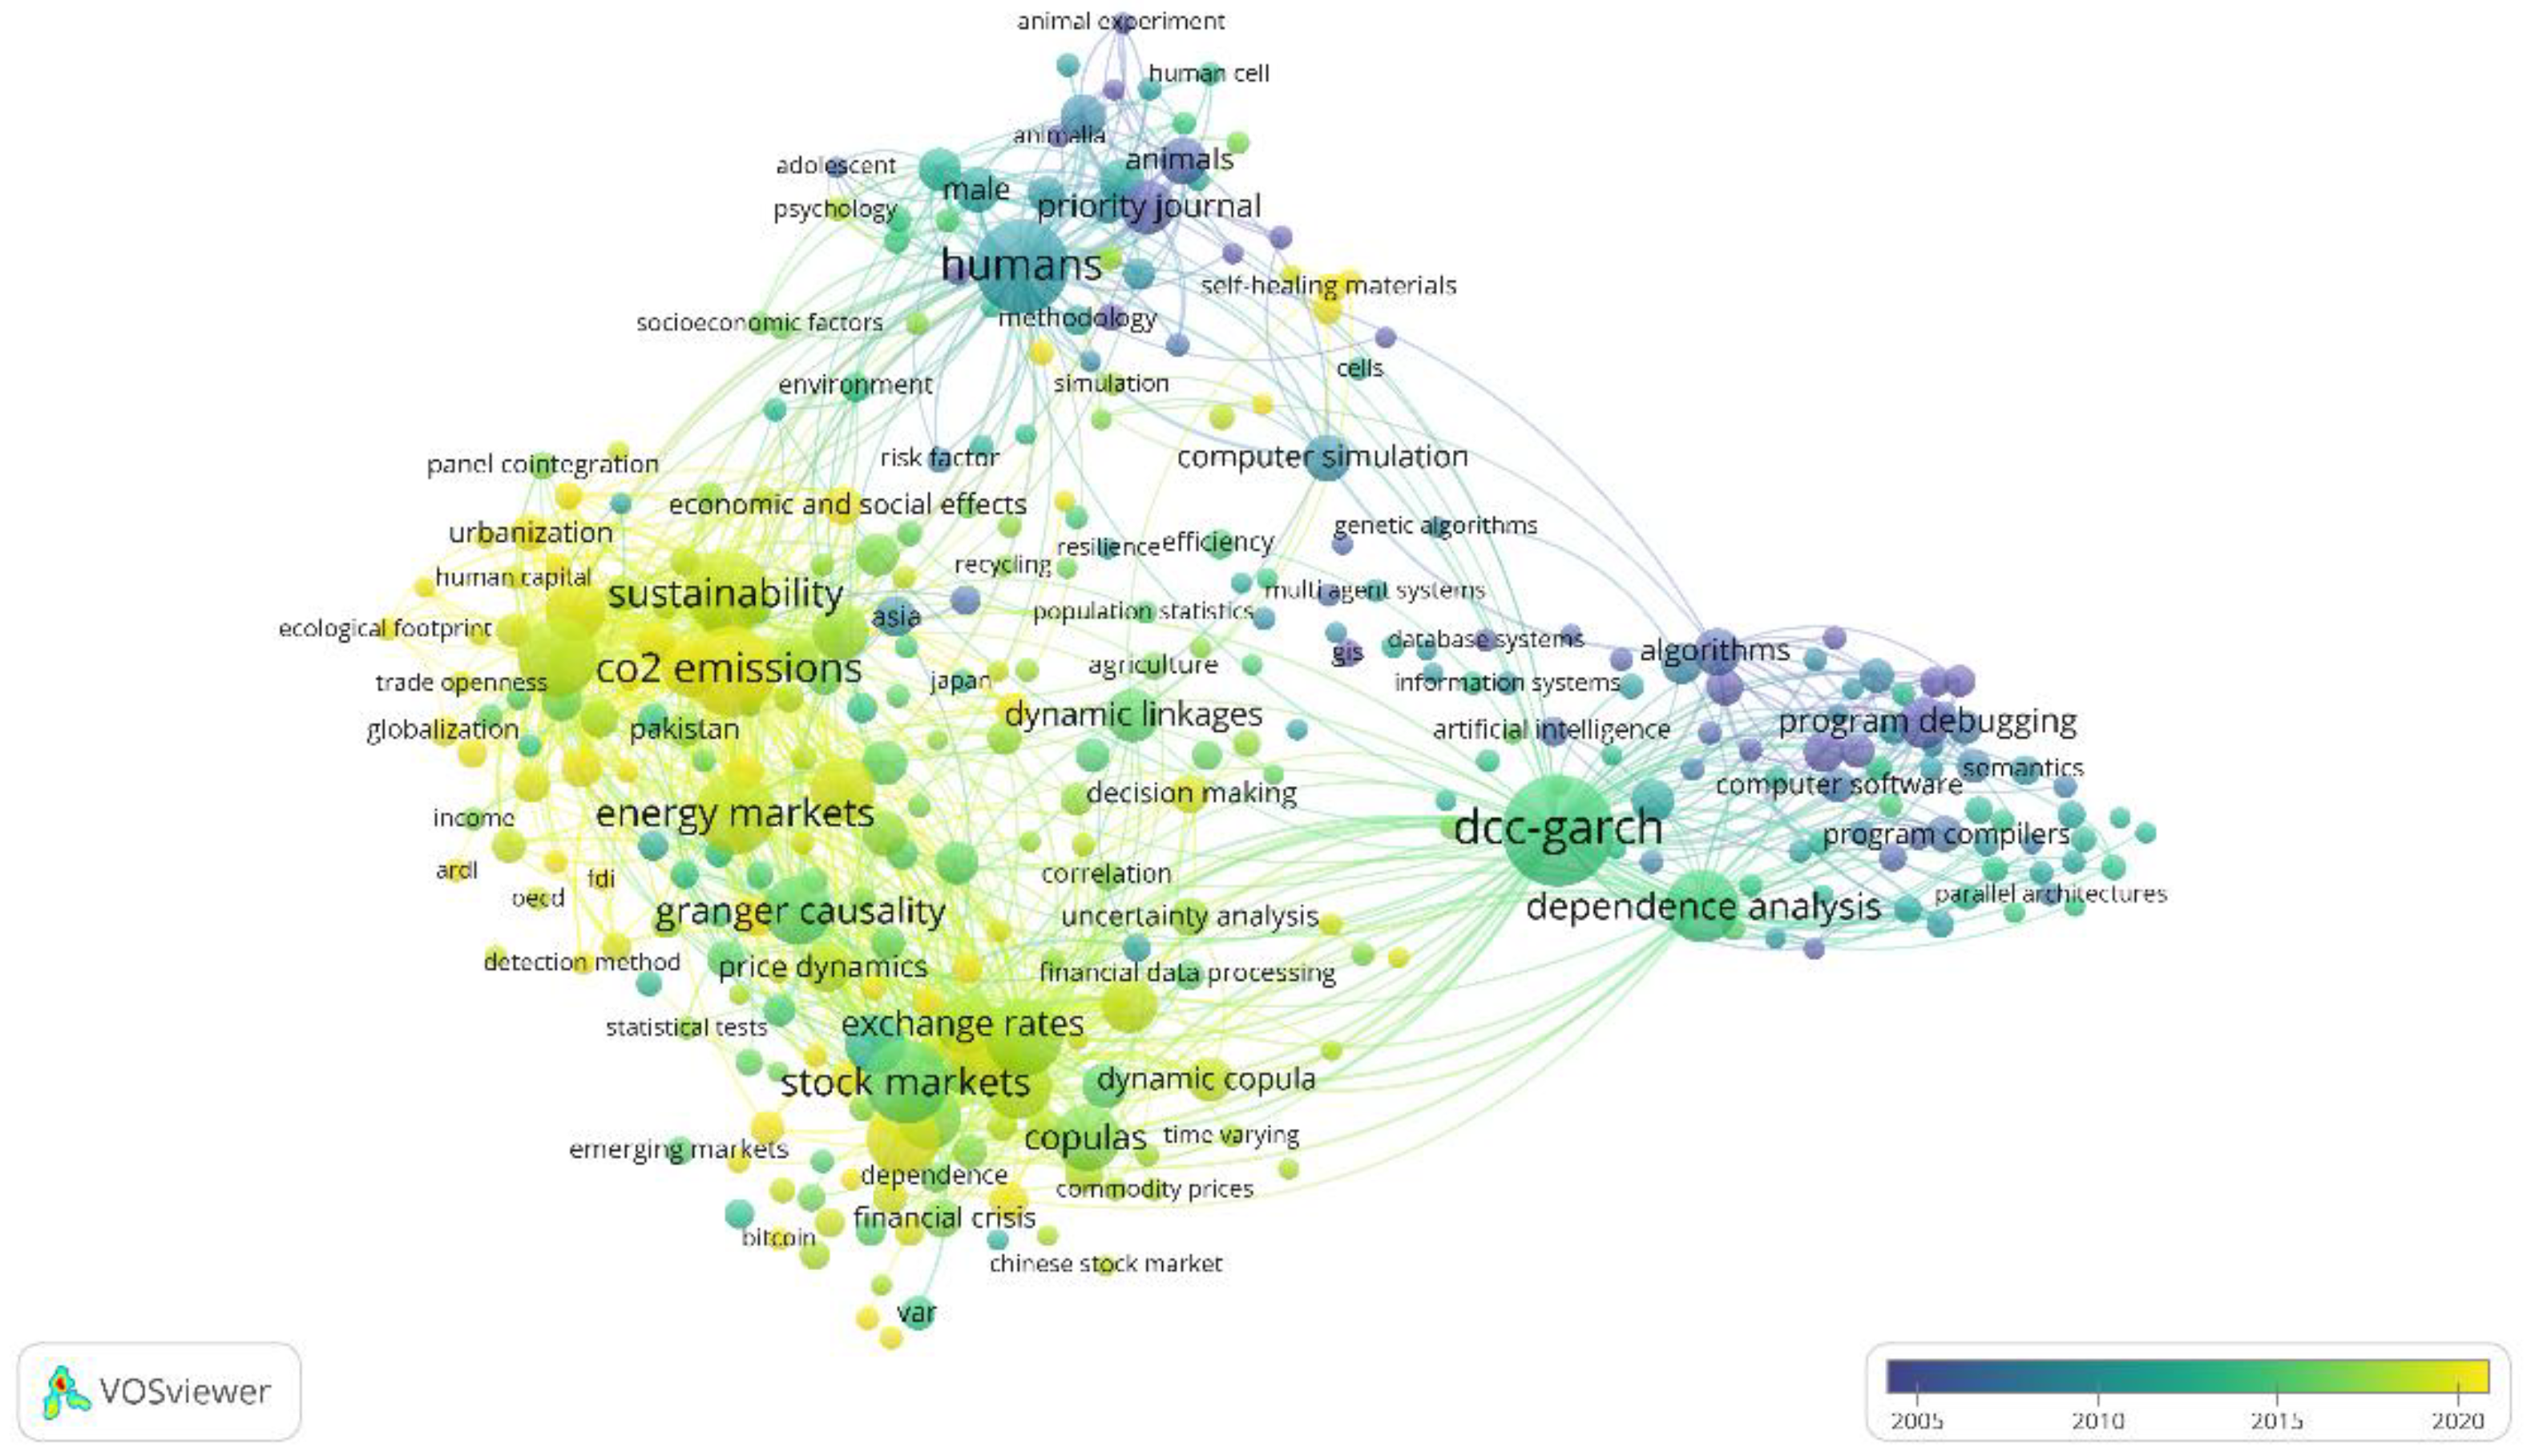
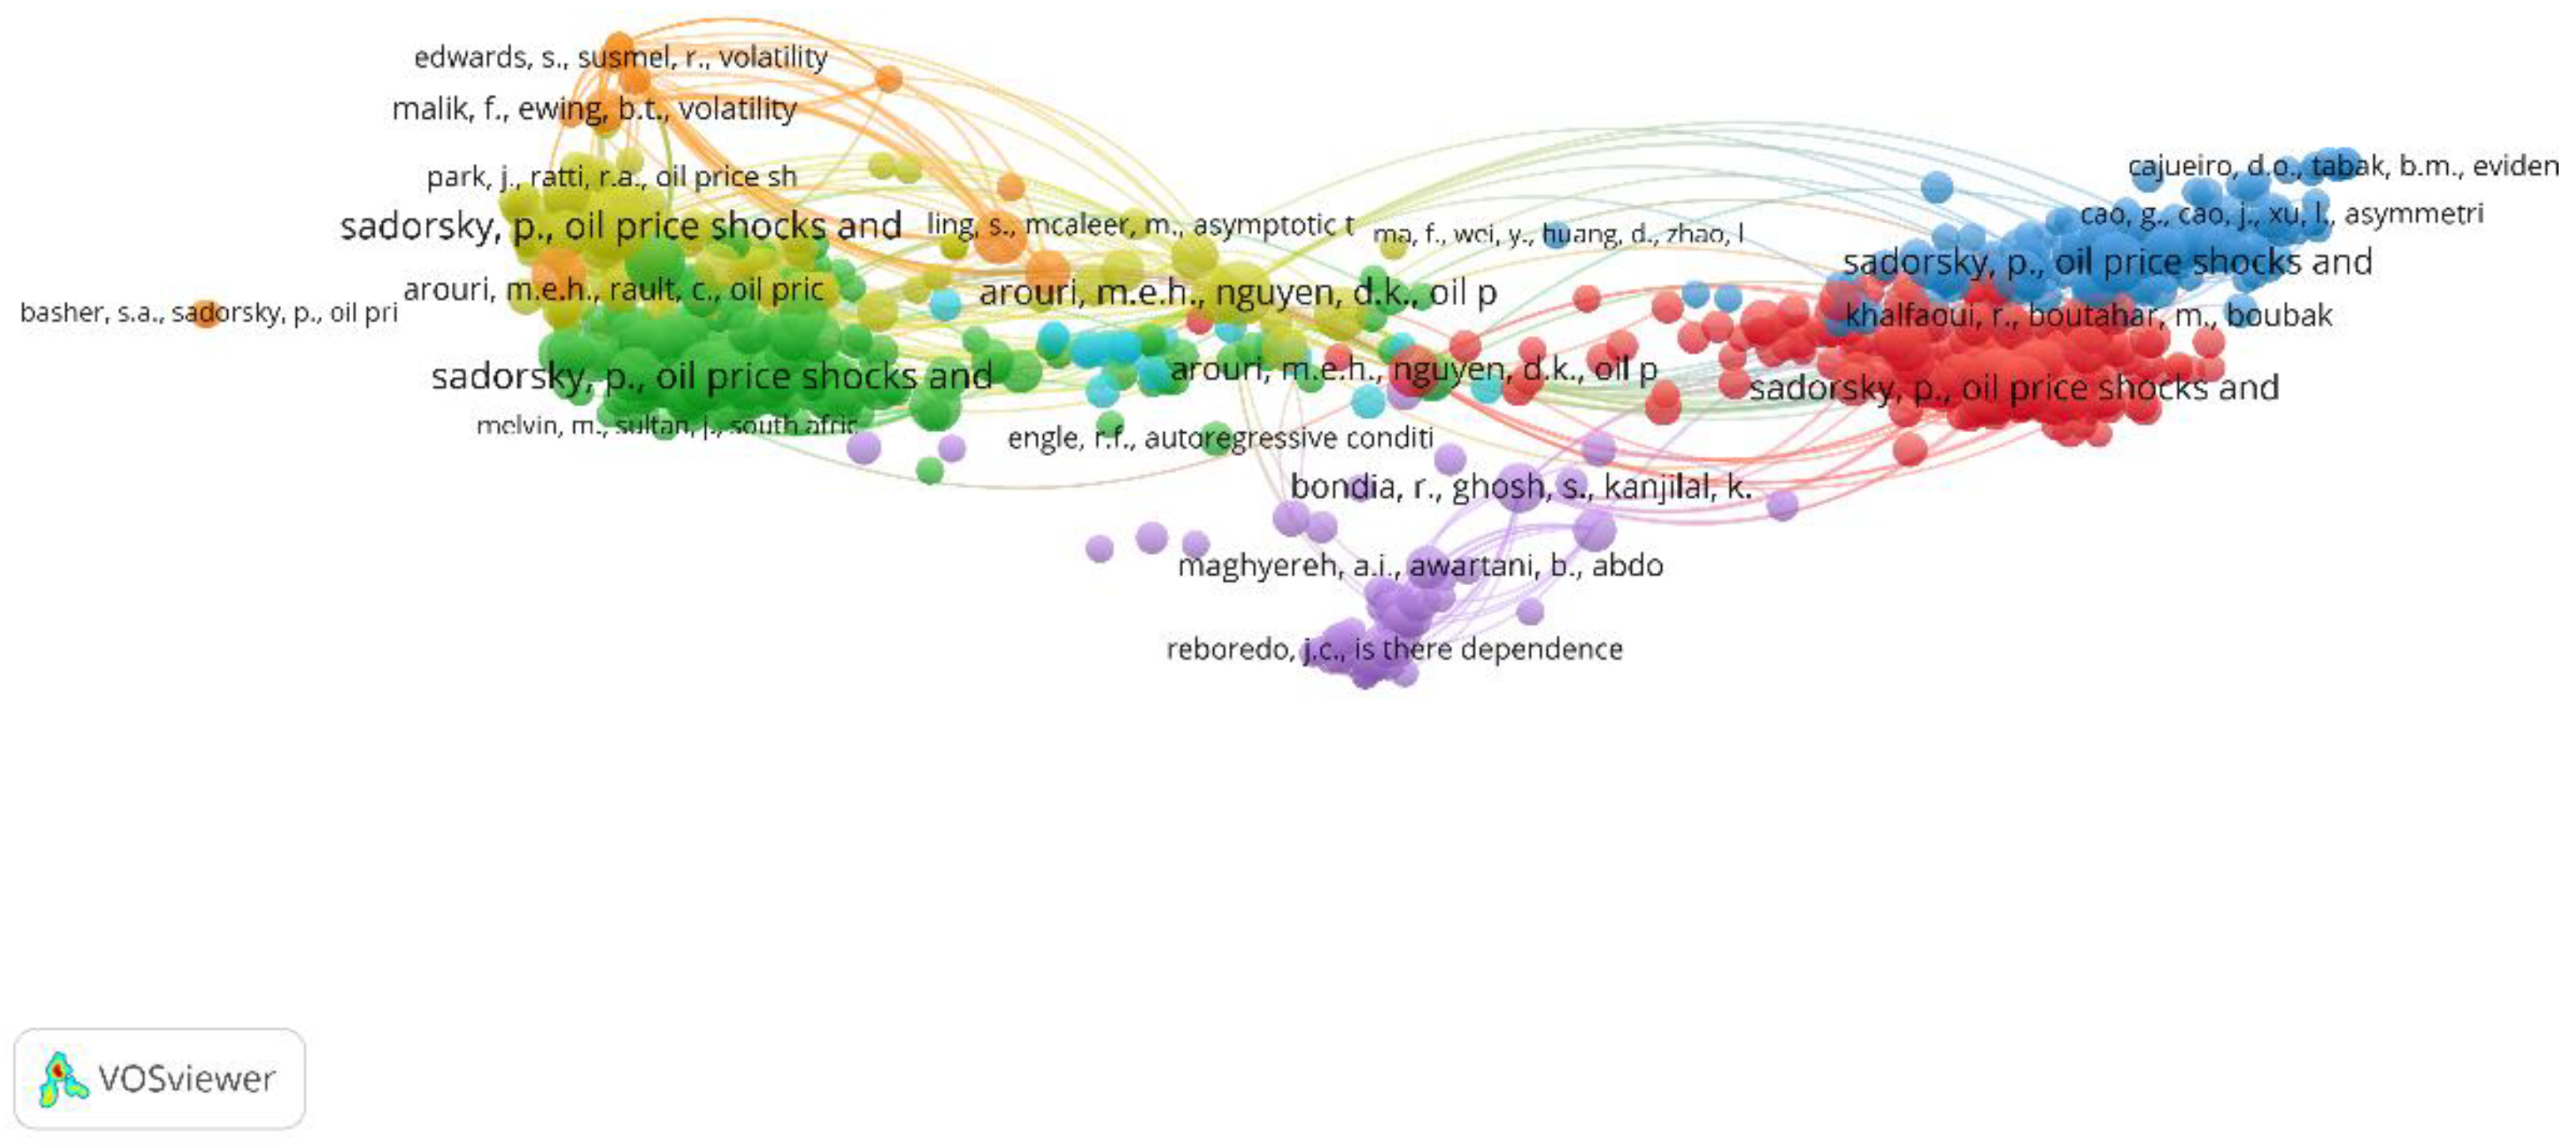
4.2. Measuring the Co-Movements: Bibliometric Coupling of Documents
The bibliometric coupling of documents examines prior researchers’ writings on a topic, identifies significant ideas, and illustrates the character of scholarly argument [
39].
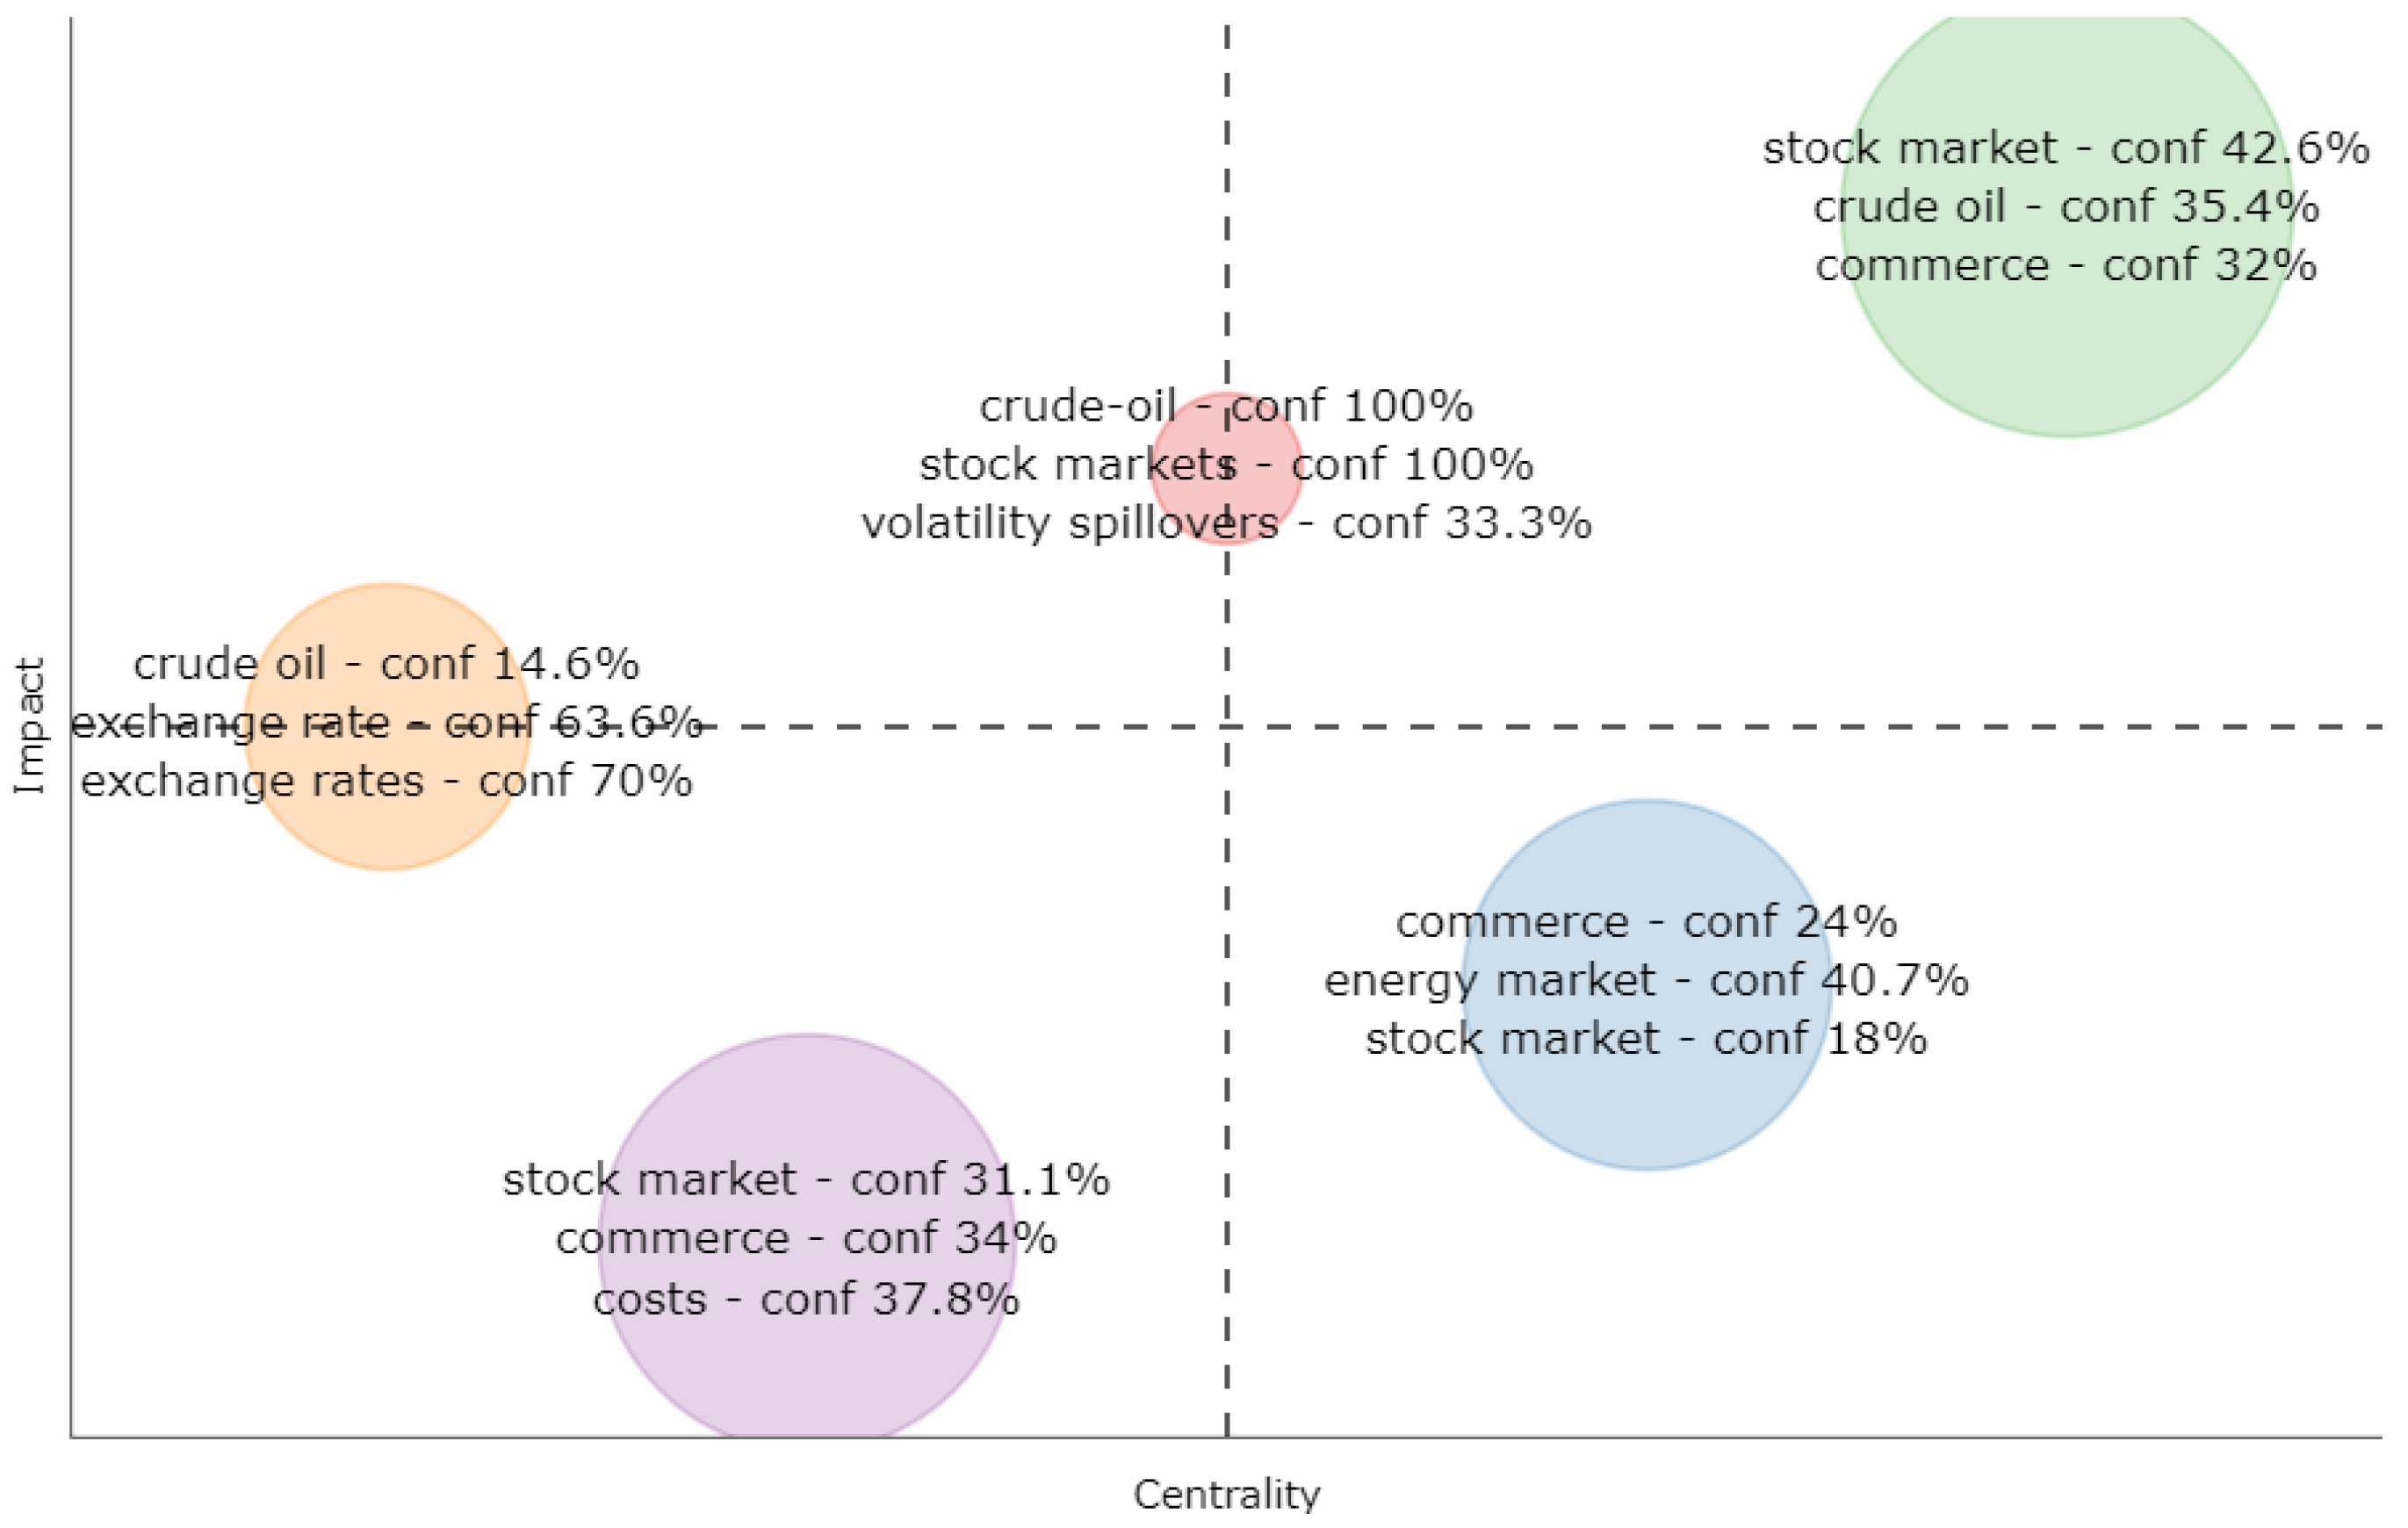
Figure 17 represents a scientific map that identifies critical documents (impact) and their relationships (centrality) using k-means clustering as an unsupervised learning algorithm to solve clustering problems [
39]. The number of local citation scores quantified the document’s effect. Five clusters were created depending on the topic’s significance, each with a distinct color scheme: red, blue, green, blue, purple, and orange.
Among these, the red cluster has a centrality of 0.5405, an impact of 2.177, and 15 documents containing the topics of crude oil, stock markets, and volatility spillovers. The documents in this cluster include Nagayev et al. [
89], Antonakakis, Chatziantoniou, and Filis [
90], Shahzad et al. [
91], Roy and Roy [
92], Disli [
93], and others. Nagayev et al. [
89] explored whether commodities offer potential diversification benefits for Islamic equity index investors. The authors used MGARCH-DCC and wavelet coherence analyses. Their findings reveal that correlations between commodity markets and the Dow Jones Islamic Market World Index were time-varying and highly volatile throughout the January 1999–April 2015 period. A substantial and persistent increase was observed in the return correlations between commodities and Islamic equity at the onset of the 2008 financial crisis. However, recent trends suggest that this association is heading towards its pre-crisis levels, again offering diversification benefits for Islamic equity holders. Disli [
93] studied the role of gold, crude oil, and cryptocurrency as a haven for traditional, sustainable, and Islamic investors during the COVID-19 pandemic crisis. The authors use the wavelet coherence analysis and the spillover index methodologies in bivariate and multivariate settings, examining the correlation of these assets for different investment horizons. The findings suggest that gold, oil, and bitcoin exhibited low coherency with each stock index across almost all considered investment horizons until the onset of COVID-19. Conversely, given the pandemic outbreak, the return spillover was more intense across financial assets, and a significant pairwise return connectedness between each equity index and the hedging asset was observed.
The blue cluster with a centrality of 0.576, an impact of 1.516, and 39 documents contains the topics of commerce, energy market, and stock markets. The studies in this cluster include Pal and Mitra [
94], Ftiti, Guesmi, and Abid [
95], Bouri et al. [
96], Maghyereh and Abdoh [
97], and others. Pal and Mitra explore the co-movement between oil price and automobile stock return using the Wavelet Coherence for daily price series from 1 August 1996, to 20 June 2017. The results indicate that the co-movement between oil price and automobile stock return was strong from November 2000 to December 2002 and from March 2006 to December 2009. The co-movement is found to be more prominent in the long term, and stock return is sensitive to the higher oil price emanating from the demand shock. Maghyereh and Abdoh [
97] examine the extreme co-movements (tail dependence) between the different sources of oil price shocks and stock market returns of major oil-exporter countries (Gulf Cooperation Council (GCC) countries) directly by testing the tail dependence of the joint distribution across frequencies. Their methodology incorporates an oil shock decomposition with a novel quantile cross-spectral dependence approach and the wavelet coherence analysis from 1 June 2006, to 28 February 2020. These two approaches enable the detection of the dependence structure during extreme market conditions (bearish and bullish markets) and/or at different time horizons (frequencies).
The green cluster with a centrality of 0.614, impact of 2.564, and 56 documents contains the topics of stock markets, crude oil, and commerce. The research in this cluster includes studies conducted by leading researchers. Filis, Degiannakis, and Floros [
23] studied the time-varying correlation between stock market prices and oil prices for oil-importing and oil-exporting countries using a DCC-GARCH-GJR approach based on data from six oil-exporting (Canada, Mexico, Brazil) and oil-importing (USA, Germany, The Netherlands) countries. The findings suggested that (i) the contemporaneous correlation, although it is a time-varying correlation, does not differ for oil-importing and oil-exporting economies, and (ii) the correlation increases positively (negatively) in response to important aggregate demand-side (precautionary demand) oil price shocks, which are caused by fluctuations of the global business cycle or world turmoil (i.e., wars). Supply-side oil price shocks do not influence the relationship between the two markets. Furthermore, the lagged correlation results show that oil prices negatively affect all stock markets, regardless of the origin of the oil price shock. Boldanov, Degiannakis, and Filis [
98] examined the time-varying conditional correlation between oil price and stock market volatility for six major oil-importing and oil-exporting countries using data from January 2000 to December 2014 and a Diag-BEKK model. Their findings report the following regularities. (i) The correlation between the oil and stock market volatilities changes over time, fluctuating at both positive and negative values. (ii) Heterogeneous patterns in the time-varying correlations are evident between the oil-importing and oil-exporting countries. (iii) Correlations are responsive to major economic and geopolitical events, such as the early 2000 recession, the 9/11 terrorist attacks, and the global financial crisis in 2007–2009.
Studies conducted mainly by Belhassine [
99], Ali et al. [
100], and Ren [
95] are included in the purple cluster with a centrality of 0.5108, an impact of 1.266, and 48 documents containing the topics of stock markets, commerce, and costs. Belhassine [
99] and Ren [
101] employ a bivariate VAR-BEKK-GARCH model to explore the dynamic relationships between oil prices and other assets in the Eurozone. Belhassine’s findings [
99] show that both mean and volatility spillovers among the oil market and the different Eurozone sectors are time-varying and heterogeneous. Meanwhile, Ren [
101] found stronger shock and volatility contagions from the European stock market to oil and gold markets. For the volatility nexus between oil and gold, weak and moderate evidence of shock and volatility transmission from gold to oil markets is reported by this author.
Finally, studies conducted mainly by Aloui, Aïssa, and Nguyen [
102], Feng and Cui [
103], and Nautiyal [
98] are included in the orange cluster with a centrality of 0.388, an impact of 1.649, and 27 documents. Aloui, Aïssa, and Nguyen [
102] and Feng and Cui [
103] used a copula–GARCH approach to analyze the conditional dependence structure among crude oil prices and foreign exchange rates. Aloui, Aïssa, and Nguyen [
96] found evidence of significant and symmetric dependence for almost all the oil–exchange rate pairs considered. The rise in the price of oil was found to be associated with the depreciation of the dollar. On the other hand, Feng and Cui [
103] studied the dual hedge of integrated risks among oil prices and foreign exchange rates. Their results showed that a dual hedge cannot outperform the single hedge in the direct hedging background. However, in the cross-dual hedging setting, a dual hedge performs much better, possibly because the dual hedge brings different levels of advantages and disadvantages in the two different settings, and the superiority of the dual hedge is more evident in the cross-dual hedging setting.


