Analysis of the Influencing Factors of the High-Quality Utilization of Territorial Space Based on the Perspective of Spatial Equilibrium: A Case Study of Hunan Province, China
Abstract
1. Introduction
2. Materials and Methods
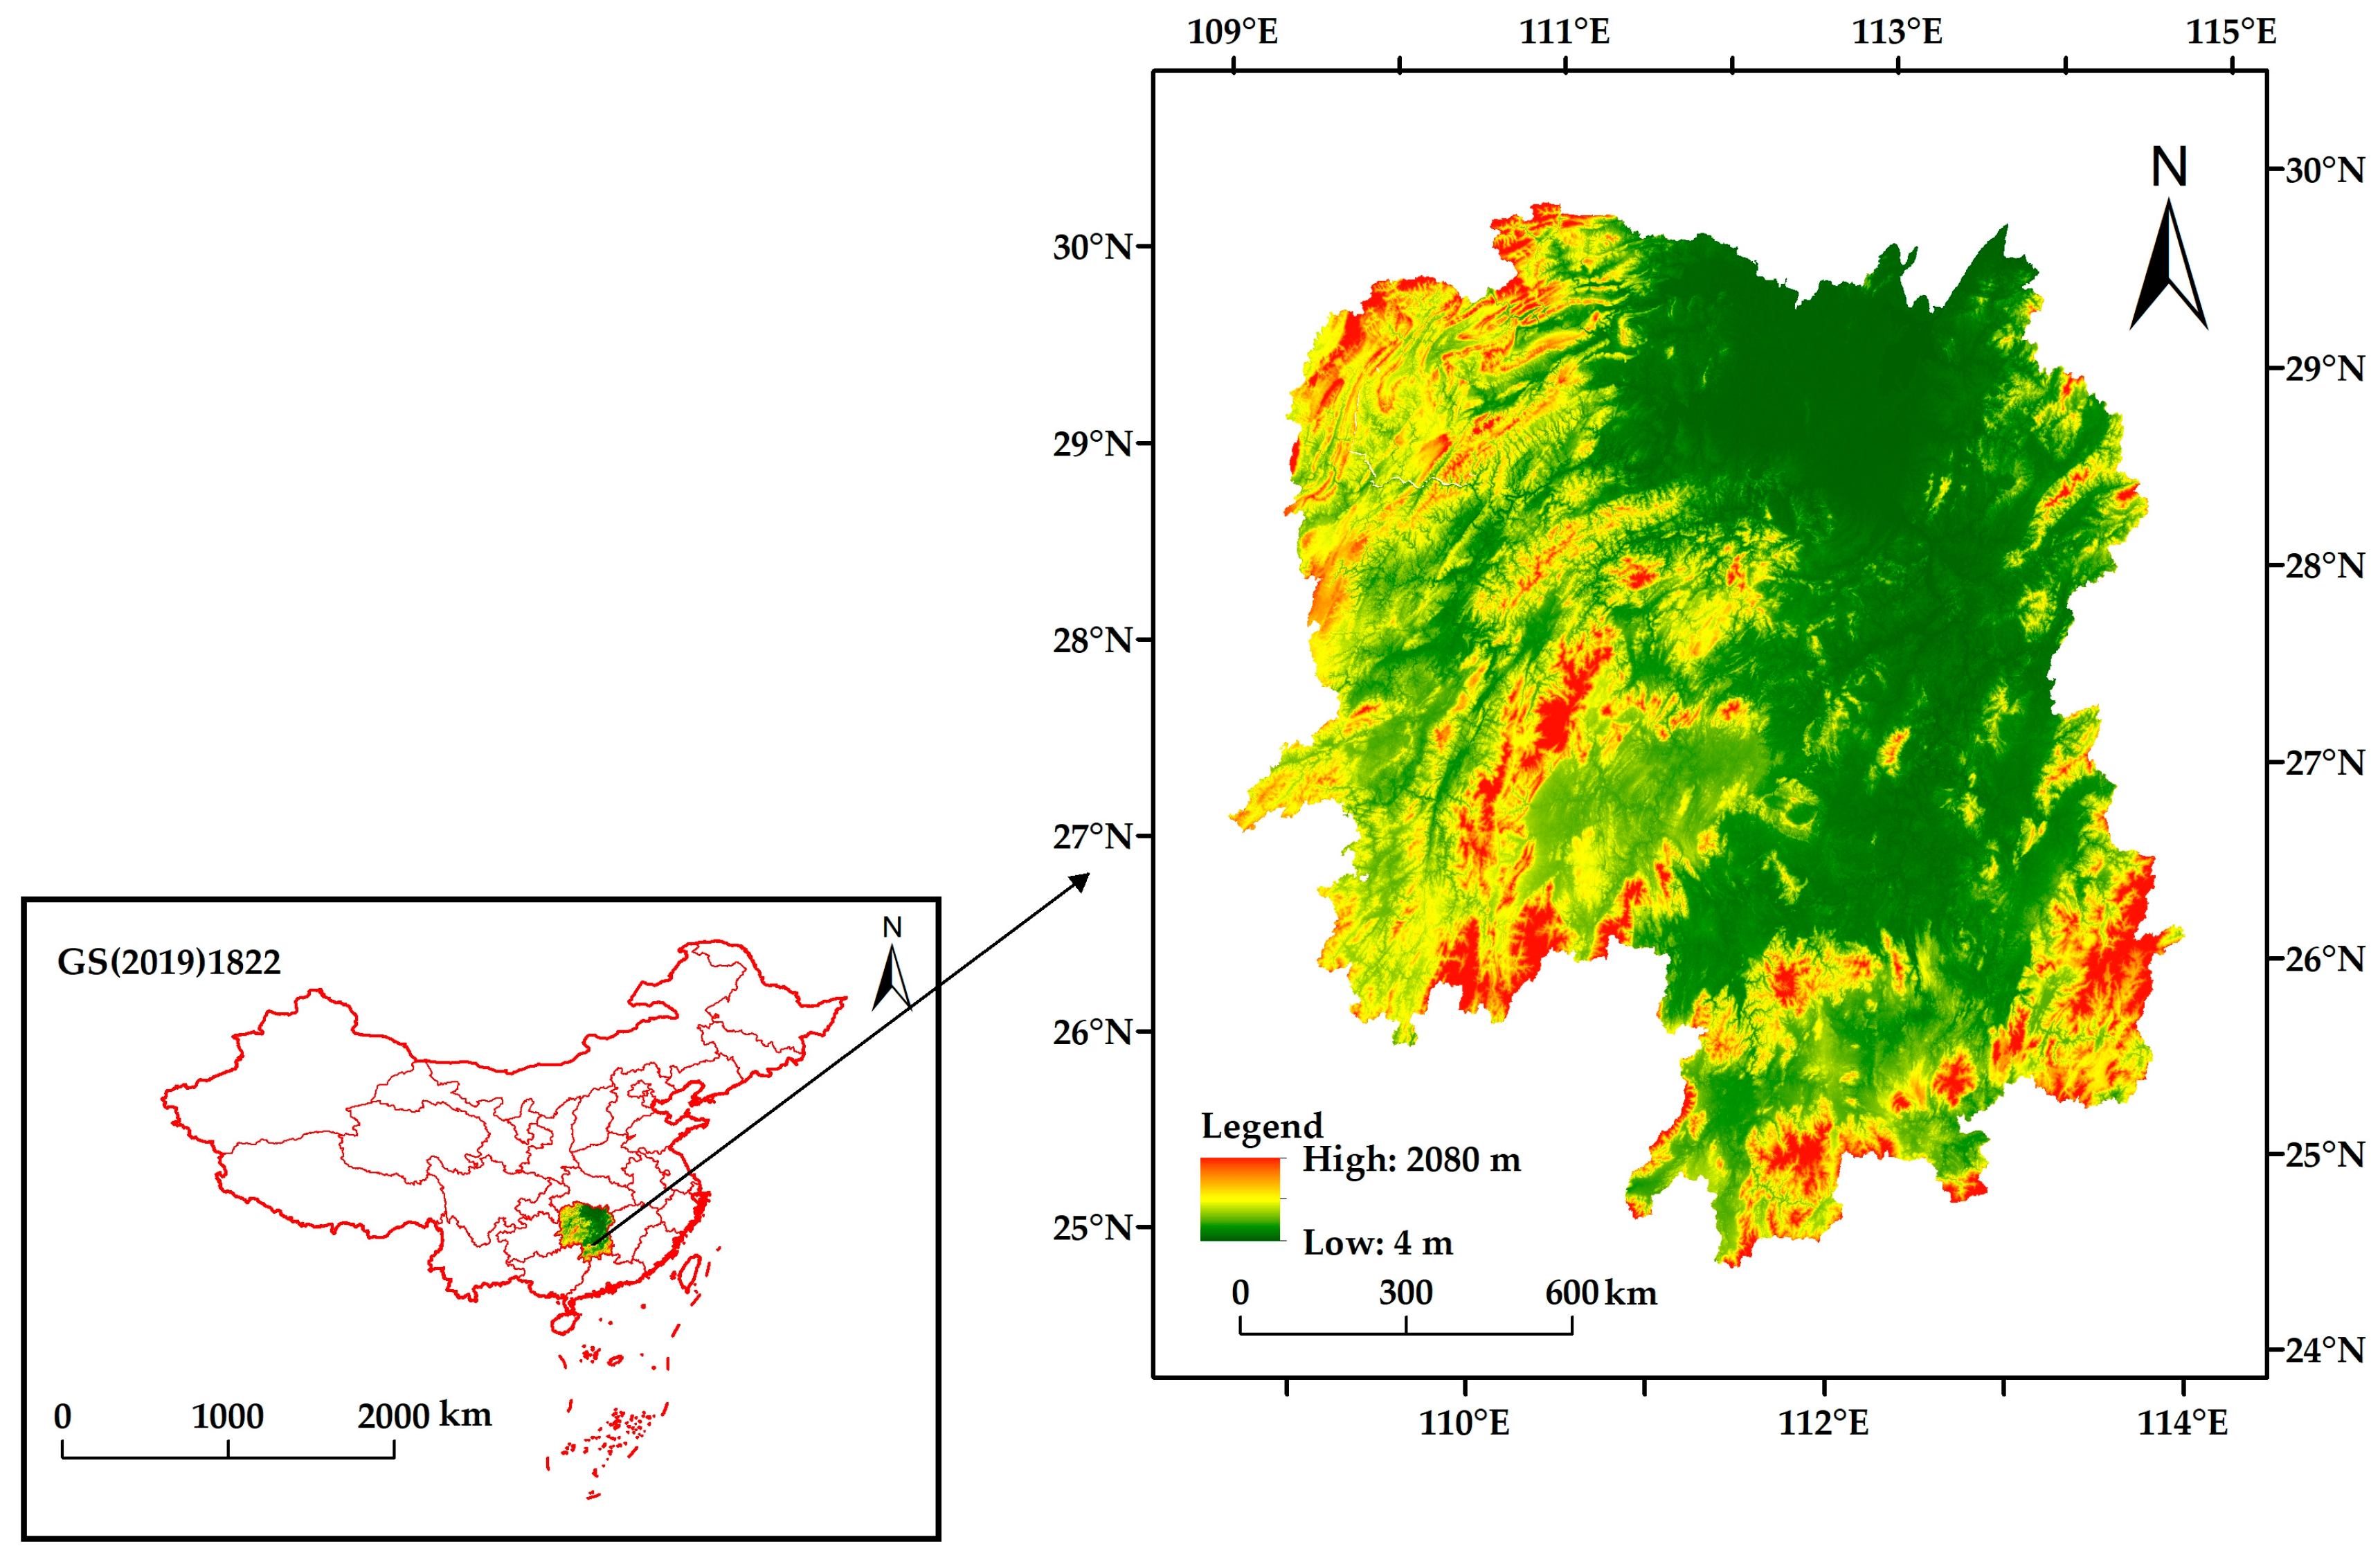
2.1. Study Area
2.2. Data Sources
2.3. Indicator System
2.3.1. Quality Evaluation Index System of Territorial Space Utilization
2.3.2. Index System of Influencing Factors of High-Quality Utilization of Territorial Space
2.4. Research Methods
2.4.1. Evaluation Model of Territorial Space Utilization Quality
2.4.2. The Model of Equilibrium Degree and Equilibrium Development
2.4.3. Spatial Econometric Model
3. Results and Analysis
3.1. Spatial and Temporal Characteristics of Territorial Space Utilization Quality and Spatial Equilibrium Development Degree
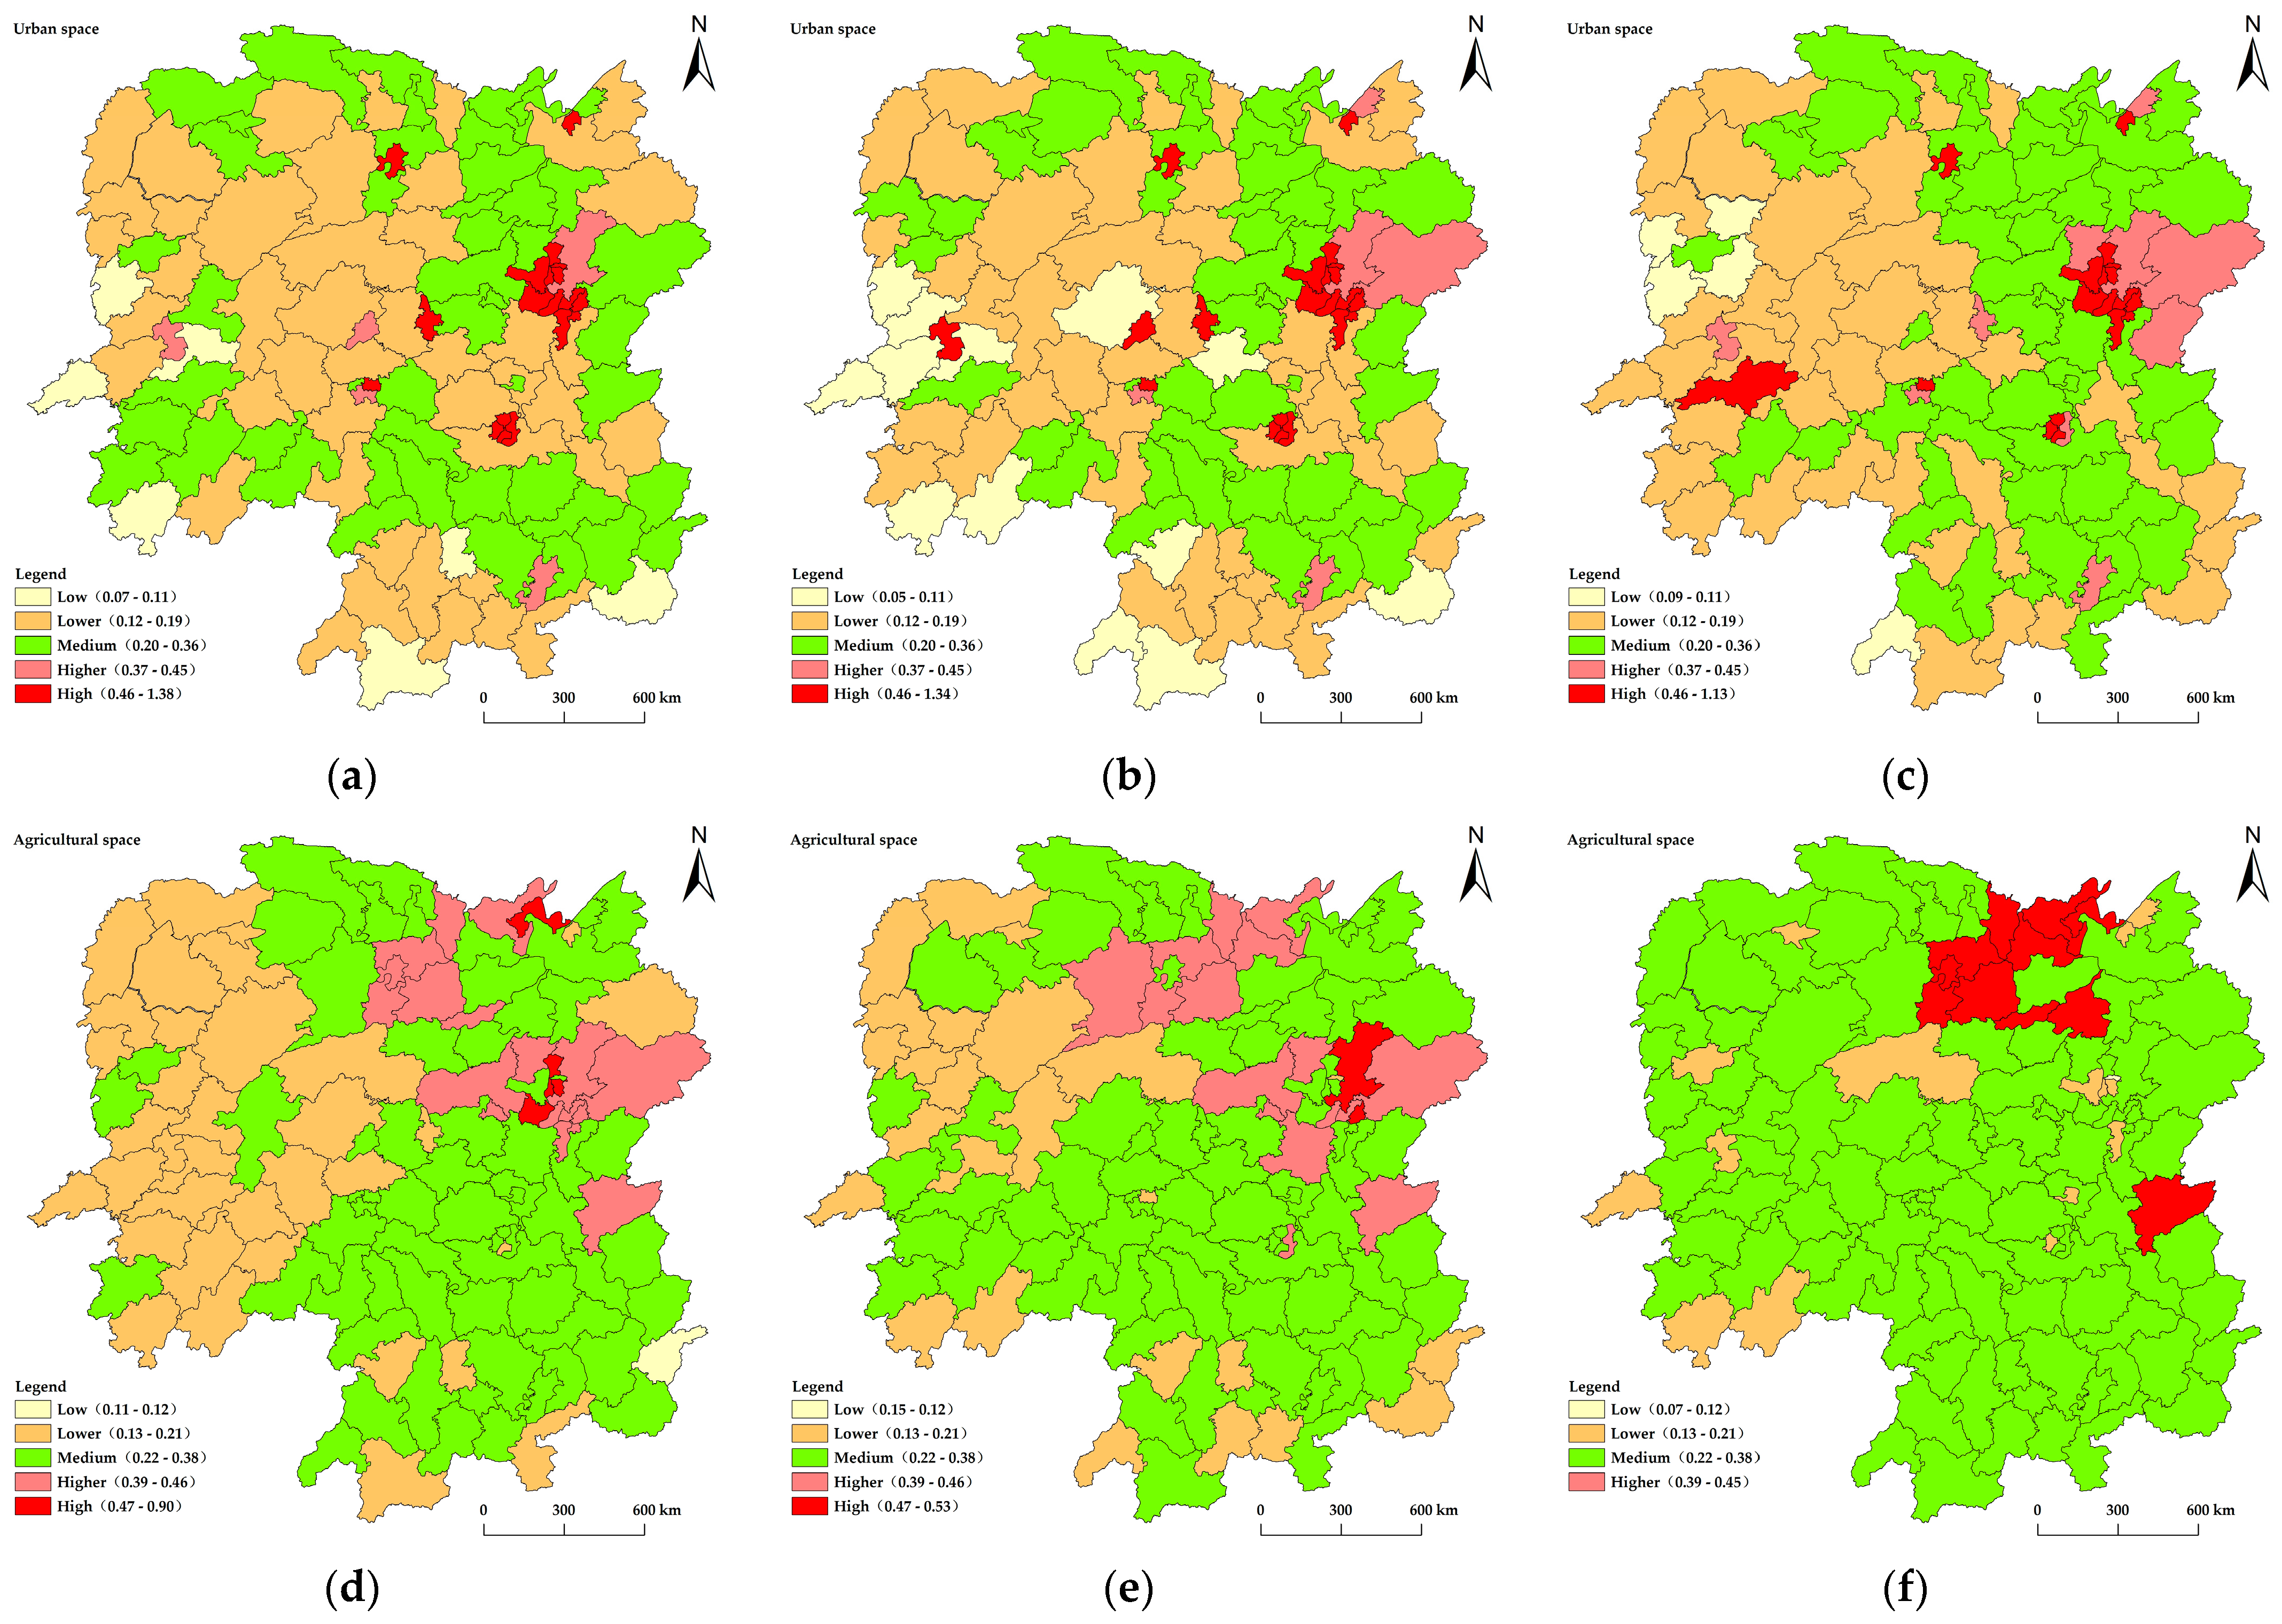
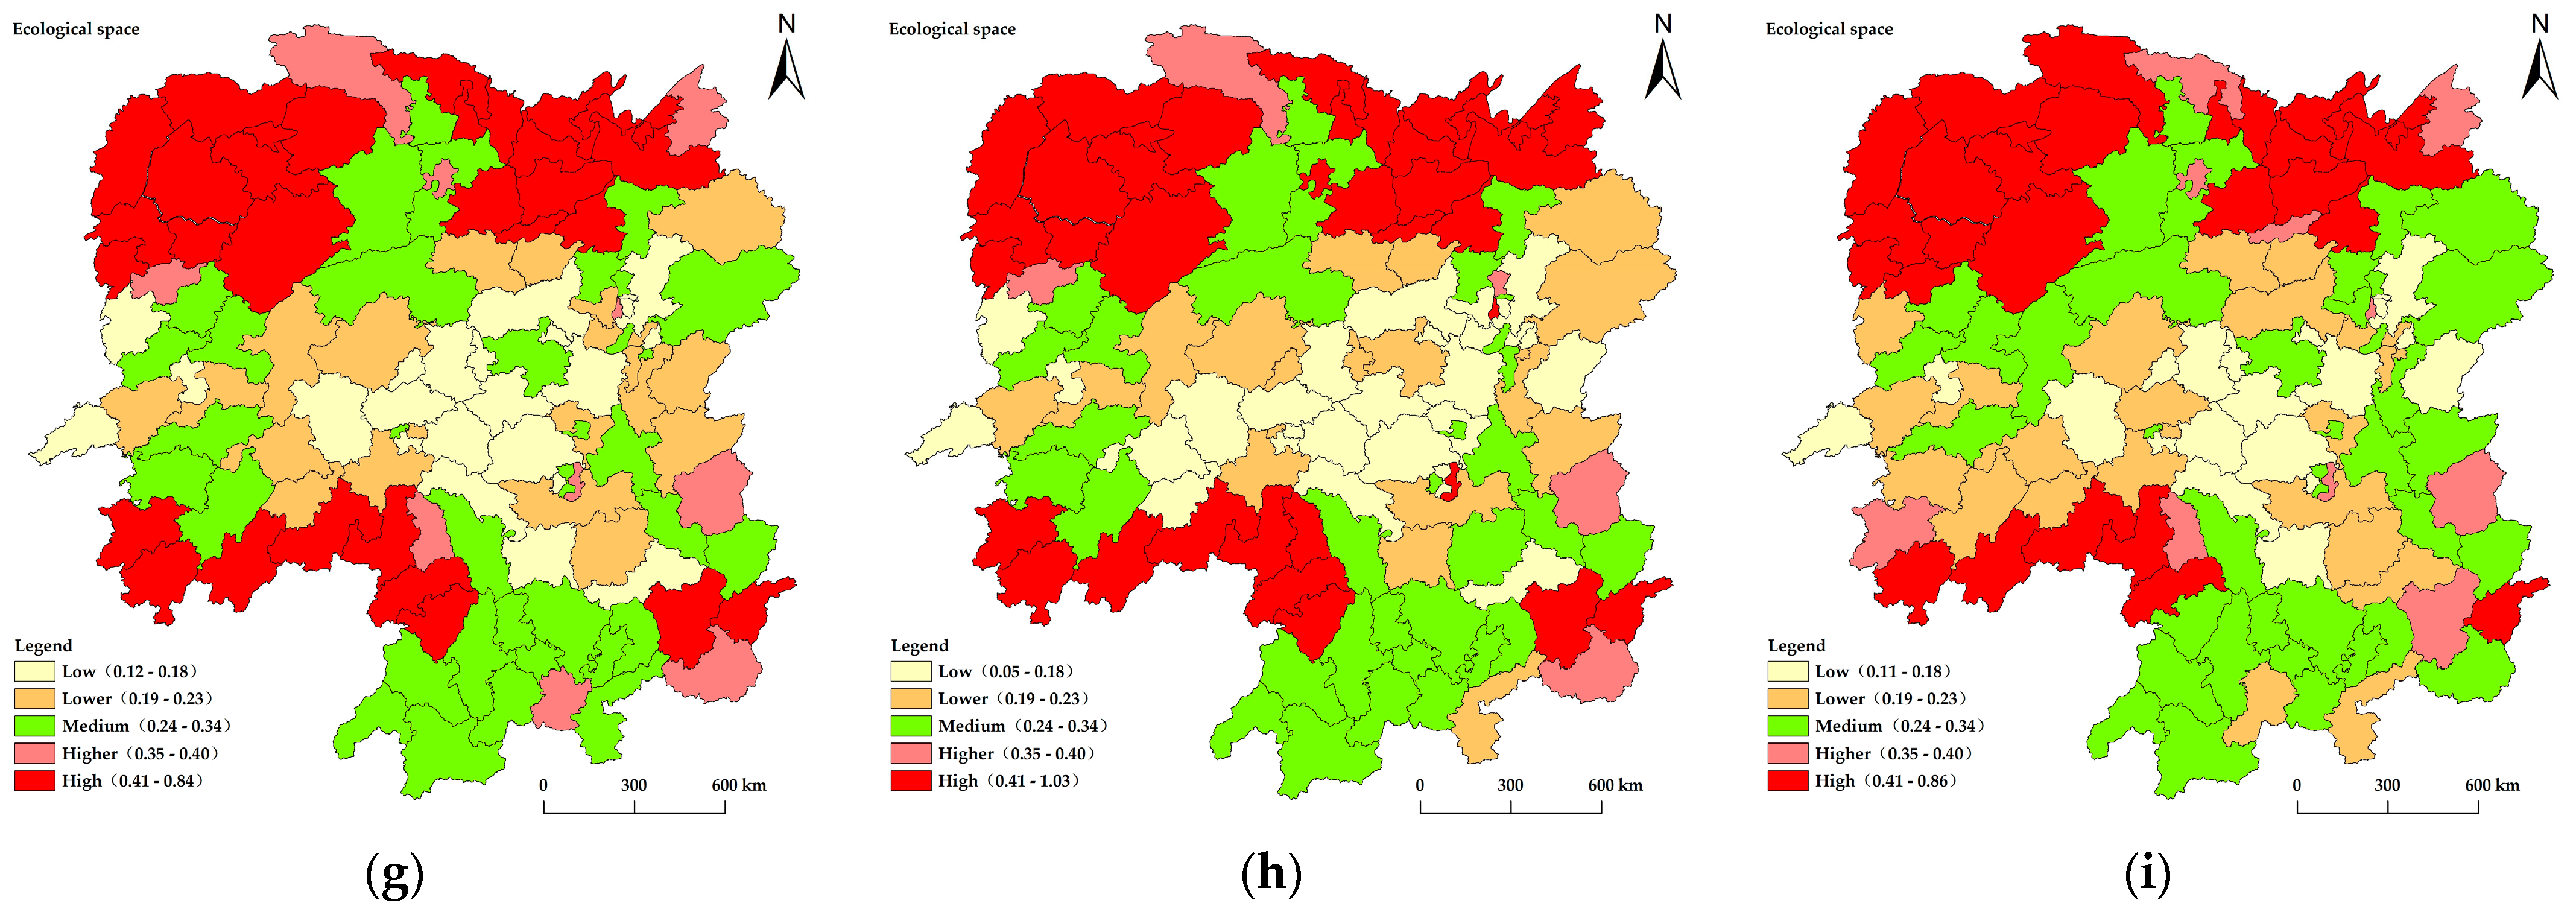
3.1.1. Spatial and Temporal Characteristics of Urban, Agricultural, and Ecological Space Utilization Quality
3.1.2. Spatial and Temporal Characteristics of the Spatial Equilibrium Development Degree of “Urban-Agricultural-Ecological”
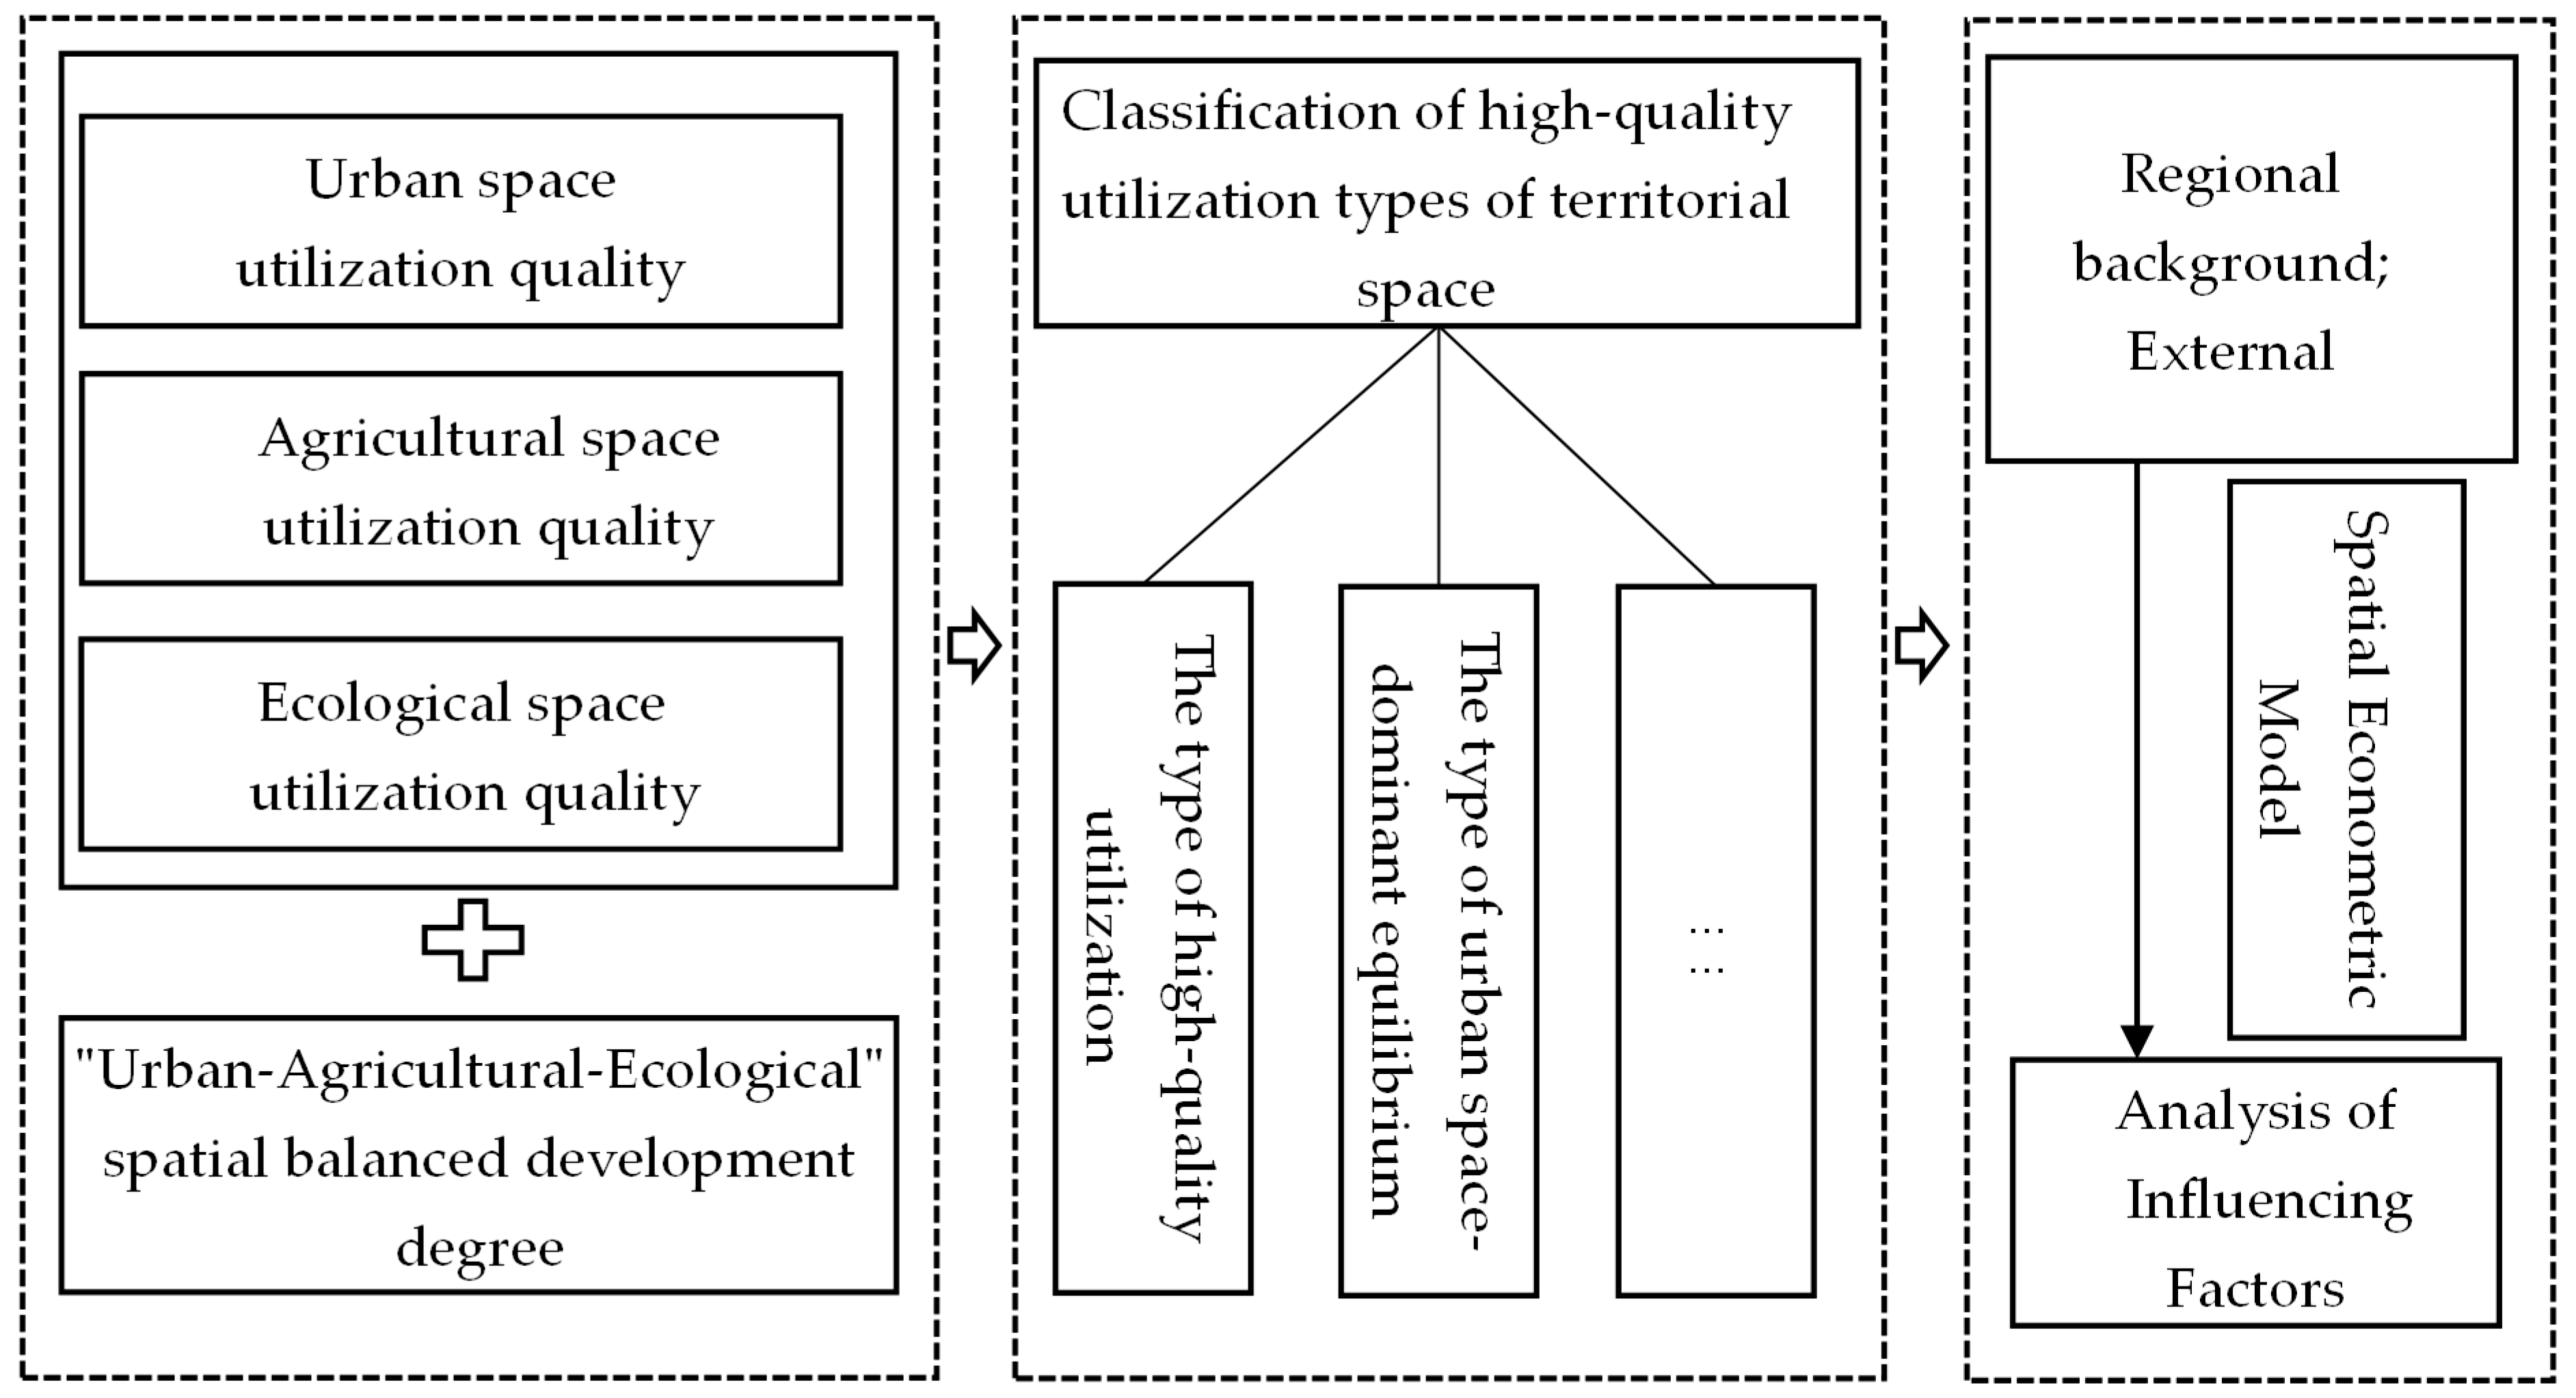
3.2. Classification of High-Quality Utilization Types of Territorial Space
3.3. Analysis of Influencing Factors on High-Quality Utilization of Territorial Space
3.3.1. Factors Affecting the Quality of Urban Space Utilization
3.3.2. Factors Affecting the Quality of Agricultural Space Utilization
3.3.3. Factors Affecting the Quality of Ecological Space Utilization
3.3.4. Analysis of Influencing Factors of “Urban-Agricultural-Ecological” Spatial Balanced Development Degree
4. Conclusions and Discussion
4.1. Conclusions
- (1)
- During the research period, the quality differences in the quality of urban, agricultural, and ecological spaces were significant. From 2010 to 2020, the quality of urban space utilization and ecological space utilization both increased first and then decreased, but the quality of agricultural space utilization continued to decline in Hunan Province. This spatial pattern of the three was relatively stable. The core area of Chang-Zhu-Tan with high economic and population agglomeration and some central urban areas in some prefectures were high-value areas of urban space utilization quality, but the urban space utilization quality in western and southern Hunan with backward infrastructure was not high. In 2010 and 2015, the high quality of agricultural space utilization in the Dongting Lake Plain and Chang-Zhu-Tan regions was related to their unique natural conditions. With the development of urbanization, most areas of Chang-Zhu-Tan wereno longerthe high-quality agricultural space utilization in 2020. In the value area, the quality of agricultural utilization in western Hunan and southern Hunan where cultivated land resources are fragmented has not been high. The high-value areas of ecological space utilization quality have always been in areas with large ecological scales, such as the county of Wuling Mountains.
- (2)
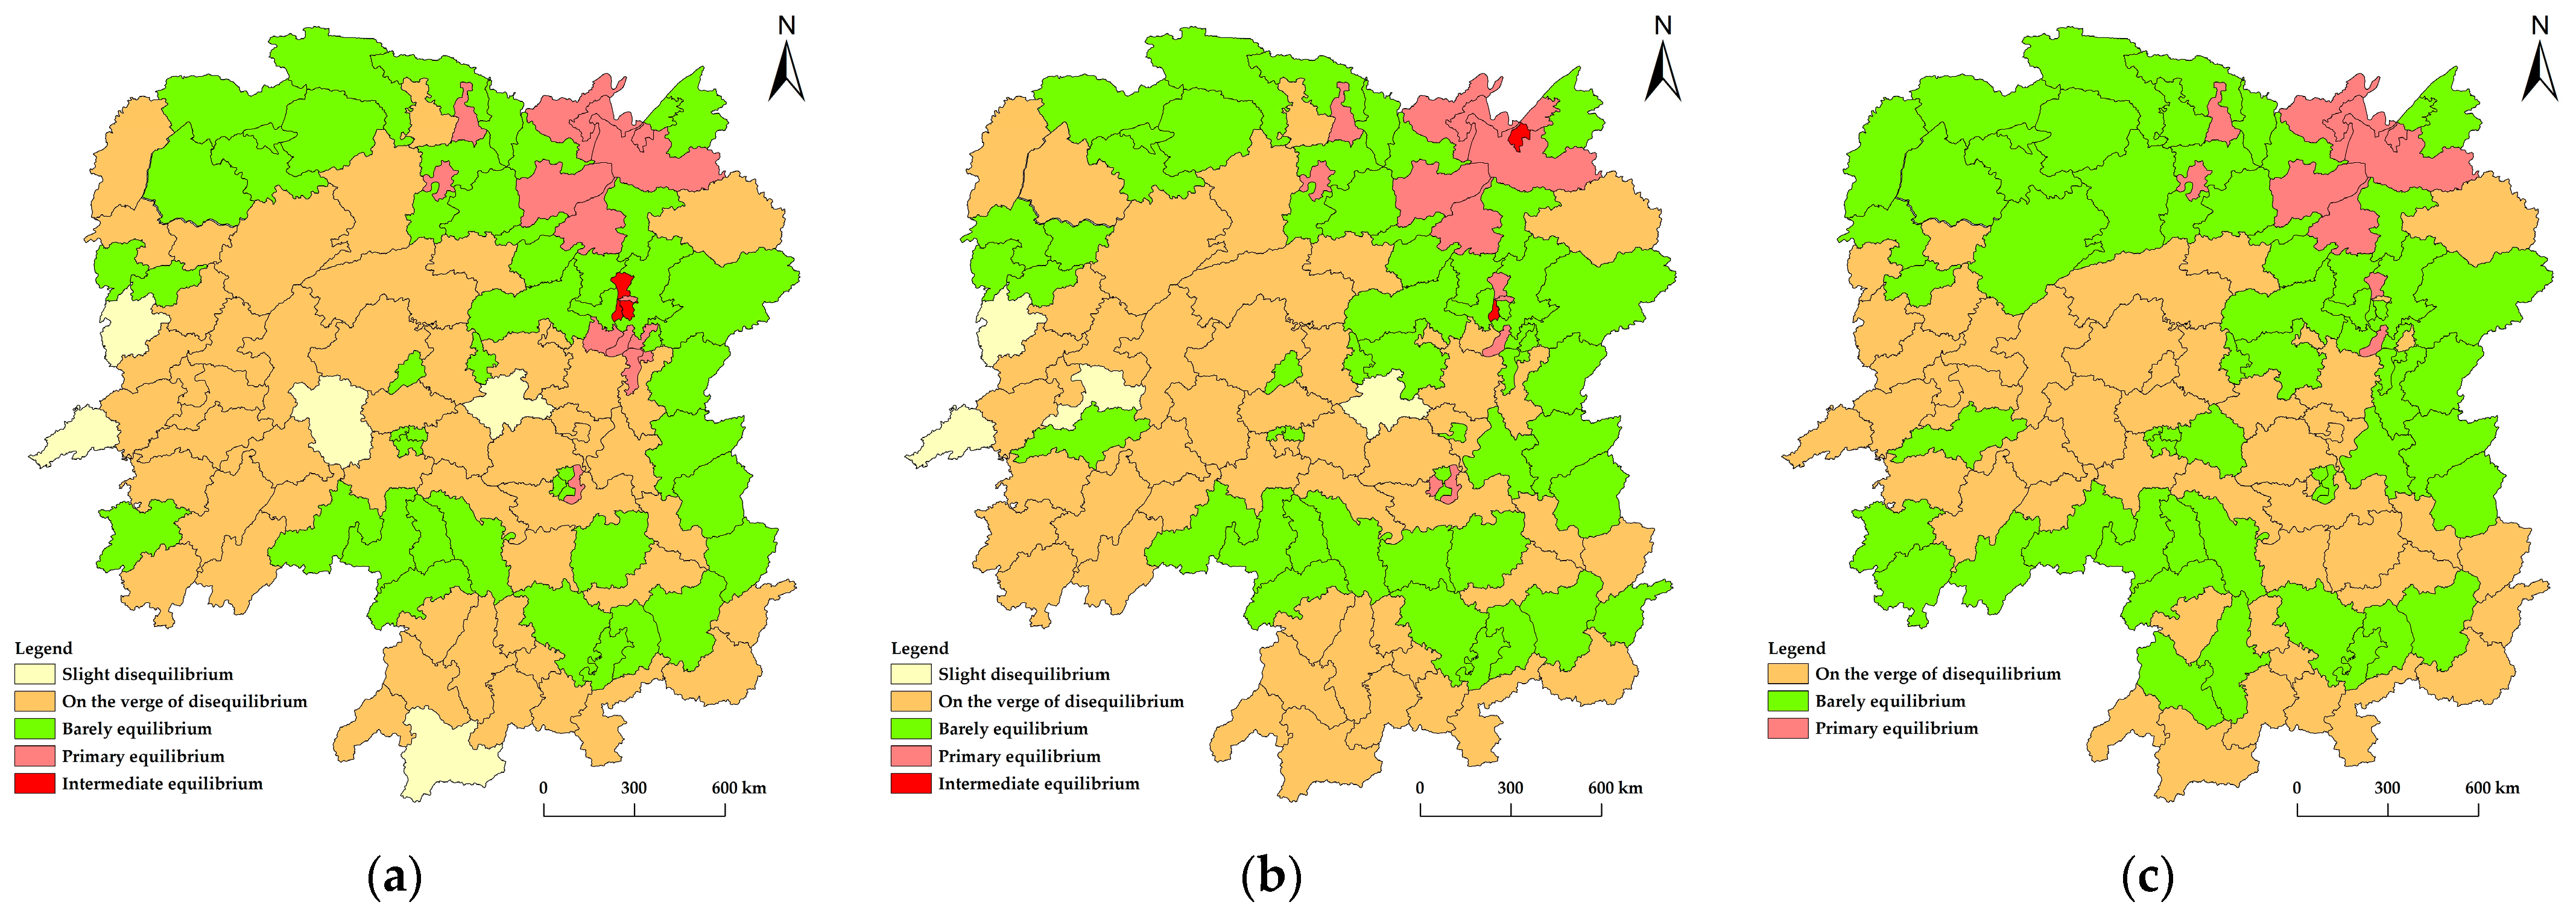
- The spatial equilibrium development degree of “urban-agricultural-ecology” increased first and then decreased in Hunan Province. The near-imbalance and barely balanced development have always been the main types of balanced development. Some counties in the core area of Chang-Zhu-Tan, and Dongting Lake Plain and the central urban area of Hengyang had a relatively high degree of balanced development driven by one or two types of space utilization quality. From 2010 to 2015, there were five types of balanced development. By 2020, because the quality of urban space utilization in the core area of Chang-Zhu-Tan was more prominent, the gap between the three spaces increased. However, with the increased infrastructure construction in western and southern Hunan, the gap between the three spaces narrowed, and the intermediate equilibrium and slight disequilibrium types of “urban-agricultural-ecology“ space were no longer present in Hunan Province.
- (3)
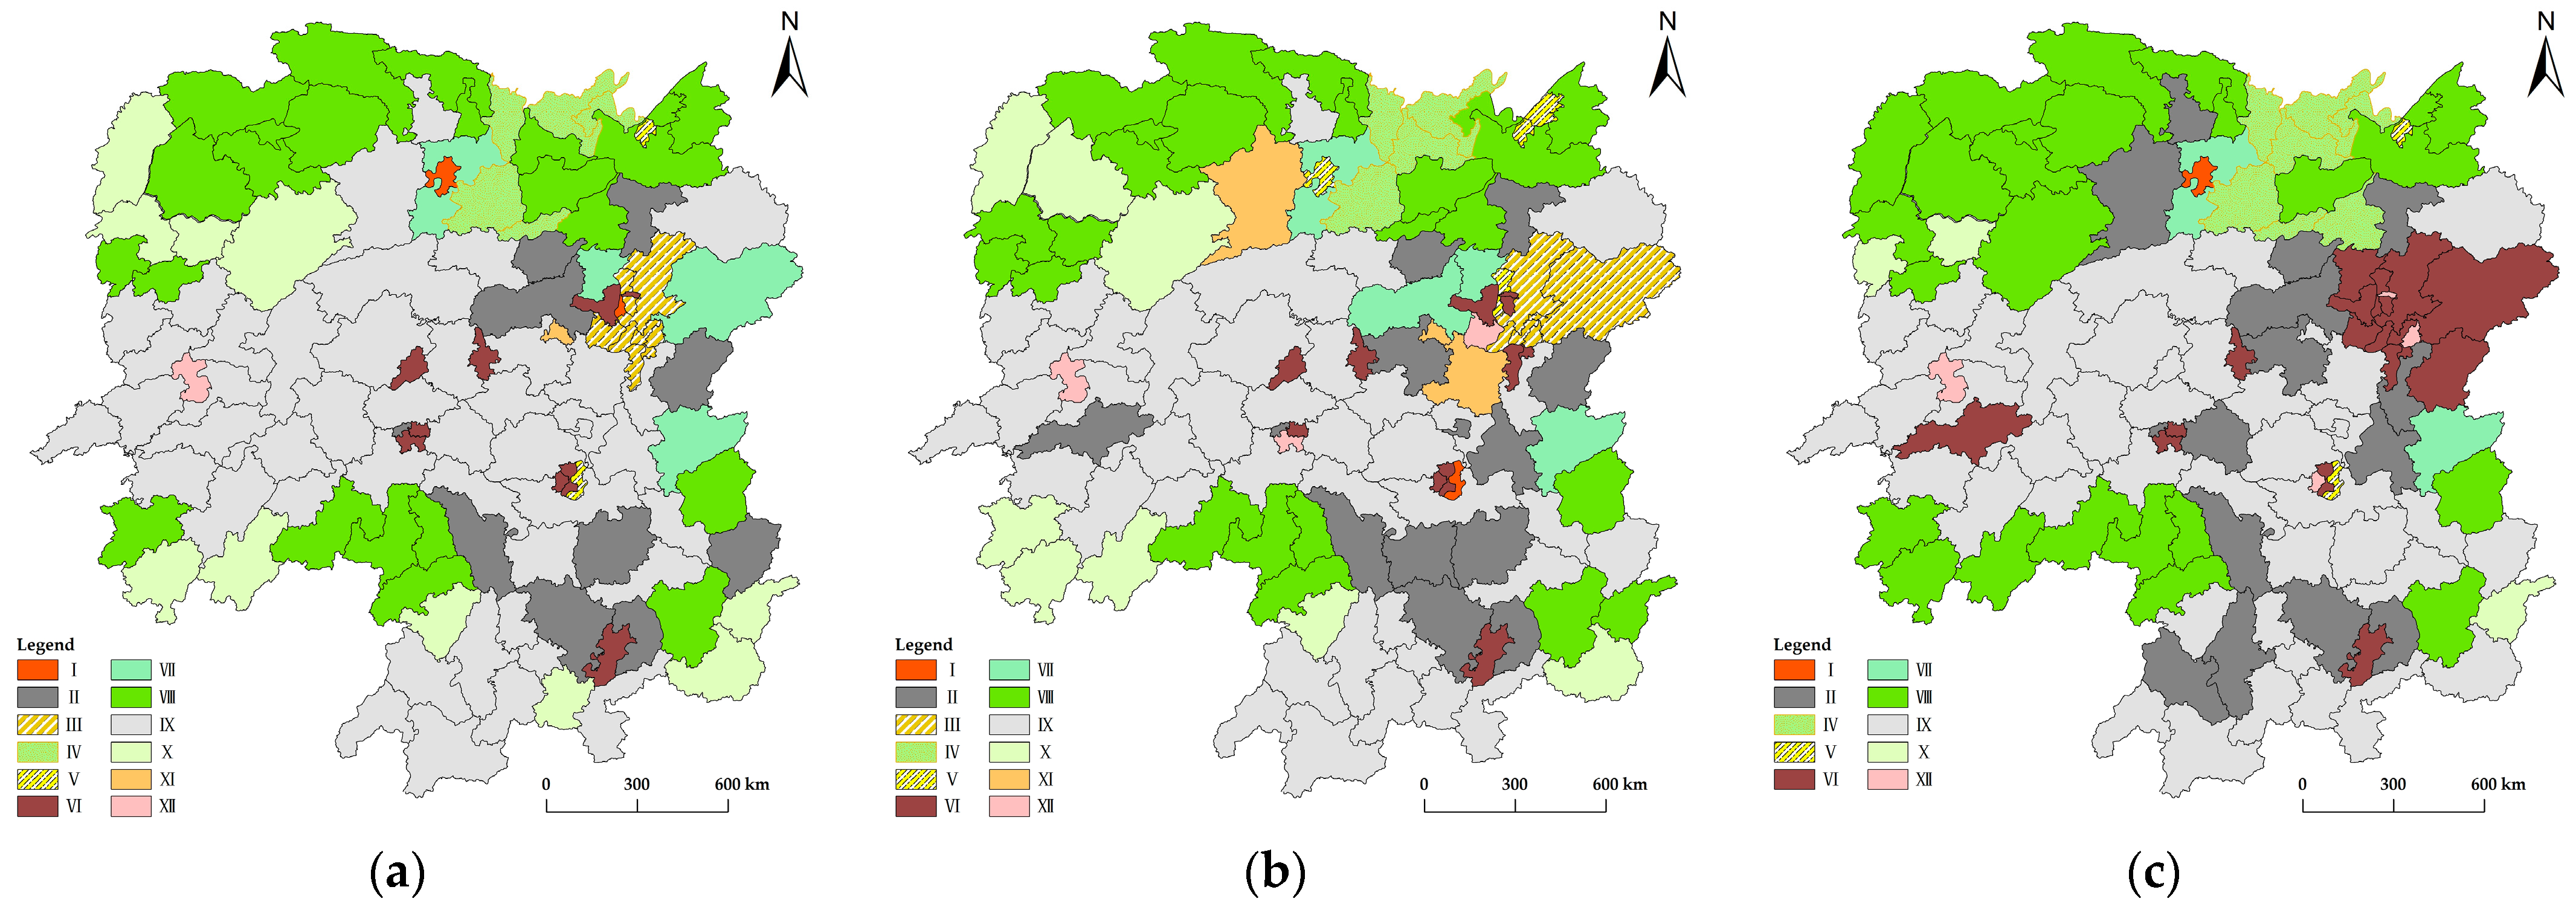
- From 2010 to 2020, the types of high-quality utilization of territorial space decreased in Hunan Province. There were 12 types of combination types in 2010 and 2015, and they were reduced to 10 types by 2020. During the study period, the type of urban-agricultural-ecological space of low-quality disequilibrium was the main type. From 2010 to 2020, the high-quality utilization of territorial space in Hunan Province from the perspective of spatial equilibrium has decreased from 2 in Tianxin District of Changsha City and Wuling District of Changde City in 2010 to 1 in Zhuhui District of Hengyang City in 2015. By 2020, with the quality of agricultural space utilization improvement, the Wuling District of Changde City once again ranked among the counties with high-quality utilization of territorial space in Hunan Province, but the other 121 counties’ territorial space utilization status needs to be improved. Therefore, from the perspective of spatial equilibrium, Hunan Province still has much room for improvement to promote the high-quality utilization of territorial space.
- (4)
- The high-quality utilization of territorial space in Hunan Province is affected by the combined effect of regional background factors and external influencing factors. Among them, the regional background factors had a strong limiting effect, such as average altitude, topographic relief, and annual average temperature. However, external factors had a strong driving effect, such as population density, resident consumption level, and so on. Only the area of soil erosion control had no significant impact on the high-quality utilization of territorial space. Nine influencing factors, such as average altitude and population density, had different degrees of influence on the high-quality use of territorial space, and each factor had a significant effect on the high-quality use of territorial space. Due to complexity, the same influencing factor may had different effects in different periods. On the whole, the factors of population density, resident consumption level, and average industrial output value above the designated scale have an important impact on the high-quality utilization of territorial space. Therefore, it is a good choice to promote the high-quality utilization of territorial space from these aspects.
4.2. Discussion
Author Contributions
Funding
Institutional Review Board Statement
Informed Consent Statement
Data Availability Statement
Acknowledgments
Conflicts of Interest
References
- Kong, Y.; Zhen, F.; Zhang, S.; Liu, J.; LI, Z. Evaluation on high-quality utilization of territorial space based on multi-source data. China Land Sci. 2020, 34, 115–124. [Google Scholar]
- Wen, N.; Tu, L.; Peng, J.; Tang, K. Development strategy of territorial space in Hunan Province under the background of reconstruction of spatial planning system. Econ. Geogr. 2021, 41, 73–80. [Google Scholar]
- Zhang, W.; Wang, H.; Cao, K.; He, S.; Shan, L. Ecological conservation–and economic development–based multiobjective land-use optimization: Case study of a rapidly developing city in central China. J. Urban Plan. Dev. 2019, 145, 5018023. [Google Scholar] [CrossRef]
- Qian, Q.; Liu, H.; Zheng, X. A Regional Sustainable Intensive Land Use Evaluation Based on Ecological Constraints: A Case Study in Jinan City. Sustainability 2019, 11, 1434. [Google Scholar] [CrossRef]
- Zhang, J.; Liu, C.; Chang, F. A New Approach for Multifunctional Zoning of Territorial Space: The Panxi Area of the Upper Yangtze River in China Case Study. Sustainability 2019, 11, 2325. [Google Scholar] [CrossRef]
- Wei, L.; Zhang, Y.; Wang, L.; Mi, X.; Wu, X.; Cheng, Z. Spatiotemporal Evolution Patterns of “Production-Living-Ecological” Spaces and the Coordination Level and Optimization of the Functions in Jilin Province. Sustainability 2021, 13, 13192. [Google Scholar] [CrossRef]
- Li, Q.; Fang, C.; Wang, S. Evaluation of territorial utilization quality in China: Based on the aspect of production-living-lcological space. Areal Res. Dev. 2016, 35, 163–169. [Google Scholar]
- Wang, Q.; Chen, T.; Li, A.; Zhang, S.; Wang, Y. Evaluation of territorial utilization quality based on “production-living-ecological” perspectives—A case study of Panxi Region. Mt. Res. 2020, 38, 290–302. [Google Scholar]
- Zhang, J. Assessment of land space utilization quality and its coupling and coordination based on producing, living and ecological—A case study of the southern Jiangsu Region. J. Agric. Sci. 2017, 38, 57–63. [Google Scholar]
- Yakufu, ·D.; Xia, F. A case study on Hebei province: Spatial features, factors and mechanism of land development intensity based on ESDA-GWR. Resour. Ind. 2018, 20, 28–38. [Google Scholar]
- Wei, S.; Lu, R.; Lin, X.; Pang, X.; Qin, Q. Study on the evolution and mechanism of territorial space pattern of land border area in Guangxi. China Land Sci. 2021, 35, 98–108. [Google Scholar]
- Zhao, X.; Li, S.; Pu, J.; Miao, P.; Wang, Q.; Tan, K. Optimization of the National Land Space Based on the Coordination of Urban-Agricultural-Ecological Functions in the Karst Areas of Southwest China. Sustainability 2019, 11, 6752. [Google Scholar] [CrossRef]
- Li, S.; Zhao, X.; Pu, J.; WANG, Q.; Miao, P.; Tan, K. Territorial space function quality evaluation and couplingcoordination analysis in typical karst areas of Southwest China:A case study of Guangnan county. J. Nat. Resour. 2021, 36, 2350–2367. [Google Scholar]
- Muryanto; Suntoro; Gunawan, T.; Setyono, P. Land use, climate parameters and water quality changes at surroundings of Code River, Indonesia. In Proceedings of the International Conference on Climate Change: Challenges and Opportunity on Environment Degradation Researches, Surakarta, Indonesia, 24–26 October 2017. [Google Scholar]
- Hsu, K. Effect of distinct land use patterns on quality of life in urban settings. J. Urban Plan. Dev. 2019, 145, 5019016. [Google Scholar] [CrossRef]
- Zhou, D.; Xu, J.; Lin, Z. Conflict or coordination? Assessing land use multi-functionalization using production-living-ecology analysis. Sci. Total Environ. 2017, 577, 136–147. [Google Scholar] [CrossRef]
- Bagheri, M.; Zaiton Ibrahim, Z.; Mansor, S.; Manaf, L.A.; Akhir, M.F.; Talaat, W.I.A.W.; Beiranvand Pour, A. Land-Use Suitability Assessment Using Delphi and Analytical Hierarchy Process (D-AHP) Hybrid Model for Coastal City Management: Kuala Terengganu, Peninsular Malaysia. ISPRS Int. J. Geo-Inf. 2021, 10, 621. [Google Scholar] [CrossRef]
- Aymen, A.; Al-husban, Y.; Farhan, I. Land suitability evaluation for agricultural use using GIS and remote sensing techniques: The case study of Ma’an Governorate, Jordan. Egypt. J. Remote Sens. Space Sci. 2021, 24, 109–117. [Google Scholar]
- Pokhrel, S. Green space suitability evaluation for urban resilience: An analysis of Kathmandu Metropolitan City, Nepal. Environ. Res. Commun. 2019, 1, 105003. [Google Scholar] [CrossRef]
- Azuara-García, G.; Palacios, E.; Montesinos-Barrios, P. Embedding sustainable land-use optimization within system dynamics: Bidirectional feedback between spatial and non-spatial drivers. Environ. Model. Softw. 2022, 155, 105463. [Google Scholar] [CrossRef]
- Farhan, S.L.; Alyasari, H.I.; Akef, V.S.; Zubaidi, S.L. Analysing the Transformed Urban Patterns of Al-Najaf Historical Center: Urgent Issues and Possible Solutions. In Proceedings of the 1st Conference on Science and Technology for Early Career Researchers and Postgraduate Students (STEPS 2020), Erbil, Iraq, 20–22 December 2020. [Google Scholar] [CrossRef]
- Yang, R.; Du, W.; Yang, Z. Spatiotemporal Evolution and Influencing Factors of Urban Land Ecological Security in Yunnan Province. Sustainability 2021, 13, 2936. [Google Scholar] [CrossRef]
- Jiao, G.; Yang, X.; Huang, Z.; Zhang, X.; Lu, L. Evolution characteristics and possible impact factors for the changing pattern and function of “Production-Living-Ecological” space in Wuyuan county. J. Nat. Resour. 2021, 36, 1252–1267. [Google Scholar] [CrossRef]
- Song, Y.; Xue, D.; Xia, S. Change characteristics and formation mechanism of the territorial spatial pattern in the Yellow River Basin from 1980 to 2018, China. China Geogr. Res. 2021, 40, 1445–1463. [Google Scholar]
- Tan, X.; Jiang, L.; Mi, S.; Ouyang, Q.; Wang, Z.; An, Y. Performance evaluation and spatial differentiation of rural anti-poverty at county scale in Hunan Province. Sci. Geogr. Sin. 2019, 39, 938–946. [Google Scholar]
- Tang, Y.; Yuan, Y.; Zhong, Q. Evaluation of land comprehensive carrying capacity and spatio-temporal analysis of the Harbin-Changchun urban agglomeration. Int. J. Environ. Res. Public Health 2021, 18, 521. [Google Scholar] [CrossRef]
- Yin, S.; Li, J.; Liang, J.; Jia, K.; Yang, Z.; Wang, Y. Optimization of the weighted linear combination method for agricultural land suitability evaluation considering current land use and regional differences. Sustainability 2020, 12, 10134. [Google Scholar] [CrossRef]
- Xu, D.; Hou, G. The Spatiotemporal Coupling Characteristics of Regional Urbanization and Its Influencing Factors: Taking the Yangtze River Delta as an Example. Sustainability 2019, 11, 822. [Google Scholar] [CrossRef]
- Bai, J.; Liu, R.; Liu, Q. The connotation definition and state evaluation of regional high quality development based on perspective of spatial equilibrium: A case of ShanXi Province. Hum. Geogr. 2020, 35, 123–130. [Google Scholar]
- Chen, G.; Liu, X.; Jiang, S.; Ding, G.; Guo, Q.; Yang, L. Measurement and path selection of coupling and coordinated development of rural revitalization in Hunan Province. Econ. Geogr. 2019, 39, 191–197. [Google Scholar]
- Cui, J.; Guo, G. Impact of new-type urbanization on industrial land use efficiency based on spatial econometric model: Evidences from industrial enterprises in Jiangsu Province. Resour. Environ. Yangtze Basin 2021, 30, 565–574. [Google Scholar]
- Yan, S.; Peng, J.; Wu, Q. The convergence characteristics of industrial land use efficiency in China. Resour. Sci. 2018, 40, 1163–1174. [Google Scholar]
- Xiong, Y.; Huang, L.; Zou, F.; Zhao, D.; Tang, Y. Multifunctional spatial characteristics of rural areas and their type identification based on county scale: A case of Hunan Province. Econ. Geogr. 2021, 41, 162–170. [Google Scholar]
| Target Layer | Criterion Layer | Indicator Layer and Unit | Calculation | Weight |
|---|---|---|---|---|
| Urban space | Efficient utilization | Investment intensity of fixed assets per land (yuan/km2) | Fixed asset investment/Construction land area | 0.06 |
| Land development intensity (%) | Built-up area/Total administrative area | 0.192 | ||
| Employment in secondary and tertiary industries per land (people/km2) | Employment in the secondary and tertiary industries/Built-up area | 0.045 | ||
| Economic agglomeration | GDP per capita (yuan) | GDP of secondary and tertiary industries/ Total urban population | 0.126 | |
| The added value of the secondary and tertiary industries per land (yuan/km2) | The added value of the secondary and tertiary industries/Built-up area | 0.06 | ||
| Per capita disposable income of urban residents (yuan) | The Hunan Statistical Yearbook | 0.078 | ||
| Population agglomeration | Urban population density (people/km2) | Total urban population/Built-up area | 0.092 | |
| Urbanization rate (%) | Total urban population/Total population | 0.257 | ||
| Medical education allocation index | Number of schools × Number of teachers × Number of health facilities × Number of beds to the power of 4 | 0.090 | ||
| Agricultural space | Agricultural productivity | Land reclamation rate (%) | Cultivated area/Total administrative area | 0.112 |
| The ratio of agricultural employees (%) | Agricultural working population/Total working population | 0.101 | ||
| Per capita arable land area (km2/person) | Cultivated area/Total population | 0.078 | ||
| Agricultural product security rate | Grain yield per unit area (kg/km2) | Grain yield/Cultivated area | 0.063 | |
| Effective irrigation area ratio (%) | Effective irrigation area/Agricultural land area | 0.045 | ||
| Per capita grain possession (kg) | Grain yield/Total population | 0.156 | ||
| Rural quality of life | Per capita disposable income of rural residents (yuan) | Hunan Rural Statistical Yearbook | 0.196 | |
| Disposable income of rural residents (km2) | Food expenditure/Total household consumption expenditure | 0.144 | ||
| Engel coefficient (%) | Total electricity consumption/Total rural population | 0.107 | ||
| Ecological space | Ecosystem | Pesticide use intensity (kg/km2) | Pesticide usage/Agricultural land area | 0.078 |
| Agricultural plastic film use intensity (kg/km2) | Agricultural plastic film usage/Agricultural land area | 0.134 | ||
| Per capita afforestation area (%) | Afforestation area/Total population | 0.078 | ||
| Ecological scale | Forest coverage (%) | Extract via ArcGIS | 0.079 | |
| Grassland coverage (%) | 0.21 | |||
| Water coverage (%) | 0.225 | |||
| Landscape quality | Fragmentation index | Extract via Fragstats | 0.087 | |
| Diversity Index | 0.107 |
| Criterion Layer | Independent Variable | Unit | Calculation |
|---|---|---|---|
| Regional background factors | Average altitude (X1) | m | Extract via ArcGIS |
| Topographic relief (X2) | m | ||
| Annual average temperature (X3) | °C | ||
| Annual average precipitation (X4) | mm | ||
| External factors | Population density (X5) | people/km2 | Total Population/Total area of Administrative Region |
| Resident consumption level (X6) | yuan/people | Total retail sales of social consumer goods/Total population | |
| Average industrial output value above designated scale (X7) | yuan/km2 | Industrial output value above designated size/Construction land area | |
| Local fiscal expenditure (X8) | yuan | Hunan Statistical Yearbook | |
| Dike length from local fiscal expenditure (X9) | km | ||
| Water and soil loss control area (X10) | km2 | Hunan Rural Statistical Yearbook |
| High-Quality Utilization Partition Type | Feature | ||||
|---|---|---|---|---|---|
| U1 | U2 | U3 | D | ||
| Ⅰ | The type of high-quality utilization | ≥higher | ≥higher | ≥higher | Balanced development |
| Ⅱ | The type of urban-agricultural-ecological space is a low-quality equilibrium | ≤medium | ≤medium | ≤medium | Balanced development |
| Ⅲ | The type of urban-agricultural space-driven equilibrium | ≥higher | ≥higher | ≤medium | Balanced development |
| Ⅳ | The type of agricultural-ecological space-driven equilibrium | ≤medium | ≥higher | ≥higher | Balanced development |
| Ⅴ | The type of town-ecological space-driven equilibrium | ≥higher | ≤medium | ≥higher | Balanced development |
| Ⅵ | The type of urban space-dominant equilibrium | ≥higher | ≤medium | ≤medium | Balanced development |
| Ⅶ | The type of agricultural space-dominant equilibrium | ≤medium | ≥higher | ≤medium | Balanced development |
| Ⅷ | The type of ecological space dominant equilibrium | ≤medium | ≤medium | ≥higher | Balanced development |
| Ⅸ | The type of urban-agricultural-ecological space has low-quality disequilibrium | ≤medium | ≤medium | ≤medium | Unbalanced development |
| Ⅹ | The type of urban-agricultural space lag disequilibrium | ≤medium | ≤medium | ≥higher | Unbalanced development |
| Ⅺ | The type of urban-ecological space lag disequilibrium | ≤medium | ≥higher | ≤medium | Unbalanced development |
| Ⅻ | The type of agricultural-ecological space lag disequilibrium type | ≥higher | ≤medium | ≤medium | Unbalanced development |
| Factors | U1 | Factors | U1 | ||||
|---|---|---|---|---|---|---|---|
| The Year 2010 | The Year 2015 | The Year 2020 | The Year 2010 | The Year 2015 | The Year 2020 | ||
| X1 | −0.042 | −0.763 *** | −0.549 *** | X6 | 0.414 *** | 0.346 *** | 0.327 *** |
| X2 | −0.085 | −0.112 | −0.007 | X7 | 0.127 *** | 0.104 *** | 0.106 *** |
| X3 | 0.09 | −0.303 | −0.136 | X8 | −0.049 | −0.034 | 0.064 |
| X4 | 0.026 | 0.223 | −0.053 | X9 | −0.065 ** | −0.069 *** | −0.055 * |
| X5 | −0.35 *** | −0.514 *** | −0.627 *** | X10 | −0.007 | −0.028 | −0.043 |
| Factors | U2 | Factors | U2 | ||||
|---|---|---|---|---|---|---|---|
| The Year 2010 | The Year 2015 | The Year 2020 | The Year 2010 | The Year 2015 | The Year 2020 | ||
| X1 | 0.007 | −0.037 | −0.019 | X6 | 0.433 *** | −0.05 | −0.047 |
| X2 | −0.082 ** | −0.042 | 0.019 | X7 | 0.023 | 0.094 * | 0.017 |
| X3 | −0.017 | −0.005 | −0.022 | X8 | 0.163 *** | 0.446 *** | 0.139 |
| X4 | 0.004 | −0.033 | −0.062 | X9 | 0.074 | 0.007 | 0.062 |
| X5 | 0.463 *** | 0.572 *** | 0.704 *** | X10 | −0.003 | −0.089 | 0.039 |
| Factors | U3 | Factors | U3 | ||||
|---|---|---|---|---|---|---|---|
| The Year 2010 | The Year 2015 | The Year 2020 | The Year 2010 | The Year 2015 | The Year 2020 | ||
| X1 | 0.153 | −0.516 ** | −0.154 | X6 | 0.113 | −0.057 | −0.111 |
| X2 | −0.004 | −0.112 | −0.068 | X7 | −0.021 | −0.048 | −0.112 |
| X3 | −0.111 | −0.706 *** | −0.176 | X8 | −0.261 ** | −0.27 ** | −0.17 |
| X4 | 0.062 | 0.423 *** | 0.258 *** | X9 | 0.275 *** | 0.178 ** | 0.055 |
| X5 | −0.142 | 0.035 | −0.127 | X10 | −0.049 | 0.037 | −0.083 |
| Factors | D | Factors | D | ||||
|---|---|---|---|---|---|---|---|
| The Year 2010 | The Year 2015 | The Year 2020 | The Year 2010 | The Year 2015 | The Year 2020 | ||
| X1 | −0.052 | −0.686 ** | −0.331 * | X6 | 0.691 *** | 0.421 *** | 0.334 *** |
| X2 | −0.057 | −0.136 | −0.009 | X7 | 0.157 *** | 0.171 *** | 0.093 |
| X3 | −0.037 | −0.511 ** | −0.187 | X8 | −0.156 ** | −0.012 | −0.066 |
| X4 | 0.017 | 0.228 | 0.092 | X9 | 0.127 ** | −0.041 | 0.032 |
| X5 | −0.302 ** | −0.013 | −0.214 | X10 | −0.027 | −0.024 | −0.074 |
Publisher’s Note: MDPI stays neutral with regard to jurisdictional claims in published maps and institutional affiliations. |
© 2022 by the authors. Licensee MDPI, Basel, Switzerland. This article is an open access article distributed under the terms and conditions of the Creative Commons Attribution (CC BY) license (https://creativecommons.org/licenses/by/4.0/).
Share and Cite
Liu, Q.; Su, Z.; Huang, W. Analysis of the Influencing Factors of the High-Quality Utilization of Territorial Space Based on the Perspective of Spatial Equilibrium: A Case Study of Hunan Province, China. Sustainability 2022, 14, 12818. https://doi.org/10.3390/su141912818
Liu Q, Su Z, Huang W. Analysis of the Influencing Factors of the High-Quality Utilization of Territorial Space Based on the Perspective of Spatial Equilibrium: A Case Study of Hunan Province, China. Sustainability. 2022; 14(19):12818. https://doi.org/10.3390/su141912818
Chicago/Turabian StyleLiu, Qing, Zengzeng Su, and Weihao Huang. 2022. "Analysis of the Influencing Factors of the High-Quality Utilization of Territorial Space Based on the Perspective of Spatial Equilibrium: A Case Study of Hunan Province, China" Sustainability 14, no. 19: 12818. https://doi.org/10.3390/su141912818
APA StyleLiu, Q., Su, Z., & Huang, W. (2022). Analysis of the Influencing Factors of the High-Quality Utilization of Territorial Space Based on the Perspective of Spatial Equilibrium: A Case Study of Hunan Province, China. Sustainability, 14(19), 12818. https://doi.org/10.3390/su141912818


