Abstract
In order to comprehensively evaluate the risk of bird strike at airports and effectively prevent the occurrence of bird strike events, this paper constructs the risk assessment index system of airport bird strike from five perspectives of “personnel-bird-equipment-environment-management”. For the purpose of maximizing variances, the Analytic Hierarchy Process (AHP) and the entropy weight method are combined and used to obtain the comprehensive weights. The five-element connection number of Set Pair Analysis (SPA) is introduced to establish the identical-discrepancy-contrary airport bird strike risk assessment model, and the risk trend is analyzed according to the partial connection number for each order. The experiment results show that the combined weighting method can minimize the weight deviation and demonstrate good accuracy in determining the weights of indicators at all levels. The established airport bird strike risk assessment model can reasonably predict the risk trend, which is significant for airport personnel to carry out bird strike prevention works.
1. Introduction
“Bird strike” refers to the safety accidents caused by the collision between birds and aircrafts at high speed in the air [1]. Flight accidents caused by bird strike not only cause huge economic losses to life, property, and national economy, but also seriously threaten aviation safety. This is an international problem which has plagued the aviation industry for a long time [2,3]. Therefore, it is the key to the current bird strike risk assessment research when considering the scientific and comprehensive paths to assess the risks of bird strike at airports, and to ensure flight safety.
Domestic and foreign scholars have continuously carried out bird strike risk assessment research from new perspectives. Reference [4] summarized the collision frequency between different types of birds and aircrafts, and evaluated the bird strike risk based on the bird strike database system constructed by nine airports in Australia. Reference [5] analyzed a large number of bird strike events over years, obtained the potential correlation of bird strike events based on the FP-Growth data mining algorithm, and judged the factors that led to the occurrence of bird strike through historical data. Reference [6] developed the Generalized Linear Models (GLMs) with binomial distribution in order to further quantify the risk degree of the airport bird strike events. Reference [7] developed a collision avoidance algorithm through the bird strike advisory system, and studied the efficacy of the system for air traffic control. Reference [8] calculated the risk of bird strike by predicting tracks of birds and esteeming the severity of a collision. They also evaluated the impacts on the safety and capacity of an airport when implementing the bird strike advisory system. Reference [9] conducted an investigation regarding the birds’ living and activity situation at an airport in North China, and constructed the ecological security pattern of high-risk birds by using landscape ecology theory. Reference [10] obtained the spatial distribution of the birds’ risk in different seasons by improving the feature importance assessment method, and found that the risk of bird strike has both seasonal and spatial differences. Reference [11] predicted the probability of bird strike through radar data from the US NEXRAD network. Reference [12] used the Geographically Weighted Regression (GWR) model, based on the least squares method, to evaluate the key factors of the density distribution of birds at an airport. This makes some contributions to the sustainable and safe development of the ecological environment near the airports. Reference [13] made a more reasonable prediction of bird strike risk factors based on Artificial Neural Network (ANN); however, this did not consider the special environmental impact factors of airports. Reference [14] used real-time bird status information from the airport bird detection radar to quantitatively analyze and calculate bird strike risks. However, this method is limited to specific bird detection radar equipment, without the universal characteristic. Reference [15] established a real-time bird strike risk assessment model based on associated factors, such as bird detection radar and flight data; however, the model was not dynamic, and the early established bird situation database was not considered. In addition, several common airport bird strike risk assessment methods also provide feasible ideas and methods for carrying out bird strike risk assessment according to the ecological works at airports and surrounding areas, mainly including the feature importance assessment method [16,17], grey fuzzy assessment method [18,19], and risk matrix assessment method [20,21].
Although domestic and foreign scholars have conducted relatively comprehensive research on bird strike risk assessments, furthermore, the mentioned methods can play a certain role in airport bird strike risk assessments. However, these cannot comprehensively evaluate certain and uncertain factors, and cannot make reasonable predictions on the risk trends. The set pair analysis method is a comprehensive analysis method to study the interaction between certainty and uncertainty of the system [22], which has been widely used in many fields, such as environmental assessment [23,24] and engineering technology [25,26]. The main contributions of this paper can be summarized as follows.
- (1)
- From the perspective of “personnel-bird-equipment-environment-management”, this paper established a risk assessment index system related to airport bird strike.
- (2)
- A variance maximization-based combined weighting method is designed by coupling subjective and objective factors, and has better accuracy in determining the weights of indicators at all levels.
- (3)
- Based on the SPA theory, the identical-discrepancy-contrary airport bird strike risk assessment model is established, and the risk trend of airport bird strike is predicted according to the partial connection numbers.
2. Materials and Methods
2.1. Set Pair Analysis and Connection Number
The set pair analysis method uses the connection number to effectively analyze the uncertainty factors in the system, whose core idea is to establish two sets with certain connections [27]. The characteristics of each set include terms identity, difference, and opposite. Take two sets as an example, shown in Figure 1.
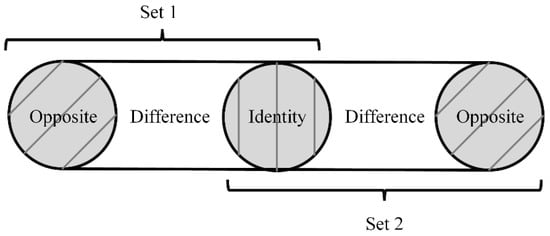
Figure 1.
The scheme of set characteristics for two sets.
In order to meet the multi-level complex requirements of the practical problems, the connection number can be extended to different levels. The multi-element connection number equation is given by Equation (1).
where μ is the connection number. a is the degree of identity, bt−2 are the degrees of difference, and c is the degree of opposite, which satisfies a + b1 + b2 + … + bt−2 + c = 1(t ≥ 3). The difference uncertainty coefficients are τt−2 and τt-2 ∈ [–1, 1] (t ≥ 3), and η is the opposite coefficient, which usually equals to –1.
When t = 3, the general expression for the connection number is shown as follows.
When t = 5, the five-element connection number equation can be obtained as follows.
2.2. Partial Connection Number
The partial connection numbers represent the trends of identities, differences, and opposites. When carrying out the risk assessments of bird strike at airports, the partial connection numbers of different orders can be introduced in order to analyze the trends of risks. The partial connection numbers of various orders are shown as follows [28].
The first-order partial connection number is
where .
The second-order partial connection number is
where .
The third-order partial connection number is
where .
The fourth-order partial connection number is
where .
When > 0, it presents an upward trend, which indicates that the risk is decreasing. When = 0, it indicates that the risk is constant. When < 0, it presents a downward trend, which indicates that the risk is increasing.
3. Airport Bird Strike Risk Assessment Model
The airport bird strike risk assessment process is shown in Figure 2. The corresponding index system is constructed. The risk assessment process also includes the corresponding levels’ divisions of the airport bird strike risks, the indicators’ weights determination, the identical-discrepancy-contrary airport bird strike risk assessment model construction, and the situation and trend of the risk analysis.
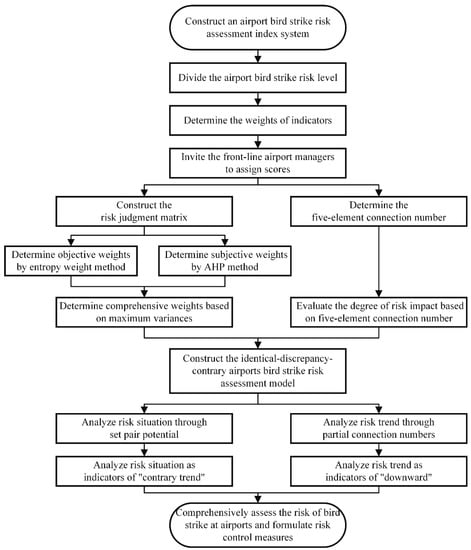
Figure 2.
Flow chart for assessing airport bird strike risk.
3.1. Airport Bird Strike Risk Assessment Index System and Risk Classifications
As References [13,19,29] analyzed, the hierarchical structure of the airport bird strike risk assessment index system includes a target layer, criterion layer, and indicator layer, respectively. First, the ultimate target layer is the airport bird strike risk assessment. Second, the criterion layer includes five factors that affect the airport bird strike risks: personnel factors, bird factors, equipment factors, environmental factors, and management factors. Finally, the indicator layer is mainly refined based on the key points of the criterion layer. A total of 22 secondary indicators with typical representatives are selected as shown in Figure 3.
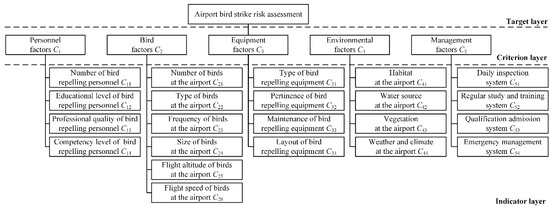
Figure 3.
Airport bird strike risk assessment index system structure.
According to the “Guidelines for the Precaution of Common Birds in Civil Airports” (AC-140-CA-2010-1), “Measures for the Precaution of Bird Strike and Animal Intrusions in Transport Airports” (AP-140-CA-2022-02), “Guidelines for the Construction of Safety Management System (SMS) in Transport Airports” (AC-139/140-CA-2019-3), and “Catalogues of Dangerous Bird Species for the Precaution Bird Strike Aircrafts in Transport Airports” (AC-140-CA-2022-01), the airport bird strike risks are divided into 5 levels: Level I (lower), Level II (low), Level III (medium), Level IV (high), and Level V (higher) as shown in Table 1.

Table 1.
Risk level evaluation standards for airport bird strike.
3.2. Indicators’ Weights Determination Method
The existing index weight calculation methods have their own advantages and disadvantages [30,31]. The entropy weight method is relatively objective. However, its application scope is limited [30]. The AHP method, as shown in Reference [31], cannot reflect the objectivity of the calculation results. Therefore, inspired by the maximum variance introduced in Reference [32], the methods mentioned above are combined to construct the linear programming model.
where xij are the normalization results of the elements of the risk judgment matrix Z, which can be calculated by Equation (9), and is the arithmetic mean of xij, that is . The risk judgment matrix Z can be constructed by the nine-scale method as shown in Table 2. Both α and β are linear positive coefficients that satisfy ; Uj are the objective weights determined by the entropy weight method and calculated by Equations (10) and (11); Vj are the subjective weights determined by AHP and calculated by Equations (12)–(14).
Table 2.
Scales and meanings of the nine-scale method.
The entropy weights Hj are determined by Equation (10).
The objective weights Uj are calculated by Equation (11).
A consistency test is carried out on the risk judgment matrix Z, and the consistency indicator is set as CI.
where is the largest eigenvalue of the judgment matrix Z, and n is the order of the judgment matrix Z.
The consistency ratio CR is determined by Equation (13).
The value of mean consistency index RI is determined by the different orders of the judgment matrix Z, as shown in Table 3. When CR < 0.1, the judgment matrix Z conforms to the consistency test and is regarded as a reasonable judgment matrix; otherwise, the judgment matrix Z needs to be adjusted.
Table 3.
RI values under different orders.
The subjective weights Vj are calculated by Equation (14).
Lagrangian function is constructed, as shown in Equation (15), to solve the optimization problem.
where δ is the Lagrangian multiplier. The partial derivative of L(α, β, δ) is calculated with respect to the linear coefficients α, β, and the multiplier δ, and it is set at 0 as shown in Equations (16)–(18).
The linear coefficients α and β are expressed as follows.
Equations (19) and (20) are substituted into Equation (8) to obtain W0 = (W01, W02, …, W0v), and W0 is normalized to obtain the final comprehensive weights matrix W = (W1, W2, …, Wv).
3.3. The Identical-Discrepancy-Contrary Airports Bird Strike Risk Assessment Model
After determining the comprehensive weights W of each indicator, Equation (21) is used in order to estimate the impact of each indicator on the airport bird strike risk assessment.
where Rs represents the risk degree of the evaluation indicator, Ns represents the number of experts who divide the indicator into the corresponding risk level s, and N is the total number of experts.
The identical-discrepancy-contrary airports bird strike risk assessment model is established.
where W is the comprehensive weight coefficients matrix, R is the identical-discrepancy-contrary matrix, and ET is the identical-discrepancy-contrary coefficients vector. The meaning of the specific parameters is shown in Table 4.
Table 4.
Meaning of model parameters and the corresponding risk levels.
3.4. Set Pair Potential Analysis
To some extent, the set pair potential reflects the dynamic evolutionary trends of the two sets including the same, balanced, and contrary trends. The function is expressed by Equation (23).
When the set pair potential value is greater than 1, it represents the “same trend”, indicating that the risk of the assessment indicator is low. When the set pair potential is 1, it represents the “balanced trend”, indicating that the risk of the assessment indicator is medium. When the set pair potential is less than 1, it represents the “contrary trend”, indicating that the risk of the assessment indicator is high. Furthermore, the airport managers must take certain risk control measures to transmit the set pair potential to the “balanced trend” in order to achieve the “same trend”. Table 5 shows the classifications of set pair potentials derived from Reference [33], which are associated with the set pair potential analysis in this paper.
Table 5.
Classification of set pair potential.
4. Case Study
Taking an airport in North China as an example, the airport managers coming from the flight area departments were invited to score the indicators. The airport is located in the northeastern part of the North China Plain and faces the Bohai Sea in the east. In addition, the airport is located in the East Asian–Australian Flyway, one of the word’s nine major bird migration routes, which is an important stopover for the north–south migration of birds in China. The surrounding environment of the airport is mainly composed of large urban areas, villages, and farmland. The habitats in the airport flight area are mainly grasslands, buildings, boundary areas, ponds, and drainage channels. Twenty selected complete surveys were used to build the identical-discrepancy-contrary airports bird strike risk assessment model, which is designed according to the indicators as shown in Figure 3. SPSS (Statistical Product Service Solutions) was used to test the reliability of the survey data. The corresponding Cromabach Alpha coefficient is 0.925, which indicates that the reliability of the data is high. Furthermore, it is demonstrated that the airport bird strike risk index system established in this paper is reasonable.
4.1. Weights of Evaluation Indicators Calculation
Taking the criterion layer indicators C1, C2, C3, C4, and C5 as examples, the scores of five experts are listed first. The objective weights U are calculated by Equations (10) and (11), while the subjective weights V are calculated by Equations (12)–(14). The linear coefficients’ α and β values can be obtained by Equations (19) and (20), and the results are listed in Equation (24). Table 6 shows the results of the scoring of criterion layers and the weights calculation.
Table 6.
Scoring and weights calculation results of criterion layers.
The weight values, as shown in Table 6, are plotted in Figure 4. Figure 4 shows that the values of comprehensive weights W are located between the objective weights U and the subjective weights V. This indicates that the designed combined weighting method weakens the deviation degree of some indicators of the entropy weight method. Furthermore, it reduces the subjective influence of the AHP method, so that the calculation results have better accuracy.
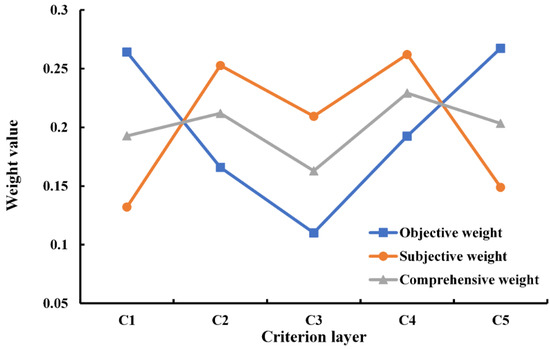
Figure 4.
Comparison chart of three weight values for the criterion layers.
Similarly, the weights of each indicator are determined, and the results are shown in Table 7.
Table 7.
Weights for each indicator.
4.2. Risk Situations and Trends Analysis
The identical-discrepancy-contrary airports bird strike risk assessment model is constructed from Equation (22), with the weights of each indicator calculated above. The partial connection numbers for different orders are calculated by Equations (4)–(7). The set pair potential analysis results are shown in Table 8 and Table 9.
Table 8.
Five-element connection numbers and first-order partial connection numbers.
Table 9.
Partial connection numbers of the second, third, and fourth orders.
4.3. Results Analysis
- (1)
- Table 7 shows that the indicators “bird factors C2” and “environmental factors C4” have greater weights among the criterion layers, which have a higher degree of impact on the airport bird strike risk. The indicator layer indicators “number of bird-repelling personnel C11”, “types of birds at the airport C22”, “maintenance of bird-repelling equipment C33”, “weather and climate at the airport C44”, and “daily inspection system C51” have relatively large weights, indicating that these factors are important reasons for the occurrence of airport bird strike events.
- (2)
- Table 8 shows that the five-element connection number of airport bird strike risk is μ = 0.14 + 0.25τ1 + 0.19τ2 + 0.24τ3 + 0.17η, and its set pair potential calculated by Equation (23) is 0.82. It locates at contrary trend level 223, indicating that the risk is high. In addition, the risk situations of each criterion layer indicator are shown as follows. “personnel factors C1” locates at same trend level 73, “bird factors C2” locates at contrary trend level 241, “equipment factors C3” locates at contrary trend level 169, “environmental factors C4” locates at same trend level 61, and “management factors C5” locates at contrary trend level 223. Among the 22 indicator layer indicators, 8 factors have the same trend, 4 factors have the balanced trend, and 10 factors have the contrary trend. The number of the contrary trend factors is slightly more than that of the same trend factors.
- (3)
- Table 9 shows that the first, second, and third-order partial connection numbers all locate in a downward trend, indicating that the risk trend is increasing. The fourth-order partial connection number locates in an upward trend, indicating that the risk trend is decreasing. This demonstrates that the airport bird strike risk has a dynamic trend. Overall, the indicators can be divided into five types, as shown in Table 10, where “↑” indicates that the partial connection number locates in an upward trend, “↓” indicates that the partial connection number locates in a downward trend, and “—” indicates that the partial connection number locates in a constant state. It is worth noting that “competency level of bird-repelling personnel C14”, “number of birds at the airport C21”, “frequency of birds at the airport C23”, “habitat at the airport C41”, “water source at the airport C42”, and “emergency management system C54” are strong contrary factors. Therefore, when dealing with bird strike at the airports, we should first pay attention to indicators C14, C21, C23, C41, C42, and C54, then indicators C11, C24, C25, C26, C31, C34, C44, C52, and C53, then indicators C13, C22, C22, C32, and C33, and finally, indicators C12, C43, and C51.
Table 10. Risk classification of each indicator.
- (4)
- When considering the strong contrary factors mentioned above, the airport managers should build up the professional team, form a cooperation system between professional talents and experienced talents, set up a high-level bird strike prevention team, and carry out the bird-repelling work efficiently. In terms of equipment, the airport managers should strictly conduct regular inspections and maintenance of various types of bird-repelling equipment, and ensure the layout is prioritized in significant areas for bird strike prevention, such as runways, taxiways, and aircraft takeoff or landing directions. It is suggested that the linkage use of all kinds of bird-repelling equipment be strengthened, and that the bird-repelling work be carried out from multiple dimensions in terms of hearing, vision, smell, and physical interception. In addition, the airport managers should establish an emergency management system according to the characteristics of the local data and information on birds, and should also improve the other working mechanisms, such as airport bird information notifications, navigation notices, and flight dynamic adjustments. Furthermore, the airport managers ought to establish a coordination mechanism with the local governments and carry out management of the ecological environment around the airport, such as bird habitats, water sources, and farming land. Therefore, the number and frequency of birds flying around the airport can also be reduced. As a result, the threat of bird strike to flight safety is reduced to some extent. In the end, the airport managers should prepare to prevent danger and focus on the factors for the contrary trend, so as to minimize the risk of airport bird strike.
5. Conclusions
There are many factors that influence bird strike events, but few previous studies have focused on certain and uncertain factors of bird strike risk. This paper evaluates airport bird strike risk based on the SPA model, from a fresh perspective. Guided by the SPA theory, this study analyzes the risk factors of airport bird strike, constructs an airport bird strike risk assessment index system from the perspective of “personnel-bird-equipment-environment-management”, and establishes the identical-discrepancy-contrary airport bird strike risk assessment model. In addition, inspired by the maximum variance idea, an indicators’ weights determination method is designed by coupling subjective and objective factors in order to calculate the weights of each indicator.
Taking an airport in North China as an example, the results of the study indicate that the proposed model in this paper can, on one hand, evaluate the risk of bird strike; on the other hand, it can analyze the risk trend of bird strike. Finally, it can achieve static and dynamic assessments for the risk of bird strike at airports. Furthermore, the method developed in this paper will be able to provide a data reference for airport managers to reduce the airport bird strike risk, which is significant for airport personnel to carry out bird strike prevention works.
In this study, the airport bird strike risk assessment index system only considers five factors; however, all kinds of detailed factors should also be taken into consideration. This will be improved in future research. Aiming at promoting sustainable development of airport security, we do hope that our approach can be applied to different case study airports.
Author Contributions
Conceptualization, R.W. and Q.Z.; methodology, R.W. and Q.Z.; software, Q.Z.; validation, R.W. Q.Z. and H.S.; formal analysis, Q.Z. and X.Z.; investigation, Q.Z., X.Z. and Y.W; resources, R.W.; data curation, X.Z. and Y.W.; writing—original draft preparation, R.W. and Q.Z.; writing—review and editing, R.W. and H.S.; visualization, Q.Z. and X.Z; supervision, R.W. and H.S.; project administration, R.W. and H.S.; funding acquisition, R.W. and H.S. All authors have read and agreed to the published version of the manuscript.
Funding
This research was funded by Civil Aviation University of China Graduate Research and Innovation Projects, grant number 2021YJS024.
Institutional Review Board Statement
Not applicable.
Informed Consent Statement
Not applicable.
Data Availability Statement
Not applicable.
Conflicts of Interest
The authors declare no conflict of interest.
References
- Metz, I.C.; Ellerbroek, J.; Muhlhausen, T.; Kugler, D.; Hoekstra, J.M. The Bird Strike Challenge. Aerospace 2020, 7, 26. [Google Scholar] [CrossRef]
- Wu, Q.; Tang, S.X.; Le, G. Study on ecological prevention and control of birdstrike accident disasters at the airports. J. Saf. Sci. Technol. 2006, 1, 40–44. [Google Scholar]
- Ning, H.S.; Liu, W.M.; Li, J.; Zhao, X.R. Research on Radar Avian Detection for Aviation. Acta Electron. Sin. 2006, 34, 2232–2237. [Google Scholar]
- Shaw, P.; McKee, J. Risk assessment: Quantifying aircraft and bird susceptibility to strike. In Proceedings of the 28th International Bird Strike Committee Meeting, Brasilia, Brazil, 24–28 November 2008. [Google Scholar]
- Jia, M.; Shao, Q.; Zhang, J.S. Correlation analysis on the likely civil aviation bird strike events based on the FP-Growth algorithm. J. Saf. Environ. 2016, 16, 110–114. [Google Scholar] [CrossRef]
- Coccon, F.; Zucchetta, M.; Bossi, G.; Borrotti, M.; Torricelli, P.; Franzoi, P. A Land-Use Perspective for Birdstrike Risk Assessment: The Attraction Risk Index. PLoS ONE 2015, 10, 16. [Google Scholar] [CrossRef]
- Metz, I.C.; Ellerbroek, J.; Muhlhausen, T.; Kugler, D.; Kern, S.; Hoekstra, J.M. The Efficacy of Operational Bird Strike Prevention. Aerospace 2021, 8, 17. [Google Scholar] [CrossRef]
- Metz, I.C.; Ellerbroek, J.; Muhlhausen, T.; Kugler, D.; Hoekstra, J.M. Analysis of Risk-Based Operational Bird Strike Prevention. Aerospace 2021, 8, 32. [Google Scholar] [CrossRef]
- Rong, Y.Y.; Wang, C.Y.; Deng, W.; Peng, S.; Mao, G.Z.; Mo, X.Q. Landscape ecology approach to the prevention and control of airport bird strike. Acta Ecol. Sin. 2021, 42, 8939–8952. [Google Scholar] [CrossRef]
- Shi, Z.F.; Zhou, Y.; Shao, Q. Risk assessment of bird strike based on airport environment and flight procedures. Bull. Sci. Technol. 2021, 37, 120–125. [Google Scholar] [CrossRef]
- Nilsson, C.; La Sorte, F.A.; Dokter, A.; Horton, K.; Van Doren, B.M.; Kolodzinski, J.J.; Shamoun-Baranes, J.; Farnsworth, A. Bird strikes at commercial airports explained by citizen science and weather radar data. J. Appl. Ecol. 2021, 58, 2029–2039. [Google Scholar] [CrossRef]
- Shao, Q.; Zhou, Y.; Zhu, P.; Ma, Y.; Shao, M.X. Key Factors Assessment on Bird Strike Density Distribution in Airport Habitats: Spatial Heterogeneity and Geographically Weighted Regression Model. Sustainability 2020, 12, 7235. [Google Scholar] [CrossRef]
- Liu, G.G.; Yang, Y.M.; Liu, B.; Zhong, D.Y.; Yang, S.Q. Prediction model of the bird strike in the airport sphere by using the artificial neural network. J. Saf. Environ. 2020, 20, 416–422. [Google Scholar] [CrossRef]
- Chen, W.S.; Wan, J.; Li, J. Bird strike risk assessment with airport avian radar data. J. Beijing Univ. Aeronaut. Astronaut. 2013, 39, 1431–1436. [Google Scholar] [CrossRef]
- Lopez-Lago, M.; Casado, R.; Bermudez, A.; Serna, J. A predictive model for risk assessment on imminent bird strikes on airport areas. Aerosp. Sci. Technol. 2017, 62, 19–30. [Google Scholar] [CrossRef]
- Wu, X.; Du, J.; Li, X.J.; Liao, W.B. Avian community structure and bird strike prevention measures at jiangbei airport in Chongqing. Chin. J. Ecol. 2015, 34, 2015–2024. [Google Scholar] [CrossRef]
- Liu, Y.; Xu, H.R.; Yuan, H.; He, B.; Zhao, S.L.; Duo, L.A. Bird community structure and diversity at Tianjin binhai international airport. Chin. J. Ecol. 2017, 36, 740–746. [Google Scholar] [CrossRef]
- Wang, J.K.; Ning, H.S.; Chen, W.S.; Li, J.; Wan, J.; He, W. Airport Bird-strike Risk Assessment Model with Grey Clustering Evaluation Method. Chin. J. Electron. 2012, 21, 409–413. [Google Scholar]
- Qiao, L.; Zhang, L. Effectiveness evaluation of airport bird strike prevention system. J. Civ. Aviat. Univ. China 2014, 34, 55–58. [Google Scholar]
- Allan, J. A heuristic risk assessment technique for birdstrike management at airports. Risk Anal. 2006, 26, 723–729. [Google Scholar] [CrossRef]
- Hu, Y.Y.; Xing, P.; Yang, F.; Feng, G.; Yang, G.S.; Zhang, Z.W. A birdstrike risk assessment model and its application at Ordos Airport, China. Sci. Rep. 2020, 10, 7. [Google Scholar] [CrossRef]
- Zhao, K.Q. Disposal and description of uncertainties based on the set pair analysis. Inf. Control 1995, 3, 162–166. [Google Scholar]
- Wu, M.M.; Ge, W.; Li, Z.K.; Wu, Z.N.; Zhang, H.X.; Li, J.J.; Pan, Y.P. Improved Set Pair Analysis and Its Application to Environmental Impact Evaluation of Dam Break. Water 2019, 11, 821. [Google Scholar] [CrossRef]
- Zou, Q.; Zhou, J.Z.; Zhou, C.; Song, L.X.; Guo, J. Comprehensive flood risk assessment based on set pair analysis-variable fuzzy sets model and fuzzy AHP. Stoch. Environ. Res. Risk Assess. 2013, 27, 525–546. [Google Scholar] [CrossRef]
- Yan, F.; Xu, K.L. A set pair analysis based layer of protection analysis and its application in quantitative risk assessment. J. Loss Prev. Process Ind. 2018, 55, 313–319. [Google Scholar] [CrossRef]
- Yue, R.T.; Han, M. Diagnosis of safety operation state for ATC position based on four diagnostic methods. China Saf. Sci. J. 2021, 31, 52–59. [Google Scholar] [CrossRef]
- Kumar, K.; Garg, H. Connection number of set pair analysis based TOPSIS method on intuitionistic fuzzy sets and their application to decision making. Appl. Intell. 2018, 48, 2112–2119. [Google Scholar] [CrossRef]
- Shi, Z.J.; Wang, H.W.; Wang, X. Risk state evaluation of aviation maintenance based on multiple connection number set pair analysis. Syst. Eng. Electron. 2016, 38, 588–594. [Google Scholar]
- Li, X.J.; Zhou, C.Q.; Du, J.; Huang, Y.; Ming, X.B.; Wu, X.; Zheng, J.P. Characteristics of bird strike and prevention system building in airport. Sichuan. J. Zool. 2018, 37, 22–29. [Google Scholar]
- Xu, H.S.; Ma, C.; Lian, J.J.; Xu, K.; Chaima, E. Urban flooding risk assessment based on an integrated k-means cluster algorithm and improved entropy weight method in the region of Haikou, China. J. Hydrol. 2018, 563, 975–986. [Google Scholar] [CrossRef]
- Lyu, H.M.; Zhou, W.H.; Shen, S.L.; Zhou, A.N. Inundation risk assessment of metro system using AHP and TFN-AHP in Shenzhen. Sust. Cities Soc. 2020, 56, 14. [Google Scholar] [CrossRef]
- Sun, Y.; Bao, X.Z. A new combination weighting method and its application based on maximizing deviations. Chin. J. Manag. Sci. 2011, 19, 141–148. [Google Scholar] [CrossRef]
- Chen, K.; Cheng, Q.R.; Pan, W.J. Evaluation of the operation risk level with the small and medium sized airports based on the set pair analysis. J. Saf. Environ. 2019, 19, 743–753. [Google Scholar] [CrossRef]


Publisher’s Note: MDPI stays neutral with regard to jurisdictional claims in published maps and institutional affiliations. |
© 2022 by the authors. Licensee MDPI, Basel, Switzerland. This article is an open access article distributed under the terms and conditions of the Creative Commons Attribution (CC BY) license (https://creativecommons.org/licenses/by/4.0/).