Abstract
The greenhouse gas (GHG) emission mandate on jet fuel requires a gradual reduction in the fuel’s GHG emissions, up to 50%, by 2050. For this reason, the demand for bio-jet fuel blended with conventional petroleum-derived jet fuel will increase. In order to meet the quality requirement of blended fuels (ASTM D7566), modeling that can predict the correlation between properties is required. Our aim was to predict the low-temperature properties using the distillation profile results obtained from Simulated Distillation (SIMDIS) according to the carbon number and chemical compositions of bio-jet fuel through correlation and regression analysis. We used hydroprocessed ester and fatty acid (HEFA) bio-jet fuel and hydrocarbon reagents that included C8, C10, and C12 carbons and five main families of hydrocarbons for blended jet fuel. This study shows an overall trend for each component, indicating that the distilled volume fraction is more affected than the carbon number. In the case of the freezing point, by composition, n-paraffin and naphthene have regression coefficients of more than 0.85 for the 50% and 60% recovery temperatures, respectively. In terms of carbon number, the C8 sample has a significant regression coefficient for the 40% recovery temperature, and C10 has a significant regression coefficient for the initial boiling point (IBP) and 10% recovery temperature. In the case of kinematic viscosity, by composition, the regression coefficient is significant for the 20% to 40% recovery temperatures. For naphthene, the kinematic viscosity exhibited no relationship with carbon number. This information can be utilized to determine the blended ratio of bio-jet fuel and conventional jet fuel in newly certified or commercial applications.
1. Introduction
Globally, major countries are promoting carbon neutrality declarations and related policies. In doing so, the main goal is to establish sustainable achievement plans in various fields, such as infrastructure, automobiles, architecture, electric power, and clean energy, and to minimize carbon emissions by 2030 through carbon reduction technology development [1,2]. Prior to the coronavirus pandemic in 2019 (COVID-19), the air-transportation industry was growing at an annual 5.4% market share; since COVID-19, in terms of commodity value, more than 35% of world trade has been transported by air [3]. Furthermore, fuel consumption in the aviation sector increased from 341 billion liters to 368 billion liters in one year [4]. Consequently, carbon dioxide (CO2) emissions by the aviation industry have increased by 3%. In the case of civil aircraft, as of 2019, CO2 emissions have increased by ≈600 million tons, which is estimated to be 88 g/km*person [5]. The aviation industry is also aware of CO2 emission reduction for sustainable growth, and accordingly, measures to reduce carbon footprint, including reducing CO2 emissions by 50% compared to 2005 emissions by 2050, were implemented by the International Air Transport Association (IATA) [6]. In March 2020, the test-operation phase of the International Civil Aviation Organization (ICAO) Carbon Offsetting and Reduction Scheme for International Aviation (CORISA) system for carbon reduction in the aviation sector was launched and is now in its second phase [7]. In particular, various methodologies have been proposed in the field of sustainable fuels, such as regulating the reduction of lifecycle emission standards toward fuels produced from biomass that do not become carbon stock by at least 10% through the selection of CORSIA eligible fuel. At the national level, it is necessary to actively participate in the preparation, implementation, and settlement for this purpose [8].
To reduce carbon in the aviation industry, four pillar strategies (aircraft structural technology, new route development, GHG trading system, and used alternative fuel) are being promoted. Using alternative fuels is an important part of competitive and usable carbon reduction in fuel costs, which account for 24.2% of the aviation industry’s operating costs [9]. Since aviation turbine fuel must be supplied on a drop-in basis, owing to the properties of aviation turbine fuel, redesigning the structure and engine of an existing aircraft is not easy. Efforts to develop a sustainable aviation fuel (SAF), with having a similar chemical composition and physicochemical properties as that of conventional aviation turbine fuel, are currently being made [1]. In 2020, 40 million liters of SAF, equivalent to 0.015% of total aviation turbine fuel production, were produced worldwide. As CO2 emissions from aviation comprise 13% of the total transport, production is expected to continue to increase in accordance with the GHG reduction policy [10].
The basic concept of SAF is to produce crude oil using various feedstocks through appropriate treatment and conversion in order to maintain the composition of the existing hydrocarbon aviation turbine fuel [6]. Feedstocks include coal, natural gas, and biomass, but coal and natural gas refer to unsustainable raw materials. In addition, the SAF composition can be adjusted by meeting the quality standards. For example, to keep the specific energy density at a minimum of 42.80 MJ/kg, the oxygen content of aviation turbine fuel should be limited, or the freezing point should be adjusted to −47 °C to minimize the long-chain linear alkanes and limit the short-chain alkanes, and the flash point must be at least 38 °C [11]. The feedstock used to produce bio-jet fuel is largely divided into sugars, starches, triglycerides, and lignocelluloses. Different feedstocks have different pretreatment processes to produce crude oil. First, sugars and starches are converted into bio-jet fuel by using biochemical processes such as alcohol-to-jet, hydroprocesses, and synthetic iso-paraffin raw processes through microbial conversion using sugar cane, sweet potato, etc., which contain sugar and glucose. Second, triglycerides are mainly produced from palm oil, vegetable oil extracted from microalgae, black-soldier-fly larvae, and animal oil extracted from free fatty acids (FFAs) to produce bio-jet fuel through hydrodeoxygenation, hydroisomerization, and hydrocracking processes. Lastly, lignocellulose is used to produce bio-jet fuel through thermochemical treatments, such as pyrolysis and the Fisher–Tropsch process [7,12]. These bio-jet fuels can be used only after certification of each raw material and process [13]. As of 2021, a total of seven processes were registered in ASTM D7566 [14], including Fischer–Tropsch hydroprocessed synthesized paraffinic kerosene (FT-SPK) [15,16], hydroprocessed esters and fatty acids (HEFA) [17,18,19], synthesized iso-paraffins (SIP) [20,21], FT Synthesized Paraffinic Kerosine plus Aromatics (FT-SPK/A) [22], alcohol-to-jet synthetic paraffinic (ATJ) [19,23], catalytic hydrothermolysis jet kerosene (CHJ), and hydroprocessed hydrocarbons, esters, and fatty acids (HC-HEFA) [24].
Among these processes, the most commercialized is the HEFA-processed bio-jet fuel, which is described in annex A2 of ASTM D7566. Bio-jet fuel produced through the HEFA process exhibits similar characteristics to general petroleum products but is known to have advantages such as high cetane number, low aromatic/sulfur content, and low GHG emissions. The HEFA process converts vegetable oils, such as triglycerides, from biomass into bio-jet fuel through a catalytic chemical process. The detailed characteristics are as follows: first, the triglyceride structure contains three fatty acids attached to a glycerol unit; triglycerides are currently being converted to biodiesel (fatty acid methyl esters) through transesterification. However, since triglyceride, a molecule containing oxygen, has low thermal stability, problems may arise when they are used directly as aviation turbine fuel for internal combustion engines at a high concentration. In the HEFA process for bio-jet fuel manufacturing, to overcome these shortcomings of vegetable oil, a hydrotreating process in which triglycerides are converted to paraffin by hydrodeoxygenation, removing the double bonds and oxygen components, is first required [25].
For aviation turbine fuel, a group of characteristics (e.g., composition, volatility, fluidity, combustion, corrosion, thermal stability, contaminants, and additives) must be considered [26]. In particular, the fluidity properties, viscosity, and freezing point are considered preferentially owing to the extreme environment (low temperature, high altitude) of aviation turbine fuel. Lowering the temperature of the aviation turbine fuel has the impact of atomizing and crystallizing the fuel spray, changing the fluidity characteristics; the carbon distribution number of most aviation turbine fuel, including SAF, is C5~C16 and this carbon number affects the fluidity characteristics [27].
In general, studies have found that each property of aviation fuel has a relationship and is affected by carbon number and chemical compositions, and the typical freezing point is shown to have a 98% correlation through multiple linear regression (MLR) [28].
In this study, the relationship between the distillation profile obtained from SIMDIS (Simulated Distillation) data and the chemical components (families of hydrocarbons and carbon numbers) on the fluidity characteristics of bio-jet fuel was investigated. Consequently, the correlation between the freezing point and the kinematic viscosity was confirmed in a part of the distillation range of HEFA bio-jet fuel. When the result value and the predicted value were verified, it was judged that the freezing point could be predicted by the distillation profile, as shown in this study scheme in Figure 1. This approach allows a set of reference data to be established, suggesting an appropriate blended ratio when replenishing bio-jet fuel in actual flight.
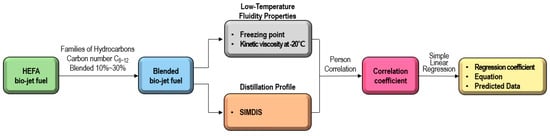
Figure 1.
Experimental procedure for the correlation and regression analysis of the distillation profile and fluidity properties for blended bio-jet fuel.
2. Materials and Methods
2.1. Materials and Reagents
In this study, we used HEFA bio-jet fuel (hereafter simply referred to as bio-jet fuel) produced from palm oil, as a raw material in Korea, using elemental processes such as hydrotreatment and upgrading at a laboratory scale (Institute for Advanced Engineering, IAE) [17]. The bio-jet fuel was composed of more than 45% C16:0 and C18:0. The bio-jet fuel production process consisted of hydrotreating, upgrading, and distillation, and 1 w/w% Pt/Al2O3 and 0.5 w/w% Pt/z-Yt were used as catalysts. The hydrotreating conditions were as follows: temperature, 385–400 °C; pressure, 40 bar; weight-hour space velocity, 2.0 h–1; and H2/feed ratio, 32 mol/mol. The upgrading conditions were as follows: temperature, 240–245 °C; pressure, 40 bar; weight-hour space velocity, 2.0 h–1; and H2/feed ratio, 16.8 mol/mol. The hydrotreatment process generates n-paraffin, the upgrading process produces iso-paraffin from palm oil, and the distillation and separation processes selectively obtain bio-jet fuel from the pretreatment oil [29]. The process configuration used in the hydrotreatment and upgrading process consisted of a raw material supply high-pressure pump, a hydrogen supply system, and a trickle-bed vertical reactor. The H2 supply line includes a preheater to allow these raw materials and H2 to reach a sufficient reaction temperature [18,19].
For the blended bio-jet fuel, 45 samples were prepared by blending 10%, 20%, and 30% n-paraffin, iso-paraffin, naphthene, aromatics, and olefins with carbon numbers of 8 (C8), 10 (C10), and 12 (C12) with the bio-jet fuel. In order to guarantee that each reagent possessed the desired carbon numbers, reagent grades of the following chemicals were used: n-octane (C8H18, Sigma-Aldrich, Saint Louis, MO, USA), n-decane (C10H22, Merck Millipore, Burlington, MA, USA), n-dodecane (C12H26, Sigma-Aldrich), 2,2,4-trimethylpentane (C8H18, Sigma-Aldrich), 2-methylnonane (C10H22, TCI Co., Ltd., Tokyo, Japan), 2,2,4,6,6-pentamethylheptane (C12H26, TCI), cyclooctane (C8H16, Sigma-Aldrich), decahydronaphthalene (C10H20, Sigma-Aldrich), cyclododecane (C12H24, TCI), ethylbenzene (C8H12, Sigma-Aldrich), butylbenzene (C10H14, Sigma-Aldrich), hexylbenzene (C12H18, TCI), 1-octene (C8H16, TCI), 1-decene (C10H20, TCI), and 1-dodecene (C12H24, TCI).
2.2. Method of Simulated Distillation
In this study, the relationship of the blended bio-jet fuel properties and composition was analyzed using SIMDIS. The test method was ASTM D2887, which is applicable to petroleum products and fractions having a final boiling point of 538 °C or lower at atmospheric pressure, as measured using this test method as shown Table 1 [30]. SIMDIS was measured by gas chromatography (GC-2010 plus, Shimadzu Co., Ltd., Kyoto, Japan), in which a BPX1-SIMD column (10 m × 0.53 mm inner diameter × 0.9 μm film thickness, max temperature of 400 °C) and flame ionization detector (FID) were employed. SIMDIS was programmed to set a helium carrier gas flow of 30 mL/min and oven temperature of 60–360 °C with a ramp rate of 35 °C/min. The injector was a programmed temperature vaporizer (PTV), which can be heated during analysis to a temperature of 200 °C to 360 °C at a ramp rate of 35 °C/min. The SIMDIS data were programmed into the LabSolutions Workstation software version 5.84 (Shimadzu Co., Ltd., Kyoto, Japan), and Microsoft Excel [31].

Table 1.
Chromatographic conditions for SIMDIS.
2.3. Method of Bio-Jet Fuel Base Properties and Low-Temperature Properties
The main properties of the bio-jet fuel and blended bio-jet fuel were analyzed according to ASTM D7566. For the analysis of the bio-jet fuel, twelve methods, including low-temperature properties, were performed to confirm the quality requirement of the bio-jet fuel for blended jet fuel. The freezing point and kinematic viscosity at −20 °C were also selected for the SIMDIS analysis. The freezing point was measured using a FZP 5G2S (Herzog Co., Ltd., Houston, TX, USA) via ASTM D 7153 [32], and the kinematic viscosity at −20 °C was measured using a manual kinematic viscosity tube via ASTM D 445 [33].
2.4. Method of HEFA Bio-Jet Fuel Components Analysis
In this study, bio-jet fuel chemical compounds were analyzed using GC×GC TOF/MS (Pegasus-IV system, LECO Co., Ltd., Saint Joseph, MI, USA). This was used with an HP-5 column (60 m × 0.25 mm inner diameter × 0.25 µm film thickness, max temperature of 320 °C) and programmed to set the purge flow at 3 mL/min, split ratio 100:1, split flow 200 mL/min, oven temperature 40 °C to 280 °C, ion source temperature 230 °C, mass range 35–600, and acquisition rate (spectra/second) 200. The classification and identification of compounds follows the National Institute of Standards and Technology and Wiley library [34].
2.5. Method of Correlation and Regression Analysis
In this study, Pearson correlation and linear regression were used to analyze the relationship between the low-temperature properties and SIMDIS distillation profile (IBP, 10~95% recovered and final boiling point (FBP)) of the blended bio-jet fuel. Pearson correlation (r) was used to explore the linear inter-correlations between the low-temperature properties and each recovered temperature of the SIMDIS distillation profile [35,36,37].
A positive value indicates a linear correlation between the two variables, while a negative value indicates that the two variables have an inversely proportional linear correlation [38,39]. A value closer to 0 signifies that there is no correlation between the two variables. The value of r lies between −1 and 1; a value closer to 1 has a stronger positive correlation, while a value closer to −1 has a stronger negative correlation, as shown in Figure 2. Between X and Y, r can be calculated using Equation (1).
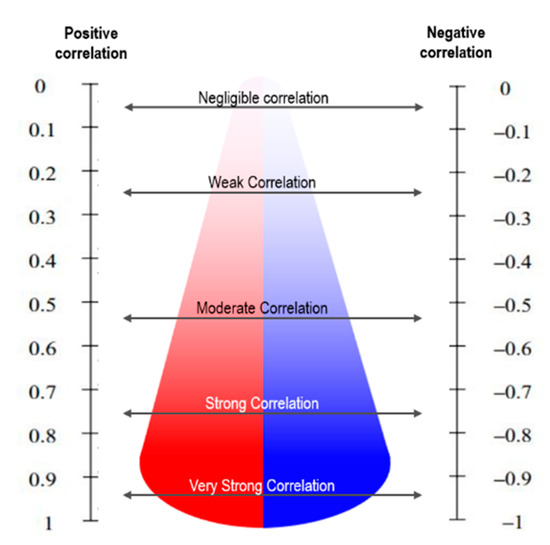
Figure 2.
Correlation coefficient description for interpretation.
Linear regression analysis includes simple linear regression analysis (SLR) and MLR analysis. For the characteristics with a clear correlation, the low-temperature properties can be calculated through simple linear regression, which is a measure of how well the estimated linear model fits the given data, as indicated by a regression coefficient (R2) close to 1. Therefore, it is possible to judge how much the prediction error will be reduced, and thus, infer the relationship between the SIMDIS result and low-temperature properties from Shimadzu LabSolutions and Microsoft Excel [40,41].
3. Results and Discussion
3.1. Base Properties and Components of Bio-Jet Fuel
In this study, bio-jet fuel produced by palm oil was evaluated according to the quality standards of ASTM D7566. Among these requirements are low acidity and low flash point. The quality standards for each process of bio-jet fuel differ, but those for blended fuels must follow ASTM D1655 [42]; therefore, so it is important to use fuels of suitable quality. Table 2 shows the details of the experimental results for the properties of bio-jet fuel [14].
Table 2.
Experimental results for the properties of bio-jet fuel.
The bio-jet fuel chemical compounds were analyzed using GC × GC TOF/MS. Following identification and classification, 100 peaks were matched, constituting five major families of hydrocarbons: 28% n-paraffin, 68% iso-paraffin, and 2% naphthene (i.e., the content of paraffinic is >98%). Almost no aromatics or olefins are present, thus the bio-jet fuel has a composition distribution very different from that of conventional jet fuel, which consists of ≈30% n-paraffin, ≈40% iso-paraffin, ≈25% naphthene, 25% aromatics, and ≈5% olefins. A more detailed analysis of the compounds revealed 8.74% tetradecane, 6.28% hexadecane, 5.04% 3-methyl-nonane, 4.74% 5-methyl-decane, and 3.88% dodecane. The chromatogram is shown in Figure 3, which color of the peaks shown from blue to red depending on the value of the compound area, and the main chemical compounds are listed in Table 3.
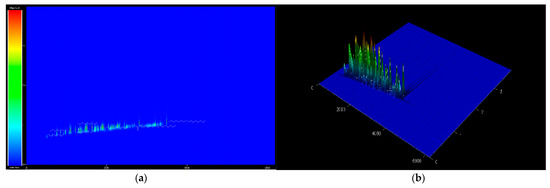
Figure 3.
GC × GC TOF MS chromatogram of bio jet fuel: (a) 2D and (b) 3D.
Table 3.
Main chemical compounds in bio-jet fuel.
The GC × GC TOF/MS analysis indicates that 95% of the bio-jet fuel contains compounds with carbon numbers distributed in the range of C8–C19. Therefore, after the carbon number was analyzed, it could be determined that bio-jet fuel has similar characteristics to the carbon number distribution (C8–C16) of kerosene-type jet fuel, and C15–C19 were suitably cracked during the upgrading process when made into bio-jet fuel. In addition, it was possible to select the reagent to be used [16]. In this study, C8, C10, and C12 were selected as the carbon numbers of the blended reagent. Figure 4 shows the carbon number distribution of the bio-jet fuel.
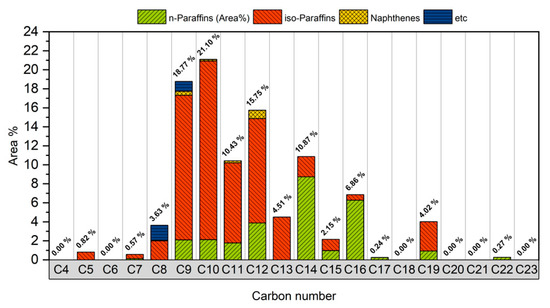
Figure 4.
Carbon number distribution of bio-jet fuel.
Five families of hydrocarbon compositions of the bio-jet fuel with suitable low-temperature properties were blended according to volume content, measured freezing point, and kinematic viscosity at −20 °C.
3.2. Result of Low-Temperature Properties in Blended Bio-Jet Fuel
The freezing point and kinematic viscosity of the bio-jet fuel of the blended samples for this study were −44.0 °C and 3.535 mm2/s, respectively, which satisfied the ASTM D7566 requirements. A sample was prepared by blending 10%, 20%, and 30% volume contents of the C8 reagents for each of the major families of hydrocarbons in the bio-jet fuel; the C10 and C12 components were prepared in a similar manner. The freezing point and kinematic viscosity of 45 samples at −20 °C were measured and are shown in Figure 5 and Figure 6, where the changes can be seen graphically for each carbon number and blended volume content.
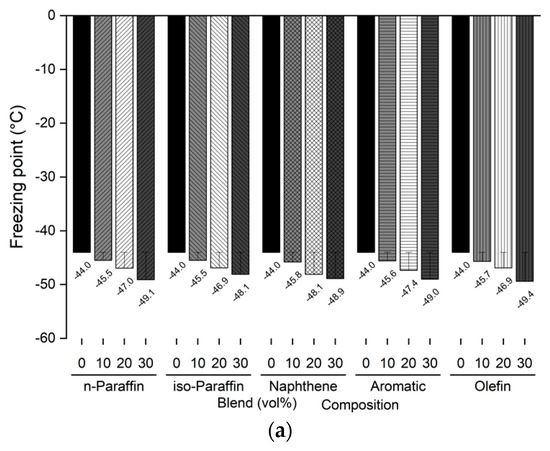
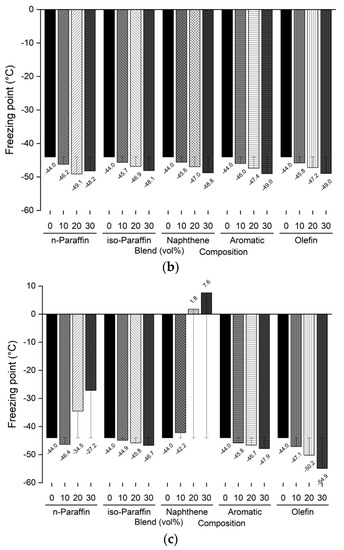
Figure 5.
Comparison of freezing points of blended bio-jet fuel: (a) C8, (b) C10, and (c) C12.
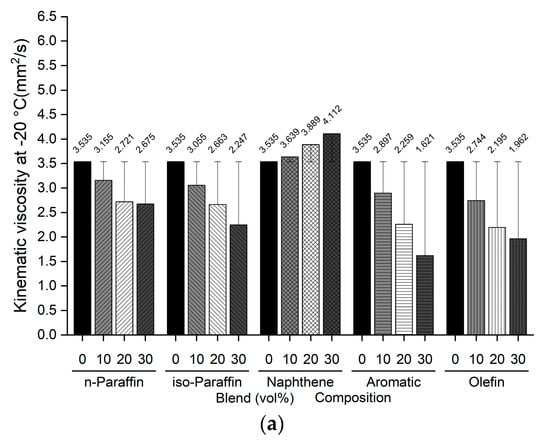
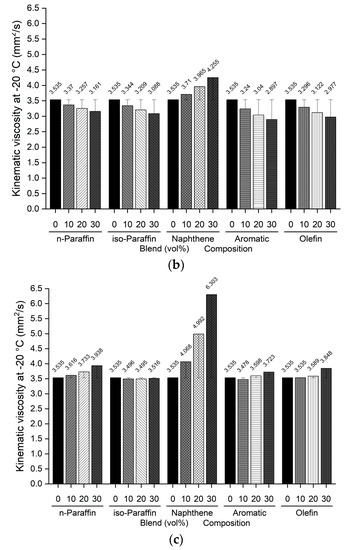
Figure 6.
Comparison of kinematic viscosity at −20 °C of blended bio-jet fuel: (a) C8, (b) C10, and (c) C12.
The freezing point is dependent on the chemical composition; in previous study results, it was found that the freezing point was lowered as the iso-paraffin was increased. [28,40]. However, it was found that the freezing point decreased as the chemical composition volume contents increased, except in the C12 samples. In the C8 samples, the freezing point of the chemical compositions decreased from −2.5 °C to a maximum of −5.1 °C as the blended volume content ratios increased; in the C10 samples, the freezing point decreased from −4.1 °C to −5.0 °C as the blending ratio increased, as it did for the C8 samples. However, in the C12 samples, the n-paraffin content was 10% at −46.4 °C, 20% at −34.5 °C, and 30% at −27.2 °C; the naphthene content was 10% at −42.2 °C and increased to 20% at 1.8 °C and 30% at 7.6 °C. The other chemical compositions decreased as the blended volume contents increased. In particular, the olefin content decreased to 30% by −10.9 °C compared with that at the initial freezing point. In addition, the C8 and C10 contents were close to the jet-fuel A-1 quality requirement (at −47 °C), except for C8 iso-paraffin. Even for C12, the aromatic and olefin contents could reach the A-1 quality requirement.
The kinematic viscosity at −20 °C indicates the relationship between the chemical composition of bio-jet fuel and its physical properties; in previous study results, it was found that the kinematic viscosity was higher as the iso-paraffin was increased [43]. In this work, all the blended bio-jet fuels had kinematic viscosities lower than the maximum limit, i.e., 8.0 mm2/s. In the C8 samples, the kinematic viscosity of the naphthene-blended volume content increased from 3.639 mm2/s to a maximum of 4.112 mm2/s; decreased to a maximum of 2.675 mm2/s, 2.628 mm2/s, and 2.343 mm2/s for n-paraffin, iso-paraffin, and olefins, respectively; decreased significantly to a maximum of 1.621 mm2/s for aromatics. In the C10 samples, the kinematic viscosity increased from 3.71 mm2/s to a maximum of 4.225 mm2/s for naphthene; and decreased to a maximum of 3.161 mm2/s for n-paraffin; decreased to a maximum of 3.088 mm2/s for iso-paraffin; decreased to a maximum of 2.997 mm2/s for olefins; decreased the most, to a maximum of 2.897 mm2/s, for aromatics. Finally, for the C12 samples, the kinematic viscosity at −20 °C increased in the following order: naphthene > n-paraffin > olefin > aromatic (except for iso-paraffin). Specifically, the kinematic viscosity increased significantly from 4.068 mm2/s to a maximum of 6.303 mm2/s for naphthene; increased to a maximum of 3.938, 3.848, and 3.723 mm2/s for n-paraffin, olefins, and aromatics, respectively; and decreased slightly, to 2.897 mm2/s, for iso-paraffin.
In addition, iso-paraffin exhibited the weakest relationship between the freezing point and kinematic viscosity at −20 °C. However, this is judged to have a negligible effect because the bio-jet fuel is mainly composed of naphthene, especially in the C12 samples.
Since the relationship between the freezing point and kinematic viscosity of the blended volume contents at −20 °C cannot be known by simple comparison, through statistical analysis with each effluent temperature of the distillation profile, which can know the hydrocarbon characteristics, must be conducted.
3.3. Distillation Profile of Blended Bio-Jet Fuel
The distillation profile of bio-jet fuel that forms the basis of the blended sample exhibited the following properties: 100.1 °C IBP, 140.0 °C at 10% recovery temperature, 186.7 °C at 50% recovery temperature, 253.2 °C at 90% recovery temperature, and 297.2 °C FBP. Furthermore, it is known from the previous studies that the distillation curves change according to the hydrocarbon classification components. Therefore, the distillation curve of 45 blended samples is an important variable for relationship analysis between low-temperature properties [44,45].
First, for the C8 samples, the recovery temperatures of all blended samples decreased from 20% to 80% compared to the bio-jet fuel. Additionally, the IBP decreased to a maximum of 14.5 °C for the iso-paraffin content and increased to a maximum of 16.5 °C for olefins. Second, in the C10 samples, compared to other carbon numbers, the recovery-temperature decrease interval and range were narrower, and the aromatic and naphthene contents increased before the 30% and 50% recovery temperatures for bio-jet fuel. In the case of the blended samples, the IBP was similar, and the recovery temperature increased in the range of 20–30%; after the 50–90% recovery temperature decreased. Lastly, for the C12 samples, the iso-paraffin content decreased before reaching the 30–90% recovery temperature. The contents of the other blended samples increased before the 90% recovery temperature. Figure 7 shows each carbon number distillation curve.
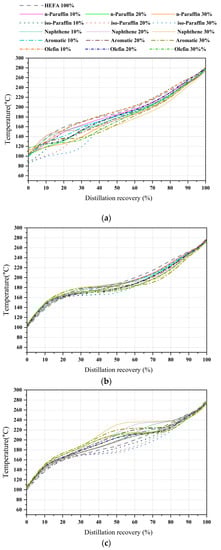
Figure 7.
Comparison of distillation curve of blended bio-jet fuel: (a) C8, (b) C10, and (c) C12.
The distillation profile changed in different ranges as the blended ratio of the contents was changed. Relationships were confirmed to exist between the 11 total distillation profiles and the IBP, recovery temperatures of 10%, 20%, 30%, 40%, 50%, 60%, 70%, 80%, 95%, and FBP; freezing point; and kinematic viscosity.
3.4. Correlation Analysis of Properties and SIMDIS of Bio-Jet Fuel
The distillation profiles and chemical components were measured using Pearson correlation, which is a simple linear regression method. A correlation coefficient greater than 0.7 indicates a strong positive correlation, while a coefficient less than −0.7 indicates a strong negative correlation [36].
The correlation analysis between the compositions and distillation profiles revealed that, for the n-paraffin content, the freezing point had a strong positive correlation with the 40% to 70% recovery temperatures and a strong negative correlation with the FBP; the correlation between the freezing point and 40% to 80% recovery temperature was strongly positive for the naphthene content. For the n-paraffin content, the kinematic viscosity at −20 °C showed a strong positive correlation with the 10% to 70% recovery temperature; a strong positive strong correlation existed between the IBP, and the 10% to 30% recovery temperature for the iso-paraffin content. A strong positive correlation was apparent between the 10%, and 40% to 60% recovery temperature for the naphthene content. For the aromatic content, a strong positive correlation existed between 10% to 60% recovery temperature, while a strong negative correlation existed between the FBP. Finally, for the olefin content, a strong positive correlation existed between the 10% to 50% recovery temperature, and a strong negative correlation was observed between the IBP and 95% recovery temperature.
The results of the correlation analysis of the carbon numbers and distillation profiles show that the freezing point had a much stronger positive strong correlation with the 30% to 80% recovery temperature for the for C8 fraction. For C10, there was a strong positive correlation between the 60% to 95% recovery temperature, and FBP, and a strong negative correlation between the IBP and the 10% and 20% recovery temperature. The kinematic viscosity at −20 °C was strongly and positively correlated with the 70% recovery temperature for the C12 fraction. Figure 8. shows diagrams displaying the correlation coefficients for the relationships between the recovery temperature, freezing point, and kinematic viscosity at −20 °C, depending on the composition and carbon number. A larger red circle indicates a strong positive correlation closer to 1, while a larger blue circle indicates a strong negative correlation closer to −1.
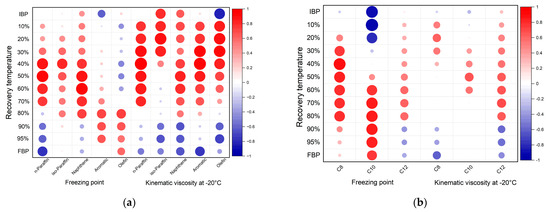
Figure 8.
Correlation coefficients of blended bio-jet fuel according to (a) composition and (b) carbon numbers.
Through Pearson correlation, the regression coefficients for the relationship between the kinematic viscosity and each recovery temperature, and those for the relationship between the freezing point and each recovery temperature, were determined. The regression coefficients for the bio-jet fuel and all the blended samples were low; however, when the regression coefficient was obtained by classifying the fuel in terms of composition and carbon number, valid results were obtained for a certain interval.
3.5. Regression Analysis and Validation of Properties Using SIMDIS for Bio-Jet Fuel
Before calculating the SLR, MLR was performed for the kinematic viscosity and 11 distillation profiles, as well as for the freezing point and 11 distillation profiles of 46 blended samples. The coefficients of determination were calculated to be 0.81414 and 0.7230, respectively, and the corresponding standard deviations were 0.388 mm2/s and 6.92 °C with significance values (F) of 7.27 × 10⁻⁹ and 3.23 × 10⁻³, respectively. Although these values are statistically significant, the analysis was deemed to be unreliable because it was out of the reproducibility range.
Through Pearson correlation analysis, correlation coefficients with a strong correlation were selected from each composition (variable 1) and the distillation profile (variable 2), or each carbon number (variable 1) and the distillation profile (variable 2), to calculate the coefficients of determination. Each equation was obtained through an SLR analysis.
For the regression analysis of the relationship between the composition and distillation profile, the coefficients of determination greater than 0.8 for the freezing point corresponded to 50% recovery temperature for n-paraffin and 60% recovery temperature for naphthene. The coefficients of determination greater than 0.8 for the kinematic viscosity at −20 °C were calculated at 30% to 40% recovery temperature for n-paraffin, 40% recovery temperature for iso-paraffin, 30% to 40% recovery temperature for aromatics, and 20% to 30% recovery temperature for olefins.
For the regression analysis of the relationship between the carbon number and distillation profile, the coefficients of determination greater than 0.8 for the freezing point were calculated at a 40% recovery temperature for C8, IBP, and a 10% recovery temperature for C10. The coefficient of determination for the kinematic viscosity at −20 °C is not shown because it did not exceed 0.8. Table 4 shows the five equations of the freezing point and seven equations of kinematic viscosity at −20 °C.
Table 4.
Simple linear regression analysis determined for model evaluation.
Based on the equations given in Table 4, each recovery temperature measured from the 46 samples of the bio-jet fuel was used to calculate the predicted data for the five freezing point equations and seven equations for the kinematic viscosity at −20 °C. The results were validated by comparison with the measured data. Figure 9 compares the measured data with the predicted data, and blue circles is the 46 samples of the bio-jet fuel [46].
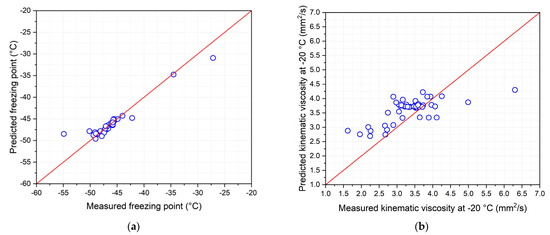
Figure 9.
Measured and predicted low-temperature fluidity properties: (a) freezing point and (b) kinematic viscosity at −20 °C.
The kinematic viscosity results at −20 °C show that the measured data and predicted data were not in good agreement. The standard deviation is 0.369 mm2/s, which is higher than the reproducibility of ±0.0154 mm2/s [34]. Valid results for the reproducibility were obtained using 11 samples, in which the bio-jet fuel showed a standard deviation of 0.1382 mm2/s.
As for the freezing point results, 38 out of 46 samples in which the measured data and the predicted data were similar had ±0.9 °C reproducibility, with freezing points from −34 °C to −50 °C [33]. The majority of the results were out of range for C10 naphthene 10%, 20%, and 30% blended samples and olefin 20% and 30% blended samples. Bio-jet fuel showed a standard deviation of 0.28 °C.
4. Conclusions
In this study, the relationship between the chemical components and low-temperature fluidity characteristics were evaluated using the distillation profiles generated by the SIMDIS gas chromatography experiments to elucidate the low-temperature properties of blended bio-jet fuel. As is known, The HEFA bio-jet fuel is highest in iso-paraffin content (≈68%) compared with the other chemical compositions; therefore, it is judged that the change in low-temperature properties owing to changes in iso-paraffin content is negligible. The kinematic viscosity and freezing point increase as the C12 n-paraffin content increases, unlike C8 and C10. In addition, C12 naphthene was affected by an increased freezing point, as and the other compositions contents increased, the freezing point decreased, and the kinematic viscosity also decreased, except for C12.
Subsequently, by classifying the sample components in terms of chemical components, content and carbon number, each equation for the low-temperature properties was calculated using SLR based on each distillation profile from the obtained SIMDIS data. Then, the measured data and predicted data were compared with the results calculated from each equation. In the first place, the reproducibility of the freezing point was more valid than the standard value, but it was difficult to calculate the freezing point outside the range of −34 to −50 °C. In particular, if the bio-jet fuel is not high in naphthenes or olefins with high carbon numbers, the freezing point can be predicted. In the second place, the predicted value of the kinematic viscosity was higher than the measured value by about 80%. As a result, the freezing point could determine the predicted values using five equations with IBP and 10%, 40%, 50%, and 60% recovery temperatures as variables; the kinematic viscosity could not determine predicted values within reproducibility.
To conclude, when blending bio-jet fuel with jet fuel, it is possible to determine a reasonable blend ratio that produces the low-temperature properties of conventional jet fuel. Hence, it will be necessary to acquire basic data for supplementary studies on the blend ratio of new bio-jet fuels before commercialization, including bio-jet fuels stipulated in ASTM D 7566, such as HEFA, ATJ, and FT-IPK. Finally, we encourage future research to find correlations between volatility, combustion, and compatibility, as well as low-temperature characteristics of bio-jet fuel.
Author Contributions
Conceptualization: H.J.; data curation, formal analysis, investigation: J.Y.P., M.O., and G.B.H.; methodology: H.J. and J.Y.P.; supervision: J.-K.K. and J.W.L.; validation: J.-K.K.; writing—original draft: H.J.; writing—review & editing: J.-K.K. and J.W.L. All authors have read and agreed to the published version of the manuscript.
Funding
This research was funded by the National Research Foundation of Korea (NRF), grant number 2020M1A2A2079804.
Institutional Review Board Statement
Not applicable.
Informed Consent Statement
Not applicable.
Data Availability Statement
Not applicable.
Acknowledgments
This work was supported by the National Research Foundation of Korea (NRF) grant funded by the Ministry of Science and ICT (2020M1A2A2079804) through Climate Change Response Technology Development Program.
Conflicts of Interest
The authors declare no conflict of interest.
Abbreviations
| ATJ | Alcohol-to-jet synthetic paraffinic |
| CHJ | Catalytic hydrothemolysis jet kerosene |
| CORISA | Carbon offsetting and reduction scheme for international aviation |
| FBP | Final boiling point |
| FFAs | Free fatty acids |
| FT-SPK | Fischer-tropsch hydrocessed synthesized paraffinic kerosene |
| FT-SPK/A | FT hydrocessed synthesized paraffinic kerosene plus aromatics |
| GHG | Greenhouse gas |
| HC-HEFA | Hydroprocessed hydrocarbons, esters and fatty acids |
| HEFA | Hydroprocessed esters and fatty acids |
| IATA | International air transport association |
| IBP | Initial boiling point |
| ICAO | International civil aviation organization |
| MLR | Multiple linear regression |
| SAF | Sustainable aviation fuel |
| SIMDIS | Simulated distillation |
| SIP | Synthesized iso-paraffins |
| SLR | Single linear regression |
References
- Cozzi, L.; Gül, T. Net Zero by 2050—A Roadmap for the Global Energy Sector; International Energy Agency: Paris, France, 2021. [Google Scholar]
- Park, Y.; Kang, G.; Jang, Y.; Kim, S.; Lee, H. The Direction and Implications of the International Community’s Carbon-Neutral Policy; Korea Institute for International Economic Policy: Sejong, Republic of Korea, 2021; Volume 1, pp. 1–15. [Google Scholar]
- International Air Transport Association. The Value of Air Cargo Make It Happen; International Air Transport Association: Montreal, QC, Canada, 2020. [Google Scholar]
- International Air Transport Association. Economic Performance of the Airline Industry; International Air Transport Association: Montreal, QC, Canada, 2019. [Google Scholar]
- Teter, J.; Kim, H. Tracking Report; International Energy Agency: Paris, France, 2022. [Google Scholar]
- International Civil Aviation Organization. Annex 16: Environmental Protection, Carbon Offsetting and Reduction Scheme for International Aviation; International Civil Aviation Organization: Montreal, QC, Canada, 2020; Volume IV. [Google Scholar]
- Claudia, G.A.; Araceli, G.R.; Fernando, I.G.; Salvador, H. Production Processes of Renewable Aviation—Present Technologies and Future Trends; Elsevier: Amsterdam, The Netherlands, 2020; pp. 1–21. [Google Scholar]
- Dyk, S.V.; Saddler, J.; Boshell, F.; Saygin, D.; Salgado, A.; Seleem, A. Biofuels for Aviation: Technology Brief; International Renewable Energy Agency: Abu Dhabi, United Arab Emirates, 2017; pp. 2–28. [Google Scholar]
- Siallagan, S.D.; Prijadi, R. The impact of operational and financial hedging to the airline operating performance. KnE Soc. Sci. 2020, 673–693. [Google Scholar]
- Murphy, A.; Earl, T. Roadmap to Decarbonising European Aviation; Transport & Environment: Brussels, Belgium, 2018. [Google Scholar]
- Kim, J.-K.; Park, J.Y.; Yim, E.S.; Min, K.I.; Park, C.K.; Ha, J.H. Bio-Jet fuel production technologies for GHG reduction in aviation sector. Trans. Korean Hydrog. New Energy Soc. 2015, 26, 609–628. [Google Scholar] [CrossRef][Green Version]
- Vozka, P.; Pavel, S.; Gozdem, K. Impact of HEFA feedstocks on fuel composition and properties in blends with jet A. Energy Fuels 2018, 32, 11595–11606. [Google Scholar] [CrossRef]
- Fredsgaad, M.; Hulkko, L.S.S.; Chaturvedi, T.; Thomsen, M.H. Process simulation and techno-economic assessment of Salicornia sp. Based jet fuel refinery through Hermelia illucens sugars-to-lipids conversion and HEFA route. Biomass Bioenergy 2021, 150, 106142. [Google Scholar]
- ASTM D7566-22; Standard Specification for Aviation Turbine Fuel Containing Synthesized Hydrocarbons. American Society for Testing and Materials: West Conshohocken, PA, USA, 2022.
- Meurer, A.; Kern, J. Fischer-Tropsch synthesis as the key for decentralized sustainable kerosene production. Energies 2021, 14, 1836. [Google Scholar] [CrossRef]
- Mattie, D.R.; Sterner, T.R.; Reddy, G.; Steup, D.R.; Zeiger, E.; Wagner, D.J.; Hinz, J.P. Toxicity and occupational exposure assessment for Fischer-Tropsch synthetic paraffinic kerosene. J. Toxicol. Environ. Health A 2018, 81, 774–791. [Google Scholar] [CrossRef]
- Han, G.B.; Jang, J.H.; Ahn, M.H.; Suh, Y.W.; Choi, M.; Park, N.K.; Jeong, B. Operation of bio-aviation fuel manufacturing facility via hydroprocessed esters and fatty acids process and optimization of fuel property for turbine engine test. Korean J. Chem. Eng. 2021, 38, 1205–1223. [Google Scholar] [CrossRef]
- Lee, K.; Lee, M.E.; Kim, J.-K.; Shin, B.; Choi, M. Single-step hydroconversion of triglycerides into biojet fuel using CO-tolerant PtRe catalyst supported on USY. J. Catal. 2019, 379, 180–190. [Google Scholar] [CrossRef]
- Kim, T.H.; Lee, K.; Oh, B.R.; Lee, M.E.; Seo, M.; Li, S.; Chang, Y.K. A novel process for the coproduction of biojet fuel and high-value polyunsaturated fatty acid esters from heterotrophic microalgae Schizochytrium sp. ABC101. Renew. Energy 2021, 165, 481–490. [Google Scholar] [CrossRef]
- Barbosa, J.A.; Coronado, C.J.; Tuna, C.E.; Silva, M.H.; Mendiburu, A.Z.; Junior, J.A.C.; Andrade, J.C. Experimental determination of lower flammability limits of Synthesized Iso-Paraffins (SIP), jet fuel and mixtures at atmospheric and reduced pressures with air. Fire Saf. J. 2021, 121, 103276. [Google Scholar] [CrossRef]
- Oßwald, P.; Zinsmeister, J.; Kathrotia, T.; Alves-Fortunato, M.; Burger, V.; van der Westhuizen, R.; Köhler, M. Combustion kinematics of alternative jet fuels, Part-I: Experimental flow reactor study. Fuel 2021, 302, 120735. [Google Scholar] [CrossRef]
- Saffaripour, M.; Zabeti, P.; Kholghy, M.; Thomson, M.J. An experimental comparison of the sooting behavior of synthetic jet fuels. Energy Fuels 2011, 25, 5584–5593. [Google Scholar] [CrossRef]
- Richter, S.; Kukkadapu, G.; Westbrook, C.K.; Braun-Unkhoff, M.; Naumann, C.; Köhler, M.; Riedel, U. A combined experimental and modeling study of combustion properties of an isoparaffinic alcohol-to-jet fuel. Combust. Flame 2022, 240, 111994. [Google Scholar] [CrossRef]
- Schripp, T.; Herrmann, F.; Oßwald, P.; Köhler, M.; Zschocke, A.; Weigelt, D.; Werner-Spatz, C. Particle emissions of two unblended alternative jet fuels in a full scale jet engine. Fuel 2019, 256, 115903. [Google Scholar] [CrossRef]
- Jekins, R.W.; Sutton, A.D.; Robichaud, D.J. Pyrolysis of Biomass for Aviation Fuel. In Biofuels for Aviation; Academic Press: Cambridge, MA, USA, 2016; pp. 191–215. [Google Scholar]
- Coordinating Research Council. Handbook of Aviation Fuel Properties; CRC Report No. 663; CRC Press: Boca Raton, FL, USA, 2016. [Google Scholar]
- Why, E.S.K.; Ong, H.C.; Lee, H.V.; Chen, W.H.; Asikin-Mijan, N.; Varman, M. Conversion of bio-jet fuel from palm kernel oil and its blending effect with jet A-1 fuel. Energy Convers. Manag. 2021, 243, 114311. [Google Scholar] [CrossRef]
- Alirio, B.; Pedro, B.; Farid, B.C.; Marco, A.R. Chemical composition and low-temperature fluidity properties of jet fuels. Processes 2021, 9, 1184. [Google Scholar]
- Cheiky, M.; Malyala, R. Method for Making Renewable Fuels Including Gasoline, Diesel and Jet Fuels with Byproducts Recycled to Gasifier. U.S. Patent US8143464B2, 27 March 2012. [Google Scholar]
- ASTM 2887-19; Standard Test Method for Boiling Range Distribution of Petroleum Fractions by Gas Chromatography. ASTM International: West Conshohocken, PA, USA, 2019.
- Bachler, C.; Schober, S.; Mittelbach, M. Simulated distillation for biofuel analysis. Energy Fuels 2010, 24, 2086–2090. [Google Scholar] [CrossRef]
- ASTM D7153-22; Standard Test Method for Freezing Point of Aviation Fuels (Automatic Laser Method). ASTM International: West Conshohocken, PA, USA, 2022.
- ASTM D45-21; Standard Test Method for Kinematic Viscosity of Transparent and Opaque Liquids (and Calculation of Dynamic Viscosity). ASTM International: West Conshohocken, PA, USA, 2021.
- Wang, Q.; Cui, D.; Pan, S.; Wang, Z.; Liu, Q.; Liu, B. Compositional characterization of neutral fractions in <300 °C distillates of six shale oils using extrography followed by GC-TOF/MS analysis. Fuel 2018, 224, 610–618. [Google Scholar]
- Chehreh, C.S. Prediction of specific gravity of Afghan coal based on conventional coal properties by stepwise regression and random forest. Energy Sources Part A 2019, 1–12. [Google Scholar] [CrossRef]
- Cookson, D.J.; Smith, B.E.; Johnston, R.R. Relationships between diesel fuel ignition quality indicators and composition. Fuel 1993, 72, 661–664. [Google Scholar] [CrossRef]
- Jin, T.; Qu, L.; Liu, S.; Gao, J.; Wang, J.; Wang, F.; Xu, X. Chemical characteristics of particulate matter emitted from a heavy duty diesel engine and correlation among inorganic and PAH components. Fuel 2014, 116, 655–661. [Google Scholar] [CrossRef]
- Schober, P.; Boer, C.; Schwarte, L.A. Correlation coefficients: Appropriate use and interpretation. Anesth. Analg. 2018, 126, 1763–1768. [Google Scholar] [CrossRef] [PubMed]
- Fumo, N.; Biswas, M.R. Regression analysis for prediction of residential energy consumption. Renew. Sustain. Energy Rev. 2015, 47, 332–343. [Google Scholar] [CrossRef]
- Bilgili, M.; Sahin, B. Comparative analysis of regression and artificial neural network models for wind speed prediction. Meteorol. Atmos. Phys. 2010, 109, 61–72. [Google Scholar] [CrossRef]
- Geller, M.D.; Ntziachristos, L.; Mamakos, A.; Samaras, Z.; Schmitz, D.A.; Froines, J.R.; Sioutas, C. Physicochemical and redox characteristics of particulate matter (PM) emitted from gasoline and diesel passenger cars. Atmos. Environ. 2006, 40, 6988–7004. [Google Scholar] [CrossRef]
- ASTM D1655-22; Standard Specification for Aviation Turbine Fuels. ASTM International: West Conshohocken, PA, USA, 2022.
- Vozka, P.; Vrtiška, D.; Šimáček, P.; Kilaz, G. Impact of alternative fuel blending components on fuel composition and properties in blends with jet A. Energy Fuels 2019, 33, 3275–3289. [Google Scholar] [CrossRef]
- Lovestead, T.M.; Bruno, T.J. A comparison of the hypersonic vehicle fuel JP-7 to the rocket propellants RP-1 and RP-2 with the advanced distillation curve method. Energy Fuels 2009, 23, 3637–3644. [Google Scholar] [CrossRef]
- Burger, J.L.; Harries, M.E.; Bruno, T.J. Characterization of four diesel fuel surrogates by the advanced distillation curve method. Energy Fuels 2016, 30, 2813–2820. [Google Scholar] [CrossRef]
- Zohari, N.; Qhomi, M.M.E. Two reliable simple relationships between flash points of hydrocarbon kerosene fuels and their molecular structures. Z. Anorg. Allg. Chem. 2017, 643, 985–992. [Google Scholar] [CrossRef]


Disclaimer/Publisher’s Note: The statements, opinions and data contained in all publications are solely those of the individual author(s) and contributor(s) and not of MDPI and/or the editor(s). MDPI and/or the editor(s) disclaim responsibility for any injury to people or property resulting from any ideas, methods, instructions or products referred to in the content. |
© 2023 by the authors. Licensee MDPI, Basel, Switzerland. This article is an open access article distributed under the terms and conditions of the Creative Commons Attribution (CC BY) license (https://creativecommons.org/licenses/by/4.0/).