1. Introduction
Mechanized excavators, such as tunnel boring machines (TBMs), offer higher speed and greater safety in operations, and this has led to their widespread use in underground construction and tunneling projects. The basic mechanism for rock fragmentation in hard rock applications is the use of disc cutters. The cutting performance of the disc cutters directly influences the efficiency of rock cutting and the success of the operation [
1], which, in turn, depends on the rock properties and cutter geometry (i.e., cutter diameter, tip width, disc cutter spacing, and penetration). Previous researchers [
2,
3,
4] have discussed optimal spacing and its relationship to cutting efficiency, as represented by specific energy. While determining the optimal penetration and spacing of disc cutters is crucial for increasing the efficiency of the disc-cutting process, the traditional approach toward optimization of the cutting geometry has been through full-scale cutting tests, via the comparison of DEM models with different elemental dimensions for TBM disc cutter rock fragmentation.
There are two main approaches to determining the optimal penetration and spacing of disc cutters: (i) experimental tests, which include the full-scale linear cutting machine (LCM) test, full-scale rotary cutting machine (RCM) test, and small-scale TBM test; and (ii) numerical simulation methods, such as the finite element method (FEM), finite difference method (FDM), discrete element method (DEM), boundary element method (BEM), and hybrid methods. In the experimental approaches, the LCM test is the most commonly used device for researching disc-cutter performance. Rostami [
3,
5] used the LCM test to develop the Colorado School of Mines (CSM) TBM performance prediction model. The LCM test can address the scale effect, and the results are directly applicable to assessing the TBM performance in an actual project. There are many studies using full-scale cutting tests that explore the optimization of cutting geometry for rock cutting by disc cutters. Gertsch et al. [
6] conducted a series of LCM tests on Colorado red granite (CRG) and determined a specific disc-cutter spacing that provides close to optimum specific energy. Geng et al. [
7] used the RCM test to research the cutting forces and specific energy of disc cutters in different rock types. The main advantage of experimental studies is that they provide a fundamental understanding of the cutting process and rock failure mechanisms under the given cutter and geometrical configurations. Although full-scale experimental tests, such as the LCM and RCM tests, offer many obvious advantages, they are expensive and time-consuming [
4]. There are limited facilities and research institutions that have LCM or RCM testing equipment. Therefore, there has been some interest in the use of numerical simulation methods to model the rock-cutting process and conduct a sensitivity analysis instead of full-scale cutting tests. Previous researchers have usually designed new disc cutters based on laboratory tests and numerical simulation methods. For example, Kim et al. [
8] proposed a new estimation method to optimize the TBM cutter-head drive design, based on full-scale tunneling tests. Sun et al. [
9] designed a new layout for the disc cutters according to numerical models and the cooperative coevolutionary algorithm. Xia et al. [
10] used a multi-objective and multi-geologic conditions optimization program to optimize the design of disc cutters.
Given the increased capabilities of computers, many researchers have used a variety of numerical methods to analyze rock fragmentation using disc cutters. Cho et al. [
4] used a linear Drucker–Prager constitutive model with AUTODYN-3D finite element analysis software to simulate an LCM test. They summarized the actual chipping mechanism and developed a corresponding experimental platform. The use of numerical simulation systems that are based on modeling the rock as a continuum (FEM, BEM, FDM, etc.) does not offer good results, due to the fact that the process of rock-cutting creates cracks and fractures, compromising the basic assumption of these models that the medium is continuous. In general, the numerical models that are continuum-based cannot accurately handle large deformations and fragmentation processes [
11]. Obviously, rocks are a collection of blocks and particles with many interfaces and even joints and fractures at the mesoscopic level. These joints and fractures of rock are difficult to simulate with an FEM or BEM, but they can easily be simulated with a discrete element model (DEM).
DEM requires substantial computational resources for simulations, which limits its applicability to modeling large-scale problems. However, it provides a framework to describe de-bonding (i.e., fracturing) among discrete elements that closely simulates the natural process of fracture propagation [
12]. Cundall [
13] used the discrete element theory to propose a method for calculating particle flow. The particle flow code (PFC) method is widely used in numerical simulation studies of rock mechanics tests, the excavation of underground spaces, rock-slope engineering, mining engineering, and various other geotechnical fields [
14,
15,
16]. Regarding the simulation of rock fragmentation by disc cutters using DEM methods, many researchers selected different element dimensions to simulate the rock and disc cutters. Gong et al. [
17,
18] simulated the cutting process of rock mass by a TBM cutter, using a two-dimensional DEM model, and studied the effect of joint spacing and orientation on rock fragmentation. Li et al. [
19] used PFC
2D to simulate the process of TBM indentation. Choi et al. [
20] analyzed the cutting power of a disc cutter in a jointed rock mass. Moon et al. [
21] used DEM to study the optimal rock-cutting conditions of a hard rock TBM, based on a two-dimensional model. Gong et al. [
22] used chip thickness and chipping area to determine the efficiency of TBM excavation. These DEM applications mainly used a two-dimensional model to reduce the calculation time. Although a three-dimensional model is more realistic, it is not often used with a DEM because of the large amount of calculation required. A few researchers have employed three-dimensional DEM models to offer a more realistic simulation of the cutting process. Choi et al. [
23] used the contact bond model to simulate the rock in PFC
3D and analyzed the rock-cutting behavior, but this model is not suitable for hard rock because of its contact model. Bahr et al. [
24] discussed some of the challenges facing the three-dimensional modeling of rock cutting. Wu et al. [
25] established PFC
3D models to analyze the relationship between the mean and peak force during cutting with a disc cutter. To analyze the differences between the two- and three-dimensional models, the current study focuses on comparing the impact of elemental dimensions, to provide a more realistic simulation of rock-cutting, as represented by comparing the results with measured normal forces and specific energy. Validation of the modeling and related parameters, including the optimal size of particles in PFC, allows for the development of the method of determining the optimal conditions for a TBM. The remainder of this paper is organized as follows.
Section 2 presents the simulation models and methods, including the contact model and the optimal condition of the simulation models. The three-dimensional simulation results and specific energy of different disc-cutter spacings and penetrations are presented in
Section 3.
Section 4 compares the cutting force of the two- and three-dimensional models in PFC.
Section 5 concludes this article.
3. Simulation Results of Three-Dimensional Models
3.1. Effect of Cutting Velocities on the Simulation Results
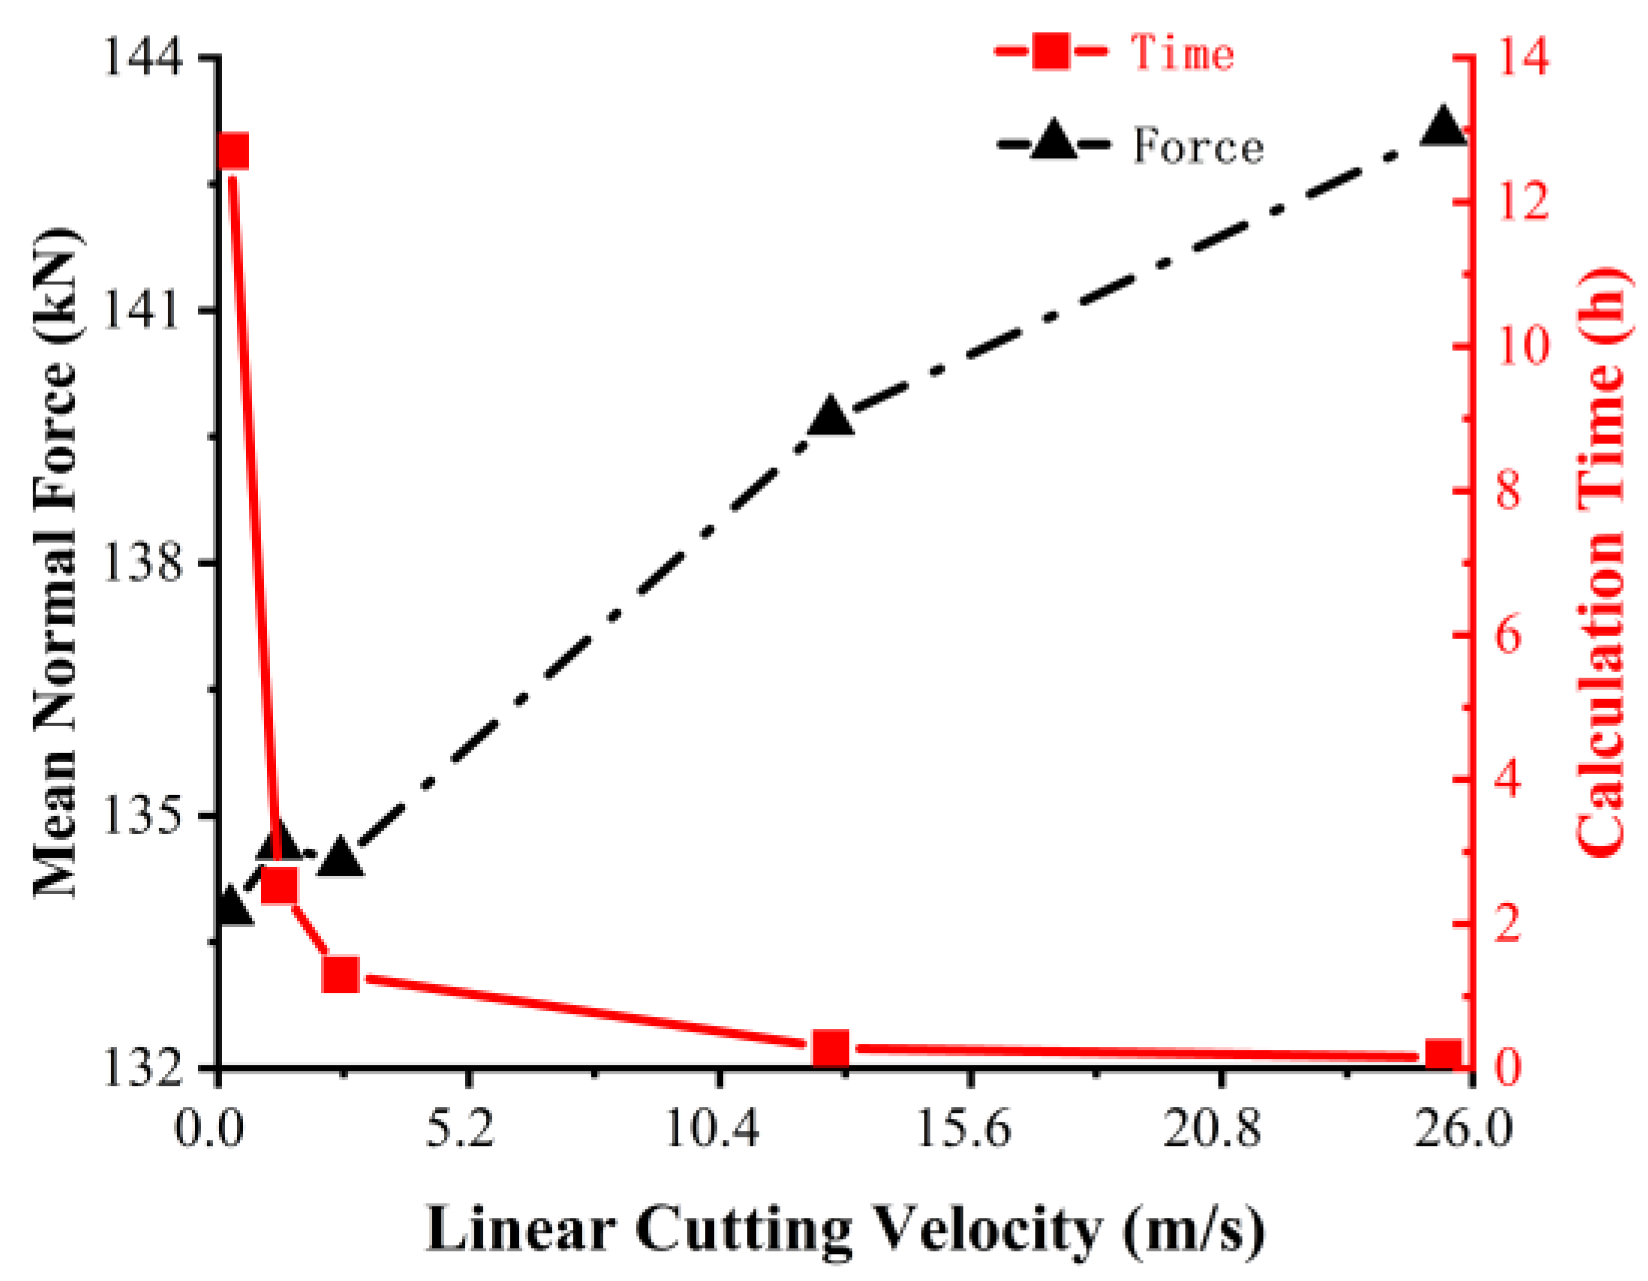
The moving speed of the disc on the rock in a numerical simulation model differs from reality, sometimes greatly, because in the numerical model, the speed is applied to the model through the time steps. In the actual LCM tests, the linear velocity was 254 mm/s (10 in/s), and the angular velocity of the disc was 1.18 rad/s. To determine the speed in the three-dimensional numerical model, five sets of simulations were conducted, and we set the linear velocity to 25.4, 12.7, 2.54, and 1.27 m/s. The selected spacing was 62.5 mm with a penetration of 3.2 mm.
Figure 9 shows the calculation times and simulation results at different cutting speeds. All the simulations were performed on a desktop computer with the following technical parameters: one CPU with an Intel core (i7-7700K, with 4.20 GHz) and eight core processors, one RAM of 32 GB, and the 64-bit system type.
The results indicate that the calculation time decreased exponentially with increasing linear speed, while the normal force did not change substantially as the linear speed decreased. To optimize the tradeoff between the calculation time and accuracy, we selected a linear speed of 2.54 m/s for the numerical simulation model, where the corresponding angular velocity was 11.8 rad/s.
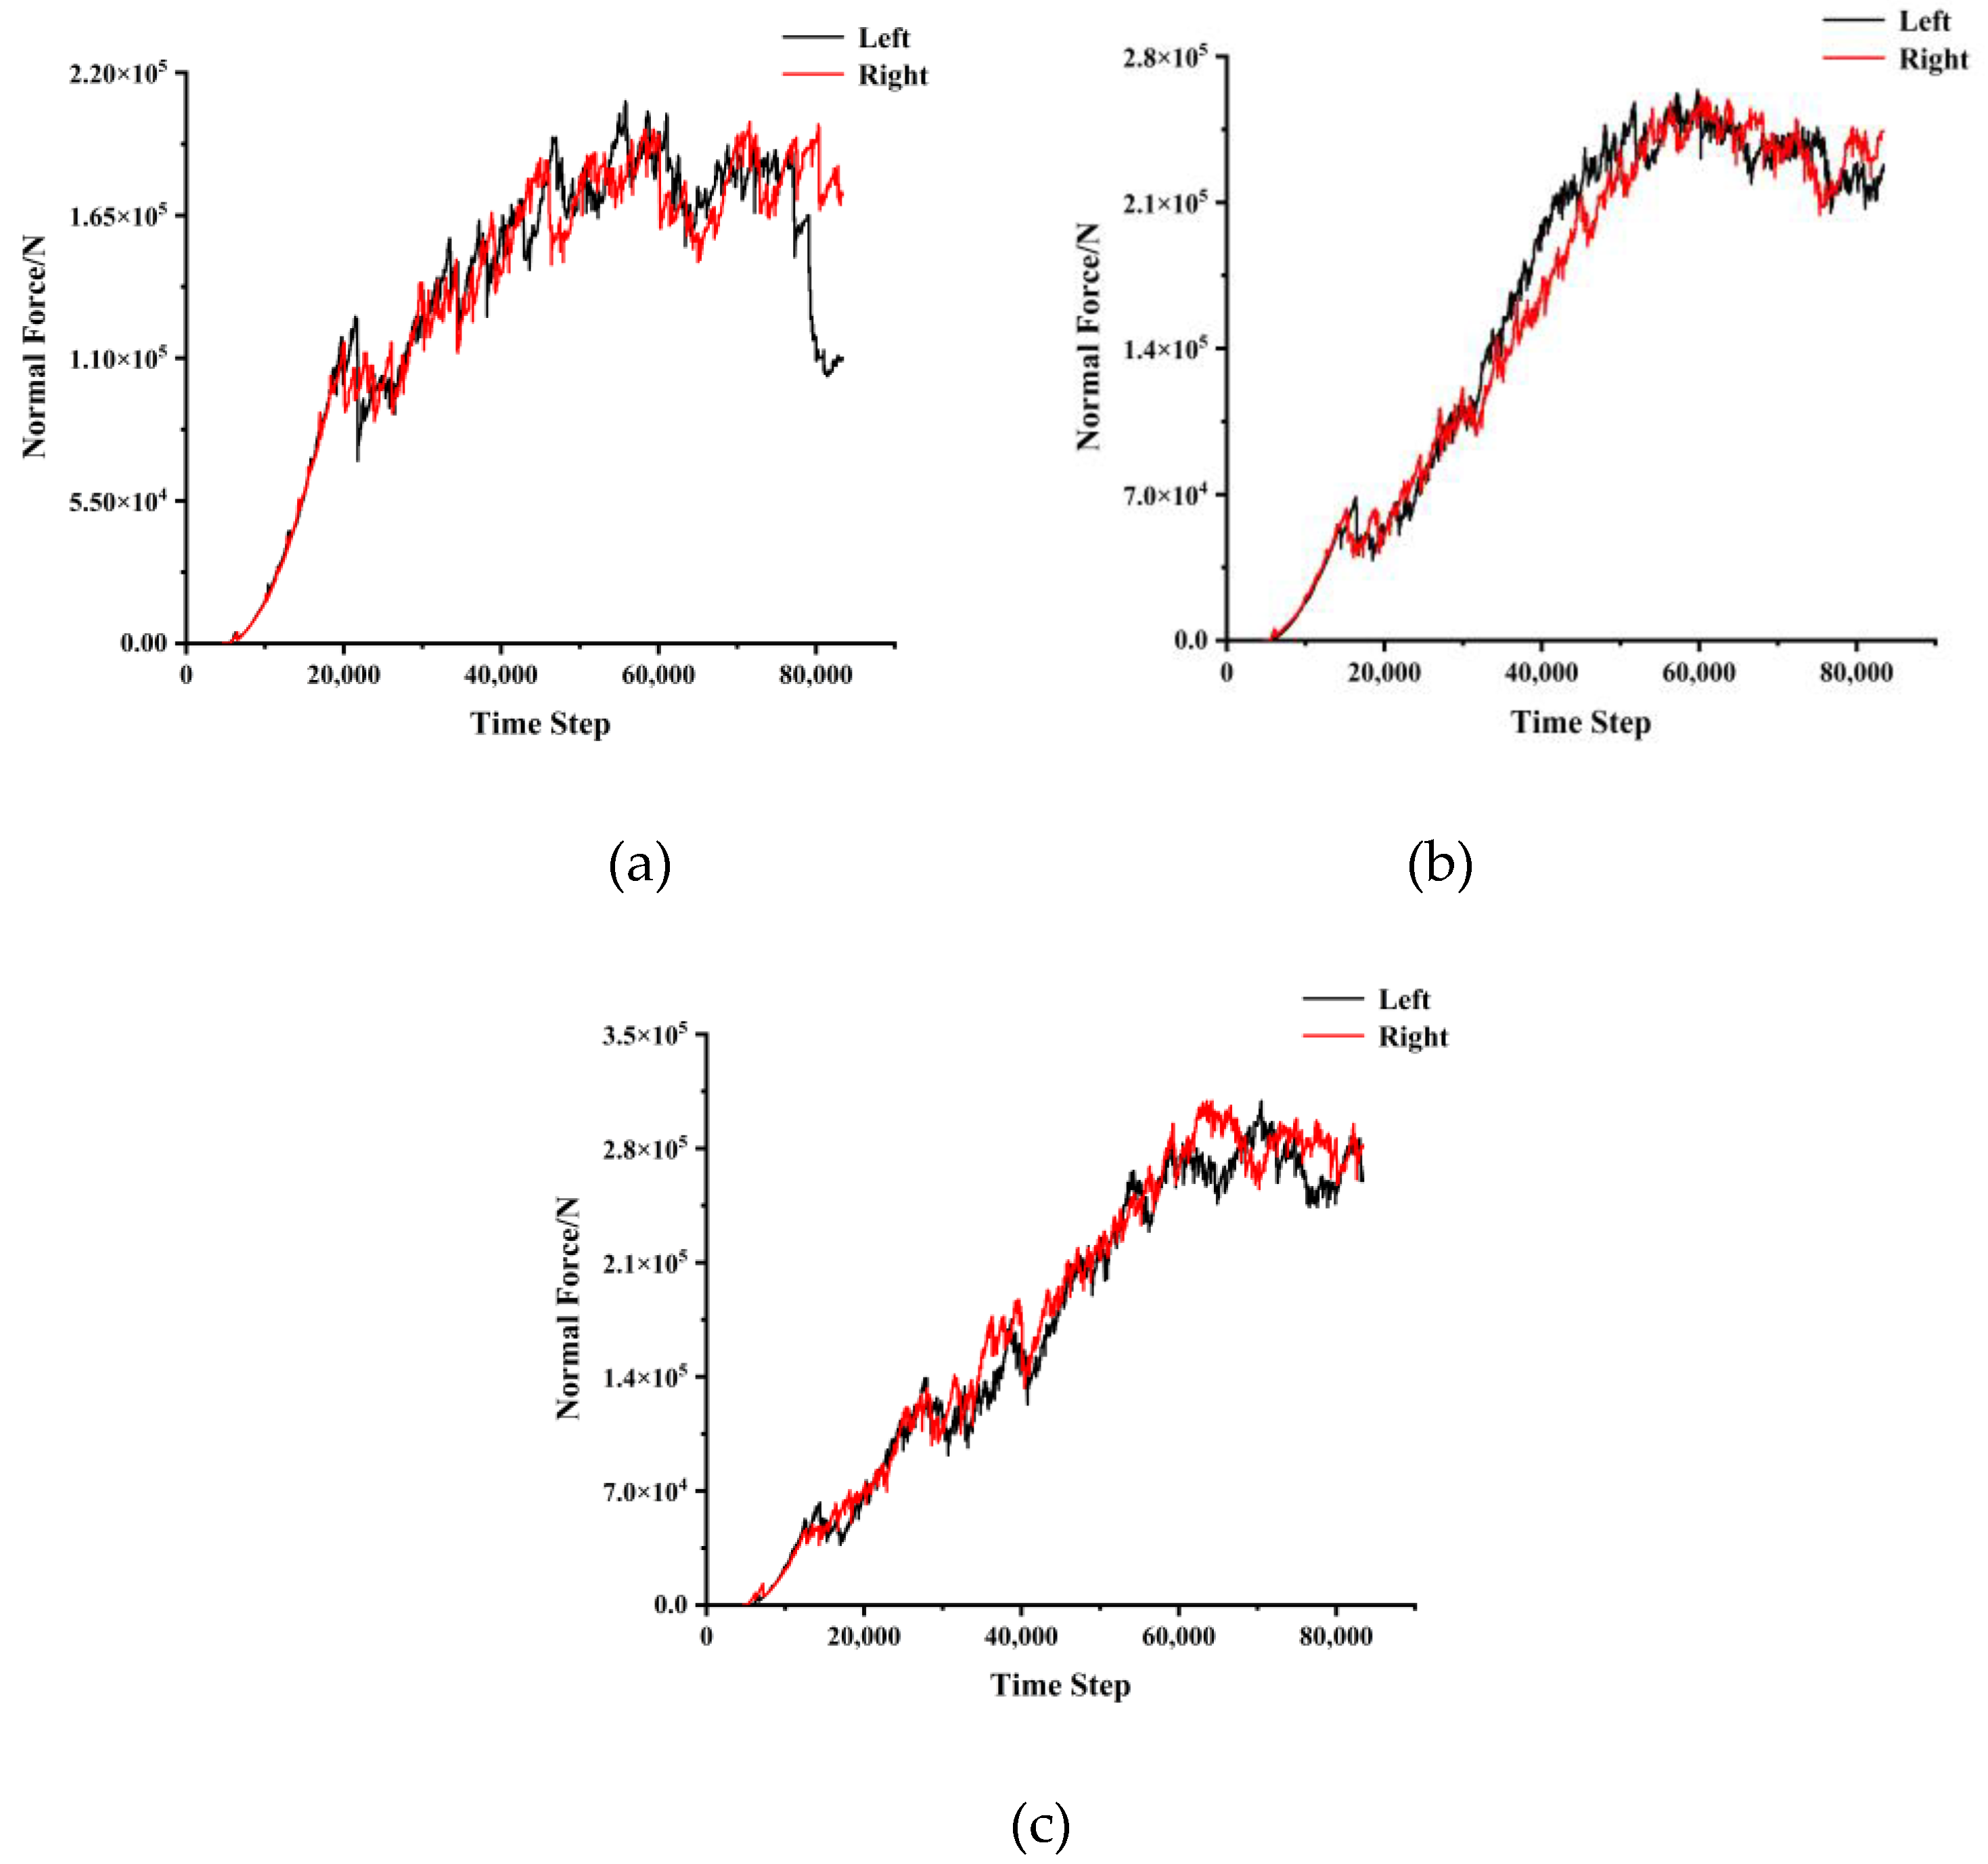
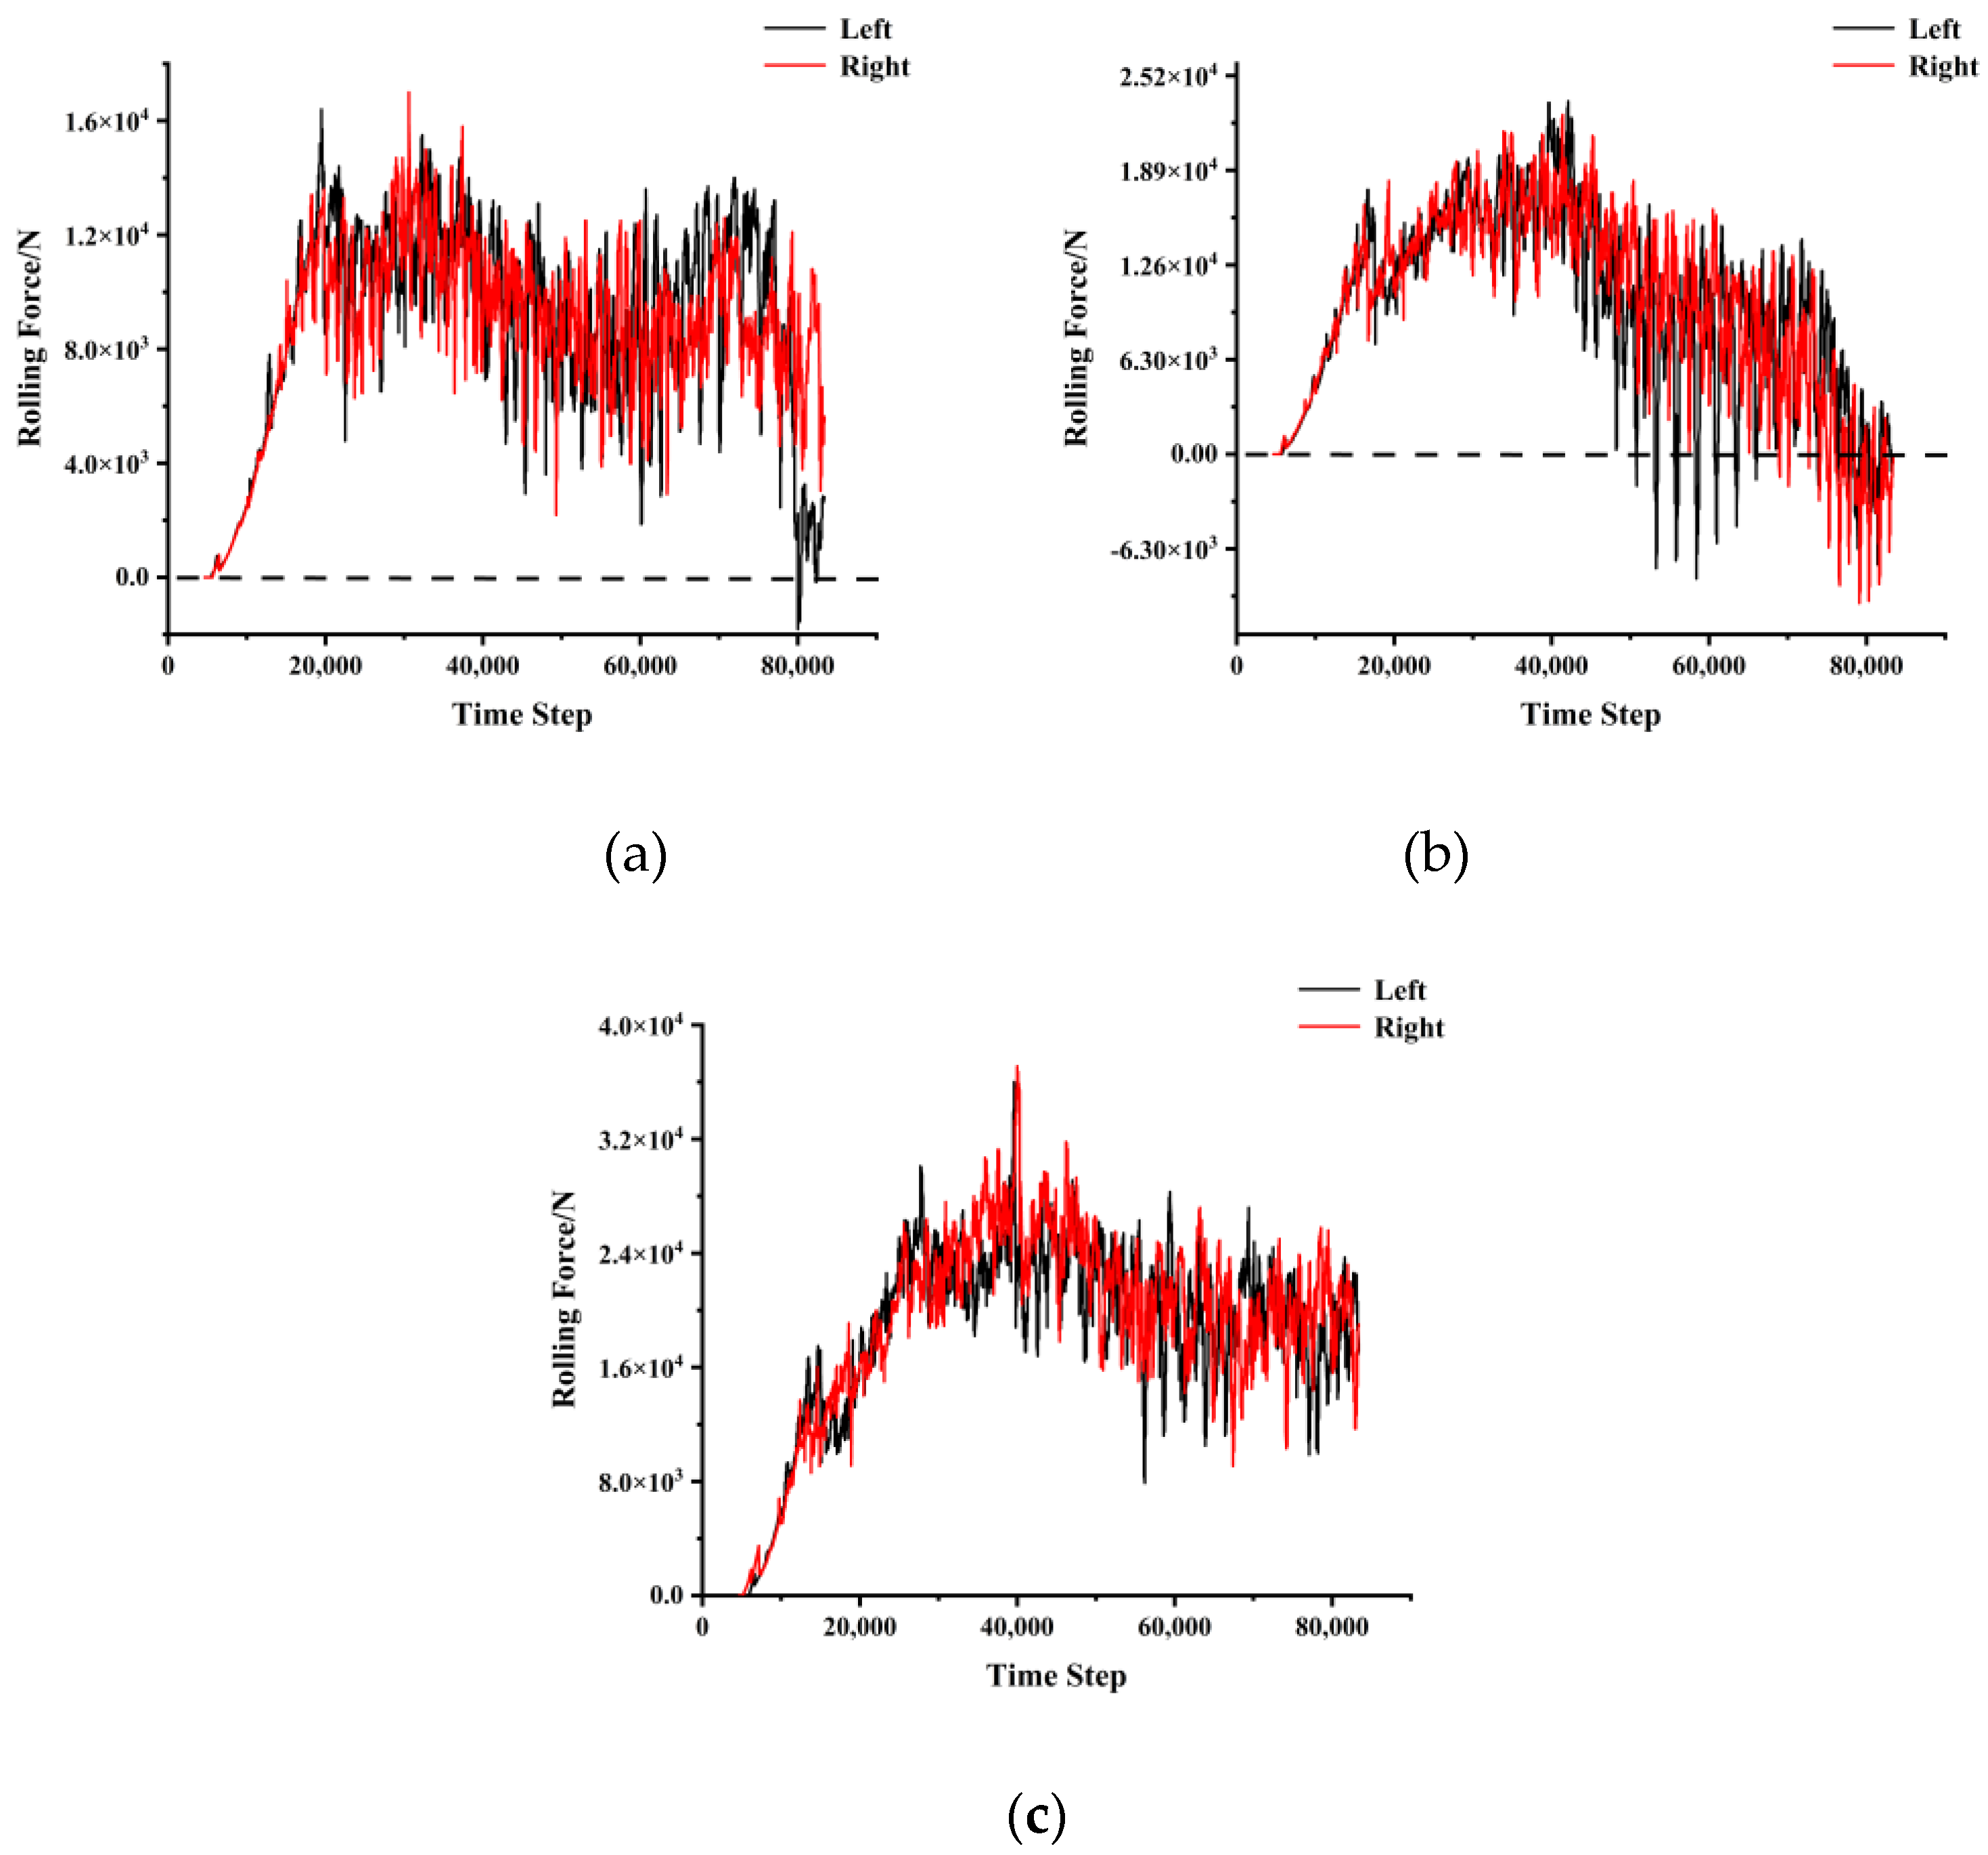
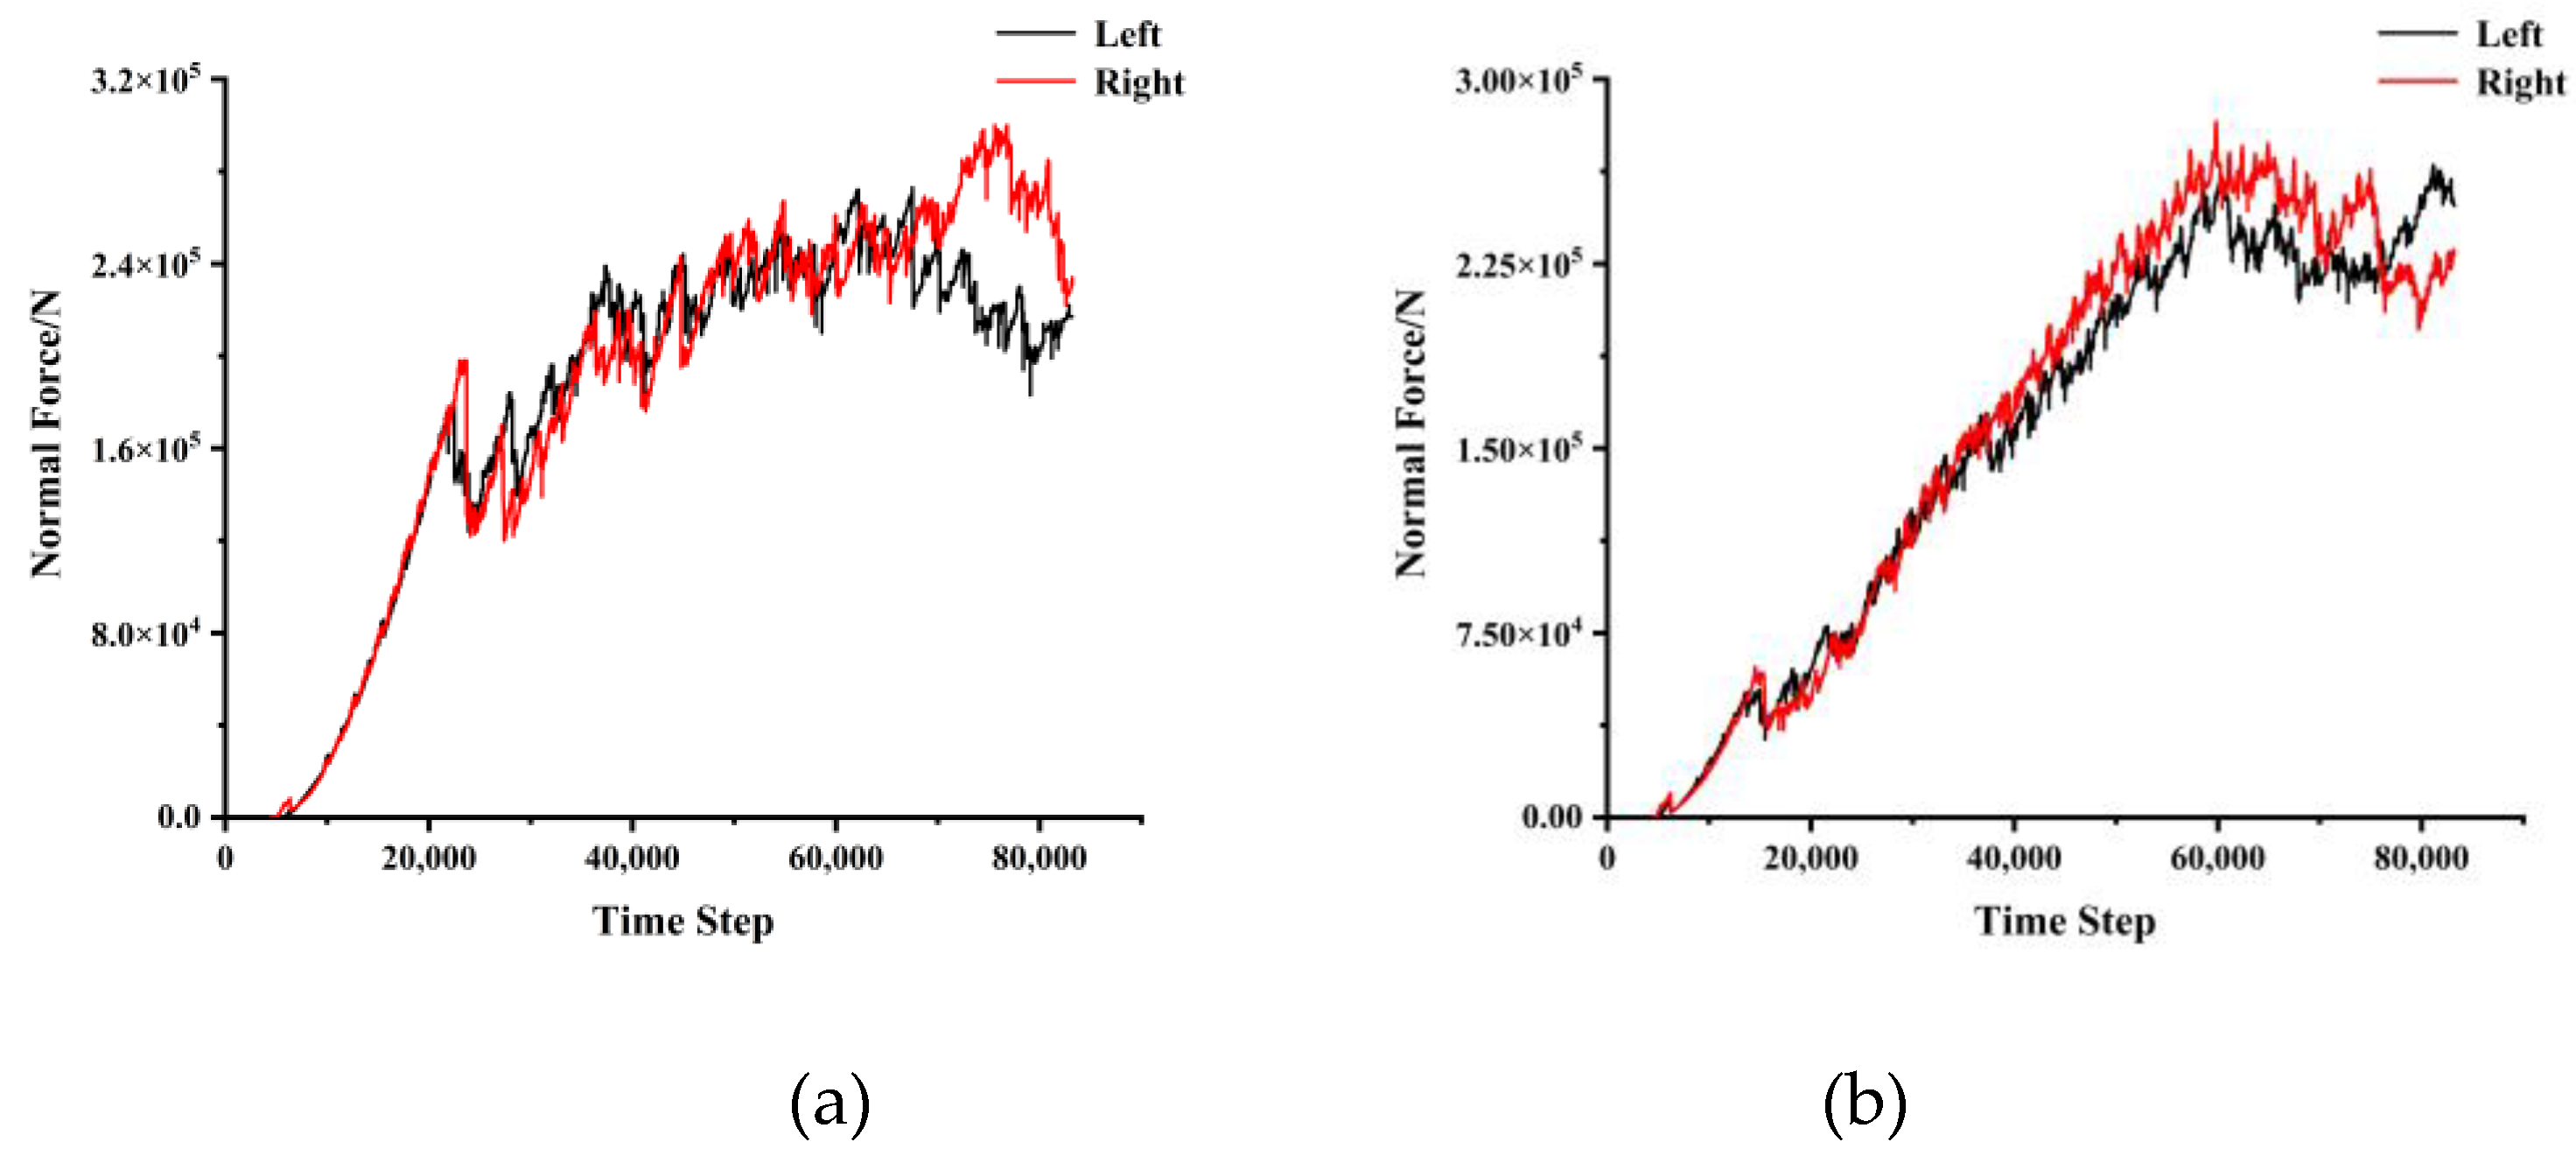
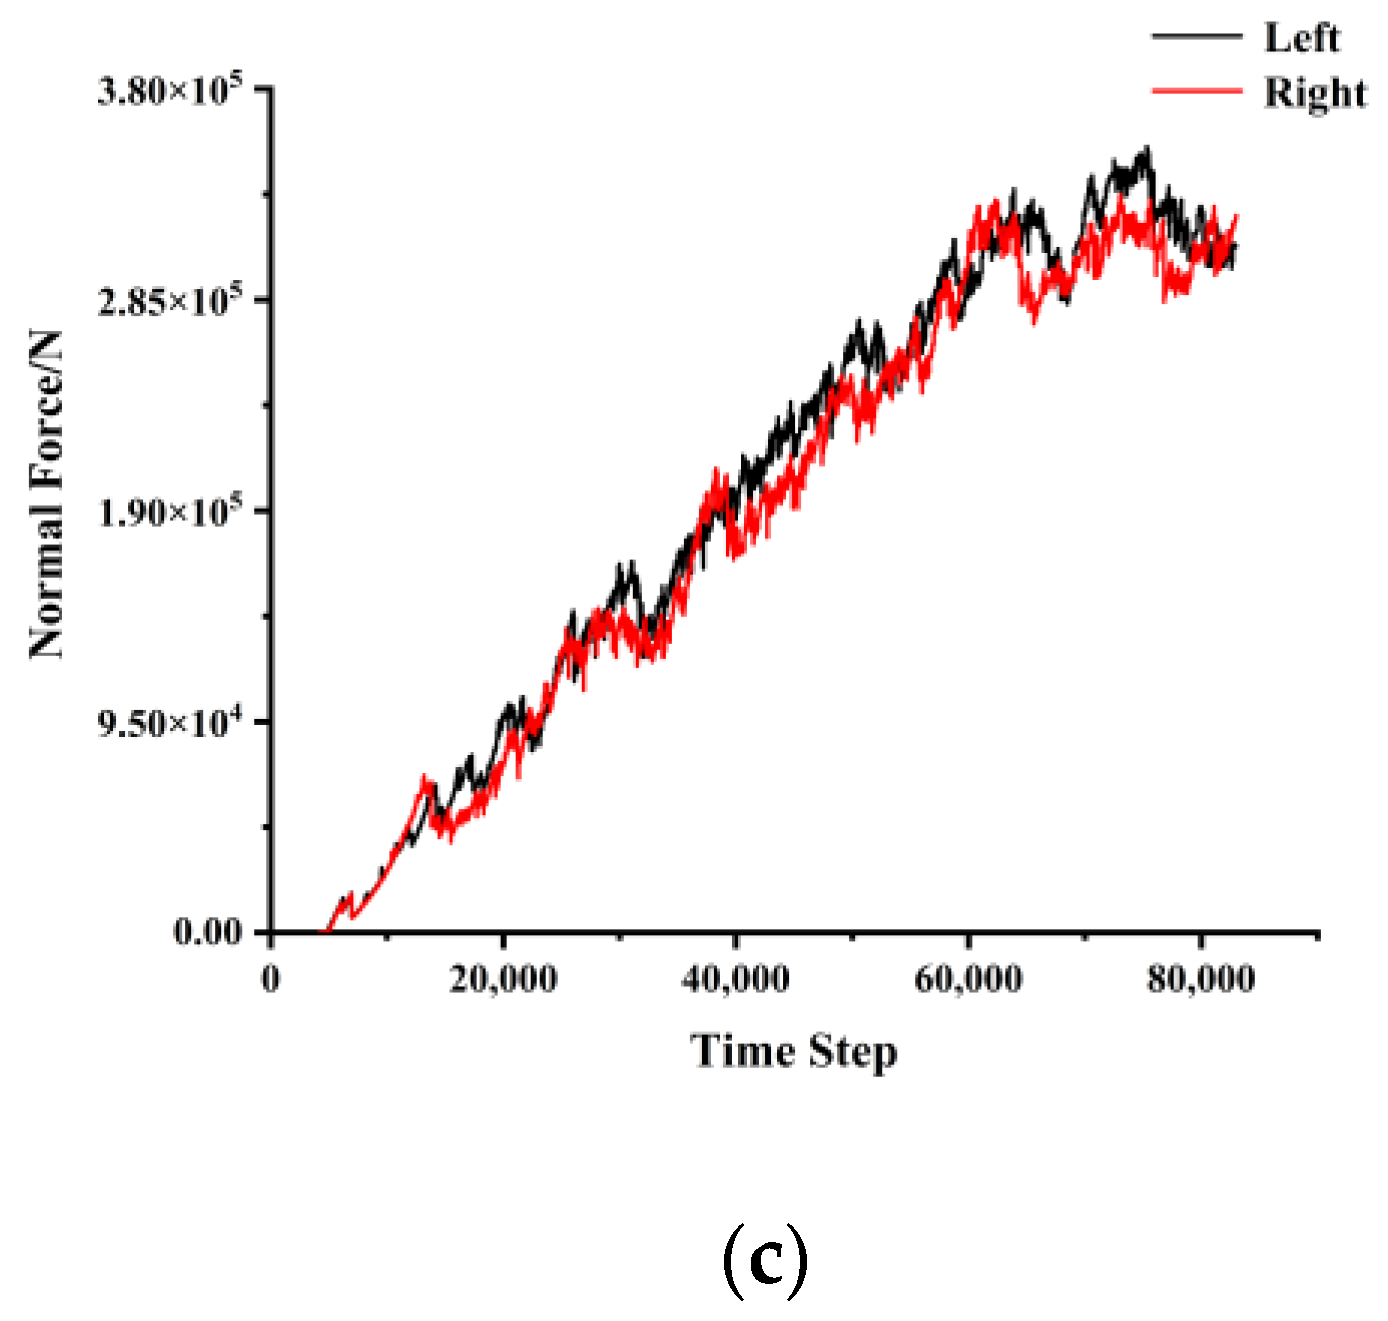
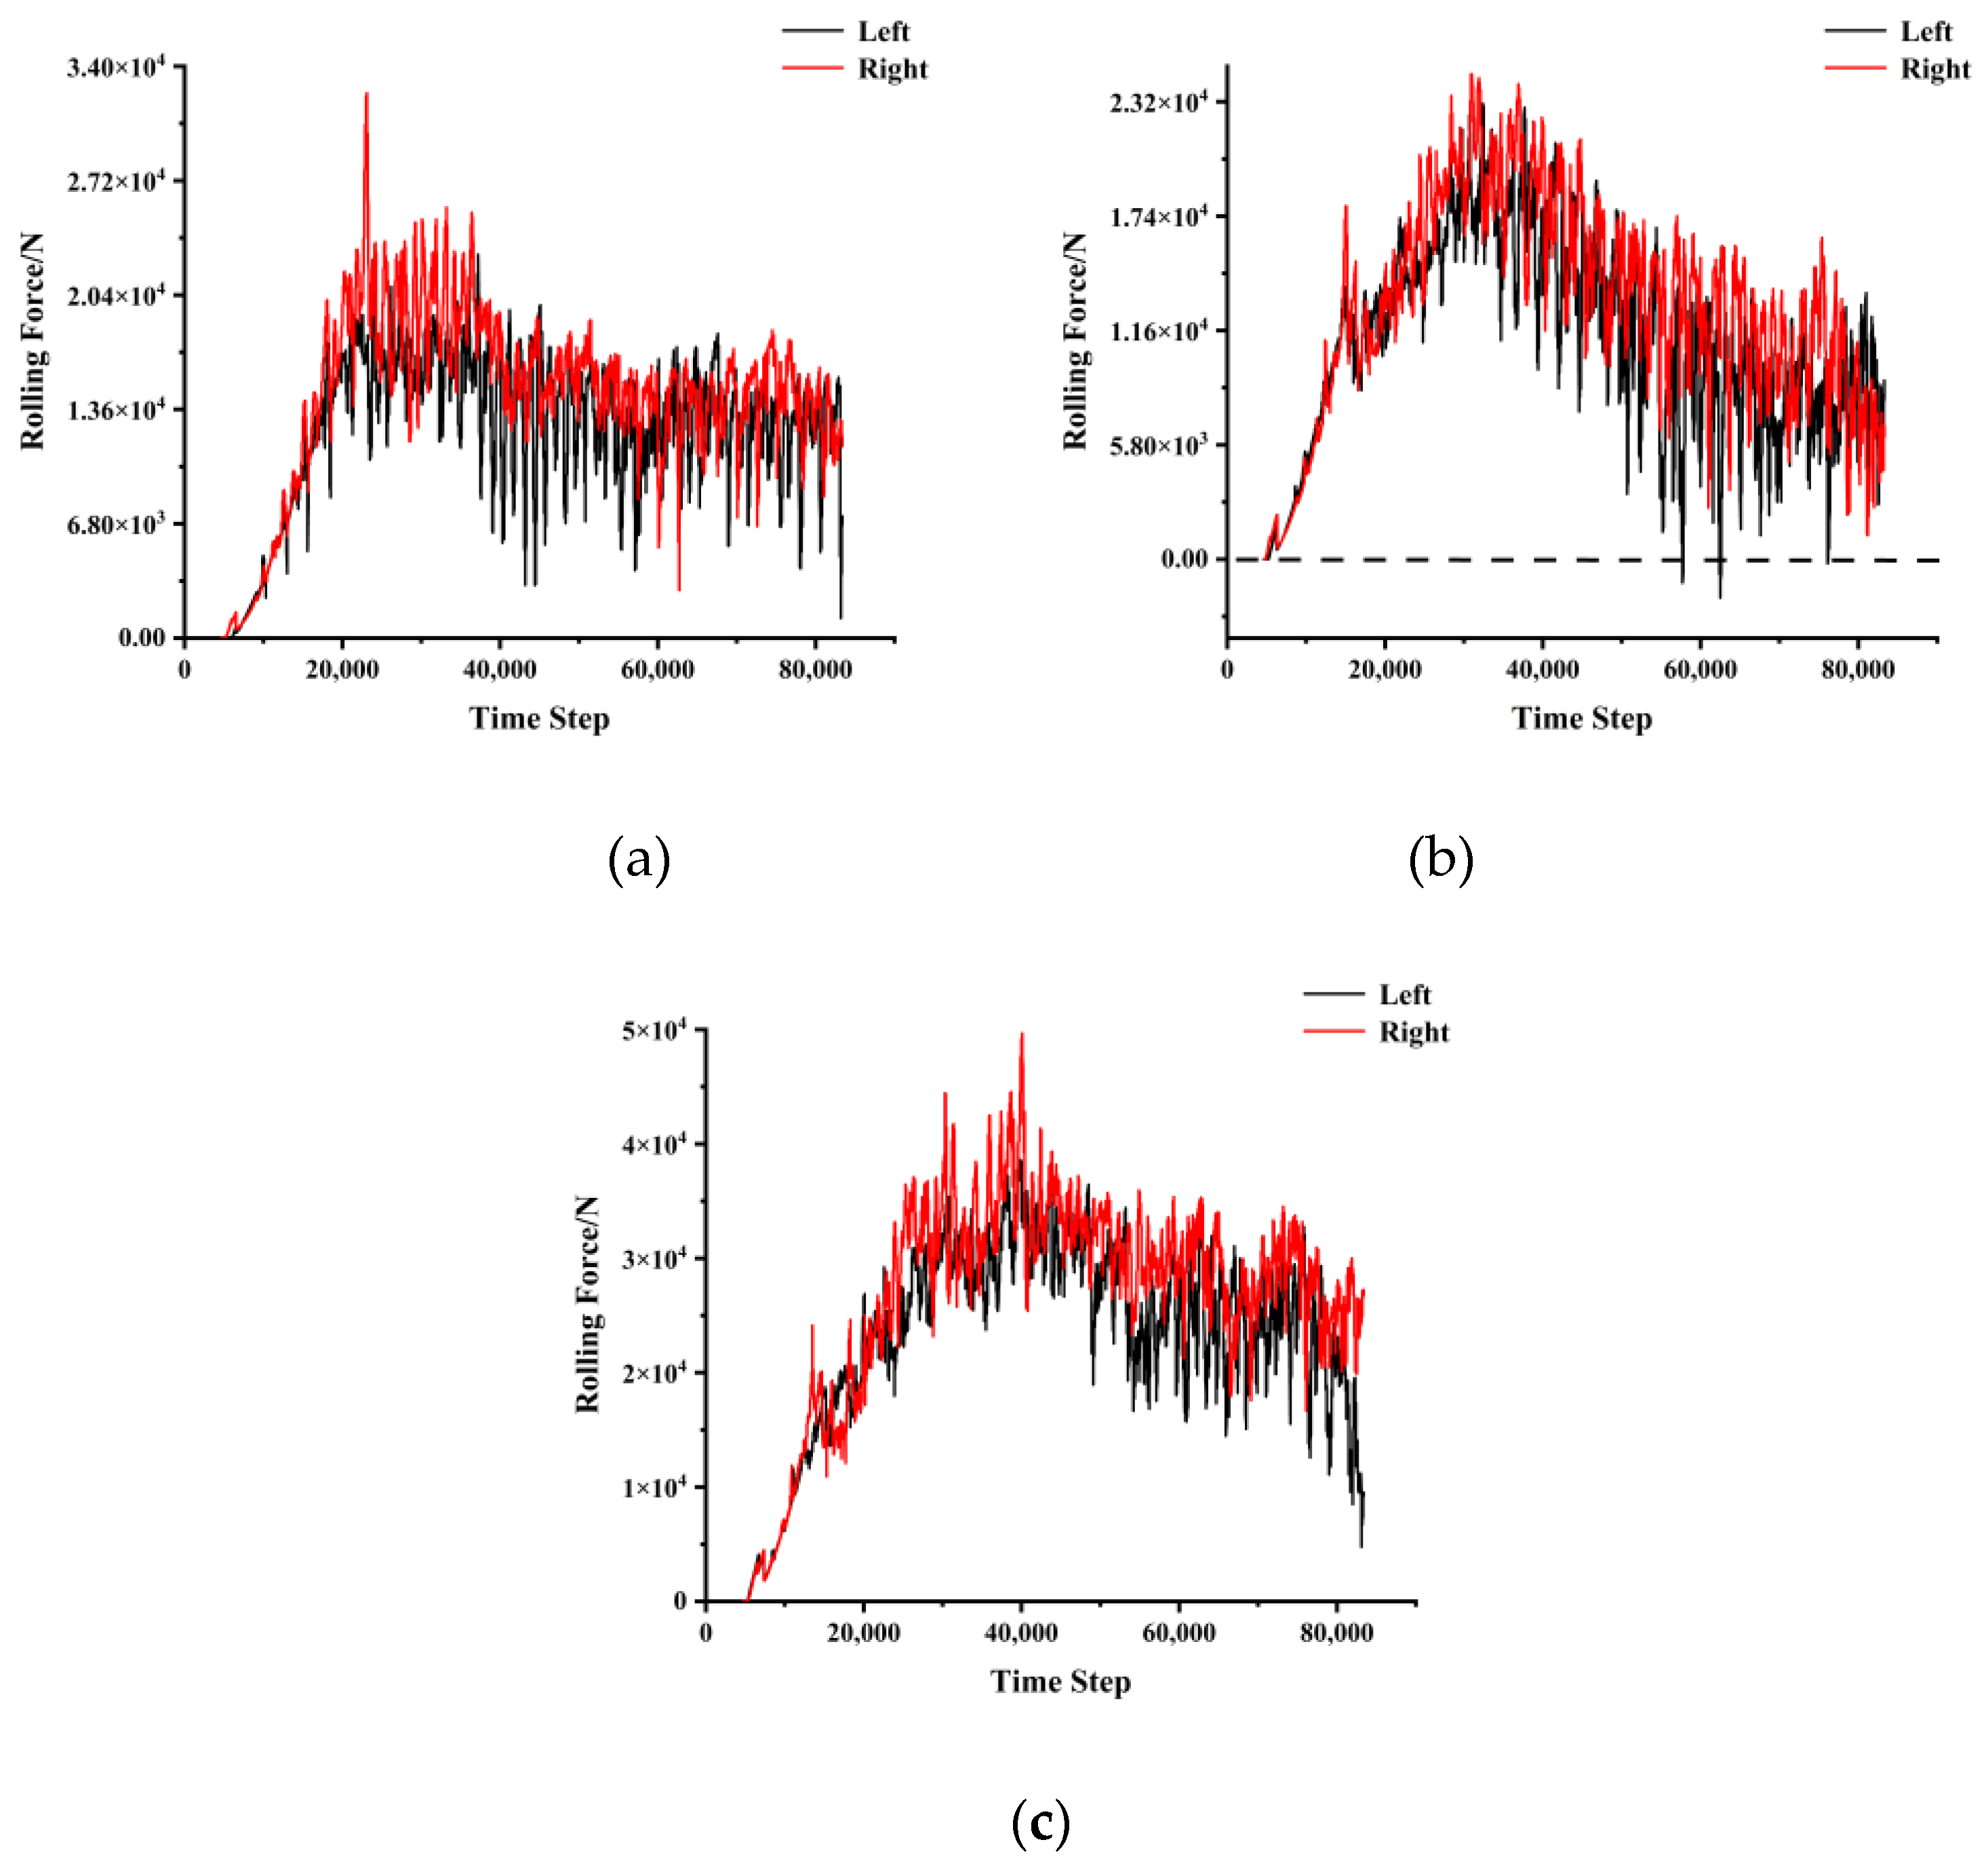
During the cutting process, the disc cutters were set up in the model as walls in PFC
3D, so we could record the wall forces in different directions. The two disc cutters are parallel to the stratification in the numerical simulation tests.
Figure 10,
Figure 11,
Figure 12 and
Figure 13 show the normal and rolling forces for different spacings.
Table 3 presents the mean normal force and rolling force under various conditions.
A closer examination of the rolling forces shows that the negative values have been calculated close to the end of the run, which means that the direction of the rolling force changed. When the rolling force drops to 0, the disc cutters continue to move forward but there is no rock to cut. This process is very short in real tests, while in a numerical simulation, it needs to happen gradually through the time steps. The change in direction in terms of the force and recording of the negative value could be due to the inertia built into the disc-cutter motion. Meanwhile, since the cutter was still in contact with the rock, the normal force did not change to negative values. Therefore, when we calculate the mean values of the normal or rolling forces, this issue has to be taken into account.
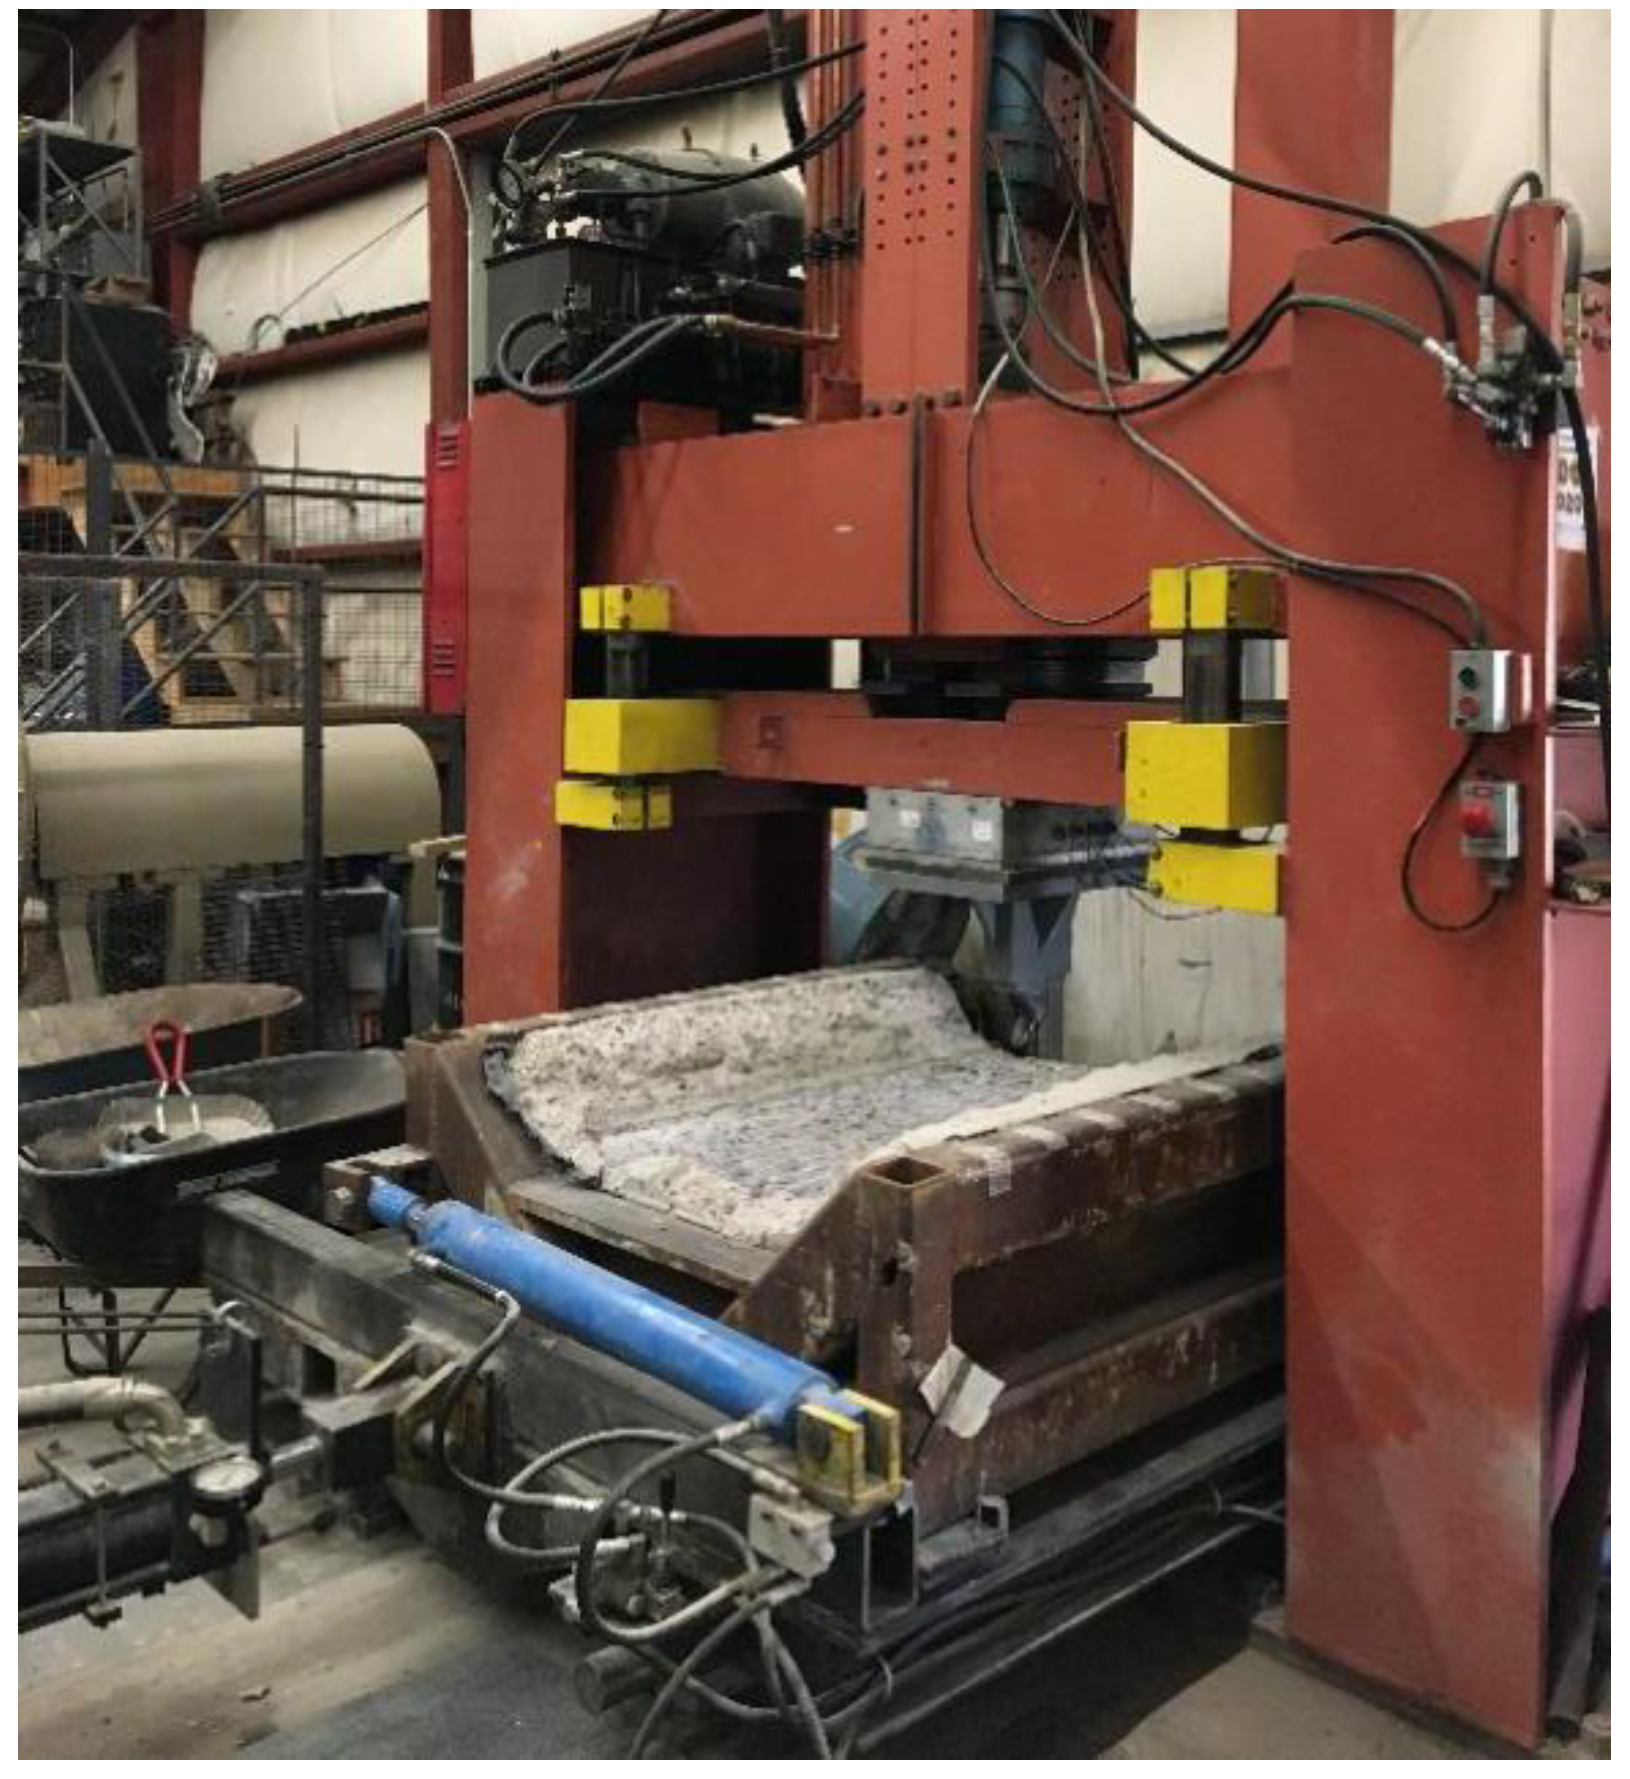
3.2. Comparison of the Simulated Forces with the LCM Results
To verify the results of the numerical simulation, the results of the numerical analysis were compared with those of the full-scale rock-cutting tests on an LCM unit at the Earth Mechanical Institute (CSM). The LCM of CSM is shown in
Figure 14. The recorded mean normal force, rolling force, and SE during the LCM tests are presented in
Table 3.
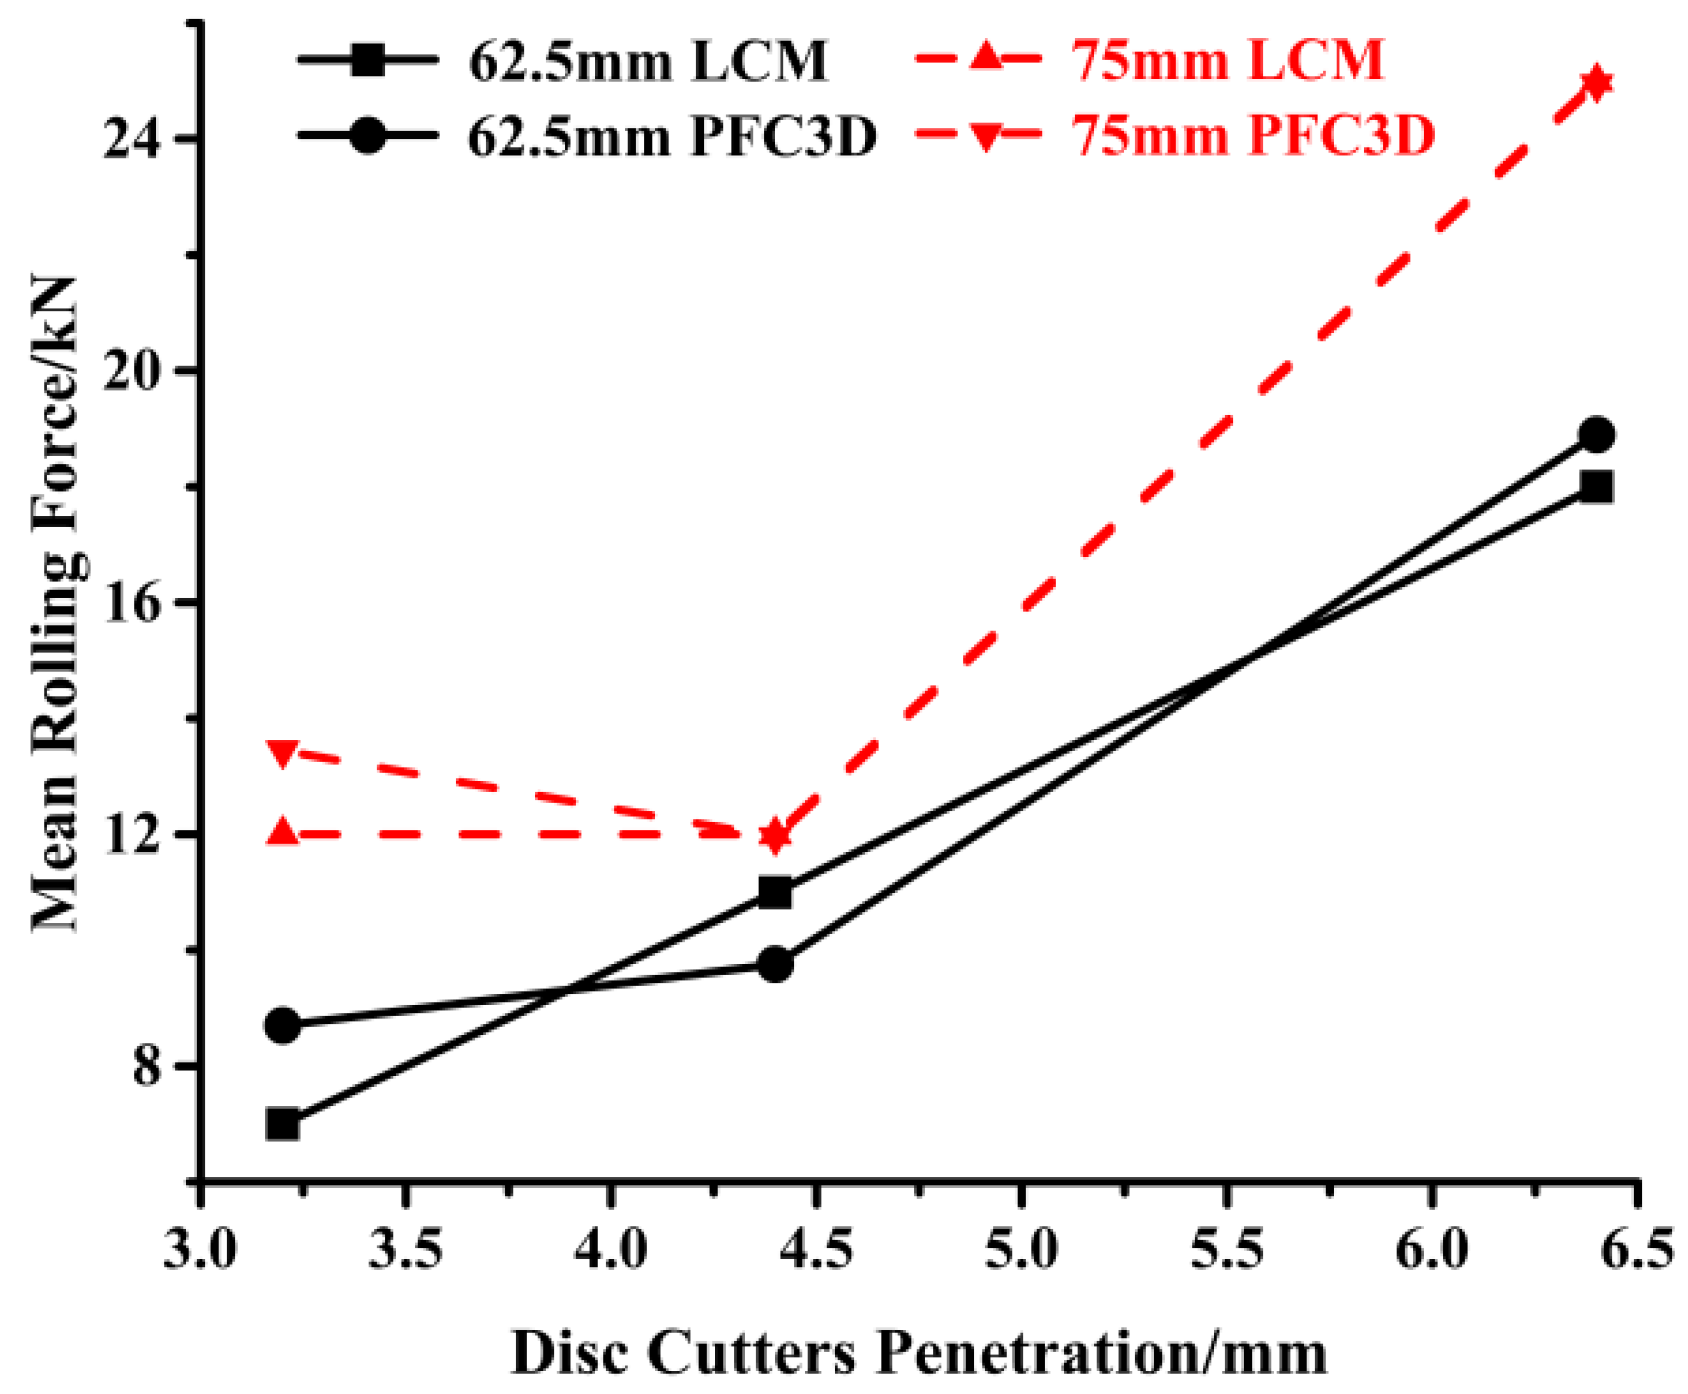
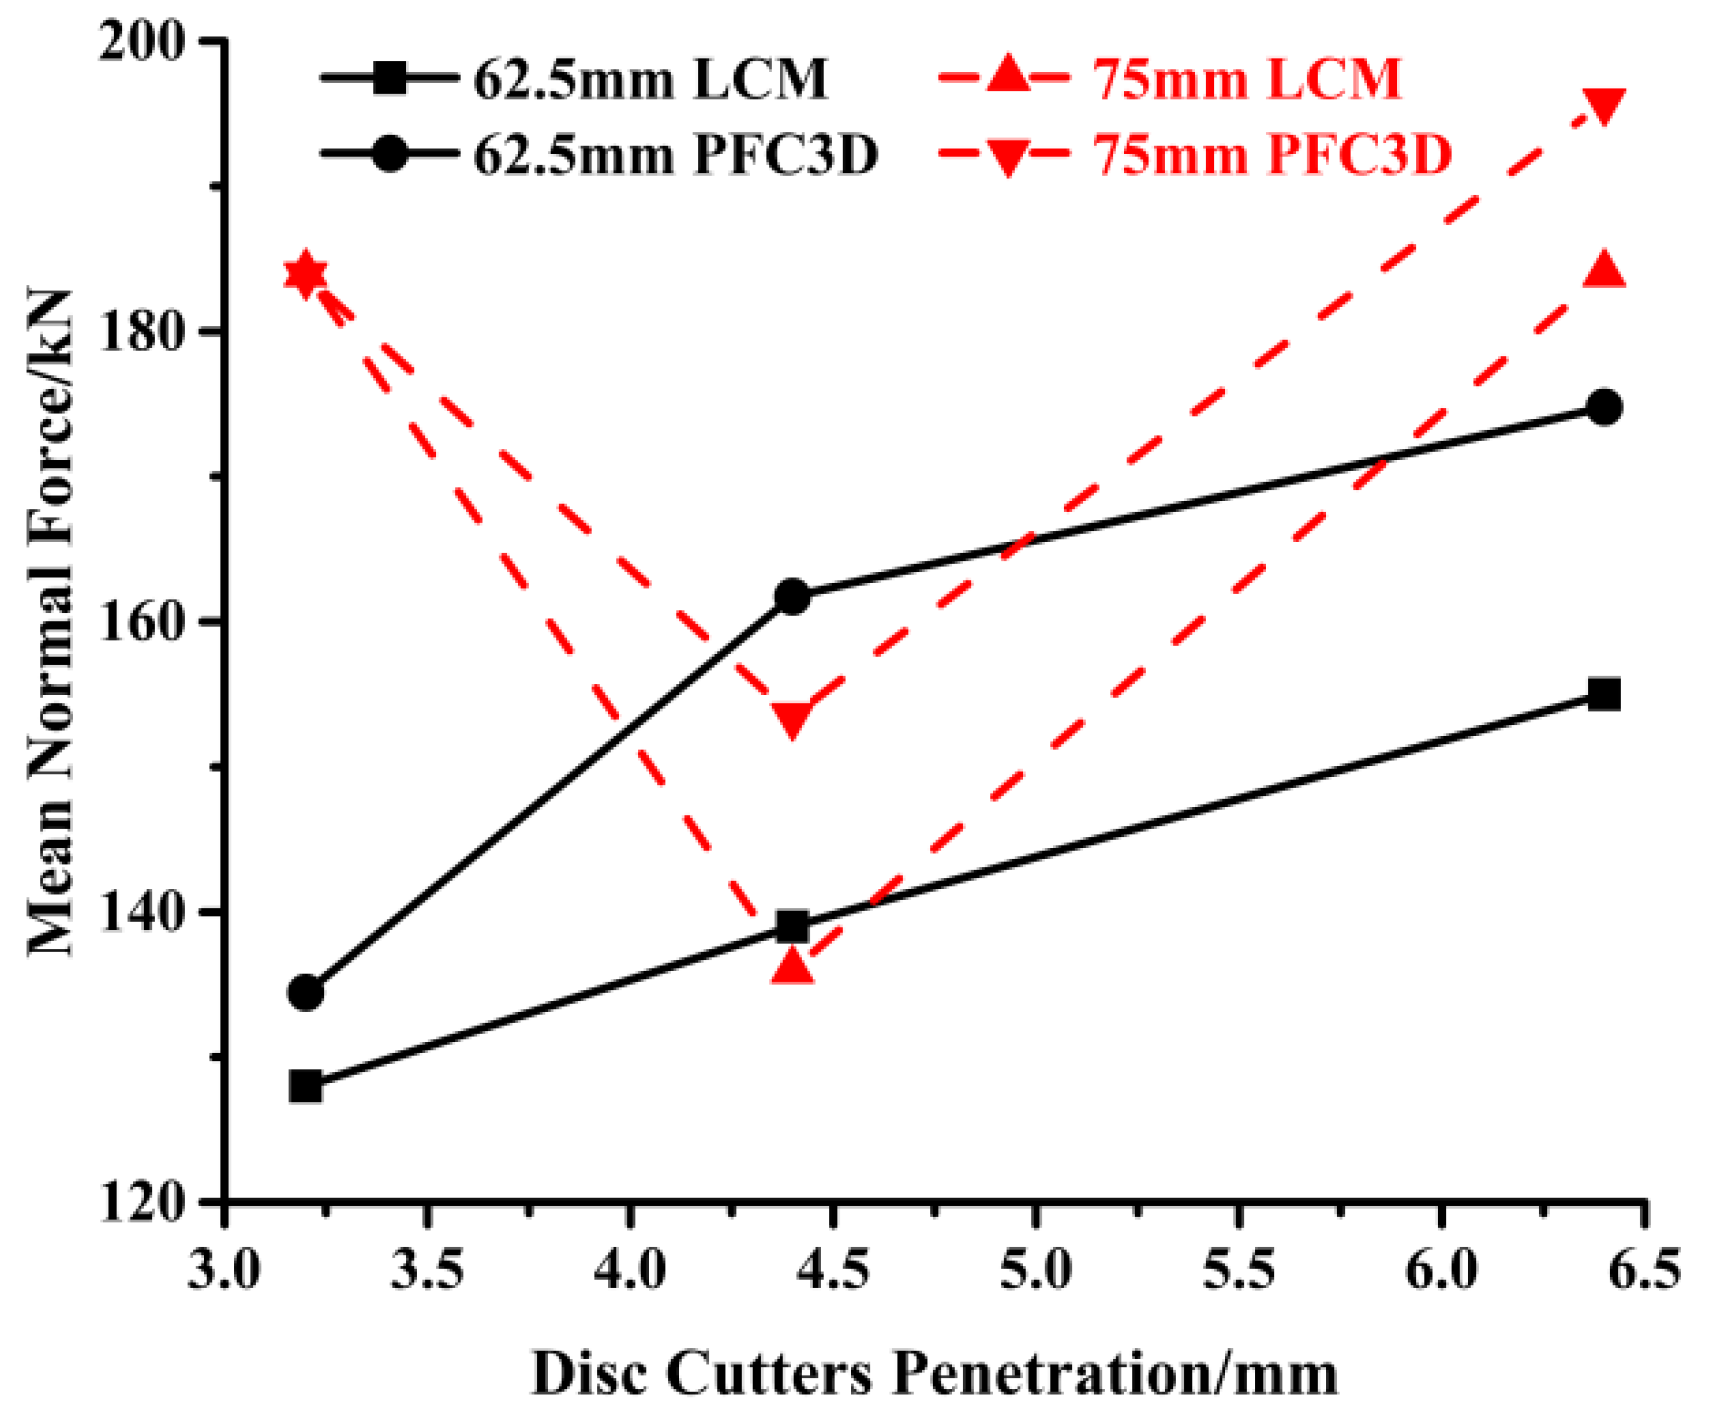
Figure 15 and
Figure 16 show the mean normal force and mean rolling force in the simulations and LCM tests as a function of penetration. In terms of the mean normal force, the simulation results were generally higher than the results of the LCM tests. When the penetration was 4.4 mm, the normal forces of the simulation results were much higher than those in the LCM tests. There could be two reasons for this observation. First, in the numerical models, the two disc cutters were simulated together, while the actual testing on the LCM was on a single disc. In the LCM tests, after the first pass, the rock is damaged, and its resistance to cutting is decreased. This decrease is known as conditioning and the disc is tracked to exploit these induced, new cracks for rock cutting in the following passes. This is not the case for the simulated cuts since the model assumed that there were no existing fractures or cracks in the rock. Second, there may have been measurement errors in the LCM tests for the given test settings. In LCM tests, the mean forces were obtained via three sets of experiments. For 75mm spacing and in the case of penetration, the measured mean normal forces were 191 kN and 100 kN.
The results of numerical simulations showed that the rolling forces were less than those measured by LCM tests. In the LCM tests, the rolling forces were recorded by a load cell, while in the numerical models, the disc cutter was modeled as a wall and the rolling force was recorded by means of the wall’s reaction force. Therefore, different measurement methods could produce measurement errors.
3.3. Disc Cutters’ Performance Comparison
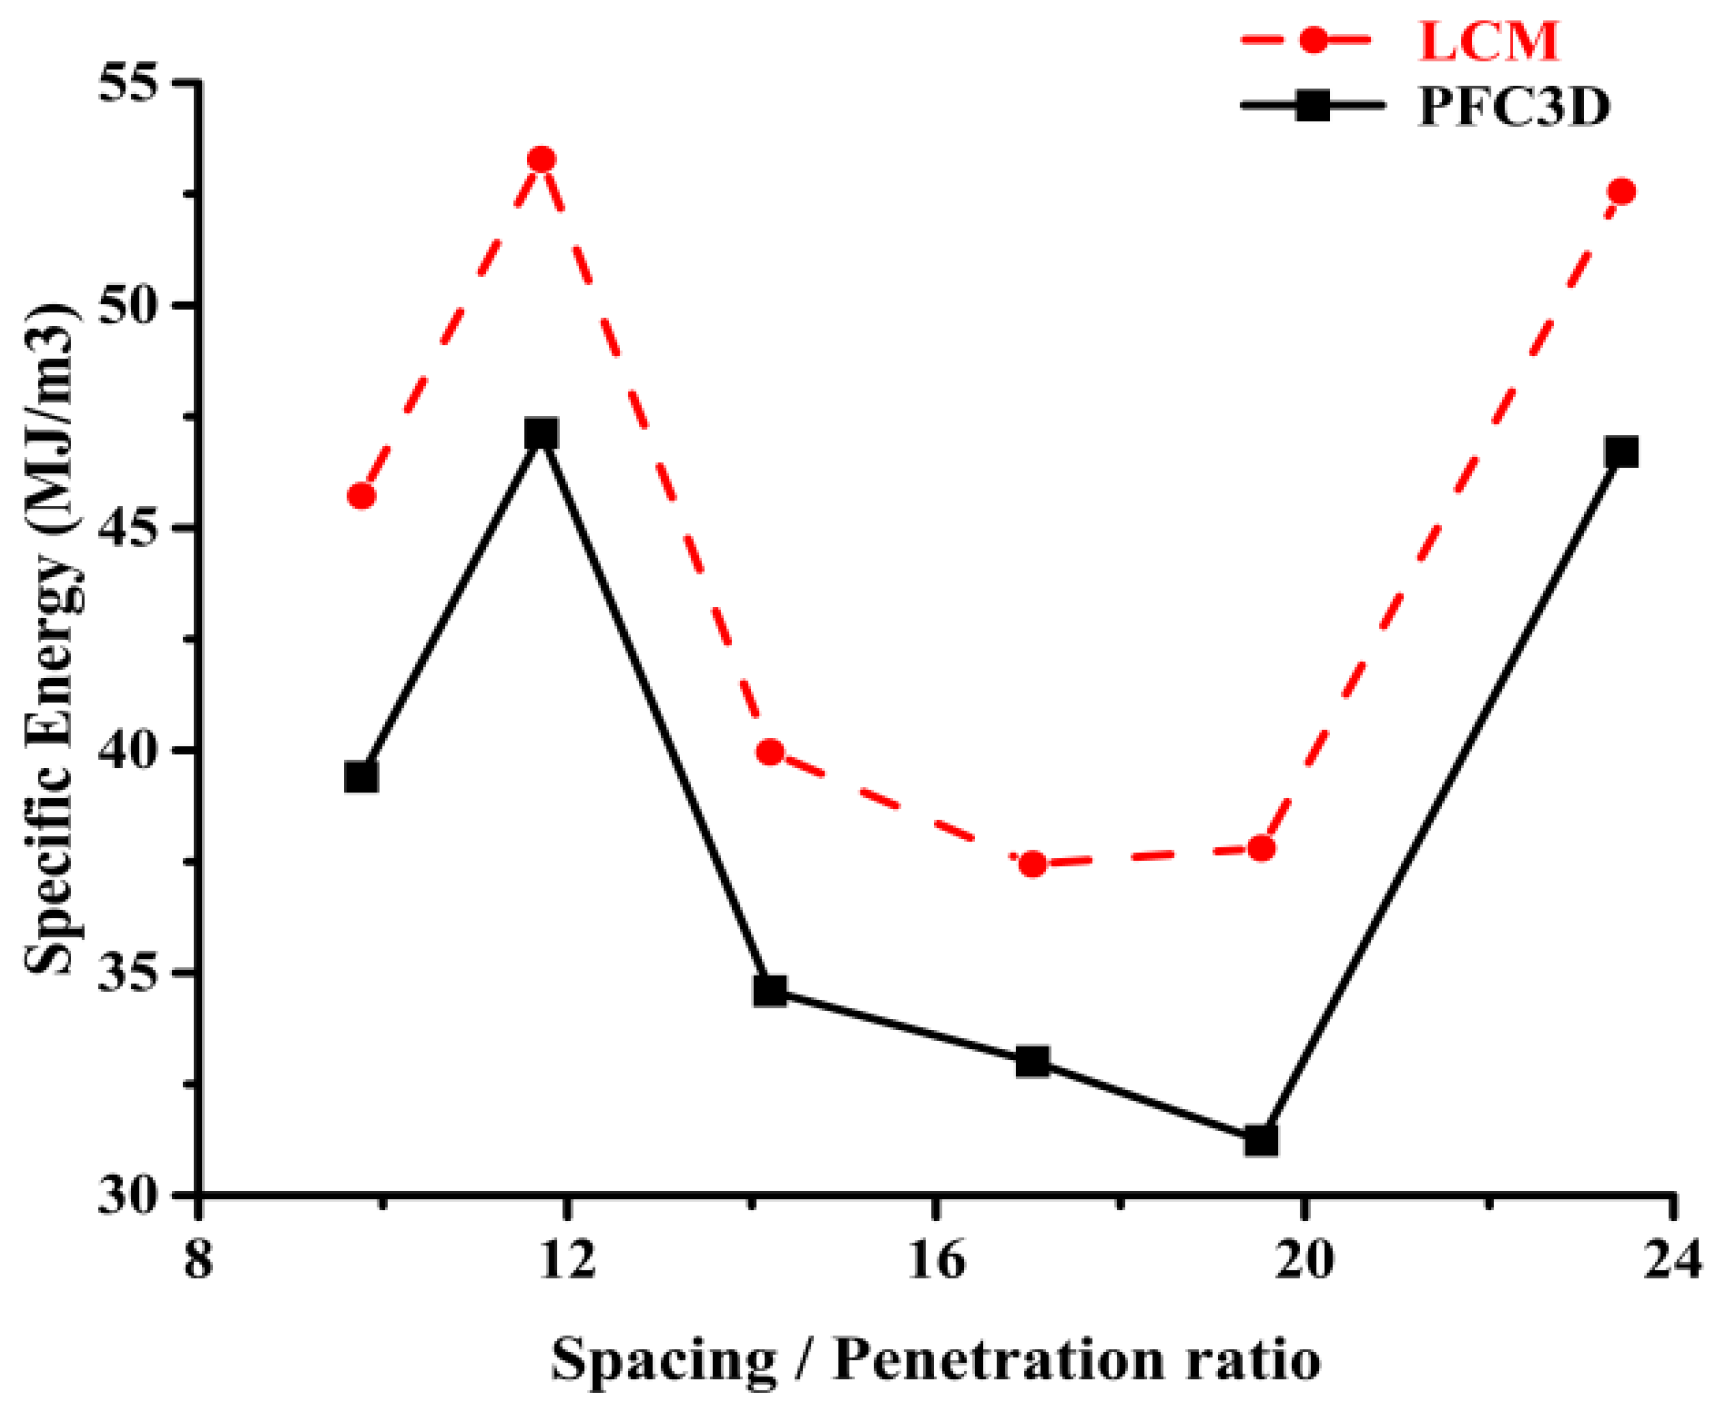
The SE is defined as the required energy for a single unit volume of rock, which is often used to determine the optimal conditions for rock excavation.
Figure 17 compares the SE results of the LCM tests and numerical simulations. At the same spacing-to-penetration ratio, the SE showed the same trend, while the SE was slightly lower when calculated by the PFC
3D simulation than when measured in the LCM tests. This agrees with the results of Choi and Lee [
23].
The reason for the lower SE calculated by PFC3D is the difference between the two calculations of excavated volume. On the one hand, in LCM testing, SE is calculated based on spacing and penetration, thereby assuming full clearance between the lines and nominal excavation volume, which is true as the cuts proceed and the rock is removed. On the other hand, the rock’s calculated excavate volume in the simulation is based on the volume estimated to have been removed from the main sample. This warrants a closer look at the way that the excavated volume is estimated in the simulation; it could be that the values that are calculated are slightly larger than those of the nominal excavation volume used in the calculation of the SE in LCM tests.
The optimal value of the SE is a range that can be determined by observing the trend and demarcation of those S/P ranges that result in lower SE values.
4. Discussion
The two-dimensional numerical model is a reproduction of the disc-cutter penetration test and can also be used to determine rock fragmentation when using TBM disc cutters. With the development of detection methods, researchers can detect and analyze the whole process of hob penetration by means of acoustic emission, electronic speckle interference, digital image detection, and so on. Chen et al. [
33] used acoustic emission and electronic speckle interference to monitor the process of disc cutter penetration into granite and sandstone, studying the influence of confining pressure on penetration force and crack propagation. Zhang et al. [
34] tested the formation and expansion of cracks in the whole process of disc cutter penetration into rock, based on the digital image correlation method, and analyzed the formation mechanism of intermediate cracks. Liu et al. [
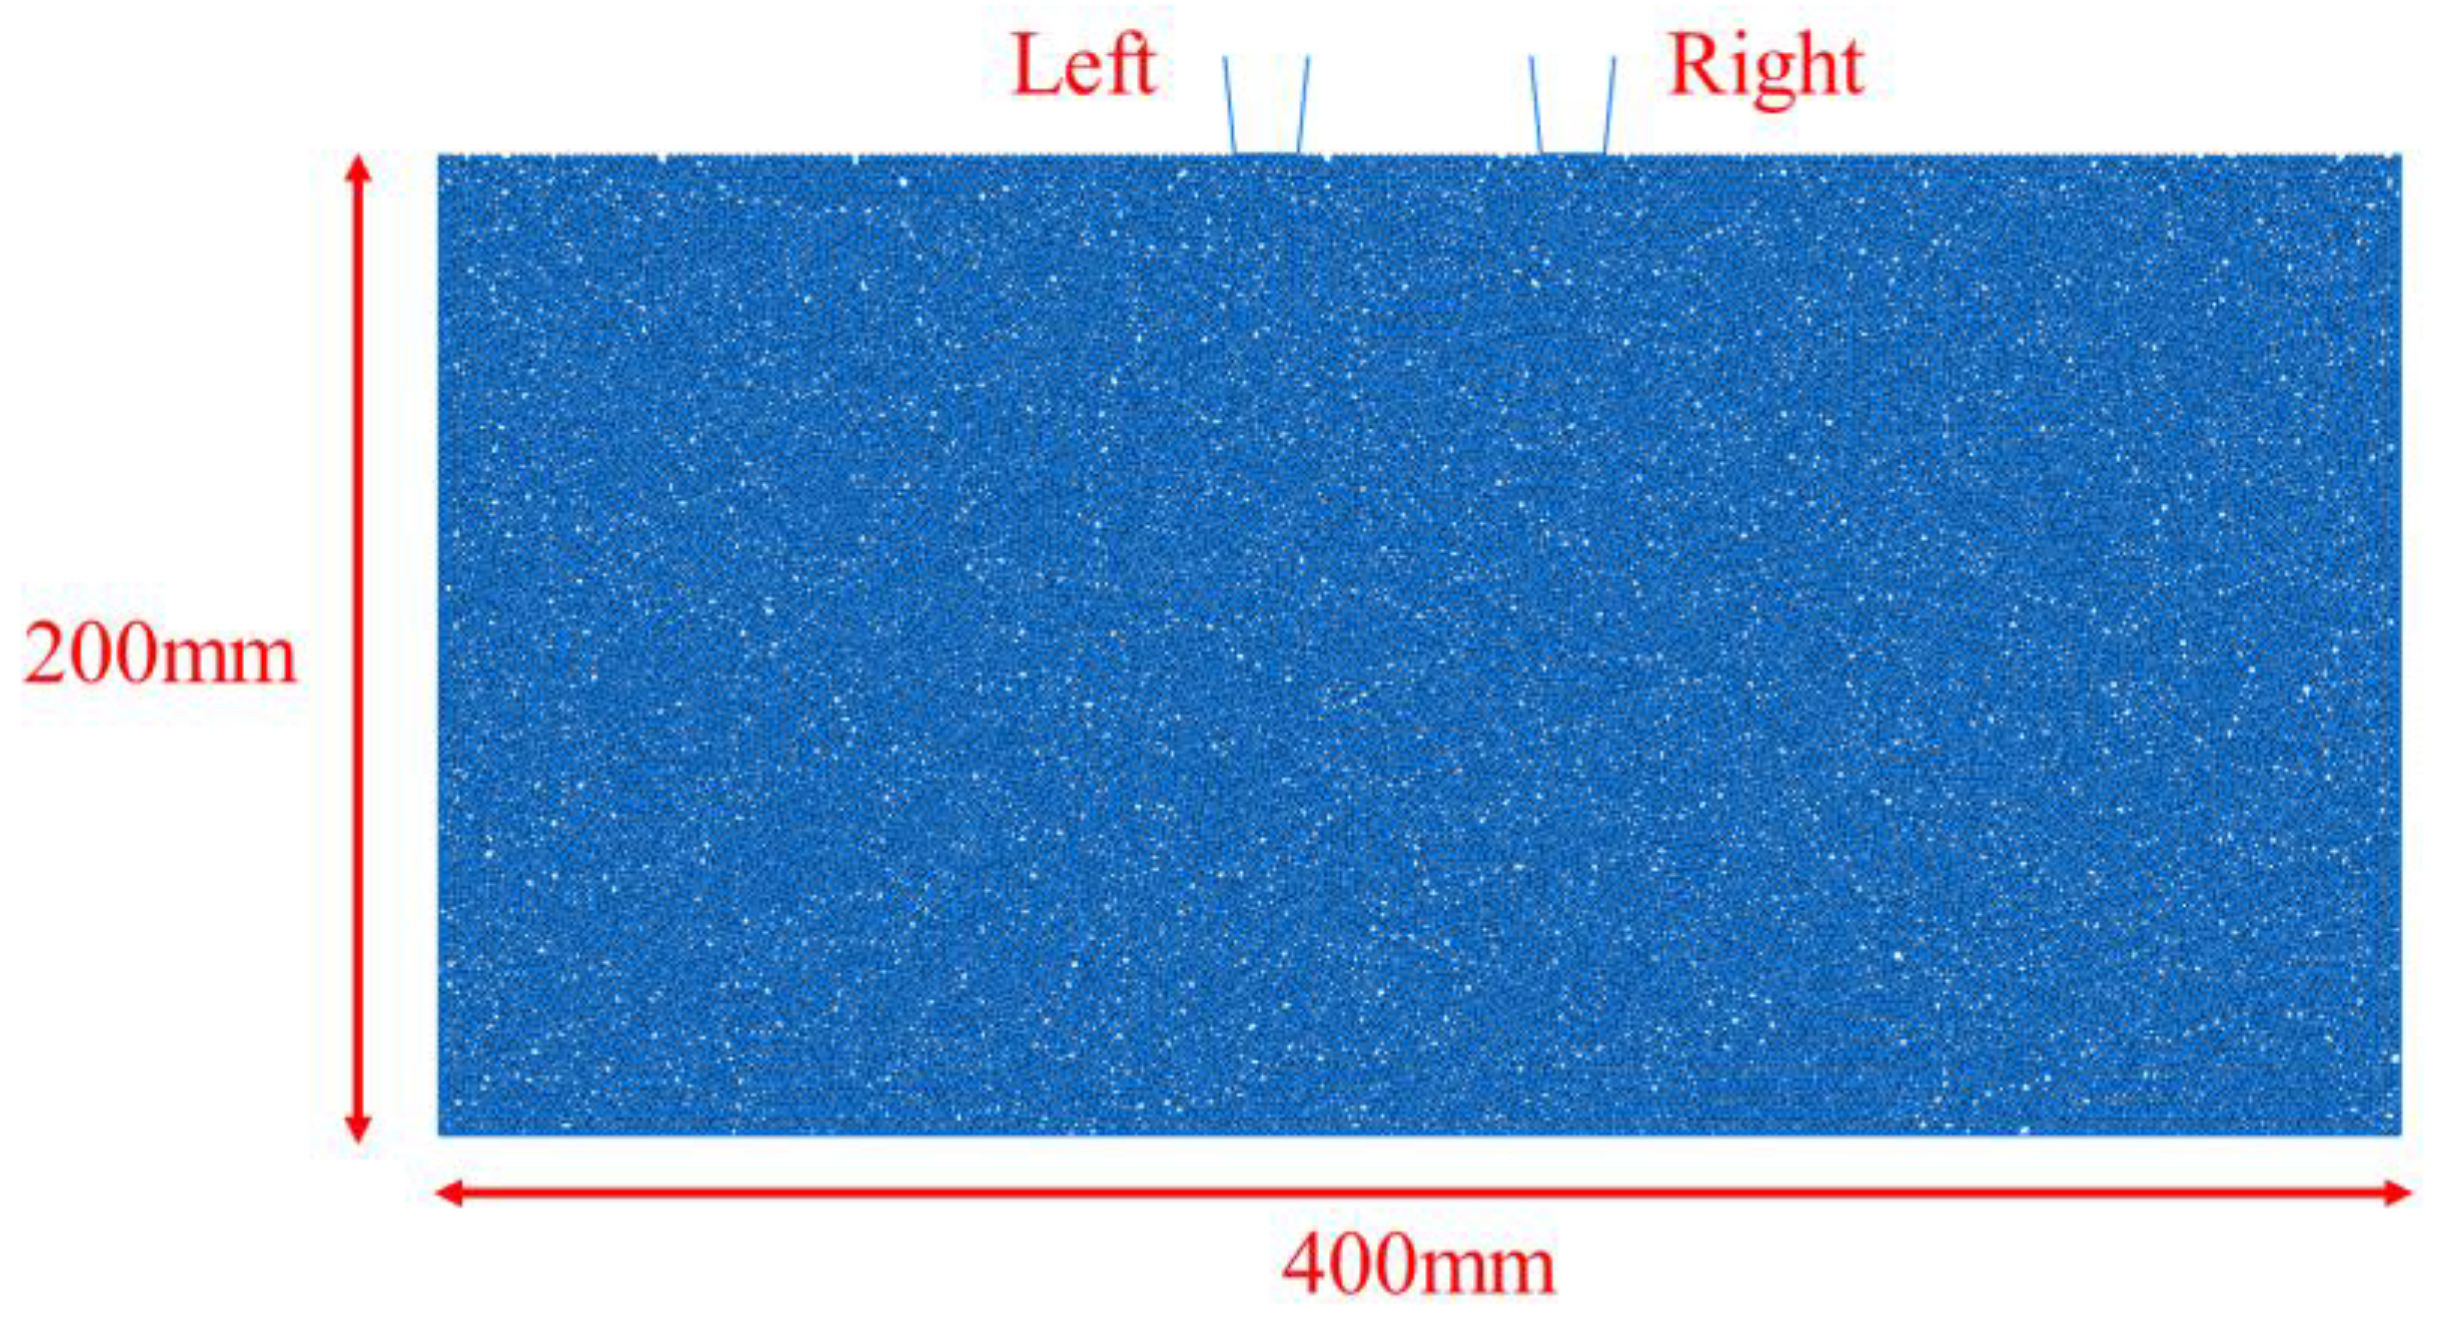
35] analyzed the fracture behavior of TBM disc cutter penetration in different jointed rock masses using a digital image method. In this section, a comparison between the cutting forces estimated, based on numerical simulation, using two- and three-dimensional models in PFC was conducted to see the impact of modeling in two and three dimensions on the results.
Figure 18 shows a screenshot of the two-dimensional numerical model in PFC. A rock specimen with dimensions of 400 mm × 200 mm was used for modeling where the discs were pressed to penetrate the rock. Overall, six sets of numerical simulations, with spacings of 62.5 and 75 mm and penetrations of 3.2, 4.4, and 6.4 mm, were conducted.
To determine the speed in the two-dimensional numerical model, a series of five simulations with a penetration velocity of 1, 0.5, 0.1, 0.05, and 0.01 m/s were run. The examination of the effect of speed assumed a spacing of 62.5 mm and a penetration of 3.2 mm.
Figure 19 shows the results for the calculation time and mean normal force at different speeds. To optimize the tradeoff between the calculation time and accuracy, we set the penetration speed for the follow-up simulations at 0.1 m/s.
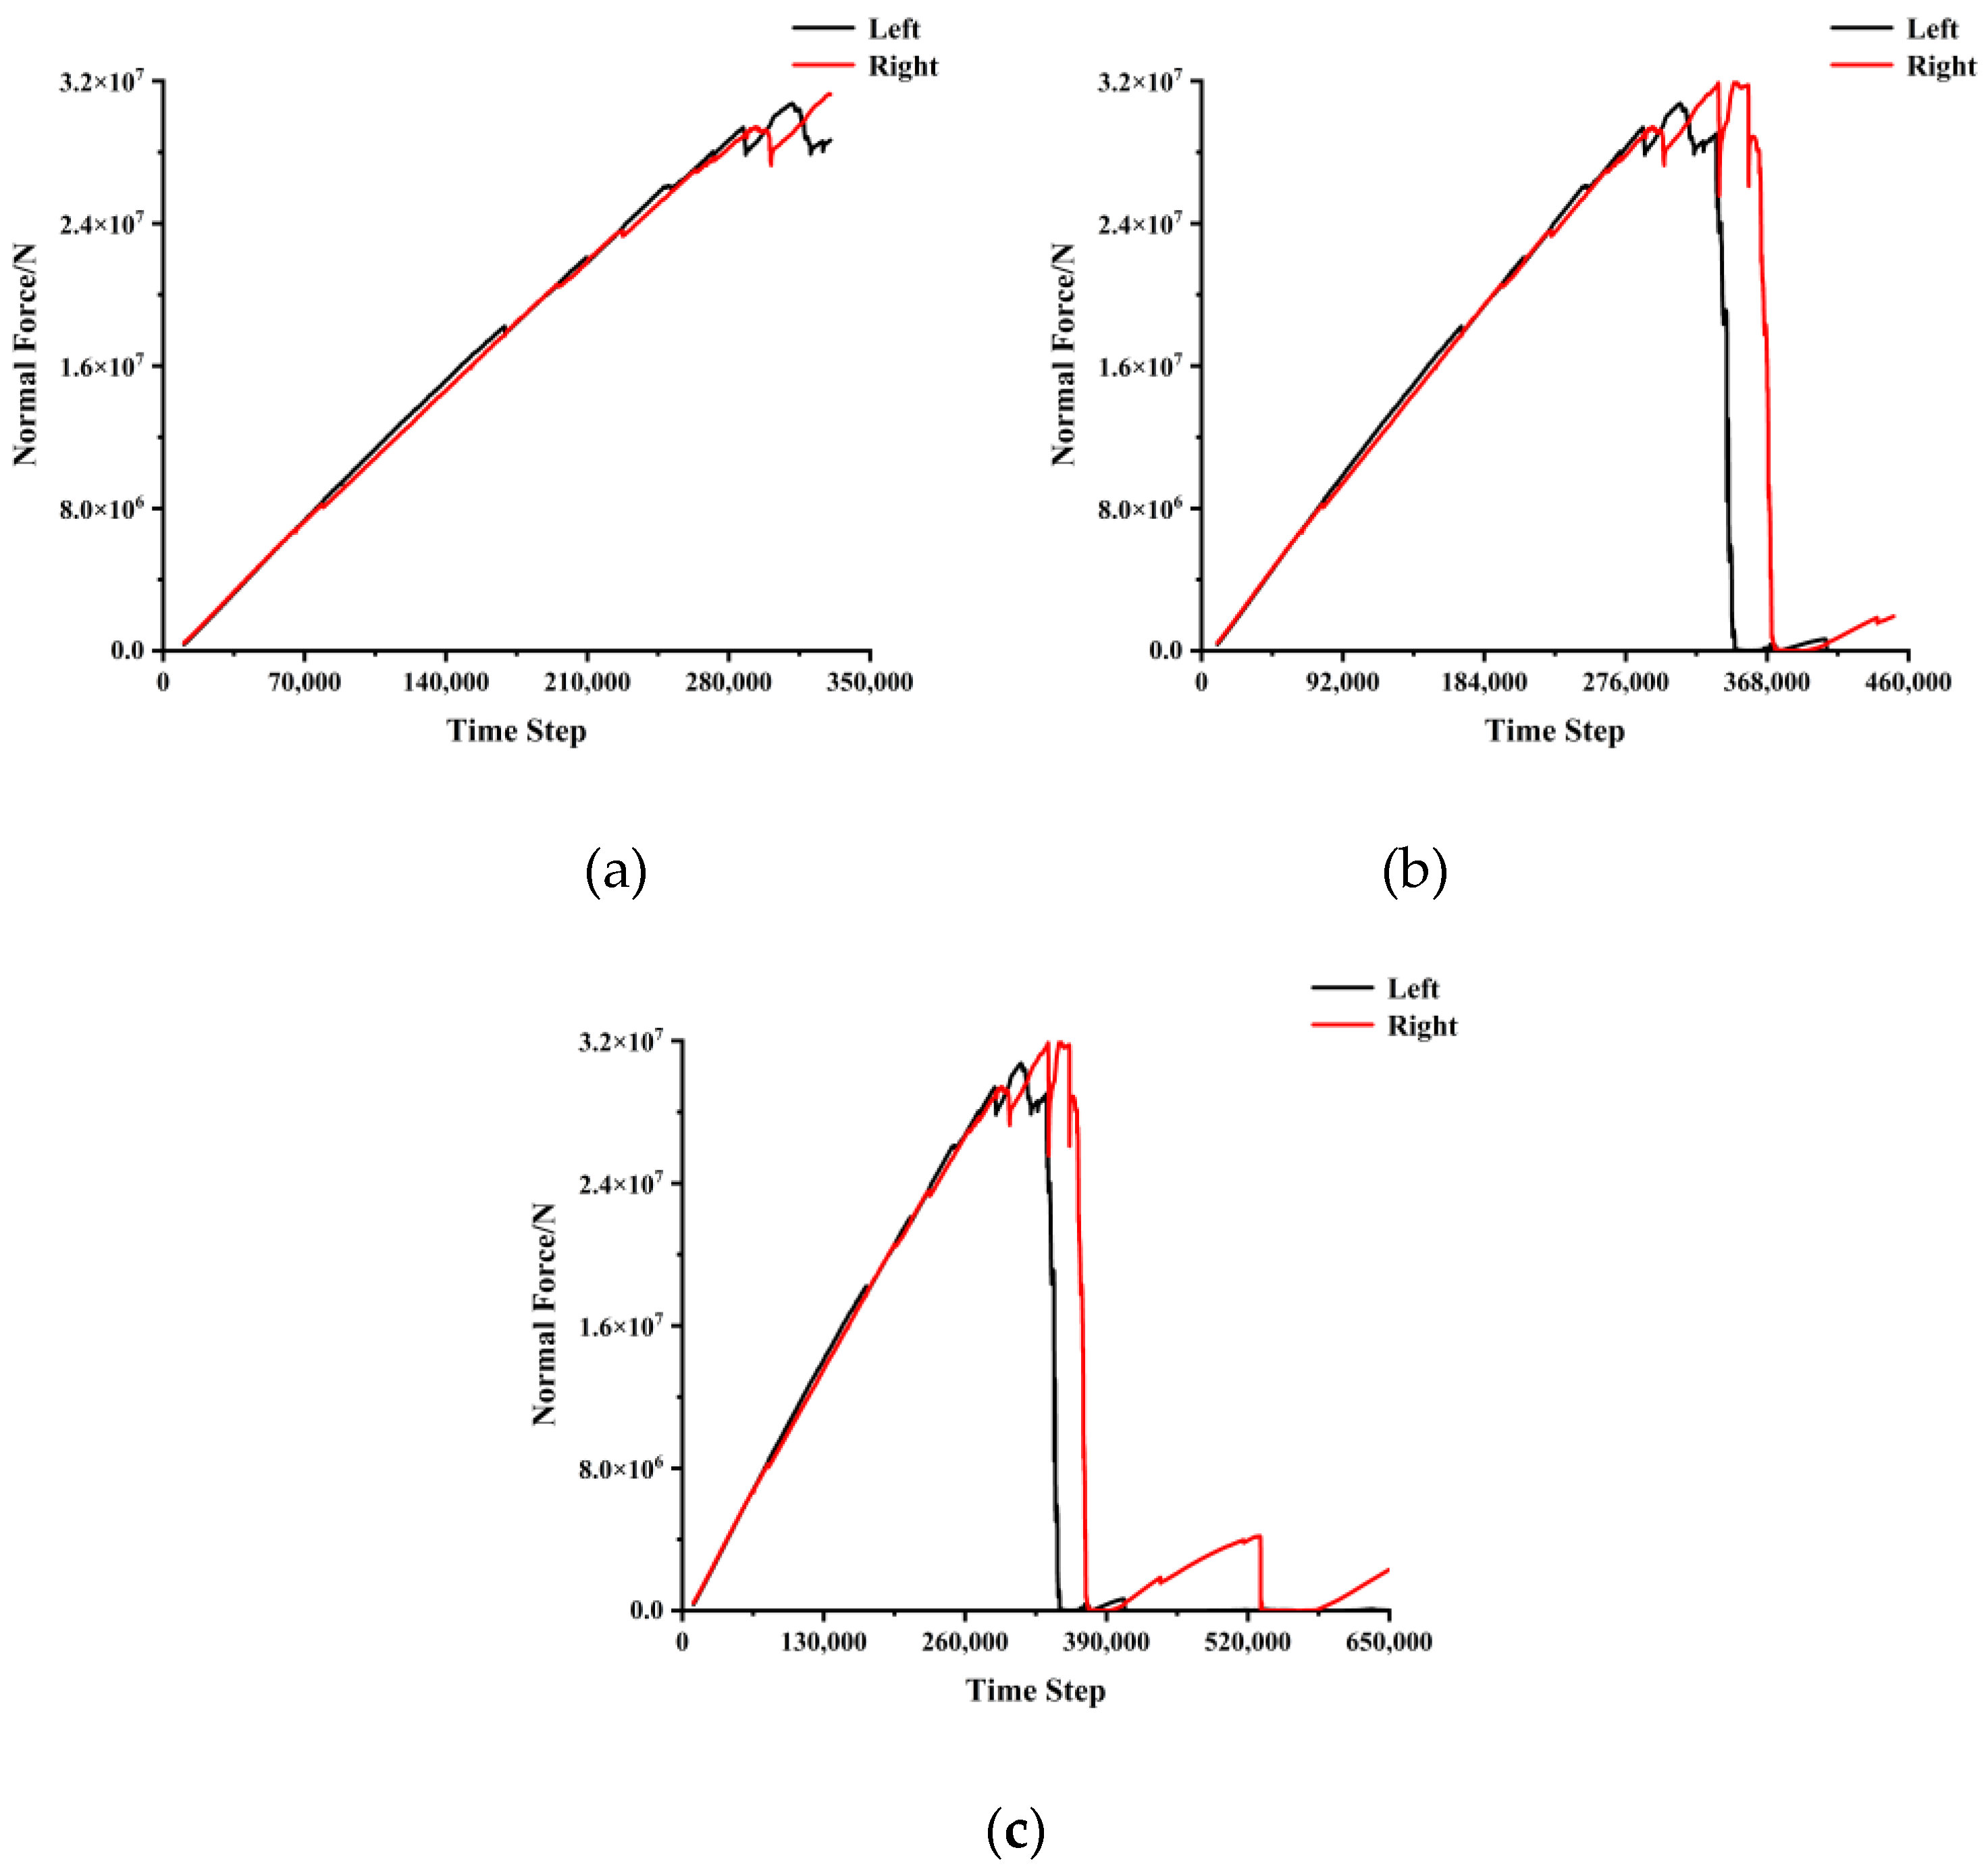
The normal forces of the disc cutters were recorded during the indentation process and
Figure 20 shows the results at a spacing of 62.5 mm. When the penetration was 4.4 or 6.4 mm, the normal force first reached the maximum value and then dropped. This shows that the rock specimen was damaged when the penetration was greater than 4.4 mm and that a crack and subsequent chips were formed, meaning that the pressure in the crushed zone or pressure bubble was released. However, the force should not, logically, then drop to zero as was observed in the simulations, since there is still contact, and some pressure is acting on the disc. The build-up of the pressure and the drop in pressure, which forms a saw-tooth pattern, is very common in the punch test.
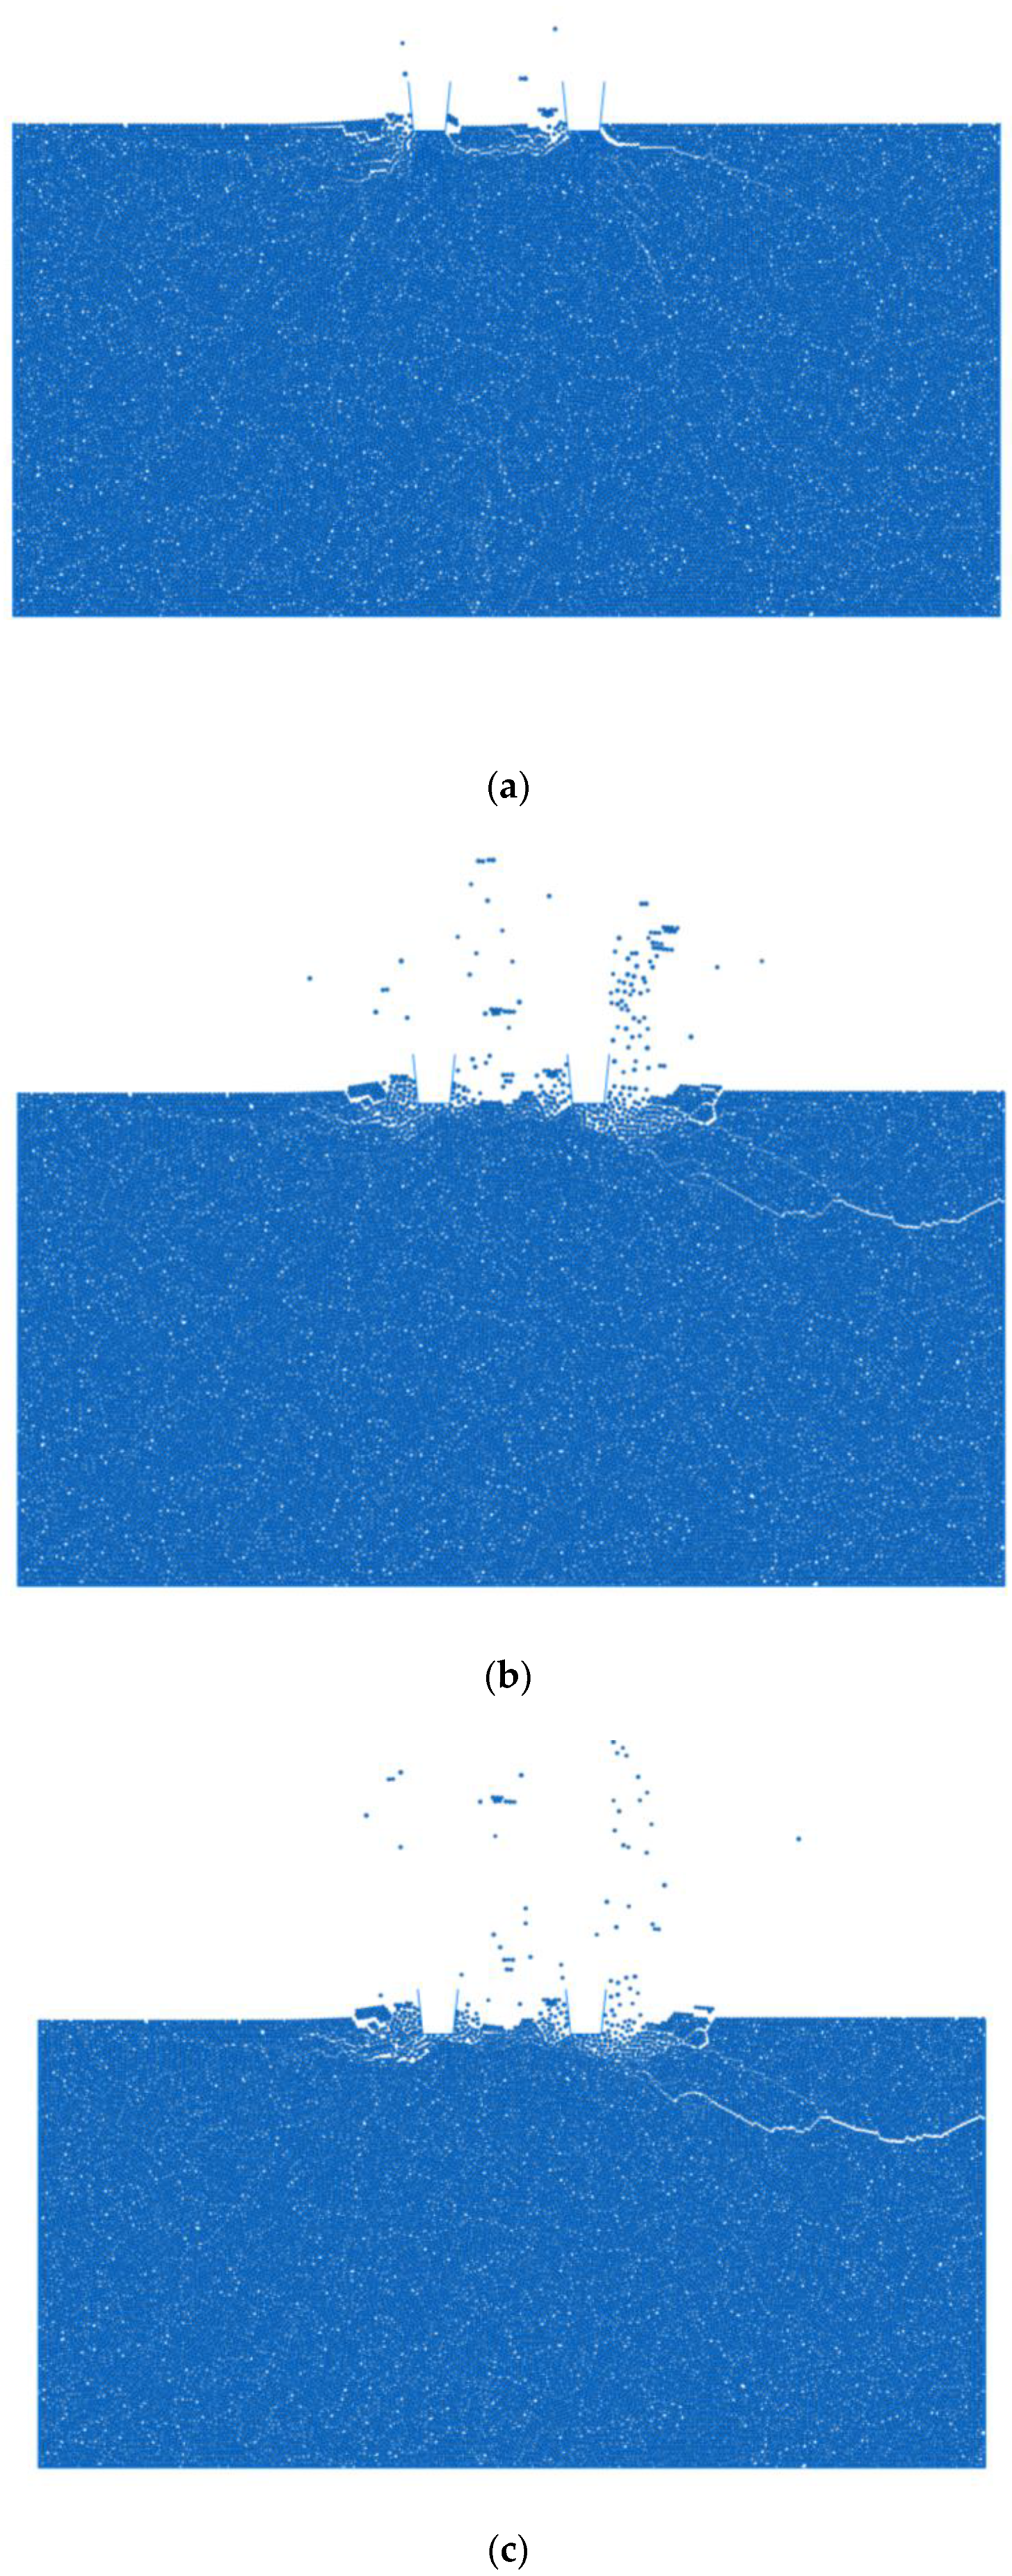
The normal force calculated in the two-dimensional models was greater than the measured values in the LCM tests. This is because the mechanisms of the two methods were different. In the LCM tests, the rock specimens were cut with gradually increasing penetration. In the two-dimensional numerical simulations, the rock was pressed in a similar way to the punch penetration test, but by assuming the indentation by two relatively dull disc cutters. In addition, the hidden assumption in the two-dimensional model is the continuation of the disc tip profile in the third dimension, which, in reality, is not true. Therefore, the two-dimensional numerical model could not simulate the LCM tests and so determining the optimal cutting geometry using the two-dimensional model would be problematic. According to
Figure 21, the fracture propagation pattern was different for the different penetrations. Thus, working from the simulation of the crack propagation pattern could only offer a qualitative assessment of the cutting process and not a quantitative measure of the cutting efficiency. However, the three-dimensional numerical model was more accurate and could offer an assessment of cutting conditions when comparing different disc-cutter geometries or different rock types, and could help in the calculation of SE to determine the optimal cutting geometry.
In this research, we compared two different dimensional DEM models of TBM disc-cutter rock fragmentation and analyzed the advantages and disadvantages of the two-dimensional and three-dimensional numerical models. However, modeling the TBM disc cutter when cutting rock is still in its infancy, and there are still many issues that need to be further studied. For example, because of the existing computational limits, PFC models cannot be used for the simulation of full-scale tests. This study’s numerical model only simulated part of the process of disc-cutter rock fragmentation. In order to fully reproduce the process of the TBM cutting rock, the numerical simulation computational power needs to be improved. On the other hand, natural rocks have complex structures and contain joints and cracks. These components of natural rocks are hard to simulate in numerical simulation models. This is also an important reason for the difference between the numerical simulation results and experimental results. Therefore, it is necessary to carry out further and more accurate numerical studies on rock structures in detail.
5. Conclusions
Discrete element models in PFC3D and PFC2D were used to simulate rock fragmentation when using disc cutters in different configurations. FJCM was used to simulate the rock specimen and offer more realistic fracturing behavior in the context of rock excavation, where the contact parameters could be better controlled to show the behavior of rock, as measured by typical rock mechanics testing. The cutting force calculated under various conditions could be used to calculate the SE for various disc-cutter spacings and penetrations. The numerical simulation results were verified in two stages, one by comparing the calculated results with the results of rock mechanics testing, thus determining the mesoscopic parameters for the PFC models. This level of verification was used to compare the results of the numerical analysis with full-scale rock-cutting tests using LCM data for a selected granite (CRG) at the CSM rock excavation laboratory. The recorded force in the LCM tests was slightly lower than the forces calculated in the numerical simulations. The rolling coefficients of RC and SE showed the same trends as the LCM tests, which validates the numerical simulation results.
The differences between the two- and three-dimensional numerical models were also examined. While the two-dimensional numerical model allowed for tracking the crack development, the calculated values were different from the full-scale test results. This means that they could be used for the qualitative evaluation of the fracturing process. Three-dimensional PFC models were more realistic and could be used to estimate the forces and SE. The results of this research could help in predicting the cutting forces and, hence, in estimating the performance of TBMs in specific rock conditions. Furthermore, the model can be used in the future to simulate rock anisotropy and jointing, to allow for the estimation of cutting forces, SE, and machine performance under more realistic natural conditions. Besides this, the modeling can also assist in improvements in disc-cutter design.
Due to the existing computational limits, PFC models cannot be used for the simulation of full-scale tests, such as LCM testing. However, these limitations could be overcome by using additional computational power, which would permit the simulation of more complex cutting conditions that could help in making further advances in rock-cutting technology.


 ,
, 


