Abstract
The primary goal of the construction industries worldwide is to improve material durability and achieve sustainability. In recent years of sustainable cement industry innovation, alkali-activated cement has emerged as one of the most promising alternatives to ordinary Portland cement (OPC). In terms of durability, corrosion of steel is a significant problem and has become a major cause of deterioration of reinforced concrete structures worldwide. Thus, structural health monitoring techniques are essential to monitor the corrosion in real-time to avoid unexpected failure since civil engineering structures serve as a crucial pillar of the economy. This paper presents through an experimental campaign a novel method of automatically monitoring the performance of alkali-activated concrete (AAC) and ordinary Portland cement concrete (OPCC) under chloride-induced corrosion conditions using an embedded piezo sensor (EPS) based on the electro-mechanical impedance (EMI) technique. AAC was produced using alkali silicate-activated fly ash and ground granulated blast furnace slag. The accelerated corrosion tests were conducted on reinforced AAC and OPCC specimens in which the EPS was attached to reinforcing steel bars inside the specimens to monitor the changes in the EMI signature during the corrosion progression. To quantify the damage due to chloride-induced corrosion, statistical damage indices such as root mean square deviation were calculated. Further, the deterioration in structural parameters was identified by extracting the equivalent structural parameters (ESPs) such as stiffness, mass and damping from the raw EMI signatures. Based on qualitative and quantitative results, it can be seen that the changes in raw signature and damage in AAC were lower than OPCC. The deterioration in term of stiffness loss was found to be 39.35% in OPCC and 12.73% in AAC. Hence, it is demonstrated that the AAC exhibits a superior corrosion resistance to OPCC.
1. Introduction
The built environment accounts for roughly 50% of annual global CO2 emissions, of which embodied carbon (the carbon produced during the construction of structures) from building material and the construction industry is responsible for 20%, while building (residential and non-residential) operations are responsible for 27% [1,2,3]. To reduce these emissions, concrete technologists, scientists and engineers are engineering various types of innovative binders such as limestone-calcined clay cement (LC3) [4], alkali-activated materials (AAMs) [5,6,7,8] and calcium sulfoaluminate cement [9] for application in construction. Among them, AAMs have outstanding potential to achieve high mechanical strength at early curing ages, resistance to elevated temperature [10], high stability in aggressive environments along with low energy consumption and low carbon-dioxide emission [11]. These properties have made concretes based on alkali-activated binders a very interesting alternative for OPCC, and the substitution of OPCC by AAMs is viable for specific applications only. However, for civil engineering infrastructures, durability is the main concern as it affects the service life when an aggressive environmental agent reaches the reinforcement by de-passivating the protective layer, affecting the safety and serviceability of the reinforced concrete structures (RCSs). Furthermore, because of the degradation of corrosion pits, chloride-induced pitting corrosion is frequently regarded to be more severe than carbonation-induced uniform corrosion for reinforcing steel in ordinary Portland cement concrete (OPCC). Evaluation of the durability of AAMs when subjected to aggressive environments is of particular importance for their use in RCSs. So far, various researchers have evaluated and identified the mechanical fracture properties [12]; the effect of binder content [11]; the use of copper slag as fine aggregate [13]; the effect of the treatment method and curing time on the microstructure [14]; electrochemical performance in presence of chlorides [15]; chloride and transport properties (by measuring the electrical resistivity, non-steady state chloride diffusivity, rate of corrosion, onset of corrosion and pore solution chemistry) [16] and long-term corrosion resistance [17] on the performance of RCSs made with AMMs. For the durability-related issues, the techniques used for monitoring the corrosion condition of reinforcing steel bars in concrete are either direct or indirect, and sensor systems include half-cell potential sensors [18], concrete resistivity measurement sensors, macro- and microcell sensors, linear polarization resistance (LPR) sensors [19], galvanostatic pulse technique (GPT) sensors, electrochemical impedance spectroscopy (EIS) sensors [20], chloride monitoring sensors, pH-sensors, fiberoptic sensors (FOSs) and the electro-mechanical impedance (EMI) technique based on piezo sensors [21,22,23,24,25]. Among them, the EMI technique utilizing piezo sensors, which has a dual capacity of sensing and actuating, has shown promising results in almost all applications of civil engineering, including strength development monitoring during the curing process [26,27], deterioration monitoring in terms of equivalent structural parameters due to corrosion in RCSs and prestressed concrete structures [21,22], health monitoring in RCS impact loading [28] and damage due to tightening and loosening of bolts [29]. Pioneering studies were performed by Talakokula et al. [30,31,32] in extending the applications of the EMI technique to corrosion in RCSs by developing physical models based on the equivalent structural parameters for both chloride- and carbonation-induced corrosion in rebars, thereby circumventing the determination of actual structural parameters, which is either very difficult or impossible. Sriramadasu et al. [33] identified incipient pitting corrosion in RCSs using guided waves and piezoelectric wafer transducers. They found that the mechanism of the corrosion process can be established from the signal characteristics of the longitudinal and flexural-guided wave mode. Huo et al. [34] presented a corrosion detection method of steel bars based on a piezoceramic-transducer-enabled time reversal method and found that the signal recorded by the piezoceramic transducers changed linearly with the mass loss ratio of the reinforcement bar. Recently, Bansal et al. [35] identified the equivalent stiffness loss in concrete systems (OPC and LC3) with the chloride effect and combined effect (chlorination attack and compression loading) using piezo sensors. Their results showed that chloride penetration in both concrete systems with the combined loading effect is lower than ideal; however, LC3 is more corrosion resistant than OPC.
In the existing literature, studies on corrosion monitoring mainly focus on RCSs made with OPCC, with only a few covering the use of SCMs. The study by Talakokula et al. [30,31,32] identified the equivalent structural parameters (ESPs) to analyze the mechanical changes in the structure during the corrosion progression; however, this study is limited to RCSs made with OPC. In real-life practice, the RCSs are made up of different concretes involving AAC, therefore, it is necessary to understand the performance of AAC under chloride-induced corrosion conditions, and there is a need for a structural health monitoring technique to monitor the corrosion in real-time. Hence, the novelty of this study is that it focuses on automatic monitoring of the performance of AAC under chloride-induced corrosion conditions using an embedded piezo sensor (EPS) based on the electro-mechanical impedance (EMI) technique. The statistical indices such as RMSD of the conductance signature during the corrosion progression were analyzed, discussed and compared to OPCC reference systems. Furthermore, ESPs were extracted from the coupled EMI signature to collect more realistic information about mechanical changes occurring during the corrosion progression of AAC and OPCC.
2. Materials and Methods
2.1. Materials and Concrete Specimens
Reinforced steel bars, 16 mm in diameter, conforming to grade Fe 500 high yield strength deformed (HYSD) conforming to IS 1786 (2008) [36] were used, and their physical and chemical composition includes carbon 0.3%, sulfur 0.055%, phosphorous 0.055%, elongation 12%, carbon equivalent 0.42% and yield stress 500 N/mm2. Ordinary Portland cement, 43 grade, class F fly ash and ground granulated blast furnace slag (GGBFS) were used for preparing the OPCC and AAC. The images of powdered OPC, FA and GGBFS are shown in Figure 1. Sand obtained from Raipur City, India, with maximum size of 4.75 mm, zone II, specific gravity of 2.71 and water absorption of 2.04% was used as the fine aggregate (FA). Crushed stone of 10 and 20 mm obtained from Raipur, India, with specific gravity of 2.54 and water absorption of 0.6%, was used as the coarse aggregate (CA) conforming to IS 2386-3 (1963) [37]. Tap water was used as mixing water for OPCC. For preparing the AAC, an alkali activator with a 2.5 Na2SiO3/NaOH molarity ratio was prepared by mixing sodium silicate solution, sodium hydroxide solution and distilled water. The chemical composition of GGBFS is shown in Table 1. The specific gravity of Na2SiO3 and NaOH is 1.6 and 1.47, respectively. The sodium silicate solution consists of SiO2 = 29.4%, Na2O = 11.4% and water = 55.9%. The purity of sodium hydroxide flakes is 98% to 99%. The mix design of OPCC conforming to IS 10262 (2009) [38] and AAC [39] is shown in Table 2. The schematic diagram of the cylindrical concrete specimen with 100 mm diameter and 150 mm height with an embedded steel bar is shown in Figure 2. An embedded piezo sensor (PZT patch sandwich between the mortar and epoxy layers) was attached to the steel bar to monitor the deterioration during the corrosion process. The specification of PZT 5H is shown in Table 3. After casting, the concrete specimens were cured at the ambient temperature for 28 days.
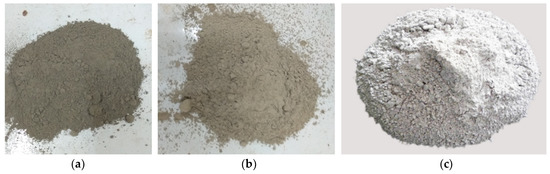
Figure 1.
Images of powdered (a) OPC, (b) fly ash and (c) GGBFS.

Table 1.
Chemical composition of GGBFS.
Table 2.
Mix proportion of OPCC and AAC.
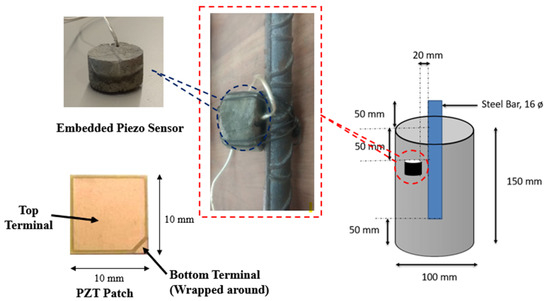
Figure 2.
Schematic representation of cylindrical reinforced concrete specimen.
Table 3.
Properties of used PZT patches.
2.2. Accelerated Corrosion Test
After 28 days of curing, the bottom end of the specimens was sealed with epoxy coating to avoid the transport of aggressive chloride ions. Later, OPCC and AAC specimens with an embedded reinforcing bar were dipped in brine solution (3.5% by weight NaCl solution) for 115 days for accelerated corrosion as shown in Figure 3. The height of the specimens dipped in the brine solution was 70% of the original height. To accelerate the corrosion process, an electrical loop was developed in which the steel bar acted as the anode and a copper rod as a cathode. A constant 12 V of voltage was applied throughout the specimens to accelerate the process.
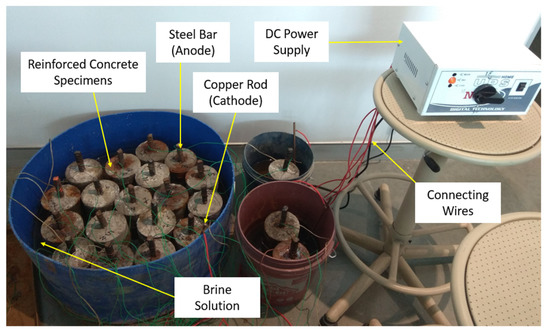
Figure 3.
Accelerated chloride-induced corrosion exposure setup.
2.3. EMI Technique
The EMI technique was employed for monitoring the corrosion process. In this technique, a high-strength epoxy adhesive is used to attach a PZT patch to the host structure. An inductance–capacitance–resistance (LCR) meter is then used to electrically excite the PZT patch between the 30 to 300 kHz frequency range to acquire the admittance signatures in the form of conductance vs. frequency and susceptance vs. frequency. The LCR meter measures the electrical signals obtained from the PZT sensor in terms of electro-mechanical admittance, representing the electrical and structural mechanical impedance of the piezo sensor and the specimen, respectively. The electro-mechanical admittance deviation measured various time intervals from the sensor indicates a change or shift in the specimen/host structure’s mechanical properties. Any change in mechanical impedance of the structure is detected by the patch (attached to the host structure) since the electrical impedance of the patch and mechanical impedance of the structure are related and can be represented by the following equation [40].
where G is the conductance; B is the susceptance with its imaginary unit (j); w is the width, l is the length, and h is the thickness of the PZT patch; ω is the angular frequency; are the effective mechanical impedance of the structure and PZT patch respectively; is Poisson’s ratio,); is the complex electric permittivity of the PZT patch (at constant stress); is the complex Young’s modulus of the PZT patch (at constant electric field); is the piezoelectric strain coefficient and is the complex tangent ratio.
2.4. Data Acquisition
By using this technique, the EMI data in the form of conductance and susceptance were acquired at the baseline or healthy state and during the corrosion period up to 115 days using an LCR meter as shown in Figure 4. The baseline signatures for OPCC and AAC are shown in Figure 5. To acquire the signatures, the specimens were taken out of the accelerated corrosion setup and dried at room temperature for half an hour. The measurement was taken at standard room temperature to avoid the temperature effect on the EMI signature. To ensure the repeatability of the signature, each specimen was measured thrice. The entire experimental campaign layout shown in Figure 6.
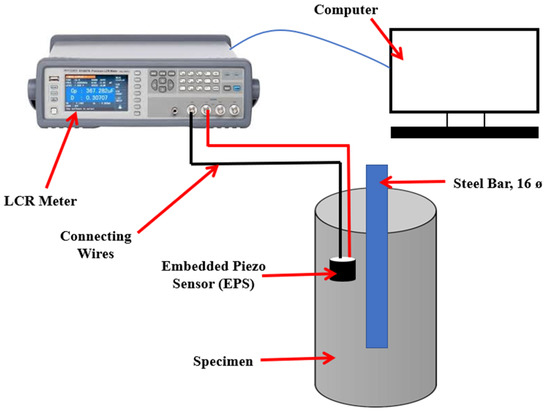
Figure 4.
EMI signature data acquisition setup.
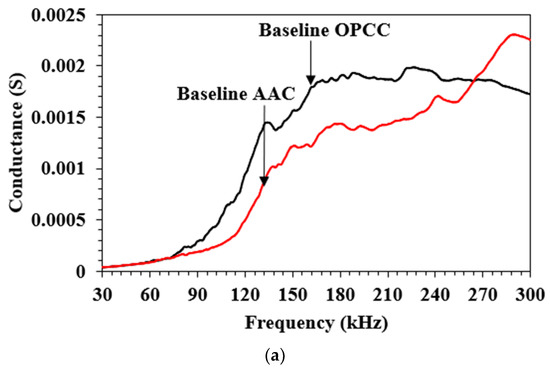
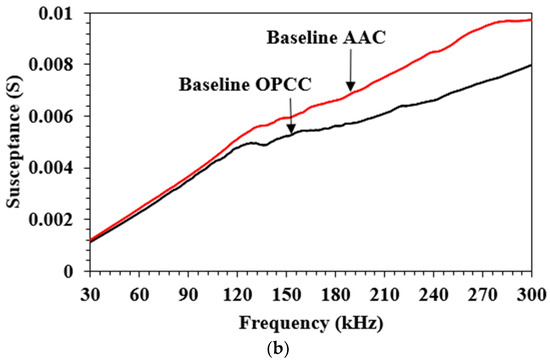
Figure 5.
Baseline signature of OPCC and AAC. (a) Conductance vs. frequency, (b) susceptance vs. frequency.
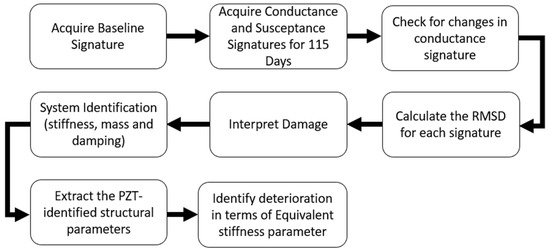
Figure 6.
The experimental campaign layout.
2.5. Statistical Indices
The statistical parameter root mean square deviation (RMSD), which has been established in numerous structural health monitoring (SHM) fields [41,42], was calculated for the quantification of EMI signature. The RMSD is expressed by:
including conductance or resistance of the PZT patch during the hydration process ) and the baseline value ), with i representing the frequency index.
2.6. Extraction of Equivalent Structural Parameters
To gain a better understanding of chloride-induced corrosion deterioration, an equivalent stiffness parameter (ESP) was identified from the raw signatures (conductance and susceptance) by developing a physical model based on spring, mass and the damper element and correlating it with the corrosion initiation phase and visual inspection. Using Equation (1) as mentioned in Section 2.3, the effective mechanical impedance (Zs, eff = x + yj) of the host structure can be divided into its real and imaginary components, which may provide critical information on the behavior of the deteriorating host structure. This well-established concept has been successfully implemented by several researchers [23,31,35,43,44,45] and has been proven to be successful in damage detection, where ‘x’ represents the real part and ‘y’ represents the imaginary parts of structural mechanical impedance. In order to identify an equivalent system based on the impedance plots provided by Hixon (1998) [46], ‘x’ and ‘y’ for all specimens were computed and plotted versus frequency to monitor variation in the structure’s physical properties.
3. Results and Discussion
This section covers the results and discussion on the qualitative analysis of piezo signature changes during the corrosion progression. Further, the quantitative analysis in the form of RMSD is discussed. The deterioration analysis based on equivalent structural parameters (ESPs) is also discussed by extracting the equivalent stiffness, mass and damping parameters.
3.1. Analysis Based on EMI Signature
The changes in conductance signature during accelerated chloride-induced corrosion at different time intervals for a typical OPCC specimen in a frequency range of 30 to 300 kHz is shown in Figure 7. It can be observed that the trend of conductance signatures shifts in the right-upwards direction from the baseline signature during the corrosion exposure period. Figure 8 shows the resonance peak frequency and conductance value shift during accelerated chloride-induced corrosion of OPCC. It can be observed that the amplitudes of the resonance peak increase significantly (0.0014 to 0.0022 S) up to 14 days, whereas as the corrosion progresses, this amplitude value increases up to 0.0037 S during the period of 115 days. In terms of the resonance frequency, which shows a good correlation with the corrosion progression, the resonance frequency presents a significant increase (130 to 260 kHz) up to 14 days; afterwards, it decreases and reaches 200 kHz during the period of 115 days. Upon visual observation of the specimens, it can be seen that the OPCC shows mild rust particles on the surface along with a minor crack at 14 days of corrosion exposure. As the corrosion progressed, the width of the crack was increased, and the mild exposure stage converted into the severe stage which is clearly visible in Figure 9. In the case of AAC, the variation in the amplitude and frequency at the resonance peak is different in comparison to the OPCC specimen as shown in Figure 10 and Figure 11. The resonance frequency (180 to 240 kHz) and its amplitude in terms of conductance value (0.0014 to 0.0023 S) presents a significant increase up to 60 days; afterwards, it follows a minimal increment in resonance frequency (240 to 242 kHz) shift and amplitude (0.0023 to 0.0025 S) during the period of 115 days. From the visual observation of the specimens, only mild rust formation on the surface of the specimen was seen after 60 days of exposure and moderate corrosion at 115 days (Figure 12). Hence, based on visual observation of the specimens and the analysis of the raw signatures for both OPCC and AAC specimens, it can be concluded that the EPS records the changes effectively, and the resonance frequency shift indicates a good correlation with the mild, moderate and severe corrosion formation in the specimens.
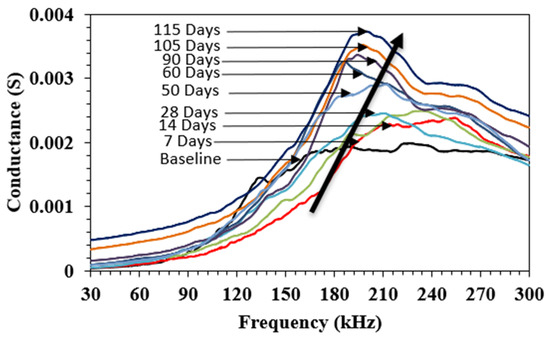
Figure 7.
Changes in conductance signature during accelerated chloride-induced corrosion exposure for OPCC.
Figure 8.
Resonance peak frequency and conductance value shift during accelerated chloride-induced corrosion of OPCC.
Figure 9.
Condition of the specimens during corrosion exposure period of OPCC.
Figure 10.
Changes in conductance signature during accelerated chloride-induced corrosion exposure for AAC.
Figure 11.
Resonance peak frequency and conductance value shift during accelerated chloride-induced corrosion of AAC.
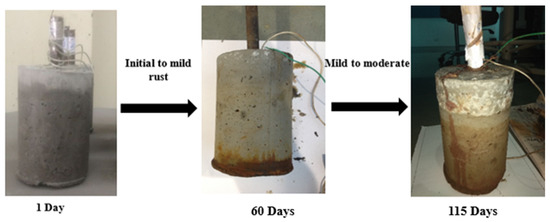
Figure 12.
Condition of the specimens during corrosion exposure period of AAC.
3.2. Analysis Based on Statistical Indices
In quantitative analysis, a significant increment is also found in RMSD value, which is about 27% in AAC with respect to the baseline value during the 14 days of corrosion exposure; after that, it reaches 33% in the period of 115 days, which indicates a gradual increment as shown in Figure 13. Upon comparing the RMSD indices of OPCC and AAC as shown in Figure 14, it was found that the RMSD value of OPCC is about 61% in the period of 115 days of corrosion exposure, while AAC is about 33%. These values show that the variation in terms of RMSD values is significant in OPCC when compared to AAC. From the raw signatures and visual observations, it was also confirmed that the changes are significant and exhibit more severe rust formation in OPPC in comparison to AAC. Hence, from all these observations, it is concluded that damage due to chloride-induced corrosion is higher in OPCC than AAC, and the sensor embedded inside the RC specimens is able to capture the damage well as the corrosion progresses.
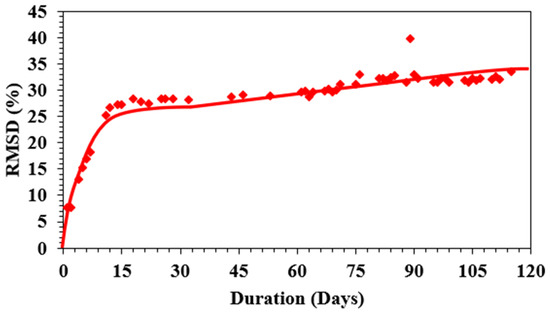
Figure 13.
Changes of RMSD during accelerated chloride-induced corrosion exposure for AAC.
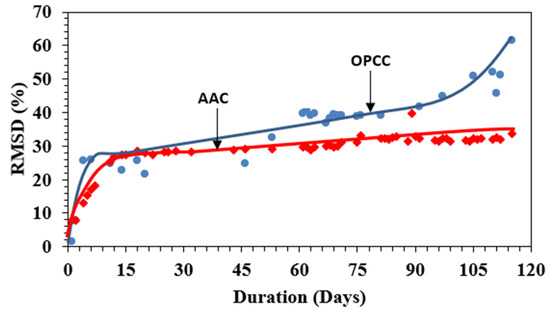
Figure 14.
Comparison of changes in RMSD for OPCC and AAC.
3.3. Analysis Based on Equivalent Structural Parameters
In this study, an equivalent system consisting of the spring element (k), mass (m) and damper element (c) in a series combination was chosen because it exhibits similar trends to the experimental system under close observation of ‘x’ and ‘y’ in a healthy state with a frequency range of 220 to 280 kHz for both OPCC and AAC. The result of the comparison between experimental and equivalent plots of OPCC is shown in Figure 15. The expression of ‘x’ and ‘y’ are shown in Table 4.
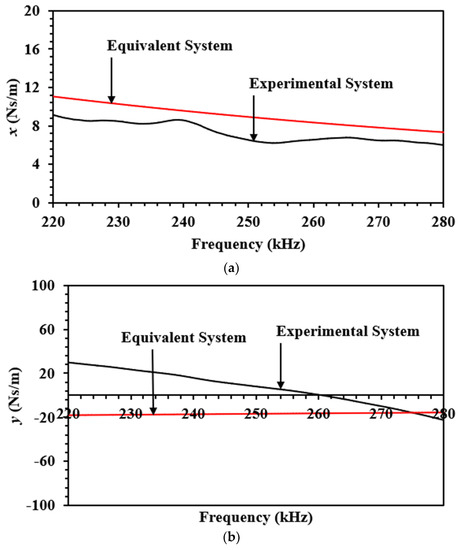
Figure 15.
Comparison of experimental and equivalent plots. (a) Variation of ‘x’ vs. frequency, (b) variation of ‘y’ vs. frequency.
Table 4.
Identified series combination of spring, mass and damper element.
The automatically identified deterioration of the equivalent stiffness parameter (ESP) during accelerated chloride-induced corrosion exposure for AAC at different intervals is shown in Figure 16a. It can be observed in Figure 16 that the equivalent stiffness (k) decreases with the increase in corrosion exposure period. At the age of 7 days, the decrease in k values from baseline ranged from 4100 to 3883.34 Ns/m, while at 60 days it was 4100 3665.70 Ns/m, and at 115 days it was 4100–3578.05 Ns/m (stiffness loss = 12.73%) in AAC. This finding indicates that the equivalent stiffness was reduced significantly up to 60 days, whereas further reductions in stiffness values were minimal as the corrosion progressed up to 115 days. This is due to the fact that the initial changes up to 60 days were captured well by the EPS. Similar observations were also noticed by Talakokula et al. [32] while assessing the corrosion in reinforced concrete structures using the EPS as shown in Figure 16b. The visual observation of the specimens also confirms that the mild rust formation on the surface of the specimen at 60 days and moderate corrosion at 115 days, as shown in Figure 12. The comparison of deterioration in terms of equivalent stiffness parameter during accelerated chloride-induced corrosion exposure for OPCC and AAC is shown in Figure 17. It can be observed in Figure 17 that the equivalent stiffness (k) decreases with corrosion progression up to 32 days, while afterwards it becomes constant. At the age of 7 days, the decrease in k values from baseline ranges from 5172.37 to 5121.45 Ns/m, while at 28 days it ranges from 5172.37 to 4390.90 Ns/m and at 115 days between 5172.37 and 3136.90 Ns/m (stiffness loss = 39.35%). This finding indicates that the deterioration in terms of stiffness loss at 115 days of AAC is lower than OPCC, and therefore AAC is more corrosion resistant than conventional concrete made with OPC.
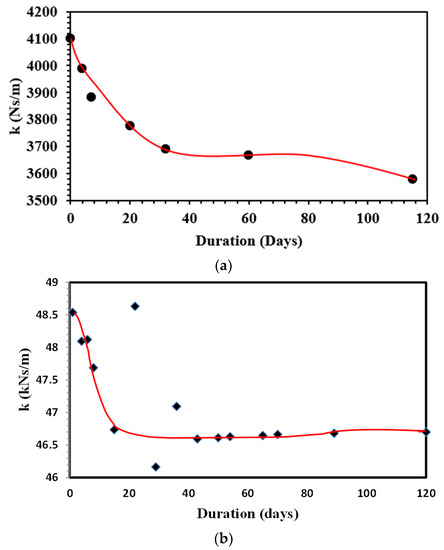
Figure 16.
Deterioration in equivalent stiffness parameter during accelerated chloride-induced corrosion exposure. (a) AAC, (b) identified stiffness during corrosion progress [32].
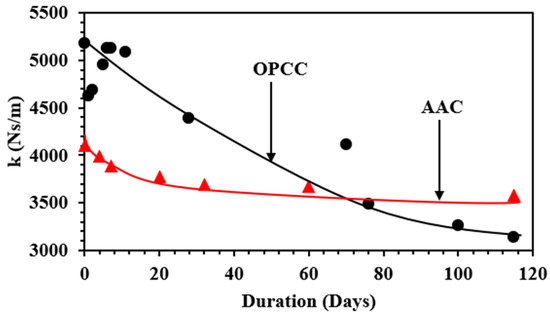
Figure 17.
Comparison of deterioration in terms of equivalent stiffness parameter during accelerated chloride-induced corrosion exposure for OPCC and AAC.
4. Conclusions
In this study, the performance of AAC under accelerated chloride-induced corrosion conditions was automatically monitored using the EPS via EMI technique. Based on raw EMI signatures of the EPS, it was found that changes in conductance signature during chloride-induced corrosion at different time intervals for OPCC and AAC are well captured by the EPS. These findings provide a proof-of-concept validation for the use of the embedded sensor for corrosion exposure monitoring in both OPCC and ACC concretes. In general, it is already well established in the literature through conventional durability tests that AAC has better durability in comparison to OPCC, which can lead to adaptability of AAC for sustainable construction. Based on the results obtained from the EPS, it was again reaffirmed using piezo sensors non-destructively. Further, based on equivalent structural analysis, it was found that the deterioration in terms of stiffness loss in AAC is lower than OPCC, which indicates that AAC is more corrosion resistant as compared to OPCC. Hence, it can be concluded that the ESP is a good indicator for identifying corrosion deterioration and could be used in real-life scenarios without any destructive testing.
Author Contributions
Conceptualization, methodology, formal analysis, data curation, writing—original draft preparation, validation, resources, visualization, T.B.; writing—review and editing, supervision, V.T.; R.V.; G.A.; S.K.R.J.; visualization, funding acquisition, G.A. All authors have read and agreed to the published version of the manuscript.
Funding
This research received no external funding.
Institutional Review Board Statement
Not applicable.
Informed Consent Statement
Not applicable.
Data Availability Statement
Not applicable.
Conflicts of Interest
The authors declare no conflict of interest.
References
- United Nations Environment Programme. 2021 Global Status Report for Buildings and Construction: Towards a Zero-Emission, Efficient and Resilient Buildings and Construction Sector; United Nations: New York, NY, USA, 2021. [Google Scholar]
- Prakash, R.; Divyah, N.; Srividhya, S.; Avudaiappan, S.; Amran, M.; Naidu Raman, S.; Guindos, P.; Vatin, N.I.; Fediuk, R. Effect of Steel Fiber on the Strength and Flexural Characteristics of Coconut Shell Concrete Partially Blended with Fly Ash. Materials 2022, 15, 4272. [Google Scholar] [CrossRef] [PubMed]
- Prakash, R.; Raman, S.N.; Subramanian, C.; Divyah, N. Eco-Friendly Fiber-Reinforced Concretes. In Handbook of Sustainable Concrete and Industrial Waste Management: Recycled and Artificial Aggregate, Innovative Eco-friendly Binders, and Life Cycle Assessment; Woodhead Publishing: Sawston, UK, 2022; pp. 109–145. [Google Scholar] [CrossRef]
- Scrivener, K.; Martirena, F.; Bishnoi, S.; Maity, S. Calcined Clay Limestone Cements (LC3). Cem. Concr. Res. 2018, 114, 49–56. [Google Scholar] [CrossRef]
- El-Hassan, H.; Elkholy, S. Enhancing the Performance of Alkali-Activated Slag-Fly Ash Blended Concrete through Hybrid Steel Fiber Reinforcement. Constr. Build. Mater. 2021, 311, 125313. [Google Scholar] [CrossRef]
- Beersaerts, G.; Ascensão, G.; Pontikes, Y. Modifying the Pore Size Distribution in Fe-Rich Inorganic Polymer Mortars: An Effective Shrinkage Mitigation Strategy. Cem. Concr. Res. 2021, 141, 106330. [Google Scholar] [CrossRef]
- Ascensão, G.; Marchi, M.; Segata, M.; Faleschini, F.; Pontikes, Y. Reaction Kinetics and Structural Analysis of Alkali Activated Fe–Si–Ca Rich Materials. J. Clean. Prod. 2020, 246, 119065. [Google Scholar] [CrossRef]
- Singaram, K.K.; Khan, M.A.; Talakokula, V. Statistical Analysis of Fly Ash and Slag Blended Geopolymer Concrete. Mater. Today Proc. 2022, 61, 466–476. [Google Scholar] [CrossRef]
- Qin, L.; Gao, X.; Zhang, A. Potential Application of Portland Cement-Calcium Sulfoaluminate Cement Blends to Avoid Early Age Frost Damage. Constr. Build. Mater. 2018, 190, 363–372. [Google Scholar] [CrossRef]
- Ascensão, G.; Faleschini, F.; Marchi, M.; Segata, M.; van de Sande, J.; Rahier, H.; Bernardo, E.; Pontikes, Y. High-Temperature Behavior of CaO-FeOx-Al2 O3-SiO2-Rich Alkali Activated Materials. Appl. Sci. 2022, 12, 2572. [Google Scholar] [CrossRef]
- Bernal, S.A.; Mejía De Gutiérrez, R.; Pedraza, A.L.; Provis, J.L.; Rodriguez, E.D.; Delvasto, S. Effect of Binder Content on the Performance of Alkali-Activated Slag Concretes. Cem. Concr. Res. 2011, 41, 105786. [Google Scholar] [CrossRef]
- Topolář, L.; Šimonová, H.; Rovnaník, P.; Schmid, P. The Effect of the Carbon Nanotubes on the Mechanical Fracture Properties of Alkali Activated Slag Mortars. In Proceedings of the Applied Mechanics and Materials; Trans Tech Publications Ltd.: Bach, Switzerland, 2014; Volume 617, pp. 243–246. [Google Scholar]
- Mithun, B.M.; Narasimhan, M.C. Performance of Alkali Activated Slag Concrete Mixes Incorporating Copper Slag as Fine Aggregate. J. Clean. Prod. 2016, 112, 837–844. [Google Scholar] [CrossRef]
- Cao, R.; Zhang, S.; Banthia, N.; Zhang, Y.; Zhang, Z. Interpreting the Early-Age Reaction Process of Alkali-Activated Slag by Using Combined Embedded Ultrasonic Measurement, Thermal Analysis, XRD, FTIR and SEM. Compos. B Eng. 2020, 186, 107840. [Google Scholar] [CrossRef]
- Shi, J.; Ming, J.; Sun, W. Electrochemical Performance of Reinforcing Steel in Alkali-Activated Slag Extract in the Presence of Chlorides. Corros. Sci. 2018, 133, 288–299. [Google Scholar] [CrossRef]
- Ma, Q.; Nanukuttan, S.V.; Basheer, P.A.M.; Bai, Y.; Yang, C. Chloride Transport and the Resulting Corrosion of Steel Bars in Alkali Activated Slag Concretes. Mater. Struct. Mater. Constr. 2016, 49, 3663–3677. [Google Scholar] [CrossRef]
- Shi, J.; Wu, M.; Ming, J. Long-Term Corrosion Resistance of Reinforcing Steel in Alkali-Activated Slag Mortar after Exposure to Marine Environments. Corros. Sci. 2021, 179, 109175. [Google Scholar] [CrossRef]
- Sadowski, L. Methodology for Assessing the Probability of Corrosion in Concrete Structures on the Basis of Half-Cell Potential and Concrete Resistivity Measurements. Sci. World J. 2013, 2013, 714501. [Google Scholar] [CrossRef]
- Wu, Z.; Yu, H.; Ma, H.; Zhang, J.; Da, B.; Zhu, H. Rebar Corrosion in Coral Aggregate Concrete: Determination of Chloride Threshold by LPR. Corros. Sci. 2020, 163, 108238. [Google Scholar] [CrossRef]
- Montemor, M.F.; Sim, A.M.P.; Salta, M.M. Effect of Fly Ash on Concrete Reinforcement Corrosion Studied by EIS. Chem. Eng. 2000, 22, 175–185. [Google Scholar] [CrossRef]
- Bansal, T.; Talakokula, V. Deterioration of Structural Parameters Due to Corrosion in Prestressed Concrete Identified by Smart Probe-Based Piezo Sensor. Eng. Res. Express 2021, 3, 015011. [Google Scholar] [CrossRef]
- Bansal, T.; Talakokula, V.; Sathujoda, P. A Machine Learning Approach for Predicting the Electro-Mechanical Impedance Data of Blended RC Structures Subjected to Chloride Laden Environment. Smart Mater. Struct. 2022, 31, 015036. [Google Scholar] [CrossRef]
- Bansal, T.; Talakokula, V.; Bhalla, S. Model Based Corrosion Assessment in Rebars of Different Fly Ash Blended Concrete Using Piezo Sensors. In Proceedings of the 7th Asia-Pacific Workshop on Structural Health Monitoring, APWSHM 2018, Hong Kong, China, 12–15 November 2018; pp. 902–913. [Google Scholar]
- Bansal, T.; Talakokula, V. Study of Durability Aspects of Limestone Calcined Clay Cement Using Different Piezo Configurations. In RILEM Bookseries; Springer: Singapore, 2020; Volume 25, pp. 723–730. [Google Scholar]
- Raju, J.; Bhalla, S.; Talakokula, V.; Thakur, S. Industrial Applications of Electro-Mechanical Impedance Technique in Novel Non-Bonded Configurations. In Sensors and Smart Structures Technologies for Civil, Mechanical, and Aerospace Systems; SPIE: Bellingham, DC, USA, 2019; Volume 10970, pp. 44–50. [Google Scholar] [CrossRef]
- Bansal, T.; Talakokula, V.; Mathiyazhagan, K. Equivalent Structural Parameters Based Non-Destructive Prediction of Sustainable Concrete Strength Using Machine Learning Models Via Piezo Sensor. Measurement 2021, 187, 110202. [Google Scholar] [CrossRef]
- Bansal, T.; Talakokula, V. Monitoring Strength Development of Cement Substituted by Limestone Calcined Clay Using Different Piezo Configurations. In RILEM Bookseries; Springer: Singapore, 2020; Volume 25, pp. 555–562. [Google Scholar]
- Negi, P.; Chhabra, R.; Kaur, N.; Bhalla, S. Health Monitoring of Reinforced Concrete Structures under Impact Using Multiple Piezo-Based Configurations. Constr. Build. Mater. 2019, 222, 371–389. [Google Scholar] [CrossRef]
- Nguyen, T.C.; Huynh, T.C.; Yi, J.H.; Kim, J.T. Hybrid Bolt-Loosening Detection in Wind Turbine Tower Structures by Vibration and Impedance Responses. Wind. Struct. Int. J. 2017, 24, 385–403. [Google Scholar] [CrossRef]
- Talakokula, V.; Bhalla, S.; Gupta, A. Corrosion Assessment of Reinforced Concrete Structures Based on Equivalent Structural Parameters Using Electro-Mechanical Impedance Technique. J. Intell. Mater. Syst. Struct. 2014, 25, 484–500. [Google Scholar] [CrossRef]
- Talakokula, V.; Bhalla, S.; Ball, R.J.; Bowen, C.R.; Pesce, G.L.; Kurchania, R.; Bhattacharjee, B.; Gupta, A.; Paine, K. Diagnosis of Carbonation Induced Corrosion Initiation and Progression in Reinforced Concrete Structures Using Piezo-Impedance Transducers. Sens. Actuators A Phys. 2016, 242, 79–91. [Google Scholar] [CrossRef]
- Talakokula, V.; Bhalla, S. Reinforcement Corrosion Assessment Capability of Surface Bonded and Embedded Piezo Sensors for Reinforced Concrete Structures. J. Intell. Mater. Syst. Struct. 2015, 26, 2304–2313. [Google Scholar] [CrossRef]
- Sriramadasu, R.C.; Lu, Y.; Banerjee, S. Identification of Incipient Pitting Corrosion in Reinforced Concrete Structures Using Guided Waves and Piezoelectric Wafer Transducers. Struct. Health Monit. 2019, 18, 164–171. [Google Scholar] [CrossRef]
- Huo, L.; Li, C.; Jiang, T.; Li, H.N. Feasibility Study of Steel Bar Corrosion Monitoring Using a Piezoceramic Transducer Enabled Time Reversal Method. Appl. Sci. 2018, 8, 2304. [Google Scholar] [CrossRef]
- Bansal, T.; Talakokula, V.; Sathujoda, P. Durability Aspects of Blended Concrete Systems Subjected to Combined Mechanical and Environmental Loading Using Piezo Sensor. Constr. Build. Mater. 2022, 348, 128613. [Google Scholar] [CrossRef]
- BIS 1786; High Strength Deformed Steel Bars and Wires for Concrete Reinforcement. Bureau of Indian Standards: New Delhi, India, 2008.
- BIS 2386–3; Methods of Test for Aggregates for Concrete, Part. 3: Specific Gravity, Density, Voids, Absorption and Bulking. Bureau of Indian Standards: New Delhi, India, 1963.
- BIS 10262–2009; Indian Concrete Mix Design Guidelines. Bureau of Indian Standards: New Delhi, India, 2009.
- Ramachandran, A.; Anuradha, R.; Sreevidya, V.; Venkatasubramani, R.; Rangan, B. Modified Guidelines for Geopolymer Concrete Mix Design Using Indian Standaard. Asian J. Civ. Eng. Build. Hous. 2012, 13, 353–364. [Google Scholar]
- Bhalla, S.; Soh, C.K. Structural Health Monitoring by Piezo-Impedance Transducers. I: Modeling. J. Aerosp. Eng. 2004, 17, 154–165. [Google Scholar] [CrossRef]
- Bharathi Priya, C.; Jothi Saravanan, T.; Balamonica, K.; Gopalakrishnan, N.; Rao, A.R.M. EMI Based Monitoring of Early-Age Characteristics of Concrete and Comparison of Serial/Parallel Multi-Sensing Technique. Constr. Build. Mater. 2018, 191, 1268–1284. [Google Scholar] [CrossRef]
- Bhalla, S.; Vittal, P.A.; Veljkovic, M. Piezo-Impedance Transducers for Residual Fatigue Life Assessment of Bolted Steel Joints. Struct. Health Monit. 2012, 11, 733–750. [Google Scholar] [CrossRef]
- Soh, C.K.; Bhalla, S. Calibration of Piezo-Impedance Transducers for Strength Prediction and Damage Assessment of Concrete. Smart Mater. Struct. 2005, 14, 671–684. [Google Scholar] [CrossRef]
- Talakokula, V.; Bhalla, S.; Gupta, A. Monitoring Early Hydration of Reinforced Concrete Structures Using Structural Parameters Identified by Piezo Sensors via Electromechanical Impedance Technique. Mech. Syst. Signal Process. 2018, 99, 129–141. [Google Scholar] [CrossRef]
- Moharana, S.; Bhalla, S. Development and Evaluation of an External Reusable Piezo-Based Concrete Hydration-Monitoring Sensor. J. Intell. Mater. Syst. Struct. 2019, 30, 2770–2788. [Google Scholar] [CrossRef]
- Hixon, E.L. Mechanical Impedance Shock and Vibration Handbook, 3rd ed.; Harris, C.M., Ed.; Mc Graw Hill Book Co: New York, NY, USA, 1998. [Google Scholar]


Publisher’s Note: MDPI stays neutral with regard to jurisdictional claims in published maps and institutional affiliations. |
© 2022 by the authors. Licensee MDPI, Basel, Switzerland. This article is an open access article distributed under the terms and conditions of the Creative Commons Attribution (CC BY) license (https://creativecommons.org/licenses/by/4.0/).