Article

Spatio-Temporal Evolution and Development Path of Industry–University–Research Cooperation and Economic Vulnerability: Evidence from China’s Yangtze River Economic Belt

1
Institute of Cultural Tourism, Sichuan Vocational College of Cultural Industries, Chengdu 610213, China
2
College of Teachers, Chengdu University, Chengdu 610106, China
3
School of Social Sciences, Universiti Sains Malaysia, Penang 11800, Malaysia
*
Author to whom correspondence should be addressed.
Sustainability 2022, 14(19), 12919; https://doi.org/10.3390/su141912919
Submission received: 2 September 2022 / Revised: 30 September 2022 / Accepted: 7 October 2022 / Published: 10 October 2022

Abstract

:
This study explores the impact of industry–university–research (IUR) cooperation on the economic system. The study constructs a vulnerability evaluation index comprising 42 indicators in five dimensions. The Yangtze River Economic Belt (YREB) panel data from 2006–2018 are used to assess economic vulnerability in China. The research results show that, firstly, from 2006–2018, the index values indicated a good development trend, with fluctuations in the values of the sensitivity and economic vulnerability indices. The response ability index values gradually increased, especially later in this period. This showed a promising trend of low sensitivity, high response ability, and low vulnerability. Secondly, the spatial distribution pattern demonstrated certain laws and continuity, but the development process was unstable, while the eastern < the central < the western showed a “ladder” evolution pattern, “extremely poor” characteristics, and an “agglomeration” evolutionary path. Thirdly, the impact of IUR cooperation on regional economic development can be divided into three phases: knowledge interaction, creation, and application. The interaction and synergy between universities, research institutions, and enterprises play a role in regional economic development. The study recommends strengthening the coupling coordination of the production, research and development (R&D), cooperation, and innovation, with the dual functions of government guidance and market decision making.

1. Introduction

Research is one of the major tools for developing all sectors. Many scholars, academics, and policy makers emphasize the industry–academia linkage, due to its support for a country’s economic development [1,2,3]. The industry–academia linkage can be developed appropriately with the help of research [4,5]. This study mainly focuses on industry–university–research (IUR) cooperation. Economists and development organizations today are emphasizing economic stability, which can be vulnerable for many reasons. Resilient economic development can be achieved by reducing economic vulnerability. Therefore, this study assesses the impact of IUR cooperation on economic development in China, with this evaluated by assessing an economic system’s vulnerability through the economic vulnerability index and spatial analysis. A path analysis is used to show the IUR development path for economic development [6].
The system of industry–university–research (IUR) cooperation and economic development refers to the state of mutual influence, interdependence, and interaction between four subsystems: enterprises, universities, scientific research institutions, and economic development, with this being a complex system with openness, non-linearity, and dynamics [7]. This study is supported by the triple helix theory. The most popular version of innovation theory is called the triple helix theory [8]. The approach strongly emphasizes the interaction and collaboration among industry, academia, and research during innovation [9]. Each party shows some capabilities of the other two, with its original functions and unique identities. The integration of triple helix components may also develop a new organizational structure that supports innovation-hybrid organizations. The triple helix theory offers a theoretical and analytical framework for the role positioning, collaborative relationships, and operational mechanisms of IUR during innovation research [10]. Under this framework, many academics have done empirical research on the innovation system. Using triple helix metrics, Li et al. [11] examined government, industry, and university research in the agriculture sector in China. Driven by external environments, such as government policies and economic competition, and supported by intermediary organizations, each subsystem gives full play to its innovation resources and advantages, as well as its innovation and ability, and jointly participates in scientific research and innovation activities [12]. This allows resource elements, such as funds, talents, knowledge, and technology, to effectively converge through the barriers between systems. Thus, they fully release their innovation vitality [13,14] to form a coupling and coordination relationship of complementary advantages, risk sharing, and benefit sharing, while promoting the advanced and orderly evolution of the IUR innovation system. In turn, this effectively promotes sustainable economic and social development [15].
However, the differences between regions are gradually emerging in China’s rapidly developing economic operation. Regions are differentiated by differences in the level of infrastructure, knowledge accumulation, IUR synergy development, and technological innovation efficiency [16]. Leading to a non-equal distribution of knowledge resources in regions, this provides an important reason for the low level of cooperation between IUR cooperation entities [17]. In turn, this leads to failure in the effective transformation and utilization of the results and advantages of IUR cooperation and reduces the effect of support and services provided for economic and social development [11]. The vulnerability of the IUR cooperation and economic system reveals the system’s sensitivity to internal and external disturbances at specific times, places, and under certain conditions. These disturbances arise due to constraints within the system’s characteristics [15] and the essential attributes of its function, as well as structural damage from the lack of ability to resist adverse disturbances [18]. Internal factors are mainly derived from the degree of rationalization of the system’s IUR cooperation and its immunity to external shocks [19]. External factors are mainly derived from the policy guarantee and social environment disturbances of IUR cooperation, which are closely related to economic and social development [20].
Since the end of the 20th century, vulnerability research has attracted the attention of relevant international organizations, governments, experts, and scholars at home and abroad. This initiated a worldwide upsurge in research on climate change and sustainable development [21,22]. The concept of vulnerability first appeared in geoscience, stemming from research related to natural disasters [23]. The rapid development and broad application of geographic information science have provided technical support for vulnerability research [24]. Continuous expansion of the scope of vulnerability research is also promoted, with the concept of vulnerability increasingly applied to other fields, such as urban science, economics, management, etc. Ranging from its role in single systems research through to composite systems research, vulnerability has gradually developed into an interdisciplinary topic, involving multiple fields and multi-scale characteristics.
The vulnerability connotation of the IUR cooperation and economic development system can be understood from the following two aspects. Firstly, due to the heterogeneity, complexity, and comprehensiveness of IUR activities, IUR cooperation behavior has become a sensitivity [22], with its behavioral activities easily affected by various factors, ranging from the government, the economy, society, education, etc. Higher sensitivity is often found in the economic development of those regions with high dependence [25]. Secondly, in addition to sensitivity, vulnerability of the IUR cooperation and economic system depends on the system’s ability to respond to changes in the external environment [15]. In addition to experiencing the influence of internal geographic conditions and natural resources, regional economic development and spatial differences are becoming more and more noticeable, especially in the context of economic globalization and regional integration. Thus, a new research hotspot is how to improve the tolerance of, and resistance to, regional economic risks [26]. Studying the vulnerability of regional IUR cooperation and economic development systems is very important, as is determining how to promote improvement at the regional economic development level, through the coordinated development of industry, education, and research.
Existing research on economic vulnerability has yielded fruitful results [15,27,28,29]. Since 1999, when the United Nations Development Programme (UNDP) first proposed the concept of economic vulnerability, scholars have conducted multifaceted and multi-perspective research on economic vulnerability [30]. For example, Gnangnon explored the economic vulnerability of 112 developing countries under the multilateral trading system [29], while Wang [28] proposed the economic vulnerability index, discussing the relationship between the index and economic volatility. In establishing an economic vulnerability indicator system, Rocha and Moreira [27] used panel data from 23 countries, proposing decisions that would reduce the economic vulnerability of emerging market economies. Some scholars have begun to pay attention to the correlation between different systems from the systems perspective, with many studies emerging on the evolution of local relationships and vulnerability of multi-system coupling. Among these studies, Cheng et al. [31] studied the vulnerability to disasters in Xiaogan City, Hubei Province, China, from the perspective of coupling three subsystems: the economy, society, and policies. Frazier et al. [26] constructed the spatially explicit resilience–vulnerability (SERV) model from the population structure, economic development, medical facilities, income, tourism and agriculture, education, and employment levels. Their study discussed the relationship between vulnerability and resilience in the Sarasota region on the west coast of Florida. In 2000–2011, Chen et al. [32] applied the vulnerability scoping diagram (VSD) framework and SERV model to study the vulnerability of the society–ecosystems relationship in Yulin City, Shaanxi Province, regarding the aspects of population and the economy, agriculture and land, ecology and the environment, education and technology, and infrastructure construction. With the aim of achieving the realization of a society in semi-arid areas of China, the approach used was a quantitative expression of ecosystem vulnerability research [15].
A review of the existing research results shows that vulnerability research has gradually extended from initially focusing only on natural environmental systems [32,33,34,35] to the multidisciplinary interdisciplinary research of natural, economic and social, and human–environment coupling systems [15,27,29,30]. This research perspective focuses on coupling coordination development or interactive response relationships between multiple systems [12,36,37,38,39,40], while fewer studies explore economic vulnerability [15,28]. Most studies, for their research method, have used coupled coordination degree models to measure the degree of coordination between systems [15,29,30]. In contrast, insufficient research has been conducted on non-coupling calculations, such as decoupling, and vulnerability [15,28]. In terms of research content, more researchers discuss the vulnerability of the ecological economy [15,28,40,41], but attention is rarely paid to the fragile relationship between IUR cooperation and economic development in education economy. This study, therefore, intends to address the research gap by seeking answers to the following two research questions:
(a)
How does industry–university–research (IUR) cooperation impact Chinese economy?
(b)
What level of economic vulnerability prevails in the IUR-driven Chinese economy?
The study aims to explore the impact of IUR cooperation on economic development and its vulnerability.
This study demonstrates novelty in several ways. For example, the study customizes and extends a multi-index evaluation system for measuring the vulnerability of the IUR cooperation and economic system by adding several indicators drawn from the existing literature. The study explores the non-coupling situation of enterprises, universities, research institutions, and economic systems, taking the Yangtze River Economic Belt (YREB) in China as a case. The study uses a geographic, spatio-temporal, two-dimensional research approach to determine the dynamic spatial differentiation of the economic vulnerability index values of 11 provinces and cities in the YREB from 2008–2018. It analyzes the specific path of IUR cooperation to promote regional economic development and provide appropriate treatment for the relevant departments in the YREB region, based on regional characteristics and future development trends. The findings will help policy makers to reduce the vulnerability of IUR cooperation and economic development, as well as to accelerate the process of high-quality, sustainable development of the Yangtze River Basin.

2. Materials and Methods

2.1. Study Area Overview

The reason for selecting the Yangtze River Economic Belt (YREB) as a case is its potential contribution to the Chinese economy. It is generally known as the “Golden Belt,” and runs through the eastern, central, and western parts of China, covering Shanghai, Jiangsu, Zhejiang, Anhui, Jiangxi, Hubei, Hunan, Chongqing, Sichuan, Yunnan, and Guizhou. The total population, along with economic output, accounts for more than 40% of the country [42]. The YREB’s development strategy is a national strategy to implement new regional development in China’s new round of reform and transformation [43]. The formal implementation of the strategy provides a good opportunity to develop cooperation between 11 provinces and cities in the region. The YREB has the Yangtze River Delta urban agglomeration in the east and vast hinterland of the central and western areas in the west [44]. The potential for market demand and room for development are huge. The YREB is rich in scientific and educational resources. In total, 43% of China’s ordinary colleges and universities are in the YREB, while expenditure on research and development (R&D) in this area accounts for 46.7% of China’s total expenditure, and the number of effective invention patents in the YREB accounts for more than 40% of China’s total [45].
Along the Yangtze River, which occupies half the country’s area, the following can be found: 2 comprehensive national science centers, 9 national independent innovation demonstration zones, 90 state-level high-tech zones, 161 state key laboratories, and 667 enterprise technology centers [45]. To promote the YREB’s high-quality development, so it becomes an innovation-driven belt cultivating new momentum to lead transformation and development, China must rely on the advantages of regional talents and intelligence intensity, vigorously stimulate the vitality of innovation and entrepreneurship, and realize the transformation from factor- and investment-driven to innovation-driven [46].
However, due to large differences in the development trends of various provinces and cities, the antagonism between IUR cooperation and economic development systems in the YREB has become more frequent, with vulnerability more prominent between various elements of each system. Therefore, it is necessary to understand the status of IUR cooperation and economic development in the region and explore the impact of enterprises, universities, scientific research institutions, and other elements, as well as the effects of their synergy on the economic development of provinces and cities. The key insights obtained can enlighten the promotion of the development of each element itself, as well as the synergy between factors that will help regional decision-makers to undertake more targeted measures. This will optimize the allocation of innovative resources, enhance the synergy between various subjects, and positively impact regional economic development.

2.2. Indicator Selection and Data Sources

The complex IUR cooperation system involves the interaction of three subsystems, namely industries, universities, and research institutions, as well as the transmission and flow of many innovative elements, such as funds, personnel, and information. Universities and research institutions mainly undertake knowledge creation in production, education, and collaborative research innovation. These two subsystems can be examined through the two aspects of scientific research input and output. Enterprises are mainly responsible for the absorption and application of innovative knowledge. Enterprises must have the foundation of technology input and ability to transform new technical knowledge into economic benefits, so the enterprise subsystem can be examined from the two aspects of market-oriented input and output. For example, Buesa et al. [47] studied the decisive factors of innovation in the European region, with researchers and funds of the three major entities taken as the main factors affecting investment in scientific research and innovation. Each entity’s annual number of patent applications was used to measure scientific research output.
Graf et al. [48], Cowan et al. [49], and Fritsch et al. [50] studied the respective roles of scientific research institutions, colleges and universities, and enterprise units in regional collaborative innovation. For indicators, they used scientific research manpower investment, scientific research expenditure, and the turnover of collaborative contracts between various entities as input variables, with the number of patents applied for, number of published papers, and income of enterprises’ new products as output variables. To construct the evaluation index system at the economic development level, the current study draws on existing research results. It combines the actual situation, based on the connotation of economic development, mainly from the three aspects of economic development quality, efficiency, and structure. For agent indicators, it adds the deviation of industrial structure and advanced indicators of industrial structure upgrade.
In comparison with construction of the traditional evaluation index system, the study of vulnerability, from the perspective of socio-ecosystem theory, integrates many research perspectives and analysis methods, such as risk, sensitivity, adaptability, and resilience. Speranza et al. [51] recommended a new way of thinking for research in this area. However, the huge and complex evaluation indicators, lack of systematic data organization methods, and lack of inductive theoretical models to coordinate jagged data, indicators, and information have, together, become a significant problem in vulnerability evaluation. In recent years, research on vulnerability integration, with its focus on effects (factors–outcomes) to emphasize adaptability and resilience (human adaptation and response to environmental changes) with the cross-scale and multi-factor integration of human–earth systems, has gradually become valued by scholars worldwide.
Polsky et al. [52] and Acosta-Michlik et al. [53] explained system vulnerability through its three elements of the system’s exposure, sensitivity, and adaptive capacity [34] and proposed a vulnerability scoping diagram (VSD) and vulnerability assessment framework, through multi-data organization. The vulnerability connotation and index system construction method provide the current study’s comprehensive vulnerability evaluation concept. Exposure refers to the degree to which the system is exposed to various environmental and social stresses or shocks [54]. Sensitivity is the degree to which the exposed unit is susceptible to coercion’s positive or negative effects [34]. Adaptive capacity is the system’s ability to handle, adapt, coordinate, and recover from the consequences of the coercion (as determined by, for example, economic, technological, infrastructural, and managerial) [15,55,56]. Based on the existing literature, the indicator is further divided into response ability indicators and sensitivity indicators, according to the nature of the indicator. The response ability indicator is inversely proportional. Thus, a specific indicator is a sensitivity indicator; that is, the higher the value, the stronger the vulnerability; the higher the value, the lower the vulnerability of a specific indicator for its ability to respond. In summary, the indicator system, with its three levels of system–dimension–indicators, is finally formed, as shown in Table 1.
This study takes 11 provinces and cities in China’s Yangtze River Economic Belt (YREB) as the research objects, in terms of data sources. The relevant data are from the 2008–2018 China Statistical Yearbook, China Science and Technology Statistics Yearbook, China Education Statistics Yearbook, China Education Expenditure Statistical Yearbook, China Regional Innovation Ability Evaluation Report, and Statistical Yearbook. Data required for the indicators were acquired from the Statistical Bulletin of National Economic and Social Development, Patent Retrieval Database Platform of the State Intellectual Property Office, China Science and Technology Statistics website, and relevant provincial, municipal science, and technology statistics websites. Among these sources, linear interpolation was used to complement some of the missing data.

2.3. Research Methods

2.3.1. Entropy Weight Method

The entropy method is used to judge the degree of dispersion of the indicators, with this belonging to the objective empowerment method in the comprehensive evaluation method. To avoid the influence of subjective factors on the research, a more objective entropy method is used to measure the weights of each index, with the basic calculation steps as follows:
Calculate the proportion of the value of the ith indicator under the jth indicator:
P i j = X i j i = 1 m   X i j
Calculate the entropy value of the jth indicator:
e j = 1 ln n i = 1 n l n   ( P ) i j
Calculate the coefficient of variance for the jth indicator:
g i = 1 e i
Calculate the weight coefficients of each indicator:
w j = g i j = 1 m g i , j = 1 , 2 ,   ,     m

2.3.2. Vulnerability Calculation

According to the vulnerability function model, the vulnerability of the system is proportional to sensitivity and inversely proportional to the ability to cope [57]:
S i = i = 1 n w j x i j                   R i = i = 1 n w j x i j
where w j is the weight of the jth indicator, and x i j is the standardized value for the jth indicator.
The vulnerability composite index value can be expressed as:
V i = S i / R i
where Vi is the comprehensive vulnerability index value of all indicators in the ith year in the YREB region; Si is the sensitivity index value for all indicators in the ith year; and Ri is the responsiveness index value for all indicators in the ith year.

2.3.3. Spatial Autocorrelation Model

Global autocorrelation analysis is mainly used to analyze the spatial distribution of the value of a certain attribute of the spatial object in the entire research area. This reflects the overall trend or spatial dependence of the observed value in the spatial area, which simply determines whether the observed value is clustered in the global spatial range. However, global autocorrelation analysis cannot specifically analyze which areas have aggregation phenomena with the aggregation phenomenon obtained by local autocorrelation analysis. Commonly used analysis methods are the global Moran’s I index and mathematical expression of the spatial autocorrelation of Moran’s I index, as follows:
I = n S 0 i = 1 n j = 1 n ω i , j z i z j i = 1 n z i 2
where I represents the Moran I index, with the value range of (−1, 1); Zi is the attribute of feature I, with its average (Xi − X ¯ ) deviation; wij is the spatial weight between features i and j; n is equal to the total number of features; and S0 is an aggregation of all spatial weights:
S 0 = i = 1 n j = 1 n ω i , j

3. Results and Discussion

3.1. Vulnerability Index Timing Evolution Analysis

In accordance with Formulas (5) and (6), this study calculates values for the sensitivity, response capacity, and vulnerability indices of the Yangtze River Economic Belt (YREB) from 2006–2018, as shown in Figure 1. The sensitivity, coping ability, and vulnerability indices in the YREB during the past 10 years show a good development trend overall, with the sensitivity and vulnerability indices fluctuating. The response ability index has gradually risen, especially in the later period. It has shown trends of low sensitivity, high response ability, and low vulnerability. According to the trend of each index, this period can be divided into two noticeable stages. In the first stage (2006–2013), the sensitivity and vulnerability indices have values above 0.5, and both are higher than the resilience index value, with the sensitivity index value as high as 0.64. However, the vulnerability index shows a significant downward trend, indicating that the level of IUR collaboration in the early years in the YREB region is low, with knowledge creation and practical application innovation failing to serve economic and social development well. In the second stage (2014–2018), the resilience index has become higher than the vulnerability index, while the sensitivity index has begun a tortuous downward trend, that is, until 2016, with the resilience index continuing to rise to the point where it becomes higher than the vulnerability and sensitivity indices. Moreover, the sensitivity and vulnerability indices began to grow in 2014, beginning to usher in an inflection point in 2016.
Overall, the vulnerability index for the IUR cooperation and economic development system in the YREB region shows a downward trend. However, the decline rate is relatively slow and tortuous, indicating continuing hidden dangers in development in the region, and the level of sustainable innovation and development needs to be further improved. Gnangnon et al. [29] evaluated the economic vulnerability of developing countries and argued that lower developed countries had greater negative effects on the economic vulnerability index of outward foreign direct investments. Huang et al. [15] also conducted a study on the economic vulnerability of the major cities in China and reported that Cities in the Yangtze River Delta urban agglomeration in eastern China are more vulnerable, whereas low susceptibility is more widely dispersed throughout the country’s northern, central, and western areas. These results are consistent with our findings.

3.2. Spatial Analysis of Vulnerability

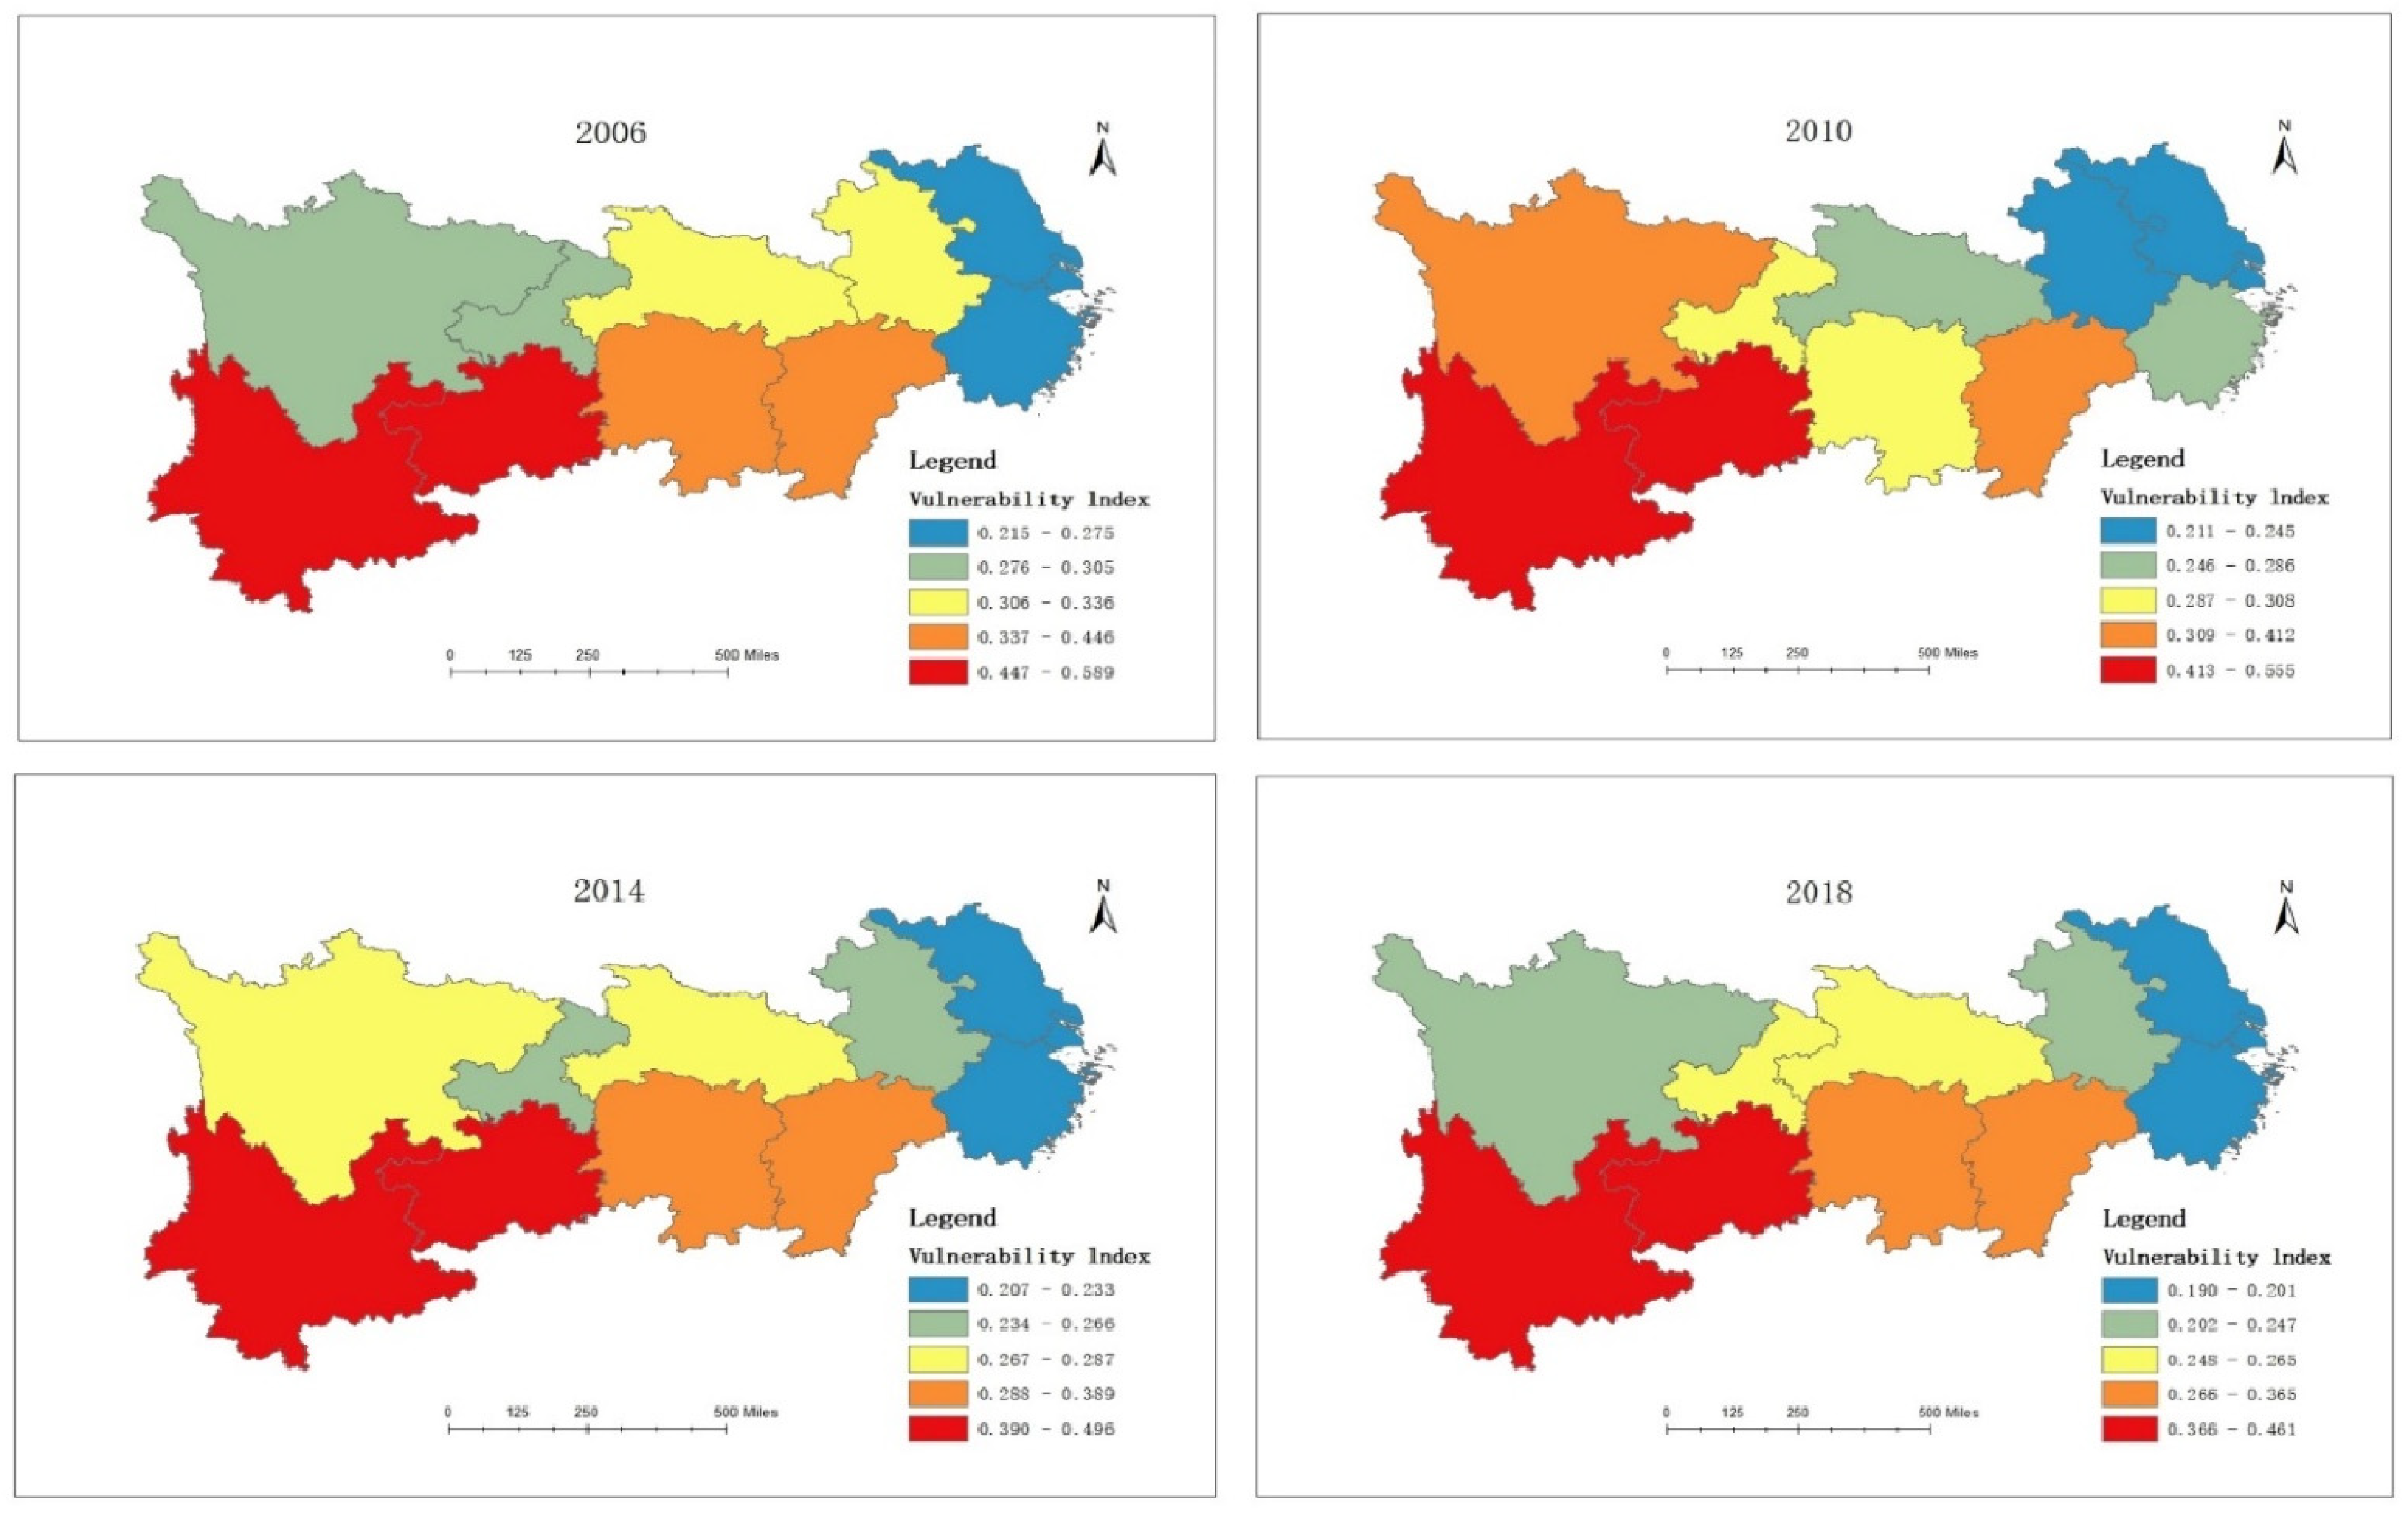
3.2.1. Spatial Distribution Characteristics

In accordance with the calculated results of Formulas (5) and (6), the quantile breakpoint method was applied by the arcGIS 10.7 software to divide the high values of the vulnerability index, in turn, into five categories. The spatial distribution map of the vulnerability index level of the IUR cooperation and economic system in the Yangtze River Economic Belt (YREB) was, thus, obtained, as shown in Figure 2.
The spatial distribution pattern is found to show certain laws and continuity. The overall vulnerability index shows a downward trend. However, the development process is unstable. The overall pattern of “stepped” spatial evolution prevails in the eastern part < the central part < the western part, specifically, Shanghai, Jiangsu, and Zhejiang provinces in the east are regions with stable and low values for the vulnerability index. With its background of the integration of the Yangtze River Delta, the eastern region is shown to have strong research and development (R&D), processing, and manufacturing capabilities [58]. This improves the sustainability of scientific research and innovation investment, thus strengthening inter-regional coordination and linkages, which is conducive to achieving scientific- and technological innovation-driven development. Anhui, Hubei, Jiangxi, and Hunan provinces in the central region, as well as Sichuan Province and Chongqing Municipality in the west, are relatively active areas of change in the vulnerability index. The slowdown trend is obvious and, for those areas near the average that do not increase or decline, their sustainable development level is likely to be overtaken by other temporarily lagging areas in the future.
This shows that development driven by scientific and technological innovation urgently needs to solve the problems of an insufficient labor force and lack of leading and innovative talents. The vulnerability index of Guizhou and Yunnan provinces in the western region has remained high, showing that the industrial structure needs to be further optimized. Traditional industries are facing the problem of overcapacity. The improvement of R&D and innovation capabilities needs to accelerate, with retaining and attracting more talents being essential for overcoming the major challenge facing the region’s transformation and development.
In addition, the vulnerability spatial distribution pattern of the IUR cooperation and economic development system in the YREB region shows the “extremely poor” characteristic, with the vulnerability index’s obvious “agglomeration” evolutionary path. The vulnerability index values of Shanghai and Jiangsu provinces have long been lower than those of Guizhou and Yunnan provinces, with a large gap between east and west. Coordinated development faces challenges related to the local industrial base, industrial structure, proportion of high-tech talents, labor resources, and institutional environment. Therefore, it is necessary to solve the barriers between administrative divisions, realize the free flow of science and education, enterprises, and economic factors, optimize the allocation of resources, and promote interregional linkage development.
Specifically, the eastern region has been a low-value area of vulnerability for a long time, due to its advantages of policy and finance. It should play a leading role in the radiation of policy, economy, and talents to the central and western regions, in order to increase the intensity of industrial science and education innovation, promote economic development transformation and upgrading, and, for these regions, strive to become a demonstration area, leading both at home and abroad. The central region lacks impetus for the relaxation of vulnerability and should actively undertake the eastern region’s scientific and technological innovation industries to stimulate the transformation of its economic structure. The economic foundation of the western region is weak, and the brain drain is serious. Under this unfavorable objective reality, it is necessary to take advantage of the situation, absorb capital investment from the eastern region, and intensify the introduction of qualified personnel. This would also assist in obtaining the advantages of IUR cooperation in the western region, with the help of preferential policies and benefits, thus promoting the sustainable development of the economy and science. Li et al. [59] assessed the economic vulnerability of the Belt and Road Initiative and mentioned that the spatial system of economic vulnerability is consistent with the spatial distribution pattern in China.

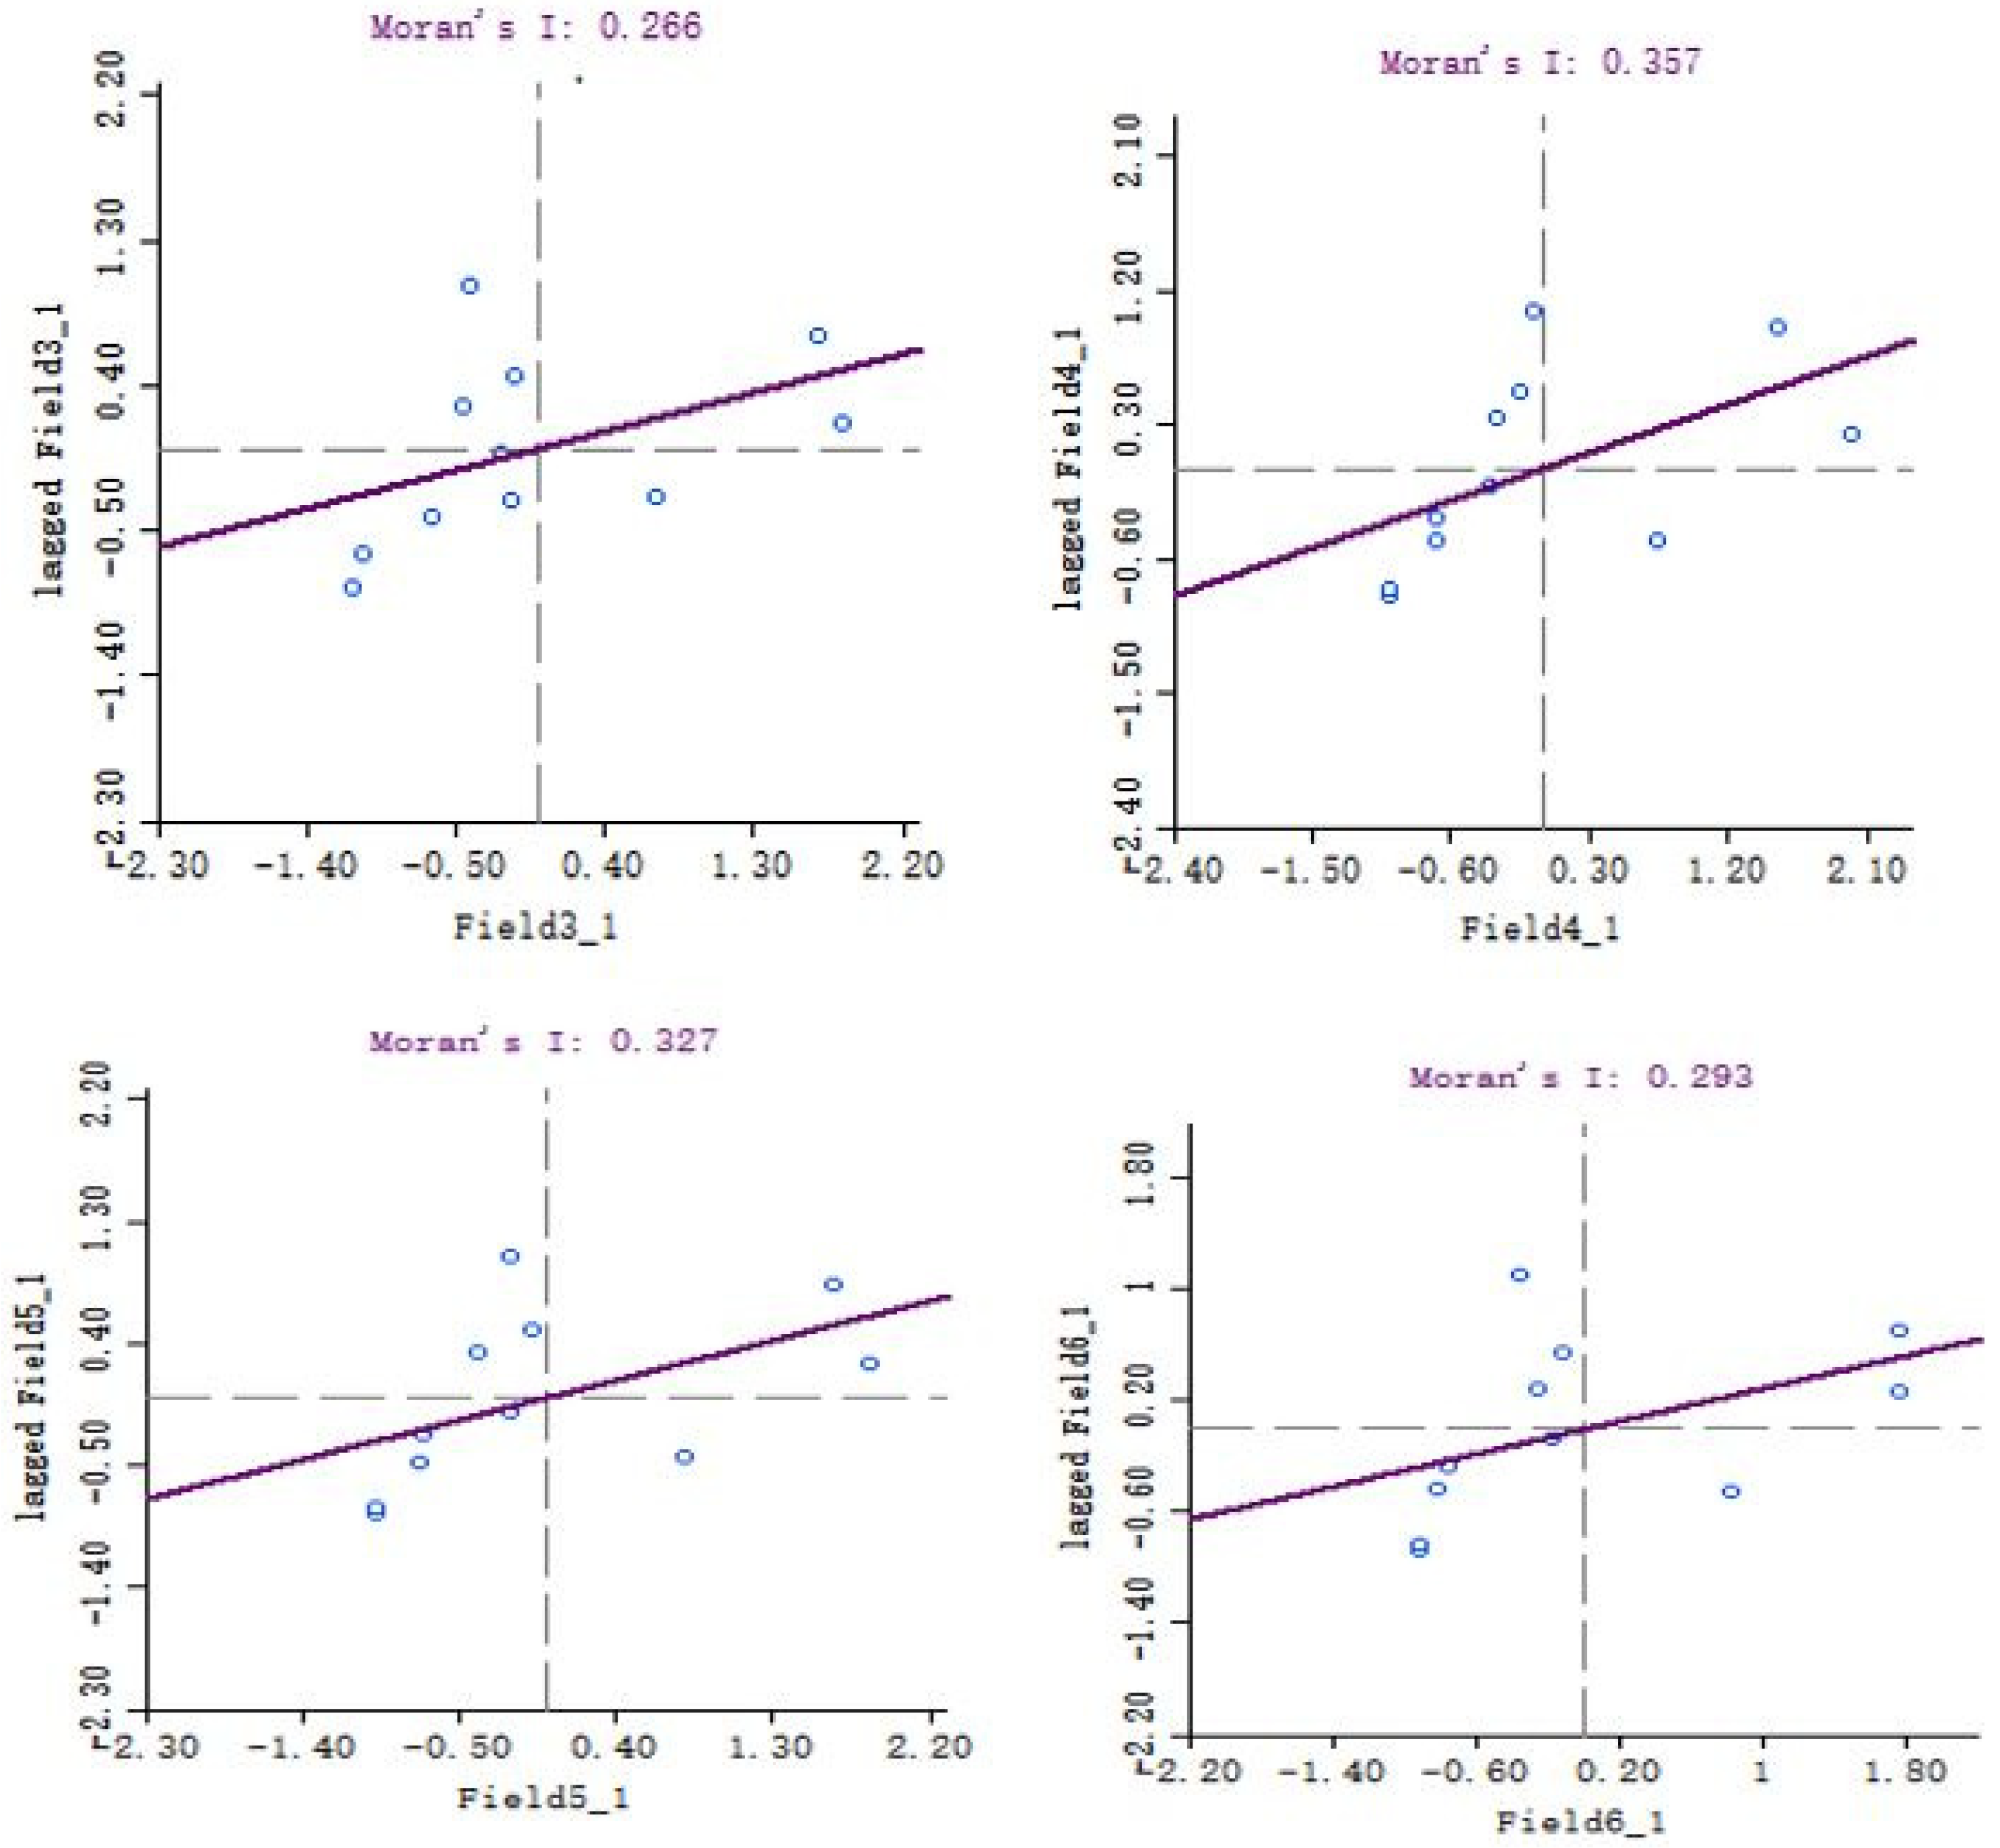
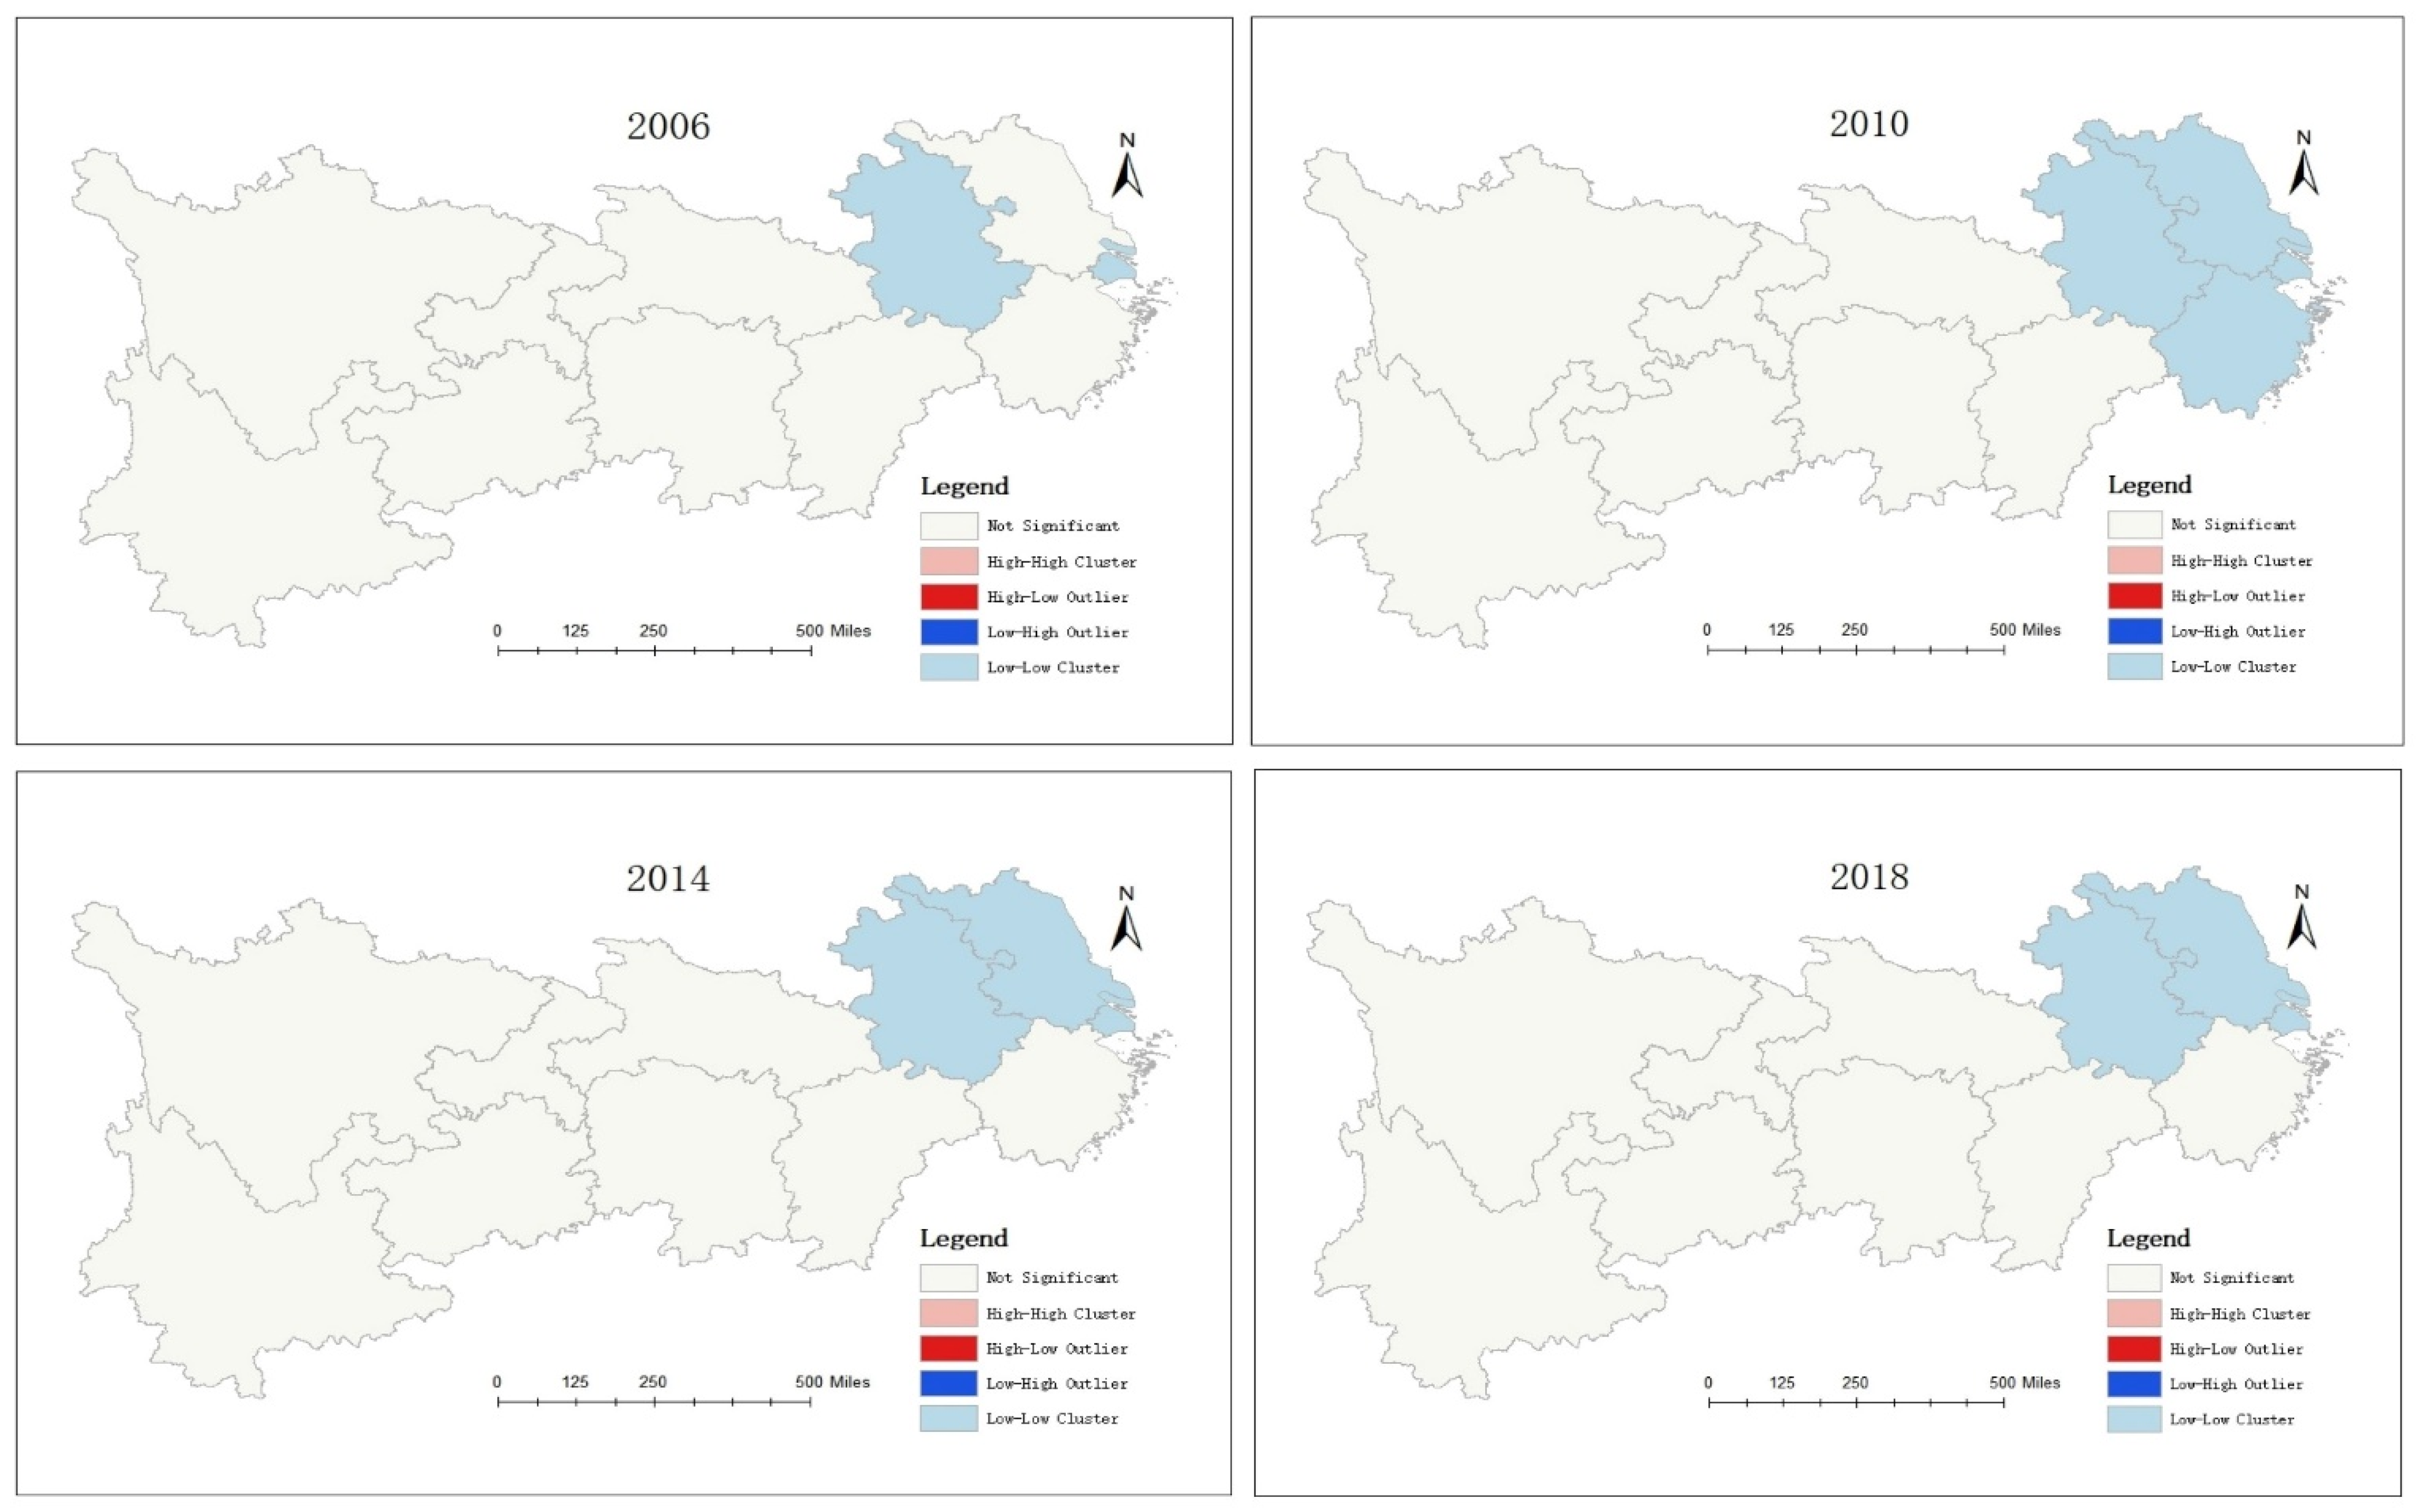
3.2.2. Spatial Correlation Analysis

Using exploratory spatial analysis, the spatial correlation between IUR cooperation and vulnerability of economic systems in the YREB region were analyzed. The spatial agglomeration differences are also presented. Spatial autocorrelation refers to the correlation of variables in different spatial locations, such as positive correlation (aggregation), negative correlation (discrete), and uncorrelated (random). Using Formulas (7) and (8), with the Geoda1.14 software, Moran’s I index calculation is performed on the vulnerability index of 11 provinces and cities in the YREB for 2006–2018, with the results shown in Table 2 and Figure 3. In 2006 (z-value 1.947, p-value 0.030), 2010 (z-value 2.433, p-value 0.020), 2014 (z-value 2.192, p-value 0.025), and 2018 (z-value 1.949, p-value 0.045), the significance test under the 95% confidence interval was passed, while the global Moran’s I index value at all four-time nodes was greater than zero. This shows an obvious spatial positive correlation between IUR cooperation and the vulnerability of the economic development system in the YREB, which has spatial dependence.
It is worth noting that the Moran I index showed an upward trend in 2006, compared to 2010, indicating a clear state of agglomeration. The areas with higher vulnerability index values tended to cluster at a high level, and those with lower-level values tended to cluster at a low level. In 2010, the Moran I index began to show a downward trend. However, by 2018, the value of 0.293 was still slightly higher than that of 0.266 in 2006, indicating that spatial dependence between 2010 and 2018 was significantly weakened, but slightly improved, compared to 2006. This shows that, with the implementation of many measures, such as the government’s efforts to build a communication and cooperation platform for universities, scientific research institutions, and enterprises, the gap between the level of vulnerability index values between regions has gradually narrowed. Therefore, it is developing in the direction of integration and equalization. However, in the face of complex and changeable domestic and international strategic environments, seizing the opportunity should receive attention through policy advantages, thus releasing economic vitality, which continues to face significant challenges.
When studying the YREB’s overall spatial correlation and differentiation trend, although the global Moran’s I index, as a global statistical indicator, can directly reveal the actual degree of regional spatial aggregation, it cannot determine the specific clustered area. However, in practice, an imbalance exists between different regions, due to the observed indicators. Therefore, to further deepen the local spatial autocorrelation analysis, the local indicators of the spatial association (LISA) agglomeration graph method are used to describe the local spatial pattern. As shown in Figure 4, from 2006–2018, the level of the vulnerability index of the IUR cooperation and economic development system in the YREB was locally concentrated. In 2006, the low–low (LL) agglomeration was in Anhui Province and Shanghai Municipality; in 2010, the LL agglomeration was in Anhui Province, Jiangsu Province, Shanghai Municipality, and Zhejiang Province; in 2014 and 2018, the LL agglomeration was in Anhui Province, Jiangsu Province, and Shanghai Municipality.
The analysis also found that, from 2006–2018, the LL agglomeration phenomenon applied in all local areas. The aggregation area in 2010 was the largest, with four regions in Anhui Province, Jiangsu Province, Shanghai Municipality, and Zhejiang Province, comprising two more areas than the LL agglomeration in 2006 in Anhui Province and Shanghai Municipality. However, the LL agglomeration in 2014–2018 decreased, compared to 2010 in Zhejiang Province, although it was still more clustered than in 2006. This shows that China’s eastern coastal areas have a high degree of opening up, strong knowledge acquisition capabilities, many high-quality foreign-funded enterprises, and significant human intellectual resources. These areas also constitute an essential foundation for innovation and development and provide a good policy and institutional environment for IUR cooperation to serve economic development. However, in the innovative development process, driven by production, education, and research, attention must be paid to the knowledge spillover effect of science-driven innovation. The transformation of scientific and technological achievements needs to play a greater role. It is also necessary to fully release the radiation driving role of technology-driven innovation and use technological breakthroughs to improve the industrial chain in the surrounding areas. The advantages of industrial clusters should play a more significant role.

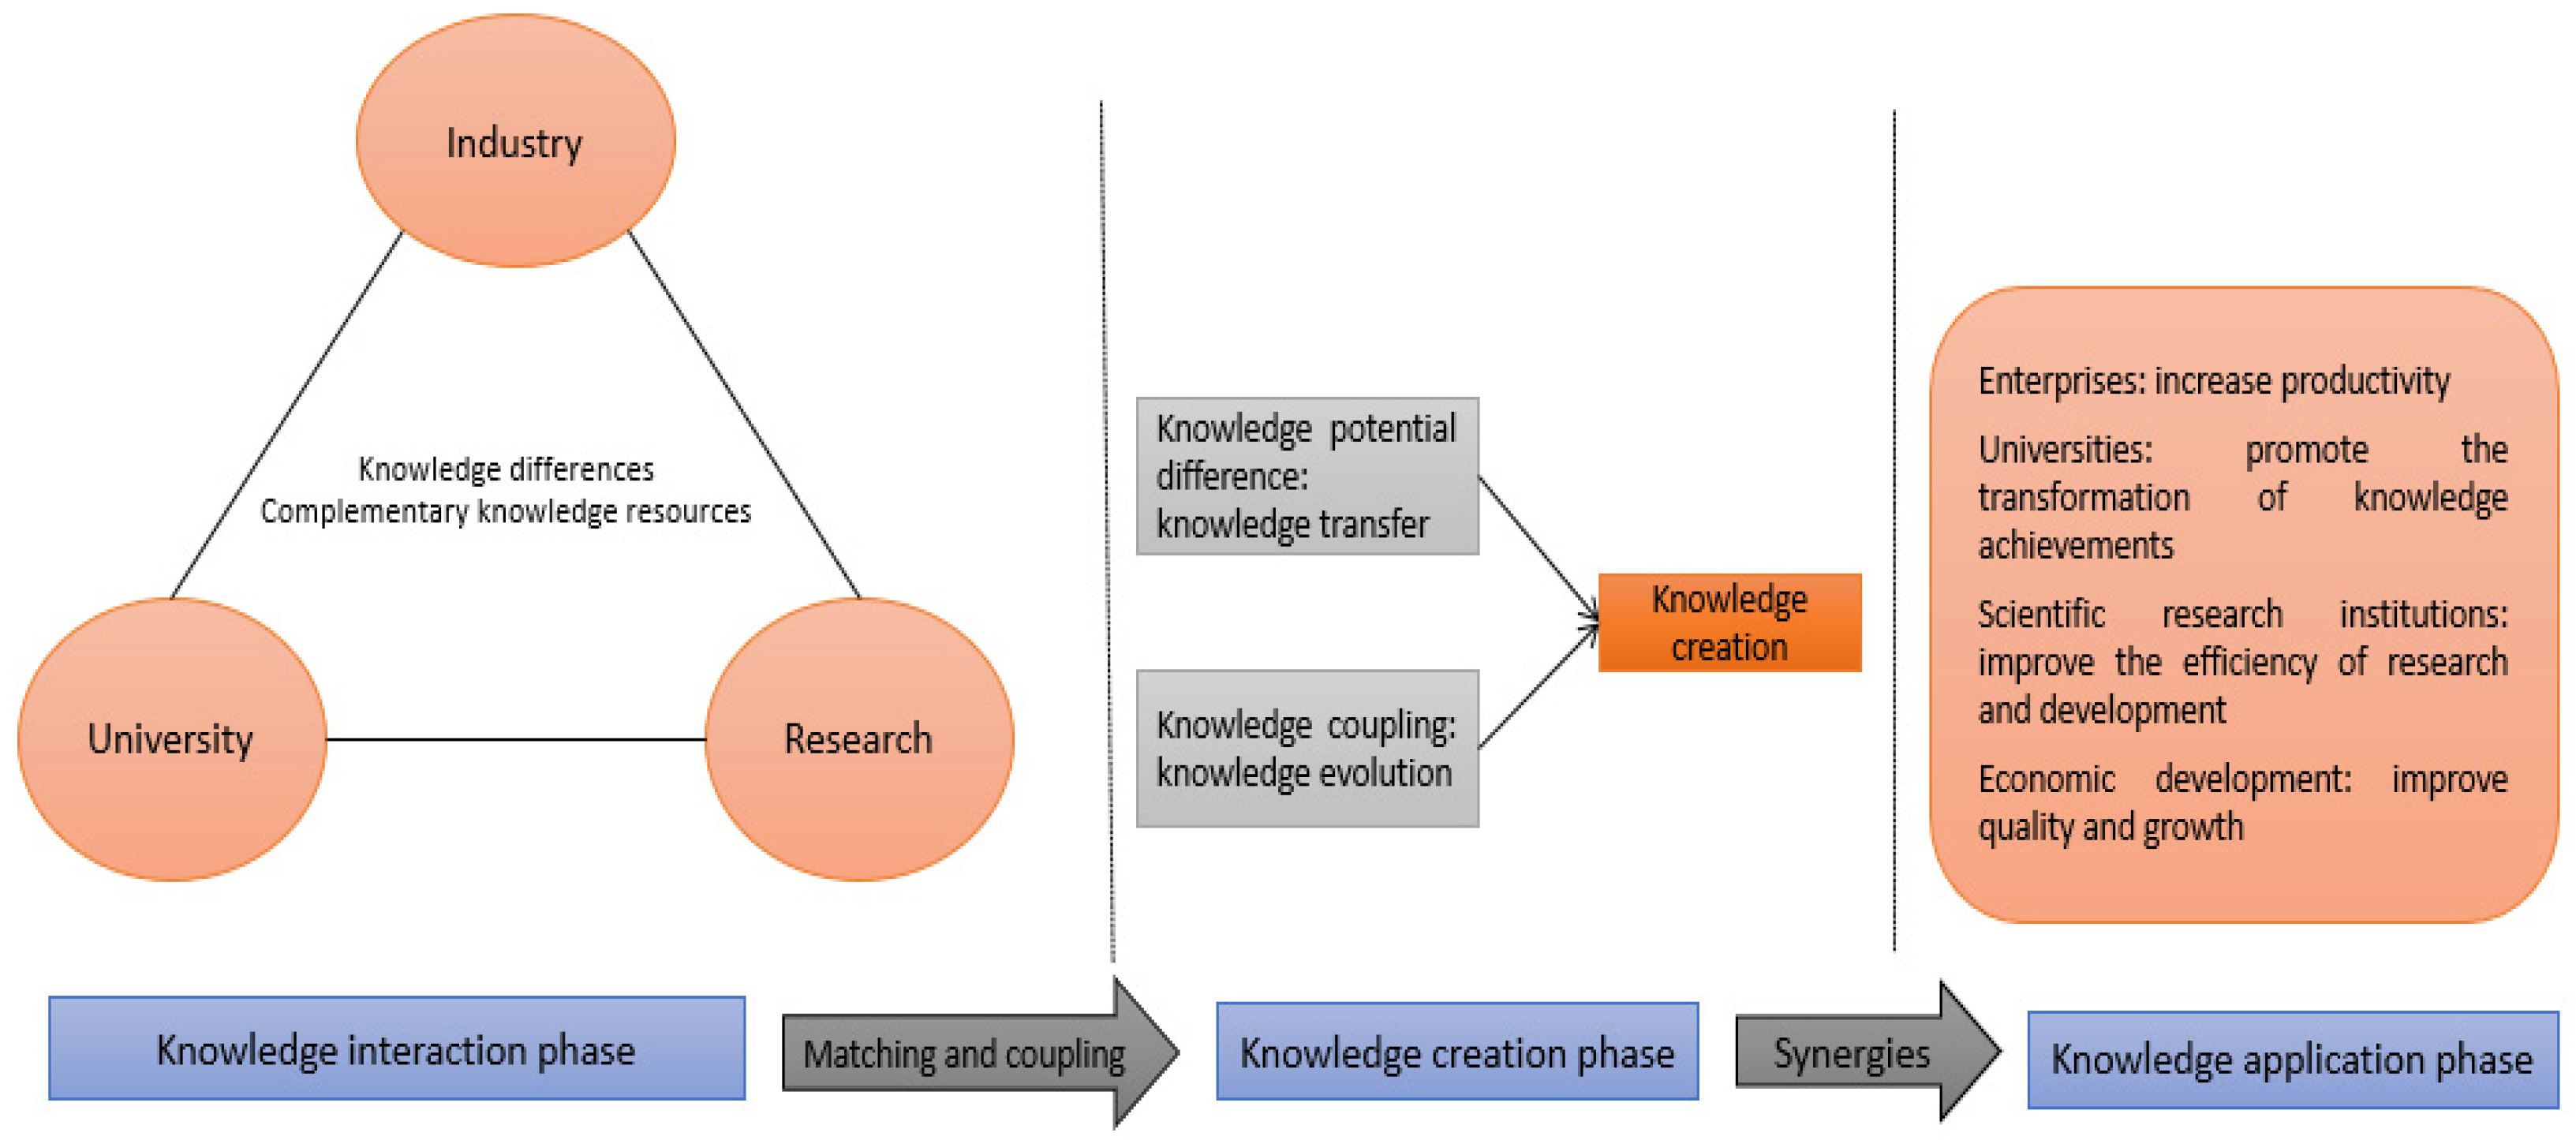
3.3. Development Path Analysis

Industry–university–research (IUR) cooperation aims to promote the transfer of new knowledge and technology to industry, through the interaction and sharing of new knowledge using the collaborative platform. It can, then, accelerate the realization of the commercial value of scientific and technological achievements. Based on the results of the analysis of the spatio-temporal process, the impact mechanism of IUR cooperation on regional economic development can be divided into the knowledge interaction, knowledge creation, and knowledge application phases (Figure 5).

3.3.1. Knowledge Interaction Phase

The knowledge stock and resources between the main body of industry, education, and research can achieve complementarity and compatibility, which is the significance of IUR cooperation and innovation. The knowledge base of universities and scientific research institutions focuses more on principles and skills, for example, the objective facts, natural laws, and laws on principles required in the initial stage of research and development (R&D), as well as the technical know-how, production skills, and operating methods required in the production stage. Morandi [60] reported that R&D cooperation requires knowledge of effective planning and adjustment practices to make a proper industry-university relationship. New knowledge is acquired through experimental and theoretical work on phenomena and observable facts. In contrast, the knowledge base of enterprises is more focused on application and social relationships [61], such as the applied knowledge obtained for the production of new products, establishment of new systems, and improvement of new processes. This includes the external knowledge acquired through social relationships and marketing knowledge of new products, etc. However, due to differences in the geographic environment, cultural atmosphere, and distribution of the human capital of different subjects, a non-equilibrium in the distribution of knowledge resources applies across the entire region. This non-equilibrium in distribution is the root cause of the potential difference in the knowledge between subjects. Knowledge interaction is a systematic project [12]. Enterprises, universities, and scientific research institutions have a clear professional division of labor in this function, with a demand for other parties’ resources. The development of universities and scientific research institutions to enhance the scientific research capabilities and academic level is considered the goal, while the driving force for the development of enterprises is to obtain market and economic benefits [16]. The respective development goals and functional differences can also lead to heterogeneity of the knowledge system. These characteristic differences are the premise of knowledge creation, through the high degree of coupling interaction between industry, education, and research, in order to achieve the complementary advantages of the knowledge system and, to a large extent, the knowledge spiral creation [62].

3.3.2. Knowledge Creation Phase

As mentioned earlier, the difference in the breadth and depth of knowledge stock directly leads to a gap in knowledge potential, thus triggering the interaction between subjects and promoting the transfer and diffusion of knowledge [12]. Knowledge transfer and creation is a necessary process of cooperative innovation. Whether knowledge can flow and be quickly and smoothly updated between cooperative members is the key to cooperative innovation [16]. Therefore, the important parts of knowledge innovation are knowledge transfer and evolution, thus achieving knowledge transfer, especially the core implicit knowledge transfer, across and between organizations. The level of knowledge potential determines the direction of knowledge transfer, with the potential differences directly constituting the driving force for knowledge transfer [63]. For example, in theoretical and scientific knowledge, universities play the role of knowledge transmitters, and the potential differences guide the flow of knowledge to enterprises or scientific research institutions. In technical and commercial knowledge, universities may play the role of knowledge receivers, often receiving applied knowledge from enterprises. Fu et al. [20] argue that innovation networks focus on knowledge creation, dissemination, and value addition, which is consistent with this study. As knowledge is more embedded in a specific carrier, successful knowledge transfer relies on the exchange and communication of carriers. While requiring both parties to have good encoding and decoding capabilities, situational factors, such as organizational distance and cultural differences, are relatively favorable. In addition, knowledge coupling and transfer is the premise and process of knowledge creation and evolution. The essence of knowledge coupling between industry, education, and research is the matching process of the “fit” characteristics of knowledge resources. The result is manifested as the mutual dependence and supplementation of knowledge resources.
Activities, such as knowledge transfer and evolution, rely on knowledge fields that provide physical and virtual “fields” to exchange ideas, experiences, inspirations, etc. Industry–university–research (IUR) knowledge creation is a knowledge spiral process, a process of continuous mutual transformation and increase of knowledge between individuals, groups, and organizations to achieve implicit and explicit outcomes [16]. Universities and research institutions use their knowledge gap to transfer these intermediate achievements to industries to compensate for enterprises’ lack of innovation resources and, ultimately, transform their knowledge advantages into economic benefits. The knowledge coupling between the subjects of IUR cooperation can control the knowledge scale of IUR’s main body [64]. This can improve the status of knowledge integration and efficiency of knowledge application, as well as avoiding knowledge interaction at a low level, with low-quality complementarity and poor heterogeneity [5]. This also helps cooperative parties to derive the “emergence” effect in the process of knowledge-based interaction and realize knowledge evolution. These findings are consistent with previous research. For example, Li et al. [41] conducted a study on IUR and governance mechanisms and mentioned that, in an IUR cooperation, explicit knowledge transmission is considerably facilitated by the contractual coordination mechanism, while tacit knowledge transfer is not affected by the contractual control mechanism. The relationship governance system greatly improves both explicit and implicit knowledge sharing.

3.3.3. Knowledge Application Phase

The key to IUR cooperation is to smoothly achieve knowledge creation and collaboration. The synergy effect of 1 + 1 > 2 is generated based on multi-dimensional collaboration of various subjects’ knowledge resources. Knowledge synergy can effectively solve the knowledge gap and reasonably solve the problems of knowledge context embedding and path dependence. Moreover, it can avoid knowledge islands and adjust knowledge transfer, evolution, creation, and other activities by forming a self-organizing coordination mechanism, ultimately achieving multi-subject, -objective, -task knowledge synergy effects [65]. In the phase of comprehensive collaboration between industry, education, and research, knowledge interaction, creation, and application generate synergistic effects through non-linear interrelationships and, thus, have an impact on regional economic development [63]. The results of knowledge creation directly affect the quality of knowledge interaction content and, thus, the application and development of knowledge by enterprises. This, in turn, relies on the practical testing and application effects that industries can provide as a basis and platform for the transformation of the knowledge achievements of universities and scientific research institutions, thus improving the efficiency of research and development (R&D) [66]. Erling Li et al. [11] conducted a study on government–industry–university–research networks and argued that science, education, and investment are the determinants of agricultural innovation in China. The applied development of new knowledge and technologies by enterprises is then successfully transformed into economic performance. This puts forward new requirements for a new round of knowledge creation, promotes a higher level of collaborative innovation, and then acts on the next phase of knowledge interaction, creation, and application. In short, the interaction and synergy of various entities will eventually impact the performance level of regional economic development [67].

4. Conclusions and Recommendations

From a new perspective on industry–university–research (IUR) cooperation and the vulnerability of economic systems, this study explored the spatio-temporal evolution characteristics and development path of the Yangtze River Economic Belt (YREB), with the following main conclusions:
(1)
From the perspective of time-series changes, the vulnerability index showed a good development trend in the period from 2006–2018, as well as the volatility of the sensitivity index and a decrease in the vulnerability index. The response ability index gradually increased, especially in the later period, showing a good trend of low sensitivity, high response ability, and low vulnerability.
(2)
From the perspective of spatial evolution, the overall vulnerability index showed a downward trend, but the development process was unstable, with an overall evolution pattern of “ladderization” in the eastern part < the central part < the western part. The characteristics of “extreme difference” and evolution path of “agglomeration” were presented. In addition, an obvious spatial positive correlation was found between IUR cooperation in the YREB region, as well as the vulnerability of the economic development system, which is spatially dependent.
(3)
From the perspective of the development path, the impact mechanism of IUR cooperation on regional economic development can be divided into three phases: knowledge interaction phase, knowledge creation phase, and knowledge application phase.
To promote the sustainable development of the IUR cooperation and economic development system in the YREB, the following suggestions are proposed.
Firstly, the coupling coordination of production, education, and research should be strengthened, with the efficiency of cooperation and innovation improved. It is necessary to strengthen the coupling of physical systems, unified standards or technologies, equipment, and rules that match each other. This can reduce knowledge transfer barriers that are brought about by physical platforms and tangible carriers, such as instruments and equipment, network platforms, information technology (IT), rule procedures, knowledge management systems, etc., and ensure the circulation of knowledge between the main bodies of production, education, and research.
Secondly, it is necessary to promote the coordinated development of IUR cooperation and economic development and supply, according to the local conditions. The relationship between ideal economic development and IUR cooperation should be highly coupled and coordinated. The formation of high-end industrial forms requires the support of a coordinated market economy operation mode and high-level IUR cooperation operation system. At the same time, the formation of high-level IUR cooperation needs to be based on highly coordinated economic development. It is recommended that economic development and IUR cooperation be included in the national policy vision. When formulating economic and social development plans, the supply of economic development and IUR cooperation should be planned synchronously, in order to coordinate the relationship between the two. In addition, high-level talent supply and technical support should be incorporated into essential areas to support economic development, attaching importance to the development of high-skilled talents and high-quality scientific research.
Thirdly, the authorities should pay attention to the dual functions of government guidance and market decisions. The introduction of symbiotic media, such as the government, as the main body of regulation and intermediaries, evolves the collaborative innovation model of various regions to a higher level, with the government needing to change from R&D management to innovation services. Based on being market-led, the breadth and depth of innovation cooperation should be improved by guiding effective exchanges between industry, education, and research.
Finally, the effective link between R&D innovation and achievement transformation should be realized, thus promoting the development of regional symbiotic systems into an integrated model. In addition, the government should rationally allocate inter-regional innovation resources and strengthen the linkage between the central and western regions and eastern region.

Author Contributions

Conceptualization, F.Z.; methodology, F.Z., Y.L. and M.N.I.S.; validation, Y.L. and M.N.I.S.; data curation, F.Z. and Y.L.; writing—original draft preparation, F.Z. and Y.L.; writing—review and editing, F.Z., Y.L. and M.N.I.S. All authors have read and agreed to the published version of the manuscript.

Funding

This work is funded by the Research Center of Vocational Education Development, Chengdu University, Chengdu, China, under the project entitled “Realistic characteristics and path optimization of integrated development of industry, education and city in Chengdu and Chongqing twin cities economic circle”, grant number CDZJZX2022A02.

Institutional Review Board Statement

Not applicable.

Informed Consent Statement

Not applicable.

Data Availability Statement

Not applicable.

Conflicts of Interest

The authors declare no conflict of interest.

References

  1. Eom, B.Y.; Lee, K. Determinants of Industry-Academy Linkages and, Their Impact on Firm Performance: The Case of Korea as a Latecomer in Knowledge Industrialization. Res. Policy 2010, 39, 625–639. [Google Scholar] [CrossRef]
  2. Xu, X.; Zhu, Y.; Xu, L.; Wang, Z. Influence of Industry-University Cooperation on Economic Development: A Mathematical Statistical Analysis. Math. Probl. Eng. 2021, 2021, 6645978. [Google Scholar] [CrossRef]
  3. Cui, Z.; Li, E. Does Industry-University-Research Cooperation Matter? An Analysis of Its Coupling Effect on Regional Innovation and Economic Development. Chin. Geogr. Sci. 2022, 32, 915–930. [Google Scholar] [CrossRef]
  4. Motoyama, Y. Long-Term Collaboration between University and Industry: Acase Study of Nanotechnology Development in Japan. Technol. Soc. 2014, 36, 39–51. [Google Scholar] [CrossRef]
  5. Rybnicek, R.; Königsgruber, R. What Makes Industry–University Collaboration Succeed? A Systematic Review of the Literature. J. Bus. Econ. 2019, 89, 221–250. [Google Scholar] [CrossRef] [Green Version]
  6. Moore, A.W.; King, L.; Dale, A.; Newell, R. Toward an Integrative Framework for Local Development Path Analysis. Ecol. Soc. 2018, 23, art13. [Google Scholar] [CrossRef] [Green Version]
  7. Bai, X.-J.; Li, Z.-Y.; Zeng, J. Performance Evaluation of China’s Innovation during the Industry-University-Research Collaboration Process—An Analysis Basis on the Dynamic Network Slacks-Based Measurement Model. Technol. Soc. 2020, 62, 101310. [Google Scholar] [CrossRef]
  8. Etzkowitz, H. The Triple Helix: University–Industry–Government Innovation in Action; Etzkowitz, H., Ed.; Routledge: New York, NY, USA; Routledge: London, UK, 2008; ISBN 978-0-415-96451-7. [Google Scholar]
  9. Farinha, L.; Ferreira, J.; Gouveia, B. Networks of Innovation and Competitiveness: A Triple Helix Case Study. J. Knowl. Econ. 2016, 7, 259–275. [Google Scholar] [CrossRef]
  10. Lan, J. A Dynamic Analysis of Triple Helix of Industry-University-Research Institution: The Case of China. In Proceedings of the 2008 4th International Conference on Wireless Communications, Networking and Mobile Computing, Dalian, China, 12–17 October 2008; pp. 1–6. [Google Scholar]
  11. Li, E.; Yao, F.; Xi, J.; Guo, C. Evolution Characteristics of Government-Industry-University-Research Cooperative Innovation Network for China’s Agriculture and Influencing Factors: Illustrated According to Agricultural Patent Case. Chin. Geogr. Sci. 2018, 28, 137–152. [Google Scholar] [CrossRef] [Green Version]
  12. Tu, Z.Z.; Gu, X.; Ye, Y.J. Synergy Evaluation of Industry-University-Research Institute Synergetic Innovation System Based on Knowledge Creation. J. Discret. Math. Sci. Cryptogr. 2017, 20, 361–376. [Google Scholar] [CrossRef]
  13. Tsaramirsis, G.; Kantaros, A.; Al-Darraji, I.; Piromalis, D.; Apostolopoulos, C.; Pavlopoulou, A.; Alrammal, M.; Ismail, Z.; Buhari, S.M.; Stojmenovic, M.; et al. A Modern Approach towards an Industry 4.0 Model: From Driving Technologies to Management. J. Sens. 2022, 2022, 5023011. [Google Scholar] [CrossRef]
  14. Grimpe, C.; Hussinger, K. Formal and Informal Knowledge and Technology Transfer from Academia to Industry: Complementarity Effects and Innovation Performance. Ind. Innov. 2013, 20, 683–700. [Google Scholar] [CrossRef] [Green Version]
  15. Huang, C.; Lin, F.; Chu, D.; Wang, L.; Liao, J.; Wu, J. Spatiotemporal Evolution and Trend Prediction of Tourism Economic Vulnerability in China’s Major Tourist Cities. ISPRS Int. J. Geo-Inf. 2021, 10, 644. [Google Scholar] [CrossRef]
  16. Wu, Y.; Li, X.; Zhang, Z. An Empirical Study on the Influencing Factors of Knowledge Governance of Industry-University-Research Synergetic Innovation; Springer International Publishing: Berlin/Heidelberg, Germany, 2021; Volume 79, ISBN 9783030792060. [Google Scholar]
  17. Li, B.; Luo, X.; Su, Y. Evolution Mechanism of the Original Innovation System of an Enterprise’s Industry-University-Research Cooperation. Harbin Gongcheng Daxue Xuebao/J. Harbin Eng. Univ. 2014, 35, 654–660. [Google Scholar] [CrossRef]
  18. Atteridge, A.; Remling, E. Is Adaptation Reducing Vulnerability or Redistributing It? WIREs Clim. Change 2018, 9, e500. [Google Scholar] [CrossRef]
  19. Huang, C.Y. How Background, Motivation, and the Cooperation Tie of Faculty Members Affect Their University–Industry Collaboration Outputs: An Empirical Study Based on Taiwan Higher Education Environment. Asia Pac. Educ. Rev. 2018, 19, 413–431. [Google Scholar] [CrossRef]
  20. Fu, L.; Zhou, X.; Luo, Y. The Research on Knowledge Spillover of Industry-University-Research Institute Collaboration Innovation Network. In Proceedings of the 19th International Conference on Industrial Engineering and Engineering Management, Changsha, China, 27–29 October 2012; Springer: Berlin, Heidelberg, 2013; pp. 361–371, ISBN 9783642384264. [Google Scholar]
  21. Kates, R.W.; Clark, W.C.; Corell, R.; Hall, J.M.; Jaeger, C.C.; Lowe, I.; McCarthy, J.J.; Schellnhuber, H.J.; Bolin, B.; Dickson, N.M.; et al. Environment and Development: Sustainability Science. Science 2001, 292, 641–642. [Google Scholar] [CrossRef] [PubMed]
  22. Turner, B.L.; Kasperson, R.E.; Matsone, P.A.; McCarthy, J.J.; Corell, R.W.; Christensene, L.; Eckley, N.; Kasperson, J.X.; Luers, A.; Martello, M.L.; et al. A Framework for Vulnerability Analysis in Sustainability Science. Proc. Natl. Acad. Sci. USA 2003, 100, 8074–8079. [Google Scholar] [CrossRef] [PubMed] [Green Version]
  23. Janssen, M.A.; Schoon, M.L.; Ke, W.; Börner, K. Scholarly Networks on Resilience, Vulnerability and Adaptation within the Human Dimensions of Global Environmental Change. Glob. Environ. Change 2006, 16, 240–252. [Google Scholar] [CrossRef] [Green Version]
  24. Etzold, B.; Sakdapolrak, P. Socio-Spatialities of Vulnerability towards a Polymorphic Perspective in Vulnerability Research. J. Geogr. Soc. Berlin 2016, 4, 234–251. [Google Scholar] [CrossRef]
  25. Bao, L. The Research on Social Capital of Industry-University-Research Institute Cooperation. Asian Soc. Sci. 2009, 4, 118–176. [Google Scholar] [CrossRef] [Green Version]
  26. Frazier, T.G.; Thompson, C.M.; Dezzani, R.J. A Framework for the Development of the SERV Model: A Spatially Explicit Resilience-Vulnerability Model. Appl. Geogr. 2014, 51, 158–172. [Google Scholar] [CrossRef]
  27. Rocha, K.; Moreira, A. The Role of Domestic Fundamentals on the Economic Vulnerability of Emerging Markets. Emerg. Mark. Rev. 2010, 11, 173–182. [Google Scholar] [CrossRef]
  28. Wang, C.C. Reconsidering the Economic Vulnerability Index of the United Nations. Can. J. Dev. Stud. 2013, 34, 553–568. [Google Scholar] [CrossRef]
  29. Gnangnon, S.K. Effect of Multilateral Trade Liberalization on Foreign Direct Investment Outflows amid Structural Economic Vulnerability in Developing Countries. Res. Int. Bus. Financ. 2018, 45, 15–29. [Google Scholar] [CrossRef]
  30. Guillaumont, P. The Concept of Structural Economic Vulnerability and Its Relevance for the Identification of the Least Developed Countries and Other Purposes (Nature, Measurement, and Evolution). CDP Backgr. Pap. 2011, 12, 1–7. [Google Scholar]
  31. Cheng, J.; Tao, J.P. Fuzzy Comprehensive Evaluation of Drought Vulnerability Based on the Analytic Hierarchy Process—An Empirical Study from Xiaogan City in Hubei Province. Agric. Agric. Sci. Procedia 2010, 1, 126–135. [Google Scholar] [CrossRef] [Green Version]
  32. Chen, J.; Yang, X.; Yin, S.; Wu, K. The Vulnerability Evolution and Simulation of the Social-Ecological Systems in the Semi-Arid Area Based on the VSD Framework. Dili Xuebao/Acta Geogr. Sin. 2016, 71, 1172–1188. [Google Scholar] [CrossRef]
  33. Wu, J.; Han, G.; Zhou, H.; Li, N. Economic Development and Declining Vulnerability to Climate-Related Disasters in China. Environ. Res. Lett. 2018, 13, 034013. [Google Scholar] [CrossRef]
  34. Sarker, M.N.I.; Cao, Q.; Wu, M.; Hossin, M.A.; Alam, G.M.; Shouse, R.C. Vulnerability and Livelihood Resilience in the Face of Natural Disaster: A Critical Conceptual Review. Appl. Ecol. Environ. Res. 2019, 17, 12769–12785. [Google Scholar] [CrossRef]
  35. Huq, M.E.; Shao, Z.; Al Dughairi, A.A.; Sarker, M.N.I.; Bowen, C.; Al Mamun, A.; Saleem, N.; Javed, A.; Rahman, M.M. Measuring Vulnerability to Flash Flood of Urban Dwellers. In Wadi Flash Floods; Springer: Singapore, 2022; pp. 317–354. ISBN 9789811629044. [Google Scholar]
  36. Fan, Y.; Fang, C.; Zhang, Q. Coupling Coordinated Development between Social Economy and Ecological Environment in Chinese Provincial Capital Cities—Assessment and Policy Implications. J. Clean. Prod. 2019, 229, 289–298. [Google Scholar] [CrossRef]
  37. Wan, J.; Zhang, L.; Yan, J.; Wang, X.; Wang, T. Spatial–Temporal Characteristics and Influencing Factors of Coupled Coordination between Urbanization and Eco-Environment: A Case Study of 13 Urban Agglomerations in China. Sustainability 2020, 12, 8821. [Google Scholar] [CrossRef]
  38. Ariken, M.; Zhang, F.; Weng Chan, N.; Kung, H. Coupling Coordination Analysis and Spatio-Temporal Heterogeneity between Urbanization and Eco-Environment along the Silk Road Economic Belt in China. Ecol. Indic. 2021, 121, 107014. [Google Scholar] [CrossRef]
  39. Li, W.; Xia, H.; Guo, W. Distributed Data Collaborative Fusion Method for Industry-University-Research Cooperation Innovation System Based on Machine Learning; Springer International Publishing: Berlin/Heidelberg, Germany, 2021; Volume 347, ISBN 9783030678708. [Google Scholar]
  40. Wang, S.; Wang, J.; Wei, C.; Wang, X.; Fan, F. Collaborative Innovation Efficiency: From within Cities to between Cities—Empirical Analysis Based on Innovative Cities in China. Growth Change 2021, 52, 1330–1360. [Google Scholar] [CrossRef]
  41. Li, Z.; Wan, T.; Lan, J. Substitution or Complementarity: Influence of Industry–University–Research-Institute Cooperation Governance Mechanism on Knowledge Transfer—An Empirical Analysis from China. Sustainability 2022, 14, 7606. [Google Scholar] [CrossRef]
  42. Changle, X.; Tingting, X. Status Quo, Problems and Development Countermeasures of Industrial Division of Labor and Cooperation in the Yangtze River Economic Belt. Resour. Environ. Yangtze River Basin 2015, 24, 1634–1638. [Google Scholar]
  43. Li, M.; Zhang, M.; Agyeman, F.O.; ud din Khan, H.S. Research on the Influence of Industry-University-Research Cooperation Innovation Network Characteristics on Subject Innovation Performance. Math. Probl. Eng. 2021, 2021, 4771113. [Google Scholar] [CrossRef]
  44. Zhao, Y.; Wang, S.; Zhou, C. Understanding the Relation between Urbanization and the Eco-Environment in China’s Yangtze River Delta Using an Improved EKC Model and Coupling Analysis. Sci. Total Environ. 2016, 571, 862–875. [Google Scholar] [CrossRef]
  45. Lifeng, H. Solidly Promote the High-Quality Developmen Map River Economic Belt. 2019, pp. 1–5. Available online: http://www.qstheory.cn/dukan/qs/2019-09/16/c_1124994831.htm (accessed on 10 December 2021).
  46. Liu, J.; Tian, Y.; Huang, K.; Yi, T. Spatial-Temporal D ifferentiation of the Coupling Coordinated Development of Regional Energy-Economy-Ecology System: A Case Study of the Yangtze River Economic Belt. Ecol. Indic. 2021, 124, 107394. [Google Scholar] [CrossRef]
  47. Buesa, M.; Heijs, J.; Baumert, T. The Determinants of Regional Innovation in Europe: A Combined Factorial and Regression Knowledge Production Function Approach. Res. Policy 2010, 39, 722–735. [Google Scholar] [CrossRef]
  48. Graf, H.; Henning, T. Public Research in Regional Networks of Innovators: A Comparative Study of Four East German Regions. Reg. Stud. 2009, 43, 1349–1368. [Google Scholar] [CrossRef]
  49. Cowan, R.; Zinovyeva, N. University Effects on Regional Innovation. Res. Policy 2013, 42, 788–800. [Google Scholar] [CrossRef]
  50. Fritsch, M.; Slavtchev, V. How Does Industry Specialization Affect the Efficiency of Regional Innovation Systems? Ann. Reg. Sci. 2010, 45, 87–108. [Google Scholar] [CrossRef] [Green Version]
  51. Speranza, C.I.; Wiesmann, U.; Rist, S. An Indicator Framework for Assessing Livelihood Resilience in the Context of Social–Ecological Dynamics. Glob. Environ. Change 2014, 28, 109–119. [Google Scholar] [CrossRef]
  52. Polsky, C.; Neff, R.; Yarnal, B. Building Comparable Global Change Vulnerability Assessments: The Vulnerability Scoping Diagram. Glob. Environ. Change 2007, 17, 472–485. [Google Scholar] [CrossRef]
  53. Acosta-Michlik, L.; Espaldon, V. Assessing Vulnerability of Selected Farming Communities in the Philippines Based on a Behavioural Model of Agent’s Adaptation to Global Environmental Change. Glob. Environ. Change 2008, 18, 554–563. [Google Scholar] [CrossRef]
  54. Sarker, M.N.I.; Wu, M.; Alam, G.M.; Shouse, R.C. Livelihood Vulnerability of Riverine-Island Dwellers in the Face of Natural Disasters in Bangladesh. Sustainability 2019, 11, 1623. [Google Scholar] [CrossRef] [Green Version]
  55. Chen, P.; Chen, X. Summary on Research of Coupled Human-Environment System Vulnerability under Global Environmental Change. Prog. Geogr. 2010, 29, 454–462. [Google Scholar] [CrossRef]
  56. Sarker, M.N.I.; Wu, M.; Shouse, R.C.; Ma, C. Administrative Resilience and Adaptive Capacity of Administrative System: A Critical Conceptual Review. In Lecture Notes on Multidisciplinary Industrial Engineering; Xu, J., Ahmed, S., Cooke, F., Duca, G., Eds.; Springer Nature: Cham, Switzerland, 2019; pp. 1–13. [Google Scholar]
  57. Lixin, Z.; Xinjun, Y.; Jia, C.; Ziqiao, W.; Jing, Z.; Jie, Y. Vulnerability Evaluation and Impact Mechanism of Human-Land System in the Great Ruins Area: A Case Study of the Great Ruins Area of Han Chang’an City. Resour. Sci. 2015, 37, 1848–1859. [Google Scholar]
  58. Zhang, H.; Chen, W.; Liu, Z. Spatiotemporal Evolution of Entrepreneurial Activities and Its Driving Factors in the Yangtze River Delta, China. Land 2022, 11, 216. [Google Scholar] [CrossRef]
  59. Li, Z.; Wu, J.; Cui, X.; Mi, Z.; Peng, L. Assessment and Influencing Factors Analysis of Economic System Vulnerability of the Belt and Road Initiative Countries. PLoS ONE 2022, 17, e0262611. [Google Scholar] [CrossRef] [PubMed]
  60. Morandi, V. The Management of Industry–University Joint Research Projects: How Do Partners Coordinate and Control R&D Activities? J. Technol. Transf. 2013, 38, 69–92. [Google Scholar] [CrossRef]
  61. Shin, S.J.; Kim, T.Y.; Lee, J.Y.; Bian, L. Cognitive Team Diversity and Individual Team Member Creativity: A Cross-Level Interaction. Acad. Manag. J. 2012, 55, 197–212. [Google Scholar] [CrossRef]
  62. Tang, D.; Mao, M.; Shi, J.; Hua, W. The Spatio-Temporal Analysis of Urban-Rural Coordinated Development and Its Driving Forces in Yangtze River Delta. Land 2021, 10, 495. [Google Scholar] [CrossRef]
  63. Nicli, S.; Elsen, S.U.; Bernhard, A. Eco-Social Agriculture for Social Transformation and Environmental Sustainability: A Case Study of the UPAS-Project. Sustainability 2020, 12, 5510. [Google Scholar] [CrossRef]
  64. Zhang, S.; Wang, X. Does Innovative City Construction Improve the Industry–University–Research Knowledge Flow in Urban China? Technol. Forecast. Soc. Change 2022, 174, 121200. [Google Scholar] [CrossRef]
  65. Anklam, P. Knowledge Management: The Collaboration Thread. Bull. Am. Soc. Inf. Sci. Technol. 2002, 28, 8. [Google Scholar] [CrossRef]
  66. Salazar, A.E.R.; Domínguez-Crespo, M.A.; Torres-Huerta, A.M.; Licona-Aguilar, A.I.; Nivón-Pellón, A.; Orta-Guzmán, V.N. Analysis of the Dynamical Capabilities into the Public Research Institutes to Their Strategic Decision-Making. Sustainabi.ity 2021, 13, 6672. [Google Scholar] [CrossRef]
  67. Dai, P.; Lin, Y. Should There Be Industrial Agglomeration in Sustainable Cities?: A Perspective Based on Haze Pollution. Sustainability 2021, 13, 6609. [Google Scholar] [CrossRef]
Figure 1. Index values of the industry–university–research (IUR) cooperation and economic system of the Yangtze River Economic Belt (YREB).
Sustainability 14 12919 g001
Figure 2. Spatial characteristics of the vulnerability index of the IUR cooperation and economic development system in the Yangtze River Economic Belt (YREB) from 2006–2018.
Sustainability 14 12919 g002
Figure 3. Moran I Index scatter chart of the vulnerability index of the IUR cooperation and economic system in the Yangtze River Economic Belt (YREB) (2006–2018).
Sustainability 14 12919 g003
Figure 4. LISA agglomeration chart of the vulnerability index of the IUR cooperation and economic system in the Yangtze River Economic Belt (YREB) (from 2006–2018).
Sustainability 14 12919 g004
Figure 5. Framework of industry–university–research (IUR) cooperation to promote economic development.
Sustainability 14 12919 g005
Table 1. Evaluation index system of IUR cooperation and economic system vulnerability.
System LayerDimension LayerIndex LayerNature
Industry–university–research (IUR) cooperation and cIndustryGovernment funds in R&D expenditure (10 thousand yuan)Sensitivity (S)
Internal expenditure of R&D expenditure (10 thousand yuan)Coping ability (R)
New product development funds accounted for as a proportion of main business income (%)Sensitivity (S)
Proportion of new product sales revenue to main business revenue (%)Sensitivity (S)
Number of R&D projects (a)Coping ability (R)
R&D project personnel accounted for as a proportion of all employees (%)Sensitivity (S)
R&D project funding investment (10 thousand yuan)Coping ability (R)
Number of enterprise R&D institutions (a)Coping ability (R)
Number of invention patents (pieces)Coping ability (R)
High-paying technology industry accounted for as a proportion of main business income (%)Sensitivity (S)
UniversityGovernment funds in R&D expenditure (10 thousand yuan)Sensitivity (S)
Internal expenditure of R&D expenditure (10 thousand yuan)Coping ability (R)
R&D project personnel accounted for as a proportion of all employees (%)Sensitivity (S)
Number of R&D projects (a)Coping ability (R)
R&D project personnel input (persons)Coping ability (R)
R&D project funding investment (10 thousand yuan)Coping ability (R)
Number of R&D institutions owned (a)Coping ability (R)
Number of invention patents (pieces)Coping ability (R)
Number of scientific papers published (papers)Coping ability (R)
Research institutionGovernment funds in R&D expenditure (10 thousand yuan)Sensitivity (S)
Internal expenditure of R&D expenditure (10 thousand yuan)Coping ability (R)
R&D project personnel accounted for as a proportion of all employees (%)Sensitivity (S)
Number of R&D projects (a)Coping ability (R)
R&D project personnel input (persons)Coping ability (R)
R&D project funding investment (10 thousand yuan)Coping ability (R)
Number of R&D institutions owned (a)Coping ability (R)
Number of invention patents (pieces)Coping ability (R)
Number of scientific papers published (papers)Coping ability (R)
Industry–university–research (IUR) interactionTechnology market turnover (100 million yuan)Sensitivity (S)
Amount of funds from enterprises in funds for scientific and technological activities of universities and scientific research institutions (10 thousand yuan)Sensitivity (S)
Number of patents applied for by the three parties of industry, university, and research, or by two of them, jointly accounted for as a proportion of the total number of patents (%)Sensitivity (S)
Number of papers published by industry–university–research (IUR) cooperation (papers)Sensitivity (S)
Economic developmentGross domestic product (GDP) per capita (yuan)Coping ability (R)
Local public budget revenue (100 million yuan)Coping ability (R)
Per capita disposable income of urban residents (yuan)Coping ability (R)
Per capita disposable income of rural residents (yuan)Coping ability (R)
Proportion of tertiary industry in GDP (%)Sensitivity (S)
R&D expenditure as a proportion of GDP (%)Sensitivity (S)
Overall labor productivity (%)Coping ability (R)
Regional innovation ability index (constant)Coping ability (R)
Degree of deviation of industrial structure (constant)Sensitivity (S)
Industrial structure advanced index (constant)Sensitivity (S)
Table 2. Global Moran I index of the IUR cooperation and economic system of the Yangtze River Economic Belt (YREB).
YearMoran’s I Indexz-Valuep-Value
20060.266 1.9470.030
20100.3572.4330.020
20140.327 2.1920.025
20180.2931.9490.045
Publisher’s Note: MDPI stays neutral with regard to jurisdictional claims in published maps and institutional affiliations.

