Abstract
Sustainable urban development is a dynamic, continuous, and long-term process. However, only a few studies have considered the continuous changes in urban development levels over time. From a novel perspective of multivariate functional data, this study aims to analyze the sustainable development capability of cities through dynamic evaluation, and to explore the differences in the level of sustainable development of cities. Firstly, a sustainable urban development evaluation system with 18 indicators across the economic, social, and environmental indices is established. Secondly, based on the index system, an entropy weight method for functional data is developed to assign weights to the indicators. The time weight is used to consider the effects of missing values. Then, a new method of urban development level clustering is proposed. Thirdly, the differences in sustainable urban development levels among the 33 cities in China from 2005 to 2019 are analyzed, and the cities are separated into 5 categories. The results show that the coordinated development of the economy, society, and environment can promote the sustainable development of cities. The overall level of sustainable development in Chinese cities is not high, and significant differences are observed in sustainable urban development. Notable differences and significant imbalances are observed between the sustainable development level of the cities in the central and western regions of China and the cities in the eastern coastal areas. Finally, relevant conclusions and suggestions are proposed to improve sustainable urban development.
1. Introduction
Achieving sustainable urban development has become the focus of international attention [1,2] and the core objective for urban planners and managers [3] because of the fast urbanization. The United Nations 2030 Agenda for Sustainable Development sets out 17 Sustainable Development Goals (SDGs), including the following target for cities (Goal 11): "Make cities inclusive, safe, resilient and sustainable" [4]. According to the United Nations World Investment Report 2020, almost $1.3 trillion is being allocated toward sustainable development [5]. The worldwide population will continue to urbanize in the next 10 years, increasing by 56.2–60.4% by 2030 [6]. The uncontrolled urban expansion will, however, lead to many challenges. For example, cities with backward economic development have a low ability to attract talent and corresponding economic activities, thus, restricting the sustainable development of cities; cities with imperfect social development cannot meet the needs of residents for essential public services, such as education and medical care, and they face the dilemma of uncoordinated urban development; some cities consume natural resources excessively, causing environmental damage, which is unsustainable to maintain rapid economic growth [7,8,9]. How to maintain long-term sustainable urban development is an essential and meaningful issue.
In 1987, the concept of sustainability was first introduced, and its three pillars are economic, social, and environmental sustainability [10]. Some scholars currently use the three elements of society, economics, and the environment to explain urban sustainability and sustainable urban development. Tang et al. defined urban sustainability as a state that comprehensively considers economic, social, environmental, and other factors for the continuous development of an urban complex system developed with balance, stability, and coordination [11]. Sustainable urban development is the realization of long-term, stable, and continuous economic growth and structural optimization in a specific time and space, thereby realizing urbanization and urban modernization. It involves economic, social, and environmental aspects, and it aims to promote the urban economy and the harmonious development of urban society and the environment [3,12]. Accordingly, urban sustainability focuses on the conditions and status of urban development, while sustainable urban development emphasizes the process of urban development.
Furthermore, urban sustainability research plays a key role in sustainable urban development, thus, helping policymakers to better conceptualize the sustainability of cities and providing them with diverse evaluation index systems to assess the strengths and weaknesses of city development [11]. Qualitative and quantitative analyzes are mainly used in urban sustainability research [13]. The qualitative analysis focuses on the processes, trends, and future directions of urban development [14,15,16,17]. For instance, Fan et al. [18] investigated the evolution and influence of policies in numerous sustainable urban development domains. Cao et al. [19] described the difficulties that Chinese cities encounter in sustainable development. Quantitative studies often use various statistical tools to conduct empirical research on the level of sustainable urban development [20,21,22,23,24]. For instance, Ding et al. [25] employed the TOPSIS–entropy approach to evaluate the sustainable development level of 287 Chinese cities quantitatively and to analyze their spatial distribution. Wang et al. [26] examined the sustainable urban development of 13 cities in Jiangsu Province by using an enhanced ML indicator analysis approach based on a novel directional distance function. Shaker et al. [27] used 25 multi-indicator indices to evaluate 36 European nations quantitatively and geographically by using cluster analysis.
Research on sustainable urban development has been deepening and improving in recent years [28,29,30,31,32]. The research objects and evaluation indicators have gradually changed from a single city and a single evaluation index to multiple cities and a multi-indicator evaluation system [33,34,35,36,37,38,39]. For instance, Wei et al. [40] assembled 54 variables and associated thresholds into an urban carrying capacity evaluation framework to examine Beijing’s ability for sustainable growth. Lin et al. [41] calculated the sustainable development level of Suzhou City in the target years (2000, 2005, 2010, and 2016) based on the constructed evaluation index system of sustainable urban development combined with the entropy–fuzzy comprehensive evaluation method. Tang et al. [11] established an evaluation index system that includes 39 economic, social, and environmental indicators to evaluate and rank the sustainable development level of 16 cities in Anhui Province in 2017. Zhang et al. [42] selected 11 variables to calculate the sustainability score of each factor based on society, economy, environment, and resource utilization for 16 cities in the Yangtze River Delta region in 2000 and 2005.
However, most of the above-mentioned research involved single-year cross-sectional or multi-year panel data, and a few studies consider the continuous changes in urban development levels over time. Sustainable urban development should be seen as an ongoing process rather than a single event [43]. Ding et al. [44] outlined an inclusive causal framework for sustainable development (SD) evaluation entitled “Trinity of Cities Sustainability from Spatial, Logical, and Time Dimensions” (TCS-SLTD). The research on sustainable urban development involves long-term economic, social, and environmental development, which requires long-term dynamic data accumulation. Single-year or short-period data are not enough to comprehensively and objectively determine the different characteristics and sustainable development trends of cities and serve as the basis for the analysis of different development routes of cities and the deep-seated reasons for their formation. Therefore, dynamic, continuous, and long-term data need to be obtained to explore the level of sustainable urban development.
With the onset of the big data era, functional data emerged in many scientific fields because of the sophisticated data storage and collection capacities. Unlike traditional classical data that are discontinuous and noisy, functional data are usually recorded in the form of curves or images, and each observation is a continuous function. Functional data were first comprehensively studied by the Canadian statistician Ramsay [45]. A series of statistical tools have been developed in recent decades for the analysis of functional data [46,47]. Sustainable urban development indicators, such as per capita GDP, per capita disposable income of urban residents, and urban population, sequentially collected over a certain period can be regarded as functional data. Additionally, the entire sustainable urban development index system can be regarded as multivariate functional data that simultaneously describes multiple functional variables, which can simultaneously consider the correlation between multiple variables and the variations in different variables over time. In recent years, multivariate functional data analysis has begun to attract attention [48,49]. Considering the importance of the continuous time factors in the study of sustainable urban development levels, the differences in sustainable urban development levels should be analyzed from the perspective of multivariate functional data.
Moreover, the application of functional data analysis methods in sustainable urban development research has many advantages. Firstly, for the long-term continuous observations collected in sustainable urban development research, traditional statistical or econometric methods for cross-sectional, time series, or panel data often require strong model assumptions. By contrast, functional data analysis methods rely on much weaker assumptions. Secondly, traditional data analysis techniques can be difficult to apply directly and may experience inefficiency and information loss if the continuous long-term observations are dense. In addition, the use of tools, such as data smoothing and visualization, allows the functional data analysis approach to effectively leverage the dynamic information contained in continuous data to better explore the dynamic process of sustainable urban development.
Based on the fresh perspective of multivariate functional data, this paper studies and analyzes the sustainable development level of 33 cities in China. We provide scientific suggestions to promote the sustainable development of cities. The main contributions of the study are as follows: (1) the development of a sustainable urban development evaluation index system that measures the capacity for sustainable development of various cities from three aspects of the economic, social and environment; (2) the application of an entropy weight method to determine the weight coefficient of each functional index in the similarity measurement of multivariate functional data, which fully considers the dynamic data characteristics of urban development levels; (3) direct use of multi-index data for similarity measurement to overcome the information loss problem caused by the fusion of multiple indicators into a single composite index in existing research; (4) the determination of the average value of the comprehensive indicators of the sustainable development level of various cities based on the multivariate functional data similarity measurement method to define the sustainable development level of multiple cities and, thus, provide objective and scientific evaluation results.
The research aim of this study is based on a new perspective of multivariate functional data to analyze the sustainable development capability of cities through dynamic evaluation, explore the differences in the level of sustainable development of cities, and to provide suggestions to promote cities’ sustainable development. The rest of the paper is organized as follows. In Section 2, the sustainable urban development evaluation framework is introduced. Section 3 introduces the method for evaluating the level of sustainable urban development. In Section 4, the evaluation method is applied to an empirical study of 33 cities in China, and the evaluation results are described. Finally, Section 5 provides the conclusions and suggestions.
2. Sustainable Urban Development Evaluation Framework
The development of sustainable urban indicator systems generally accepts that sustainability comprises people (social sustainability), the environment (environmental sustainability), and the economy (economic sustainability) [50]. Sustainable urban development research has generally embraced this idea of sustainability [51].
Sustainable urban development can be measured entirely, systematically, and scientifically by constructing a collection of indicator systems from different indicators and evaluating, assessing, and analyzing it from numerous perspectives [52]. In addition to being a fundamental tool for providing data to support policy and decision-making, the evaluation index system for sustainable urban development is also a suitable scientific technique for managing sustainable urban development [13,53].
The current study uses different index systems to assess sustainable urban development in the economic, social, and environmental spheres. Several academics have explored the sustainable urban development evaluation index system in terms of economic, social, and environmental aspects [11,20,21,22,54]. However, some index systems consider one or two factors. For instance, Yang et al. only considered sustainable urban economic and social components, ignoring environmental sustainability [55]. Only the social and environmental aspects of the index were considered by the Environmental Sustainability Index created by Columbia University and the Environmental Performance Index created by Yale University [56,57,58]. Other dimensions have also been considered in some studies. For instance, Michalina et al. considered the institutional aspect in addition to the economic, social, and environmental aspects in the development of sustainable urban indicator frameworks [53]. In summary, for the comprehensive evaluation of sustainable urban development, economy, society, and environment should be considered. These three subsystems should coordinate and balance to achieve the stability and development of the urban system in sustainable urban development.
3. Materials and Methods
3.1. Data
The data in this paper are mainly obtained from the China City Statistical Yearbook [59], the statistical bulletin of national economic and social development issued by local governments, and the official websites of urban statistical bureaus. We collected 18 indicators that reflect each city’s economic, social, and environmental development (part of the index values are processed per capita) to evaluate the sustainable development level of each city. Considering that the indicators in this paper cover a long period of time, not all cities in China calculated these indicators. The indicator data of the 33 cities selected in this paper are relatively complete, and most of the cities are Chinese provincial capitals. Accordingly, they are used as the research object.
3.2. Methods
To assess the degree of sustainable development in 33 cities, we analyze multivariate functional data clustering using R software. The R software code employed in this study appears in Part III of the Supplementary Materials.
3.2.1. Discrete Data Smoothing
The research object of this paper involves 15 years of urban evaluation indicators, which are discrete and noisy in the collection process and have no apparent periodic nature. Before performing functional data analysis, the discrete data are processed to remove the noise, and smoothed to obtain a continuous functional curve. The evaluation index sequence of urban development is set as follows: where the subscript represents 33 cities, and the subscript represents one of the 18 indicators. The following functional data observation model is established in Equation (1):
where is the measurement error, and is the observed value of the th indicator of the th city at the moment . A local polynomial kernel smoothing method [60] is used to fit the function , in which the observed points near the target point are used to fit the value of this target point, and the observed point that is closer to the target point has a larger weight and a greater influence on the estimation of .
3.2.2. Calculation of Weights
- (1)
- Time Weights ().
Considering the large number and period of urban indicators, some indicators have missing values in the collected data, and the number of missing values varies significantly at different time points. A time weight function is applied to offset the effect of missing values when exploring differences in sustainable urban development levels and the more missing values a dataset has at a given time point. A smaller weight will be assigned to this time point. Considering that the number of missing values can only be obtained from discrete observations, the time weights also need to be smoothed as a continuous function. The same local polynomial smoothening method is used to fit the number of the missing value function , and the following time weight function is established in Equation (2):
The specific values of time weights in this paper are shown in Appendix A.
- (2)
- Indicator Weights Based on the Functional Entropy Weight Method ()
Entropy was originally a concept in thermodynamics and was later introduced into information theory by Shannon [61]. In comparison with various subjective weighting models, the most significant advantage of the entropy weight method is that it avoids the interference of human factors on the indicator weights, thus, enhancing the objectivity of the evaluation results [62]. The entropy weight method determines weights based on the amount of information in each indicator. The greater the amount of information, the smaller the uncertainty and the entropy, and the larger the entropy weight. Entropy can be used to measure the amount of information contained in the index data to determine the weight of each index, providing a basis for the comprehensive evaluation of multiple indicators [63,64].
For multivariate functional data, all time points should be considered in the calculation of the weight of the th indicator. Therefore, the classical entropy weight method for discrete data is not applicable. In the present paper, the multivariate functional entropy weight method is used to calculate the indicator weights, and the specific procedure is as follows:
Step 1—Data pre-processing. Different indicators have different scale units and cannot be directly used for comparison and calculation. Therefore, the data need to be standardised. After data standardisation, the indicators have the same magnitude and are suitable for comparative evaluation. The data standardization formula is as follows in Equation (3):
where is the observed value of the th index of the th city at the moment , is the minimum value of the th index among 33 cities at the moment , and is the maximum value of the th index among 33 cities at the moment .
Step 2—The proportion function of the th observation to all observations of the th indicator is calculated as follows in Equation (4):
Step 3—The entropy value and the degree of variation of the th indicator are calculated as follows in Equation (5):
where is the total number of cities. refers to the th year, Urban data for 15 consecutive years is studied ().
Step 4—The indicator weights is calculated as follows in Equation (6):
The specific values of indicator weights in this paper are shown in Appendix A.
3.2.3. An Distance-Based Similarity Measure and Multivariate Functional Clustering
The distance is used to retain the functional features of multivariate functional data to effectively study the differences in sustainable urban development in China without losing data information. Let be the square-integrable function in the space, and the difference in the level of sustainable urban development between the th city and the th city is defined as follows in Equation (7):
By using the similarity measure of the two cities defined above as the ()th element of the matrix, the similarity matrix of the observed multivariate functional data is obtained. Then, the classical hierarchical clustering method is used for the study of sustainable urban development level differences.
3.2.4. Clustering Procedures for Long-term Series Data of Multiple Indicators
According to the above method, Figure 1 shows the cluster analysis process used in this paper. The detailed procedures are as follows:
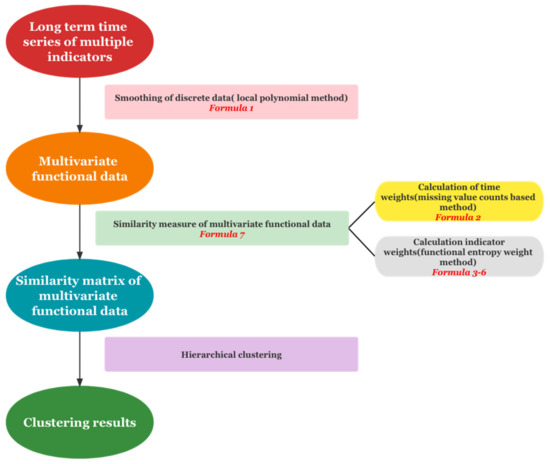
Figure 1.
Procedures visualization of long-term series data cluster analysis.
3.2.5. Defining Hierarchical Clustering Categories
Traditional hierarchical clustering cannot be used to determine the level of sustainable development of various cities after clustering. In this paper, each city’s comprehensive index value of sustainable development is obtained based on the abovementioned multivariate functional data similarity measurement method. According to the results of hierarchical clustering, the average value of the comprehensive indicators of each category of the sustainable development level is obtained. Finally, according to the average value of each category, the sustainable development levels of multiple categories of cities are compared and analyzed. The higher the average value of the city’s comprehensive indicators, the higher the level of sustainable urban development in this category.
We used as the minimum city index value of the th index in year , and as the comprehensive index value of the th city, and the comprehensive index value is calculated as follows in Equation (8):
4. Empirical Analysis
4.1. Construction of the Index System
Based on the understanding of sustainable urban development, an urban sustainable development evaluation index system is constructed from the three classic pillars of sustainable urban development, namely economic, social, and environmental. Among these, the sustainable development of the city’s economy is needed for sustainable urban development. Social development primarily reflects the status and quality of life. The city’s education, culture, and medical care levels are essential to sustainable urban development. The environment is the basis for sustainable urban development. The urban environment presented under the influence of the economic and social system is the living environment and urban ecological status. The indicator system for the level of sustainable urban development developed in this study is shown in Table 1. Additionally, Part II of the Supplementary Materials includes the collected urban data of 18 indicators.

Table 1.
Evaluation index system of sustainable urban development.
Economic development is a prerequisite for the sustainable development of a city. Among the economic development indicators, a city’s overall economic development level is the basis for the assessment factors of sustainable urban development capacity [65]. Sustainable economic development reflects the city’s economic development, and the macroeconomic indicators can reflect the status and changes of the city’s economic development to a certain extent [11]. Therefore, in the present study, EC1 is used to reflect the city’s economic strength and market scale, and EC6 is used to reflect the city’s economic development level changes within a certain period. The fundamental driving force of rapid urban economic growth is the high level of investment, which can reflect the level of sustainable economic development of a city at a certain level. Therefore, EC2 is used as the indicator of sustainable urban economic development. Sustainable economic development aims to raise people’s income and living standards. The EC3 and EC4 factors are selected as indicators because the former reflects the financial living standards of city inhabitants and the latter reflects the average household income of city residents. Furthermore, EC5 is used to represent the city’s economic size in terms of foreign commerce because import and export data are crucial indicators of the city’s sustainable economic direction.
In terms of society, social development mainly reflects the overall level of social development and is the guarantee for sustainable urban development [66]. Sustainable social development is based on improving people’s quality of life, health, and cultural level, and creating a social environment that guarantees people’s freedom, equality, civilization, and harmony. The sustainable development of society primarily reflects the whole city’s quality of life, education, culture, and medical care [11]. Therefore, this paper starts from the above aspects to construct the sustainable development of society. Among the indicators, SO1 represents the ease of urban transport, while SO2 summarises the urban transportation situation; SO4 is used to describe the city’s cultural atmosphere, and SO5 indicates the city’s educational level. Finally, SO3, SO6, and SO7 represent the city’s current housing, tourism, and healthcare conditions, respectively.
Additionally, sustainable development emphasizes the effective control of environmental pollution, the protection of the high quality of the environment, and the provision of a comfortable living environment [25]. Therefore, sustainable environmental development is achieved from the perspective of the urban environment and environmental improvement. In terms of the urban environment, the living environment is an essential factor in the city’s sustainable development, which plays a role in accelerating or delaying the city’s sustainable development. Here, EN1 represents the quantity and quality of greening in the city, EN3 reflects the living environment level of the city, and EN5 shows the coverage of urban green space. Furthermore, water quality and waste disposal are the two most essential criteria for environmental sustainability [67]. Finally, EN2 and EN4 are used to reflect the urban environmental system’s improvement measures and to maintain the urban environment’s sustainability.
In Table 1, in addition to the indicators used in most of the existing literature [1,11,22,25,30,38,39,41,54], the indicators of “the average salary of on-the-job employees”, “number of primary schools per 10,000 people”, and “per capita urban cleaning area” are also used. These three indicators are incorporated into the indicator system because of the following reasons: (1) The higher the average wage on the job, the higher the consumption level of urban residents. Therefore, the average salary of on-the-job employees can reflect the sustainable development level of the urban economy to a certain extent. (2) The number of primary schools can reflect the basic level of urban education, as well as the development potential of the urban population. (3) The per capita urban cleaning area reflects the living environment level of the city. People’s desire to improve the living environment is increasingly urgent, and the improvement of the urban living environment is in line with the needs of public opinion. Therefore, the per capita urban cleaning area is chosen as one of the indicators of environmental development in this paper.
4.2. Data Per Capita
Considering that each city has a different population and most of the indicators are aggregate indicators, the absolute value is used as the basis for comparison. Notably, the urban population will substantially affect the evaluation results of the city. For overpopulated or underpopulated cities, the results may be inaccurate. Comparability is achieved by analyzing the data per capita to obtain relative indicators. Except for some of the per capita data collected, the remaining data have been processed per capita.
4.3. Empirical Evaluation
A three-dimensional scatter plot of the indicator data is generated for the ease of observing the precise form of the data. The study cannot provide all the cities and indicators included in this article because of their sheer number. Accordingly, 8 cities are selected from 33 cities, and their 2005–2019 per capita GDP three-dimensional scatter graph is plotted (Figure 2). The three-dimensional scatter plots of the remaining 17 indicators are included in Part I of the Supplementary Materials. The urban indicators are discrete points and not in the form of a functional curve. However, as the time dimension increases, the functional characteristics will gradually appear. The multiple urban indicators selected in this paper can be regarded as multivariate functional data. Furthermore, the urban index data are arranged quite densely, making it difficult to use traditional cluster analysis methods. Therefore, the data should be analyzed from the perspective of multivariate functional data.
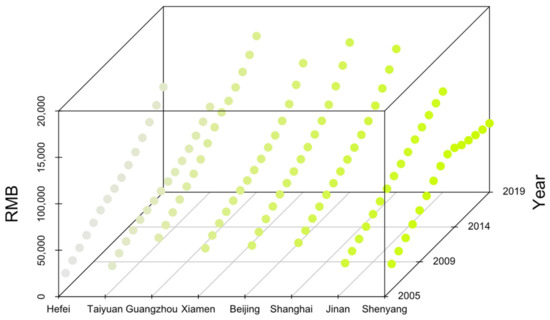
Figure 2.
Three-dimensional view of per capita GDP of eight cities from 2005 to 2019.
Following the basic idea and procedure of the multivariate functional data clustering analysis described above, hierarchical clustering results are obtained based on the observations of 18 indicators in 33 cities using the R software program (Table 2, Figure 3). The comprehensive index value of each sustainable urban development is shown in Table 3. The average comprehensive index of each category of sustainable urban development is shown in Table 4.
Table 2.
Clustering results.
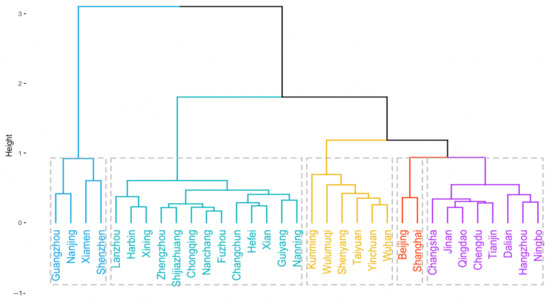
Figure 3.
Cluster dendrogram.
Table 3.
The comprehensive index value of each city.
Table 4.
The average comprehensive index value of each category.
4.4. Result and Discussion
According to the average comprehensive index value of each category of sustainable urban development, the first category of cities has the highest level of sustainable development, which is better than the other four categories. The second category of cities ranks second in the sustainable development level. The sustainable development level of the third category of cities is in the middle level, while that of the fourth category city is behind the third category city, and that of the fifth category city is the lowest.
Additionally, the average values of the indicators of the same city category are obtained and plotted into curves (Figure 4) for a more thorough elaboration and analysis, and for a better assessment of each category of cities.
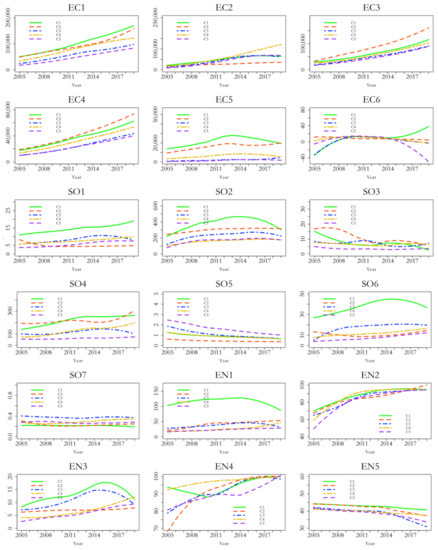
Figure 4.
Average value curve of 18 indicators in 33 cities from 2005 to 2019.
Based on the hierarchical clustering results, the clustering results for 33 cities are visualized (Figure 5). Four cities are included in the first category (purple squares), and they are located in Southeastern China. Two cities are included in the second category (blue circles). Six cities are included in the third category (red triangles), and they are mainly located in the eastern coastal areas and central regions of China. Eight cities are included in the fourth category (orange diamonds), and they are mainly located in the eastern coastal areas and central regions of China. Thirteen cities are included in the fifth category (green squares), and they are mainly located in the western region. The figure shows that cities are clustered spatially, and most cities with high levels of sustainable development are located in the eastern coastal regions of China, whereas those with low levels of sustainable development are located in the western areas of China. Cities in these ‘high’ clusters with relatively high levels of sustainable development can fully share resources, optimize their industrial structures, and use their respective strengths to promote sustainable urban development. Therefore, cities in clusters often have a close relationship and influence sustainable development [25].
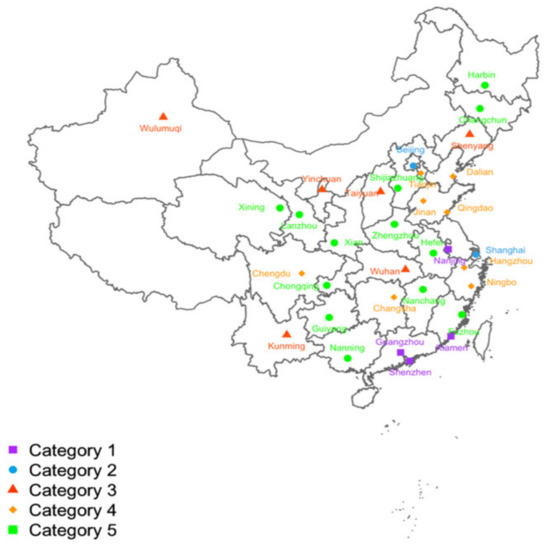
Figure 5.
Clustering results visualization.
The cities in the first category are Shenzhen, Xiamen, Guangzhou, and Nanjing. These four cities have the highest level of sustainable urban development among the 33 cities studied. From a spatial point of view, these four cities are mainly located in the southeastern part of China and are characterized by highly sustainable urban development. These cities have balanced economic, social, and environmental development, and some indicators are far ahead of the four other categories of cities in these three aspects, such as the per capita urban road area, the number of passengers taking public transport per capita, the number of books in public libraries per 100 people, and the number of urban parks per 10,000 people.
The cities in the second category are Beijing and Shanghai. Such cities have a high level of sustainable development. They are the cities with the most potential to become international metropolises in China. Furthermore, these two cities have a solid worldwide reputation and comprehensive development. This category of cities has excellent economic development. The average value of economic development indicators, except the per capita total import and export, is comparable to those of the first category of cities. Several indicators, such as the average salary of on-the-job employees and per capita disposable income of urban households, even outperform the first category of cities. This category of cities lags behind the first category of cities in terms of social and environmental development, such as the number of primary schools per 10,000 people, and lags even behind those of the three other categories of cities.
The cities in the third category are Kunming, Shenyang, Wulumuqi, Wuhan, Taiyuan, and Yinchuan. This category of cities has the middle level of sustainable development, and most of the cities are located in central China. Generally, these cities have a balanced performance in various indicators, which are in the middle of the five categories of cities. Their sustainable development is slightly mediocre and lacks their characteristics. Compared with the first and second categories of cities, the advantages of the third category of cities in terms of economic development are not obvious. A few indicators are higher than those of the first or second category cities, such as the number of hospitals per 10,000 people in social development. These cities still have some gaps in other indicators compared with the first two categories of cities. These cities need to focus on development, make up for their shortcomings, and improve comprehensive strength while maintaining the continuous development of promising areas.
The cities in the fourth category are Dalian, Hangzhou, Ningbo, Changsha, Tianjin, Qingdao, Chengdu, and Jinan. Most of these cities are in the eastern coastal and central regions of China, and the level of sustainable development is relatively low. The development of this category of cities is uneven in all aspects. Most of their indicators lag behind the first three categories of cities and the fifth category of cities, such as the number of passengers taking public transport per capita. Furthermore, some indicators, such as the disposal rate of living garbage harmless, have a smaller gap with the first three categories of cities in terms of environmental development. These cities must invest more energy in sustainable development, reduce the gap with other cities, and improve their comprehensive sustainable development capabilities.
The cities in the fifth category are Guiyang, Hefei, Xian, Changchun, Nanning, Nanchang, Fuzhou, Chongqing, Zhengzhou, Shijiazhuang, Lanzhou, Xining, and Harbin. Most of these cities are located in the western region of China, and the level of sustainable development is relatively low. They are one level behind the four other city categories. The indicators are relatively low, and a pronounced gap is observed compared with the other cities. In terms of economic development, most indicators are close to the fourth category cities and lower than the first three categories. In terms of social development, some indicators, such as the number of primary schools per 10,000 people, are higher than those of the fourth category of cities or even at the leading level among the five categories of cities. The indicators of these cities are relatively low in terms of environmental development, and no apparent advantage is observed. The sustainable development of such cities needs to receive more attention, organizational planning and capital investment need to be pushed, and the sustainable development level of the city needs to be gradually improved.
According to the above clustering analysis, firstly, the cities with high sustainable development levels (the first three categories) are primarily located in the eastern coastal areas. The fourth category of cities is mainly distributed in the central region. In comparison, the cities with low sustainable development levels (the fifth category) are primarily spread in the western region. Other research results are close to this paper’s cluster evaluation results of the urban sustainable development level. For instance, Ding et al. evaluated 287 cities in China at the prefecture level and above. They found that the sustainable development level of coastal cities in Eastern China is relatively high, followed by Central and Northeastern China, and that cities in Western China ranked last [25].
Secondly, most indicators of the cities with the highest level of sustainable development (the first category) are superior to the four other types of cities in terms of economy, society, and environment, with excellent development. Sustainable urban development requires balanced economic, social and environmental development. The collaborative development of these aspects can promote the sustainable development of cities [67].
Finally, according to the existing environmental protection policies and technologies, the environment increasingly restricts sustainable urban development [48]. Although the cities in the second category in this paper have a high level of economic development, their overall sustainable development level lags behind that of the first category of cities because of their large gap in terms of the environment.
5. Conclusions and Suggestions
In allusion to the variation in development levels among cities, based on multivariate functional data analysis, a sustainable urban development evaluation index system is established in the economic, social, and environmental aspects for the analysis of pertinent data among 33 Chinese cities from 2005 to 2019. This method overcomes the problem that the single-year index system cannot fully describe the complex urban dynamic development and, to a certain extent, makes the evaluation results more convincing and objective. Furthermore, it introduces a novel concept of studying long-term dynamic research problems by using the multivariate functional data analysis method and offers a specific tool for objectively and scientifically evaluating differences in sustainable urban development levels.
The following results are obtained: (1) Remarkable differences are observed in sustainable urban development across China, and the overall level is not very high. The urban sustainable development level clustering results show that 39.4% of the cities fall into the fifth category. By comparison, only 12.1% of the cities fall into the first category. (2) Sustainable urban development is an organic system. Only the coordinated development of the economy, society, and environment can optimize the city’s sustainable development level. According to the clustering result, the first category of cities with a high level of sustainable development is at the top in terms of economics, society, and the environment. The second category of cities’ economic development is comparable to the first. However, the second category of cities’ overall level of sustainable development falls behind the first because of the low level of development of some social and environmental sustainability indicators. Furthermore, cities with relatively low levels of sustainable development lag behind others in most economical, social, and environmental indicators. (3) In terms of geographical distribution, cities in the Pearl River Delta and Yangtze River Delta, such as Shenzhen, Guangzhou, and Shanghai, are at the forefront of the clustering results of sustainable urban development. By contrast, the cities in the central and western regions have no apparent advantages and are in the middle and lower levels of sustainable urban development. In this sense, the overall development level of cities in the eastern coastal regions of China is higher than that of cities in the central and western areas.
However, this paper has some limitations. Considering that the indicators in this paper cover a long period and numerous cities, except for the indicators used in this paper, the indicators used in most other studies cannot be employed because many missing values exist, and not all cities count these indicators. Consequently, the number of indicators selected when setting the evaluation index system of the urban sustainable development level is not as comprehensive as in other studies. The evaluation index system needs to be improved, and a method for sustainable economic, social, and environmental development needs to be developed.
Taking the road to sustainable development is an inevitable choice for China, and China still has a long way to go to achieve this goal. Therefore, given the status of sustainable urban development in China, the following policy recommendations are proposed based on the clustering results:
- Balanced and sustainable development is needed in the three dimensions of economy, society, and environment. The coordinated development of the economy, society, and environment can promote the sustainable development of cities. Based on the clustering results of this paper, cities with a higher level of sustainable urban development have coordinated development in the three dimensions of economy, society, and environment and have a high balance, thus, requiring balanced development;
- According to the urban clustering results, the sustainable development levels of central and western cities in China and the cities in the east have a large gap. The sustainable development level of cities in Eastern China is relatively high, and they should continue to give full play to their advantages and maintain robust and sustainable development capabilities. The capability of sustainable development in central and western cities is relatively weak. Therefore, these cities should address their shortcomings in time and formulate relevant policies according to their characteristics and local conditions to improve their overall sustainable development capabilities;
- The city’s rapid development should not be overly dependent on the consumption of the environment and resources, and should pay attention to the sustainable development of the environment. According to the urban clustering results, except for the first type of cities, the level of environmental development of other categories of cities slightly differs. The first category of cities should maintain their advantages and prioritize the environment and green development. The other four categories of cities should focus on the protection and construction of the urban environment, improve the efficiency of improving the ecological environment, enhance the ability of environmental development, and realize the sustainable and healthy development of the city.
Supplementary Materials
The following supporting information can be downloaded at: https://www.mdpi.com/article/10.3390/su141912918/s1, Part I: Some figures for the visualization of 18 indicators; Part II: The relevant data involved in this paper, including the raw data, time weights, and indicator weights of 18 indicators in 33 cities; Part III: The R software code involved in this article.
Author Contributions
Conceptualization, J.G. and S.M.; methodology, J.G.; software, J.G. and S.M.; validation, J.G. and S.M.; formal analysis, J.G. and S.M.; investigation, J.G. and S.M.; resources, S.M.; data curation, J.G. and S.M.; writing—original draft preparation, J.G. and S.M.; writing—review and editing, J.G., S.M. and X.L.; visualization, S.M.; supervision, J.G.; project administration, J.G.; funding acquisition, J.G. All authors have read and agreed to the published version of the manuscript.
Funding
This research was funded by the National Natural Science Foundation of China (grant Number 11901522); the National Statistical Science Research Project by National Bureau of Statistics of China (2021LY016); and the 2021 Zhejiang University of Technology Humanities and Social Sciences Pre-research Fund Project (grant numbers SKY-ZX-20210179; SKY-ZX-20210197; SKY-ZX-20210198).
Institutional Review Board Statement
Not applicable.
Informed Consent Statement
Not applicable.
Data Availability Statement
The data presented in this study are available on request from the corresponding author.
Conflicts of Interest
The authors declare no conflict of interest.
Appendix A
Table A1.
Time weights for each year from 2005 to 2019.
Table A1.
Time weights for each year from 2005 to 2019.
| Year | Time Weights | Year | Time Weights | Year | Time Weights |
|---|---|---|---|---|---|
| 2005 | 0.004 | 2010 | 0.133 | 2015 | 0.061 |
| 2006 | 0.011 | 2011 | 0.161 | 2016 | 0.031 |
| 2007 | 0.026 | 2012 | 0.164 | 2017 | 0.013 |
| 2008 | 0.054 | 2013 | 0.141 | 2018 | 0.005 |
| 2009 | 0.092 | 2014 | 0.101 | 2019 | 0.001 |
Here, the comprehensive index value is rounded to three decimal places.
Table A2.
Indicator weights for 18 indicators.
Table A2.
Indicator weights for 18 indicators.
| Sub-Indices | Indicators | Code | Indicator Weights |
|---|---|---|---|
| Economic indices | Per capita GDP (RMB) | EC1 | 0.145 |
| Per capita investment in fixed assets (RMB) | EC2 | 0.122 | |
| The average salary of on-the-job employees (RMB) | EC3 | 0.163 | |
| Per capita disposable income of urban households (RMB) | EC4 | 0.145 | |
| Per capita total import and export (Dollar) | EC5 | 0.388 | |
| Growth rate of GDP (%) | EC6 | 0.038 | |
| Social indices | Per capita urban road area (m2) | SO1 | 0.149 |
| Number of passengers taking public transport per capita (Pieces) | SO2 | 0.128 | |
| Sales area of villas and high-end apartments per 100 people (m2) | SO3 | 0.123 | |
| Number of books in public libraries per 100 people (Copies) | SO4 | 0.125 | |
| Number of primary schools per 10000 people (Places) | SO5 | 0.113 | |
| Number of urban parks per 10,000 people (Places) | SO6 | 0.279 | |
| Number of hospitals per 10,000 people (Places) | SO7 | 0.082 | |
| Environmental indices | Per capita urban green coverage area (m2) | EN1 | 0.525 |
| Urban sewage treatment rate (%) | EN2 | 0.070 | |
| Per capita urban cleaning area (m2) | EN3 | 0.258 | |
| Disposal rate of living garbage harmless (%) | EN4 | 0.081 | |
| Green coverage rate of built-up areas (%) | EN5 | 0.066 |
Here, the comprehensive index value is rounded to three decimal places.
References
- Newman, P.; Jennings, I. Cities as Sustainable Ecosystems: Principles and Practices; Island Press: Washington, DC, USA, 2008; ISBN 978-1-59726-187-6. [Google Scholar]
- Wu, J.G. Urban Sustainability: An Inevitable Goal of Landscape Research. Landsc. Ecol. 2010, 25, 1–4. [Google Scholar] [CrossRef]
- Singh, R.K.; Murty, H.R.; Gupta, S.K.; Dikshit, A.K. An Overview of Sustainability Assessment Methodologies. Ecol. Indic. 2012, 15, 281–299. [Google Scholar] [CrossRef]
- United Nations. Transforming Our World: The 2030 Agenda for Sustainable Development. Available online: https://www.un.org/sustainabledevelopment/ (accessed on 7 September 2022).
- World Investment Report 2020: International Production beyond the Pandemic 2020. Available online: https://unctad.org/webflyer/world-investment-report-2020#tab-2/ (accessed on 7 September 2022).
- UN-Habitat. The Value of Sustainable Urbanization; World Cities Report; UN-Habitat: Nairobi, Kenya, 2020; ISBN 978-92-1-005438-6. [Google Scholar]
- Zhang, L.; Xu, Y.; Yeh, C.-H.; Liu, Y.; Zhou, D. City Sustainability Evaluation Using Multi-Criteria Decision Making with Objective Weights of Interdependent Criteria. J. Clean. Prod. 2016, 131, 491–499. [Google Scholar] [CrossRef]
- Ma, L.; Li, D.D.; Tao, X.B.; Dong, H.F.; He, B.; Ye, X. Inequality, Bi-Polarization and Mobility of Urban Infrastructure Investment in China’s Urban System. Sustainability 2017, 9, 1600. [Google Scholar] [CrossRef]
- Degbelo, A.; Granell, C.; Trilles, S.; Bhattacharya, D.; Casteleyn, S.; Kray, C. Opening up Smart Cities: Citizen-Centric Challenges and Opportunities from GIScience. ISPRS Int. J. Geo-Inf. 2016, 5, 16. [Google Scholar] [CrossRef]
- United Nations. Report of the World Commission on Environment and Development: Our Common Future; United Nations: New York, NY, USA, 1987. [Google Scholar]
- Tang, J.; Zhu, H.L.; Liu, Z.; Jia, F.; Zheng, X.X. Urban Sustainability Evaluation under the Modified TOPSIS Based on Grey Relational Analysis. Int. J. Environ. Res. Public. Health 2019, 16, 256. [Google Scholar] [CrossRef]
- Tanguay, G.A.; Rajaonson, J.; Lefebvre, J.-F.; Lanoie, P. Measuring the Sustainability of Cities: An Analysis of the Use of Local Indicators. Ecol. Indic. 2010, 10, 407–418. [Google Scholar] [CrossRef]
- Huang, L.; Wu, J.G.; Yan, L.J. Defining and Measuring Urban Sustainability: A Review of Indicators. Landsc. Ecol. 2015, 30, 1175–1193. [Google Scholar] [CrossRef]
- Parnell, S. Defining a Global Urban Development Agenda. World Dev. 2016, 78, 529–540. [Google Scholar] [CrossRef]
- Sun, C.; Tong, Y.; Zou, W. The Evolution and a Temporal-Spatial Difference Analysis of Green Development in China. Sustain. Cities Soc. 2018, 41, 52–61. [Google Scholar] [CrossRef]
- Wu, J.G. Urban Ecology and Sustainability: The State-of-the-Science and Future Directions. Landsc. Urban Plan. 2014, 125, 209–221. [Google Scholar] [CrossRef]
- Bibri, S.E.; Krogstie, J. Smart Sustainable Cities of the Future: An Extensive Interdisciplinary Literature Review. Sustain. Cities Soc. 2017, 31, 183–212. [Google Scholar] [CrossRef]
- Fan, Y.P.; Fang, C.L.; Zhang, Q. Coupling Coordinated Development between Social Economy and Ecological Environment in Chinese Provincial Capital Cities-Assessment and Policy Implications. J. Clean. Prod. 2019, 229, 289–298. [Google Scholar] [CrossRef]
- Cao, S.; Lv, Y.; Zheng, H.; Wang, X. Challenges Facing China’s Unbalanced Urbanization Strategy. Land Use Policy 2014, 39, 412–415. [Google Scholar] [CrossRef]
- Turcu, C. Re-Thinking Sustainability Indicators: Local Perspectives of Urban Sustainability. J. Environ. Plan. Manag. 2013, 56, 695–719. [Google Scholar] [CrossRef]
- Magee, L.; Scerri, A.; James, P.; Thom, J.A.; Padgham, L.; Hickmott, S.; Deng, H.; Cahill, F. Reframing Social Sustainability Reporting: Towards an Engaged Approach. Environ. Dev. Sustain. 2013, 15, 225–243. [Google Scholar] [CrossRef]
- Phillis, Y.A.; Kouikoglou, V.S.; Verdugo, C. Urban Sustainability Assessment and Ranking of Cities. Comput. Environ. Urban Syst. 2017, 64, 254–265. [Google Scholar] [CrossRef]
- Huang, L.; Yan, L.J.; Wu, J.G. Assessing Urban Sustainability of Chinese Megacities: 35 Years after the Economic Reform and Open-Door Policy. Landsc. Urban Plan. 2016, 145, 57–70. [Google Scholar] [CrossRef]
- Akande, A.; Cabral, P.; Gomes, P.; Casteleyn, S. The Lisbon Ranking for Smart Sustainable Cities in Europe. Sustain. Cities Soc. 2019, 44, 475–487. [Google Scholar] [CrossRef]
- Ding, L.; Shao, Z.F.; Zhang, H.C.; Xu, C.; Wu, D.W. A Comprehensive Evaluation of Urban Sustainable Development in China Based on the TOPSIS-Entropy Method. Sustainability 2016, 8, 746. [Google Scholar] [CrossRef]
- Wang, Y.Q.; Yuan, G.H.; Yan, Y.; Zhang, X. Evaluation of Sustainable Urban Development under Environmental Constraints: A Case Study of Jiangsu Province, China. Sustainability 2020, 12, 1049. [Google Scholar] [CrossRef]
- Shaker, R.R.; Zubalsky, S.L. Examining Patterns of Sustainability across Europe: A Multivariate and Spatial Assessment of 25 Composite Indices. Int. J. Sustain. Dev. World Ecol. 2014, 22, 1–13. [Google Scholar] [CrossRef]
- Bateman, I.J.; Mace, G.M.; Fezzi, C.; Atkinson, G.; Turner, K. Economic Analysis for Ecosystem Service Assessments. Environ. Resour. Econ. 2011, 48, 177–218. [Google Scholar] [CrossRef]
- Yigitcanlar, T.; Kamruzzaman, M. Does Smart City Policy Lead to Sustainability of Cities? Land Use Policy 2018, 73, 49–58. [Google Scholar] [CrossRef]
- Chen, X.; Liu, X.; Hu, D.B. Assessment of Sustainable Development: A Case Study of Wuhan as a Pilot City in China. Ecol. Indic. 2015, 50, 206–214. [Google Scholar] [CrossRef]
- Musakwa, W.; Van Niekerk, A. Monitoring Sustainable Urban Development Using Built-up Area Indicators: A Case Study of Stellenbosch, South Africa. Environ. Dev. Sustain. 2015, 17, 547–566. [Google Scholar] [CrossRef]
- Hussain, T.; Abbas, J.; Wei, Z.; Ahmad, S.; Xuehao, B.; Gaoli, Z. Impact of Urban Village Disamenity on Neighboring Residential Properties: Empirical Evidence from Nanjing through Hedonic Pricing Model Appraisal. J. Urban Plan. Dev. 2021, 147, 04020055. [Google Scholar] [CrossRef]
- Zhang, M.; Liu, Y.M.; Wu, J.; Wang, T.T. Index System of Urban Resource and Environment Carrying Capacity Based on Ecological Civilization. Environ. Impact Assess. Rev. 2018, 68, 90–97. [Google Scholar] [CrossRef]
- Yigitcanlar, T.; Han, H.; Kamruzzaman, M.; Ioppolo, G.; Sabatini-Marques, J. The Making of Smart Cities: Are Songdo, Masdar, Amsterdam, San Francisco and Brisbane the Best We Could Build? Land Use Policy 2019, 88, 104187. [Google Scholar] [CrossRef]
- Yuan, G.H.; Yang, W.X. Evaluating China’s Air Pollution Control Policy with Extended AQI Indicator System: Example of the Beijing-Tianjin-Hebei Region. Sustainability 2019, 11, 939. [Google Scholar] [CrossRef]
- Martin, C.J.; Evans, J.; Karvonen, A. Smart and Sustainable? Five Tensions in the Visions and Practices of the Smart-Sustainable City in Europe and North America. Technol. Forecast. Soc. Chang. 2018, 133, 269–278. [Google Scholar] [CrossRef]
- Meng, F.X.; Guo, J.L.; Guo, Z.Q.; Lee, J.C.K.; Liu, G.Y.; Wang, N. Urban Ecological Transition: The Practice of Ecological Civilization Construction in China. Sci. Total Environ. 2021, 755, 142633. [Google Scholar] [CrossRef]
- Zhao, J.J.; Chai, L. A Novel Approach for Urbanization Level Evaluation Based on Information Entropy Principle: A Case of Beijing. Phys. Stat. Mech. Its Appl. 2015, 430, 114–125. [Google Scholar] [CrossRef]
- Shen, L.; Zhou, J.Y.; Skitmore, M.; Xia, B. Application of a Hybrid Entropy–McKinsey Matrix Method in Evaluating Sustainable Urbanization: A China Case Study. Cities 2015, 42, 186–194. [Google Scholar] [CrossRef]
- Wei, Y.G.; Huang, C.; Lam, P.; Sha, Y.; Feng, Y. Using Urban-Carrying Capacity as a Benchmark for Sustainable Urban Development: An Empirical Study of Beijing. Sustainability 2015, 7, 3244–3268. [Google Scholar] [CrossRef]
- Lin, W.X.; Hong, C.Q.; Zhou, Y.K. Multi-Scale Evaluation of Suzhou City’s Sustainable Development Level Based on the Sustainable Development Goals Framework. Sustainability 2020, 12, 976. [Google Scholar] [CrossRef]
- Zhang, H.Y.; Uwasu, M.; Hara, K.; Yabar, H. Sustainable Urban Development and Land Use Change A Case Study of the Yangtze River Delta in China. Sustainability 2011, 2, 1074–1089. [Google Scholar] [CrossRef]
- Lane, M. The Carrying Capacity Imperative: Assessing Regional Carrying Capacity Methodologies for Sustainable Land-Use Planning. Land Use Policy 2010, 27, 1038–1045. [Google Scholar] [CrossRef]
- Ding, X.H.; Zhong, W.Z.; Shearmur, R.G.; Zhang, X.L.; Huisingh, D. An Inclusive Model for Assessing the Sustainability of Cities in Developing Countries—Trinity of Cities’ Sustainability from Spatial, Logical and Time Dimensions (TCS-SLTD). J. Clean. Prod. 2015, 109, 62–75. [Google Scholar] [CrossRef]
- Ramsay, J.O. When the Data Are Functions. Psychometrika 1982, 47, 379–396. [Google Scholar] [CrossRef]
- Wang, J.-L.; Chiou, J.-M.; Müller, H.-G. Functional Data Analysis. Annu. Rev. Stat. Its Appl. 2016, 3, 257–295. [Google Scholar] [CrossRef]
- Reiss, P.T.; Goldsmith, J.; Shang, H.L.; Ogden, R.T. Methods for Scalar-on-Function Regression: Scalar-on-Function Regression. Int. Stat. Rev. 2017, 85, 228–249. [Google Scholar] [CrossRef]
- Happ, C.; Greven, S. Multivariate Functional Principal Component Analysis for Data Observed on Different (Dimensional) Domains. J. Am. Stat. Assoc. 2018, 113, 649–659. [Google Scholar] [CrossRef]
- Jacques, J.; Preda, C. Model-Based Clustering for Multivariate Functional Data. Comput. Stat. Data Anal. 2014, 71, 92–106. [Google Scholar] [CrossRef]
- International Council for Science. Sustainability Indicators: A Scientific Assessment; Hák, T., Moldan, B., Dahl, A.L., Eds.; SCOPE Series; Island Press: Washington, DC, USA, 2007; ISBN 978-1-59726-130-2. [Google Scholar]
- Xie, Y.; Liu, C.; Chang, S.; Jiang, B. Urban Sustainability: Integrating Socioeconomic and Environmental Data for Multi-Objective Assessment. Sustainability 2022, 14, 9142. [Google Scholar] [CrossRef]
- Li, F.; Liu, X.S.; Hu, D.; Wang, R.; Yang, W.; Li, D.; Zhao, D. Measurement Indicators and an Evaluation Approach for Assessing Urban Sustainable Development: A Case Study for China’s Jining City. Landsc. Urban Plan. 2009, 90, 134–142. [Google Scholar] [CrossRef]
- Michalina, D.; Mederly, P.; Diefenbacher, H.; Held, B. Sustainable Urban Development: A Review of Urban Sustainability Indicator Frameworks. Sustainability 2021, 13, 9348. [Google Scholar] [CrossRef]
- Li, Y.; Zhang, X.; Gao, X. An Evaluation of the Coupling Coordination Degree of an Urban Economy–Society–Environment System Based on a Multi-Scenario Analysis: The Case of Chengde City in China. Sustainability 2022, 14, 6790. [Google Scholar] [CrossRef]
- Yang, Y.H.; Hu, A.A. Investigating Regional Disparities of China’s Human Development with Cluster Analysis: A Historical Perspective. Soc. Indic. Res. 2008, 86, 417–432. [Google Scholar] [CrossRef]
- Analyse des Yale Environmental Performance Index. Available online: https://www.umweltbundesamt.de/ (accessed on 7 September 2022).
- Siche, J.R.; Agostinho, F.; Ortega, E.; Romeiro, A. Sustainability of Nations by Indices: Comparative Study between Environmental Sustainability Index, Ecological Footprint and the Emergy Performance Indices. Ecol. Econ. 2008, 66, 628–637. [Google Scholar] [CrossRef]
- Rogge, N. Undesirable Specialization in the Construction of Composite Policy Indicators: The Environmental Performance Index. Ecol. Indic. 2012, 23, 143–154. [Google Scholar] [CrossRef]
- National Bureau of Statistics. China City Statistical Yearbook, 2005–2019; China Statistics Press: Beijing, China, 2020. [Google Scholar]
- Zhang, J.T. Analysis of Variance for Functional Data; CRC Press: Boca Raton, FL, USA, 2013. [Google Scholar]
- Shannon, C.E.; Weaver, W.; Wiener, N. The Mathematical Theory of Communication. Phys. Today 1950, 3, 31–32. [Google Scholar] [CrossRef]
- Delgado, A.; Romero, I. Environmental Conflict Analysis Using an Integrated Grey Clustering and Entropy-Weight Method: A Case Study of a Mining Project in Peru. Environ. Model. Softw. 2016, 77, 108–121. [Google Scholar] [CrossRef]
- Liu, L.; Zhou, J.; An, X.; Zhang, Y.; Yang, L. Using Fuzzy Theory and Information Entropy for Water Quality Assessment in Three Gorges Region, China. Expert Syst. Appl. 2010, 37, 2517–2521. [Google Scholar] [CrossRef]
- Xu, H.; Ma, C.; Lian, J.; Xu, K.; Chaima, E. Urban Flooding Risk Assessment Based on an Integrated K-Means Cluster Algorithm and Improved Entropy Weight Method in the Region of Haikou, China. J. Hydrol. 2018, 563, 975–986. [Google Scholar] [CrossRef]
- Zhong, L.; Li, X.; Law, R.; Sun, S. Developing Sustainable Urbanization Index: Case of China. Sustainability 2020, 12, 4585. [Google Scholar] [CrossRef]
- Terama, E.; Peltomaa, J.; Mattinen-Yuryev, M.; Nissinen, A. Nissinen Urban Sustainability and the SDGs: A Nordic Perspective and Opportunity for Integration. Urban Sci. 2019, 3, 69. [Google Scholar] [CrossRef]
- Dang, V.T.; Wang, J.; Dang, W.V. An Integrated Fuzzy AHP and Fuzzy TOPSIS Approach to Assess Sustainable Urban Development in an Emerging Economy. Int. J. Environ. Res. Public. Health 2019, 16, 2902. [Google Scholar] [CrossRef]


Publisher’s Note: MDPI stays neutral with regard to jurisdictional claims in published maps and institutional affiliations. |
© 2022 by the authors. Licensee MDPI, Basel, Switzerland. This article is an open access article distributed under the terms and conditions of the Creative Commons Attribution (CC BY) license (https://creativecommons.org/licenses/by/4.0/).