Abstract
A plant’s response to osmotic stress is a complex phenomenon that causes many abnormal symptoms due to limitations in growth and development or even the loss of yield. The current research aimed to analyze the agronomical, physiological, and biochemical mechanisms accompanying the acquisition of salt resistance in the Vigna radiata L. variety ‘Ramzan’ using seed osmo- and thermopriming in the presence of PEG-4000 and 4 °C under induced salinity stresses of 100 and 150 mM NaCl. Seeds were collected from CCRI, Nowshera, and sowing was undertaken in triplicate at the Department of Botany, Peshawar University, during the 2018–2019 growing season. Rhizospheric soil pH (6.0), E.C (2.41 ds/m), field capacity, and moisture content level were estimated in the present study. We observed from the estimated results that the agronomic characteristics, i.e., shoot fresh weight and shoot dry weight in T9 (4oC + 150 mM NaCl), root fresh weight and root dry weight in T4 (PEG + 100 mM NaCl), shoot moisture content in T5 (PEG + 100 mM NaCl), and root moisture content in T6 (PEG + 150 mM NaCl) were the highest, followed by the lowest in T1 (both shoot and root fresh weights) and T2 (shoot and root dry weights). Similarly, the shoot moisture content was the maximum in T5 and the minimum in T6, and root moisture was the highest in T6. We observed from the estimated results that agronomical parameters including dry masses (T4, T6, T4), leaf area index, germination index, leaf area, total biomass, seed vigor index under treatment T9, and relative water content and water use efficiency during T5 and T6 were the highest. Plant physiological traits such as proline, SOD enhanced by T1, carotenoids in treatment T2, and chlorophyll and protein levels were the highest under treatment T4, whereas sugar and POD were highest under treatments T7 and T8. The principal component analysis enclosed 63.75% of the total variation among all biological components. These estimated results confirmed the positive resistance by Vigna radiata during osmopriming (PEG) and thermopriming (4 °C) on most of the features with great tolerance under a low-saline treatment such as T4 (PEG), T5 (PEG + 100 mM NaCl), T7 (4 °C), and T8 (4 °C + 100 mM NaCl), while it was susceptible in the case of T6 (PEG + 150 mM NaCl) and T9 (4 °C + 150 mM NaCl) to high salt application. We found that the constraining impact of several priming techniques improved low salinity, which was regarded as economically inexpensive and initiated numerous metabolic processes in plants, hence decreasing germination time. The current study will have major applications for combatting the salinity problem induced by climate change in Pakistan.
1. Introduction
Plants that grow in natural conditions are exposed to many harmful environmental stresses that generally disrupt the photosynthetic apparatus, which retards the growth of plants and their yield [1]. Worldwide, some areas annually receive the minimum rainfall required for irrigation of plants grown in the field, which often leads to soil salinity [2,3]. The term salinity is generally referred to as the degree of total salts dissolved in water and is measured in parts per thousand. Soil salinity is commonly referred to as the area above the roots where the electrical conductivity of the extract is saturated at 4 ds/m at 25 degrees Celsius and has transferable Na + ions [4]. Salinity interrupts the metabolic processes and water relations in the tissues of plants [5]. It is stated that, on Earth, the entire area is 14 billion hac: 6.6 billion hac of this consists of arid and semi-arid parts, whereas 1 billion hac of this region is affected by salt [6,7]. The biochemical and physiological reactions to increasing sodium chloride concentrations in combination or isolation were observed in mung bean seedlings [8,9,10,11]. In the current studies, the increasing NaCl concentration decreased the shoot–root growth, seedling vigor, chlorophyll content, and biomass production significantly. Salt stress impacted the functioning of various antioxidant enzymes; water control increased superoxide dismutase (SOD). Soil salinity is an unavoidable defect of barren zones where, because of less rainfall and elevated temperature, thorough discharge of salts cannot be achieved. The movement of soluble salts is diverted upwards and causes aggregation closer to the soil surface. Pakistan, being chiefly in the arid to semi-arid zone, is not an exclusion to the above phenomenon [12]. Salt stress, because of the excess aggregation of sodium chloride, is commonly the focus of important research attention and an extremely detrimental factor in arid and semi-arid regions globally. Saline soils are extensive on Earth, with more than 810 million ha of land globally being salt influenced, equal to more than 5% of the land area worldwide. Irrigation water is also one of the main causes of salinity [13].
It has been found that seed priming is an easy, economical, and more effective method against stressful environmental conditions [14]. Seed pre-treatment processes such as thermopriming involve the exposure to a specific temperature for a specific time period to observe the temperature effect on a seed’s coat, physiology, and growth. Treatment before germination is undertaken to improve the germination and vegetative development, decrease the germination time, create a better stand foundation, recuperate damaged seeds, improve plant energy, further develop the change in assimilation, speed up blossoming, and create grain improved by gathering [15,16]. Thermopriming also involves the activation of cell-reinforcing enzymes such as peroxidase (POD), superoxide dismutase (SOD), glutathione reductase in ripe seeds, and an increase in amylase, acid phosphatase, ATPase, and RNA synthesis [17,18]. Nascimento et al. [19] inferred that the most extreme level of germination was accomplished using thermopriming for 10 min, and the lowermost level of germination was achieved with the control treatment. Thermopriming for 10 min allowed the seedlings to attain their full dry load, but the control treatment only managed to reach a partial dry load. In osmopriming, the seeds are subjected to a specific chemical for a specific time period to examine the effect of the chemical on the seed’s coat, growth, and physiology. Manuela et al. [20] concluded that different concentrations of salt had positive effects on fresh root weight, but significant differences were not observed when primed and non-primed seed root weights were compared. Ajit et al. [21] concluded that priming (both osmo- and hydro-priming) is applicable on the seeds of cowpea for field performance and better germination. However, 1% KNO3 osmopriming for 6 h could lead to higher seedling germination. Therefore, the objectives of the present study were to determine the effects of osmopriming and thermopriming on agronomic characteristics, physiological attributes (chlorophyll a, b, and carotenoid), osmolytes (proline and sugar), and antioxidative enzymes (SOD and POD) under induced salinity stresses of 100 and 150 Mm.
2. Materials and Methods
2.1. Experimental Design and Description of Site
The Peshawar district has an area of 1257 km2, situated between 34°15 North latitude and 71°42 East longitudes and approximately 1173 feet (358 m) msl. The district Peshawer is surrounded in the west by Mohmand and Khyber Agency, in the north side by the Charsadda district, by the Nowshera District in the east, and the southeast parts are bounded by tribal areas joining the Kohat and Peshawar districts. The semi-arid climate of the Peshawar district has very hot summers and mild winters [22]. The average temperature ranges between 5 °C and 39 °C in January to February and June to July, respectively, with an annual rainfall of around 513 mm. The months of July and August have highest rainfall. The collection of soil samples (0–30 cm) was conducted from the experiment site before sowing for physico-chemical analysis of the soil. The hydrometer method determined that the soil texture was silt-loam [22]. According to the report of Rehman et al. [23], the chemical properties of the soil were: pH 6.9, bulk density 1.55 g·cm−3, and EC 0.288 ds/m, respectively. The seeds of selected local accessions of Mung bean variety were collected from CCRI, Persabaq, Nowshera, Pakistan. The nursery had dimensions of 3.0 m length and 1.5 width, and the sowing of seeds was carried out in earthen pots (inside upper diameter 18 cm, height 20 cm, lower diameter inside 18 cm, and thickness 2 cm) containing silt and loam in a ratio of 1:2 in triplicates with well-rotted farmyard manure. All the pots were placed 5 cm apart in a Complete Randomized Design (CRD) and were protected from harsh environmental conditions (Figure 1). Regular watering was performed to maintain soil moisture content during the whole experimental work. Approximately three liters of water was used in each pot throughout the study until plants’ cultivation was finished. In order to keep pots away from weeds, manual weeding was carried out for better sunlight exposure and growth. Following a few days of post-germination, plants were decreased to eight per pot and exposed to salt stress (100 mM and 150 mM NaCl) as well as untreated control treatment (No NaCl solution). The appropriate standard methods for the pot experiment were followed, and no pests or weeds were found during the experiment. Intact, homogeneous, and identical experimental seeds in size and color and without wrinkles were chosen for the planned experiment, preceded by surface sterilization with ethanol 70% and mercuric chloride 0.1% for 10 min and finally rinsed four times with distilled water [24]. During experimental work, PEG-4000 solution was prepared for seed soaking for a specific time before seed sowing. Then, 50 mL of distilled water and 7 g of PEG-4000 with osmotic potential of 0.2 MPa were mixed until the PEG was dissolved in water. Then, one-third of the seeds were treated with the PEG solution and then dried [15], whereas one-third of the seeds were treated at 4 °C [25].
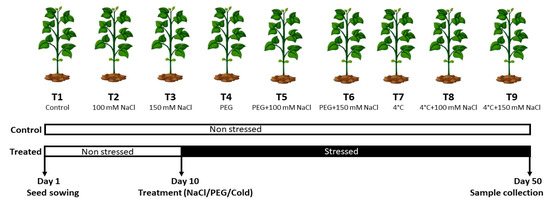
Figure 1.
Flowchart illustrating different stress conditions used in the current study.
2.2. Agronomic and Physiological Analysis of Plant
2.2.1. Soil pH and Soil Electrical Conductivity (EC)
The pH value of rhizospheric soil was measured by preparing a 1:1 (soil: water) suspension through the standard protocol of Ali et al. [26], modified by Mclean [27]. A 10 g sample of soil and 10 mL of water were taken, processed through standardized mixing, and then filtered with Whatman # 42 filter paper. A pH meter was used for pH determination, while the EC of soil was estimated through an electrical conductivity meter in micro-Siemens per centimeter.
2.2.2. Sample Moisture Content Percentage and Field Capacity
For the measurement of soil moisture content, 10–15 g of soil was collected from an even depth, i.e., a few inches below the surface of the pots. The fresh weight was calculated initially, followed by the dry weight after drying in the oven for 70 h at 75 °C. The moisture content of the roots, shoots, and leaves was also determined by weighing them fresh and then drying them in an oven for dry mass computation. Determination of moisture content percentage by the formula [25]:
The field capacity of rhizospheric soil was determined according to the given equation [25]
2.2.3. Germination Index (GI)
Germination Index has been reported according to the formula as described below [28]:
G1 = (10 × n1) + (9 × n2) + ……… + (1 × n10)
Hence, n1, n2 … n10 represent the number of germinated seeds on the first, second, and the last day (10th) while 10, 9 … and 1 were the germinated seeds’ mass on the first, second and last day (10th).
Seed vigor index (SVI)
The approach developed by Bina and Bostani [29] provided the seed vigor index in terms of seedling length:
SVI = Mean root length + Mean shoot length × % seed germination.
2.2.4. Root–Shoot Ratio (RSR)
The equation used by Chuyong and Acidri [30] describes the root-to-shoot ratio. The weights of the root and shoot in both treatments (100 mM and 150 mM) were noted by putting the samples inside an oven for 72 h:
2.2.5. Water Use Efficiency (WUE)
Chuyong and Acidri [30] reported the formula for the determination of the water use efficiency of plants. By the addition of the dry mass of the stem, root, and leaf of a plant, the total biomass is taken:
2.2.6. Relative Water Content (RWC)
The relative water content of the plants were estimated by following Zainab et al. [31]:
RWC (%) = (FW − DW)/(TW − DW) × 100
Here, FW = fresh weight (g), DW = dry weight (g), and TW = turgid weight (g) of the leaf sample.
2.2.7. Total Biomass (TB)
The dry weights of the root and shoot of plants were determined by following Mehmood et al. [32].
2.2.8. Determination of Total Chlorophyll Content (TCC)
The total chlorophyll level of the fresh leafy material was estimated by following Faryal et al. [33]. Fresh leaves samples of 0.2 g were incubated for 24 h in the dark; 80% acetone was applied with a mortar and pestle and centrifuged for 10 min. A spectrophotometer was used to measure the absorbance of chlorophyll “a”, 663 nm for chlorophyll “b”, and 470 nm for carotenoid against an 80% acetone blank.
Total chlorophyll (mg/L) = (20.2 × A645) + (8.02 × B663)
2.2.9. Approximation of Soluble Protein Content (SPC)
The protein content of fresh maize leaves was determined using Bovine Serum Albumin (BSA) (Sigma-Aldrich, St. Louis, MO, USA) as a reference, as described by [34,35]. The fresh leaves were pulverized in 1 mL of phosphate buffer (pH 7.5) and 0.2 g of leaf material using a pestle and mortar. The extract of 0.1 mL resulting from the process above were emptied into tubes, and a volume of 1 mL was prepared with distilled water. A reagent of 3.0 mL was added containing: 3 g sodium carbonate (Na2CO3), 0.6 g NaOH (0.1 N), 1.5 g Na-K tartrate dissolved in 150 mL of distilled water, and 0.125 g CuSO4.5H2O dissolved in 25 mL of distilled water. Following 10 min of shaking, 0.1 mL of Folin phenol reagent was added. After 30 min of incubation, absorbance was measured for each sample at 650 nm
2.2.10. Measurement of Soluble Sugar Content (SSC)
The Grad technique was used to calculate total soluble sugars (TSS) [36]. To analyze the leaf soluble sugar content, 0.5 g of plant matter was ground with a pestle and then spun at 2500 rpm for 5 min. Next, 1 mL of 80% (w/v) phenol was combined with 0.1 mL of supernatant, then 3.0 mL of conc. H2SO4 was added and detected on a spectrophotometer at 420 nm.
2.2.11. Assay for Antioxidant Enzymes
The content of superoxide dismutase (SOD) was determined using conventional methods of Ma et al. [37]. The reaction mixture (3 mL) having 0.02 mM riboflavin, 13 mM methionine, 0.1 mM EDTA, 0.075 mM NBT, and 0.1 mL of enzyme extract in 50 mM phosphate buffer (pH 7.8). For 10 min, the sample tube was placed beneath the light chamber. The absorbance of the sample combination was measured using a spectrophotometer at 560 nm.
Peroxidase (POD) enzyme activity was evaluated by following Ma et al. [38] standard method. The assay mixture contained enzyme extract (0.1 mL), 0.05% H2O2, 1.35 mL of 100 mM MES buffer (pH 5.5), and 0.1% phenylenediamine. Readings were taken at 48 nm for 2 min with spectrophotometer, presented as ΔOD485nm/min/mg protein.
2.2.12. Determination of Total Proline Content (TPC)
The method of Ma et al. [39] was utilized to determine the proline content in shoots. Plant material (0.25 g) was crushed in 5 mL of 3 % aqueous sulfosalicylic acid tailed through filtration. This filtrate was then reacted in a test tube for 60 min with 2 mL of glacial acetic acid and 2.0 mL acid ninhydrin, followed by the addition of 4 mL of toluene to the mixture and heated at 100 °C in a water bath. Toluene-containing chromophore was removed from the aqueous portion, warmed to 25 °C, and sampled at 520 nm against toluene as a blank.
2.3. Statistical Analysis
For each treatment, all data were obtained, and mean values and standard errors were computed. Data were analyzed using analysis of variance (ANOVA) and pairwise comparison among treatment means was made by LSD test at p = 0.05 using Statistix 8.1. Principal Component Analysis (PCA) and Pearson correlation analysis were applied using XLStat and R-software.
3. Results
3.1. Agronomic Study
Table 1 shows that T9 (4 °C + 150 mM NaCl) had the highest shoot fresh weight, while the range of shoot moisture was greatest in T5 (PEG + 100 mM NaCl). T1 (Untreated) had the lowest shoot fresh weight, and T6 (PEG + 150 mM NaCl) had the lowest shoot moisture content (p < 0.05). Similarly, T4 (PEG + 100 mM NaCl) had the highest root dry and fresh weights, T6 (PEG + 150 mM NaCl) showed the greatest amplitude for root moisture content, and T1 had the lowest root moisture content (Untreated) at p < 0.05. As a result, the findings in Table 2 indicate that T5 (PEG + 100 mM NaCl) had the highest amplitude for leaf moisture levels, whereas T2 (Untreated + 100 mM NaCl) had the lowest. Nonetheless, the highest soil dry weight was found in T8 (40 °C + 100 mM NaCl) at p < 0.05. The highest amplitude for soil moisture content was reported in T4 (PEG + 100 mM NaCl), paired with the significant root–shoot ratio in T9 (4 °C + 150 mM NaCl). A minimal root–shoot ratio, seed vigor indicator, leaf area rate, and germination ratio were reported in T9 (4 °C + 150 mM NaCl), whereas the seed vigor index, leaf area index, and minimum root–shoot ratio and germination index were reported in T2 (Untreated + 100 mM NaCl) (Table 3). The estimated values of leaf area and total biomass were highest in T9 (4 °C +150 mM NaCl) at p < 0.05, whilst the maximum amplitude was recorded for relative moisture content in T5 (PEG + 100 mM NaCl), water usage efficiency in T6 (PEG + 150 mM NaCl), and relative water content in T2 (Untreated + 100 mM NaCl).

Table 1.
Effect of osmo- and thermopriming on shoot fresh weight, shoot dry weight, shoot % moisture content, root fresh weight, root dry weight, and root % moisture content of Vigna radiata L. under salinity stress.
Table 2.
Effect of osmo- and thermopriming on leaves fresh weight, leaves dry weight, leaves % moisture content, soil dry weight, soil % moisture content, and root–shot ratio of Vigna radiata L. under salinity stress.
Table 3.
Effect of osmo- and thermopriming on leaf area index, seed vigor index, germination index, leaf area, relative water content, water use efficiency, and total biomass of Vigna radiata L. under salinity stress.
3.2. Physiological Study
In Figure 2, T5 (PEG + 100 mM NaCl) had the highest chlorophyll ‘a’ concentration (p < 0.05), whereas T2 (Untreated + 100 mM NaCl), T3 (Untreated + 150 mM NaCl), T8 (4 °C, + 100 mM NaCl), and T9 (4 °C, + 150 mM NaCl) had the lowest. Similarly, Figure 3 showed that T4 (PEG) had the highest ratio of chlorophyll a/b at p < 0.05. The results in Figure 4 present the highest chlorophyll content at p < 0.05, while the highest amplitude of carotenoid content has been reported in T2 (Untreated + 100 mM NaCl), which was not significant as compared to T4 (PEG + 100 mM NaCl) and T5 (PEG + 100 mM NaCl). Figure 5 reveals that the highest sugar content was reported in T8 (4 °C + 100 mM NaCl) as compared to other treatments. The sugar content has drastically decreased under salinity stress. The highest total protein content was reported in T4 (PEG + 100 mM NaCl), whereas the maximum content of proline has been found in T1 (Untreated) compared with other treatments (Figure 6). In Figure 7, the results showed the highest POD was reported in T7 at p < 0.05 (PEG) and the highest variation with T8 (4 °C + 100 mM NaCl).
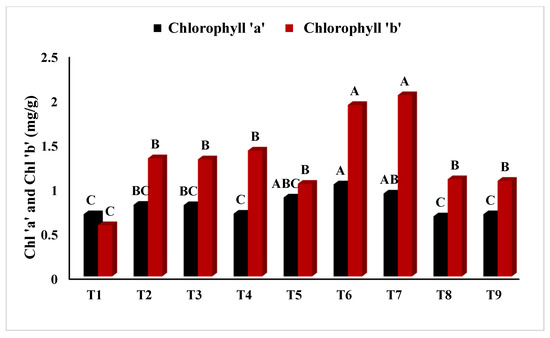
Figure 2.
Effect of osmo- and thermopriming on chlorophyll ‘a’ and ‘b’ content under induced salinity stress. T1 = Control; T2 = Control + 100 mM NaCl; T3 = Control + 150 mM NaCl; T4 = PEG + 100 mM NaCl; T5 = PEG + 100 mM NaCl; T6 = PEG + 150 mM NaCl; T7 = 4 °C, T8 = 4 °C + 100 mM NaCl; T9 = 4 °C + 150 mM NaCl. Bars sharing different letter(s) for each parameter are significantly different from each other according to the Least Significant Difference (LSD) test (p ≤ 0.05). All the data represented are the average of three replications (n = 3). Error bars represent the standard errors (SE) of three replicates.
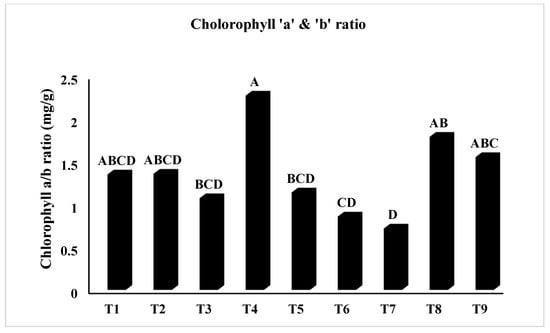
Figure 3.
Effect of osmo- and thermopriming on chlorophyll a/b ratio under induced salinity stress. T1 = Control; T2 = Control + 100 mM NaCl; T3 = Control + 150 mM NaCl; T4 = PEG + 100 mM NaCl; T5 = PEG + 100 mM NaCl; T6 = PEG + 150 mM NaCl; T7 = 4 °C, T8 = 4 °C + 100 mM NaCl; T9 = 4 °C + 150 mM NaCl. Bars sharing different letter(s) for each parameter are significantly different from each other according to the Least Significant Difference (LSD) test (p ≤ 0.05). All the data represented are the average of three replications (n = 3). Error bars represent the standard errors (SE) of three replicates.
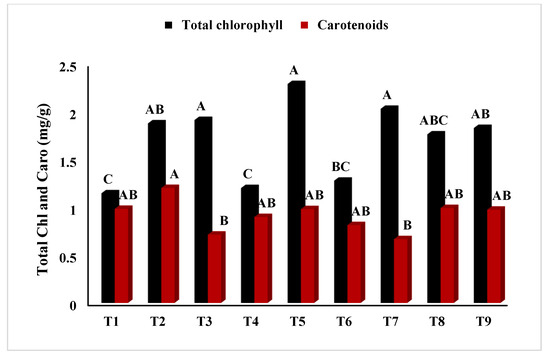
Figure 4.
Effect of osmo- and thermopriming on total chlorophyll and carotenoid content under induced salinity stress. T1 = Control; T2 = Control + 100 mM NaCl; T3 = Control + 150 mM NaCl; T4 = PEG + 100 mM NaCl; T5 = PEG + 100 mM NaCl; T6 = PEG + 150 mM NaCl; T7 = 4 °C, T8 = 4 °C + 100 mM NaCl; T9 = 4 °C + 150 mM NaCl. Bars sharing different letter(s) for each parameter are significantly different from each other according to the Least Significant Difference (LSD) test (p ≤ 0.05). All the data represented are the average of three replications (n = 3). Error bars represent the standard errors (SE) of three replicates.
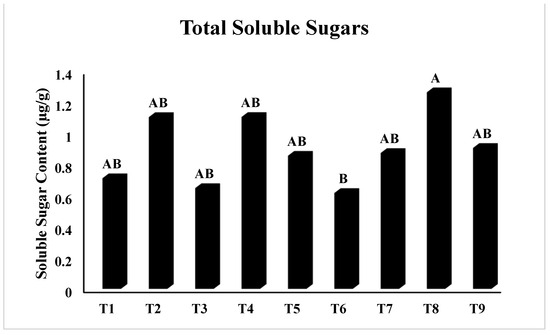
Figure 5.
Effect of osmo- and thermopriming on soluble sugar content under induced salinity stress. T1 = Control; T2 = Control + 100 mM NaCl; T3 = Control + 150 mM NaCl; T4 = PEG + 100 mM NaCl; T5 = PEG + 100 mM NaCl; T6 = PEG + 150 mM NaCl; T7 = 4 °C, T8 = 4 °C + 100 mM NaCl; T9 = 4 °C + 150 mM NaCl. Bars sharing different letter(s) for each parameter are significantly different from each other according to the Least Significant Difference (LSD) test (p ≤ 0.05). All the data represented are the average of three replications (n = 3). Error bars represent the standard errors (SE) of three replicates.
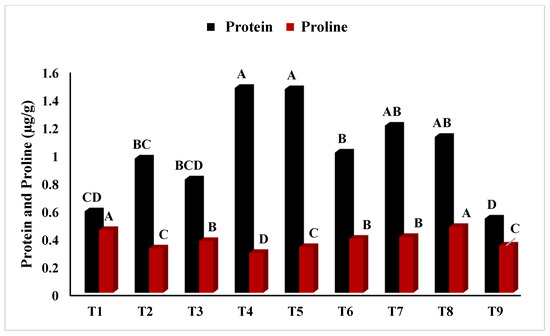
Figure 6.
Effect of osmo- and thermopriming on soluble protein and total proline content under induced salinity stress. T1 = Control; T2 = Control + 100 mM NaCl; T3 = Control + 150 mM NaCl; T4 = PEG + 100 mM NaCl; T5 = PEG + 100 mM NaCl; T6 = PEG + 150 mM NaCl; T7 = 4 °C, T8 = 4 °C + 100 mM NaCl; T9 = 4 °C + 150 mM NaCl. Bars sharing different letter(s) for each parameter are significantly different from each other according to the Least Significant Difference (LSD) test (p ≤ 0.05). All the data represented are the average of three replications (n = 3). Error bars represent the standard errors (SE) of three replicates.
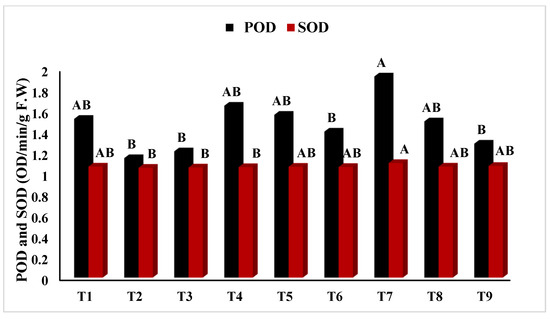
Figure 7.
Effect of osmo- and thermopriming on peroxidase (POD) and superoxide dismutase (SOD) content under induced salinity stress. T1 = Control; T2 = Control + 100 mM NaCl; T3 = Control + 150 mM NaCl; T4 = PEG + 100 mM NaCl; T5 = PEG + 100 mM NaCl; T6 = PEG + 150 mM NaCl; T7 = 4 °C, T8 = 4 °C + 100 mM NaCl; T9 = 4 °C + 150 mM NaCl. Bars sharing different letter(s) for each parameter are significantly different from each other according to the Least Significant Difference (LSD) test (p ≤ 0.05). All the data represented are the average of three replications (n = 3). Error bars represent the standard errors (SE) of three replicates.
All the results of calculated parameters in Table 4 were found non-significant, except POD, with a significant value at p = 0.05 that represented r = 0.500 and R2 = 0.250 in relation between salinity and Vigna radiata, and values for priming and Vigna radiata were r = 0.483 and R2 = 0.234.
Table 4.
Regression and correlation analysis between physiological and biochemical attributes and Vigna radiata L.
3.3. Principal Component Analysis
Principal component analysis results (Figure 8 and Table 5) based on 10 characteristics represented that the first PC1 described 28.674% of whole variance, which was correlated significantly with chlorophyll “b”, and TCC, chlorophyll “ab”, CC, and SSC were mainly correlated with growth parameters. Consequently, the second PC2 described 19.225% of the whole variance, which was correlated particularly with TPC, POD, and SOD of plants indicating that the PC2 was mainly correlated with antioxidant enzymes. However, PC3 accounted for 15.853% of the complete variance correlated with chlorophyll “a” and SPC.
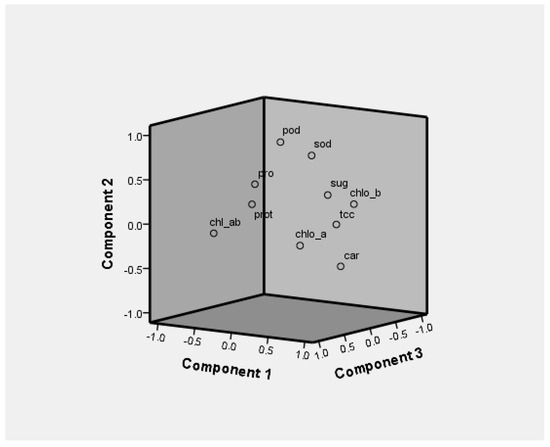
Figure 8.
Loading plots of PC1, PC2, and PC3 in rotated space.
Table 5.
Eigen values, variation explained (%), cumulative variance (%), coefficients of determination of the first three principal components based on correlation matrix of biological components.
3.4. Physiological and Biochemical Component Correlation Analysis
Analysis of correlation (Table 6) showed that chlorophyll “b” was correlated positively with chlorophyll “a”, and TCC was correlated positively with chlorophyll “b” at a significance level of p = 0.01. Similarly, CC, SSC, and SPC were negatively correlated with one another and also with growth parameters and antioxidant enzymes. In addition, TPC reported a positive correlation with SSC, whereas POD estimated a positive correlation with TPC and SOD.
Table 6.
Correlation analysis of physiological and biochemical components in Vigna radiata L.
4. Discussion
The tolerance to biotic [40,41] and abiotic stresses such as heavy metals [42,43,44,45,46], drought [47,48,49], salinity [50,51,52], temperature [53], and mineral deficiencies [54,55] are due to the pre-treatment of seeds, suggesting that these molecules trigger the expression of the potential to tolerate stress rather than having any direct effect as a protectant. Seed priming may also increase the seed or seedling’s tolerance to stress. Seed priming initiates metabolic activities, such as protein, RNA, and DNA synthesis; DNA replication; and tubulin accumulation [51]. Recently, it has been suggested that priming could enhance the activity of antioxidant enzymatic systems, resulting in a lower rate of lipid peroxidation, contributing to seed invigoration as stated by Sani and Jodaeian [56]. Salinity is a major threat to agricultural systems, causing inhibition of crop growth and development and loss of crop productivity [49]. Soil salinity directly affects crop productivity, and the electrical conductivity in the soil affected with salinity ranges from 0.6 to 3.2 ds/m. Therefore, stress imposed by salinity is considered as a key limitation to the productivity of crops [57]. In growth and agronomical characteristics, thermopriming has been determined to positively impact most of the features that included treatments, i.e., T4 (PEG), T5 (PEG + 100 mM NaCl), T7 (4 °C), T8 (4 °C + 100 mM NaCl) showed that thermo- and osmopriming had a positive impact on the Vigna radiata due to its thick seed coat and represented negative effects in the case of T6 (PEG + 150 mM NaCl) and T9 (4 °C + 150 mM NaCl) due to the high content of salt (NaCl). Nascimento et al. [19] concluded that the maximum percentage of germination was attained by thermopriming for 10 min and the lowermost percentage of germination was attained by the control treatment. A similar study was also conducted by Ahmad et al. [58], who reported the effect of osmopriming and thermopriming on the amelioration of mercuric chloride stress tolerance in mungbean. The top dry weight of the seedling was achieved by thermopriming for 10 min, and the lower dry weight of seedling was attained by the control treatment. The influence of thermopriming on germination was not significant [58]. By increasing thermopriming, an increased germination percentage was recorded, reaching its maximum at 20 min of thermopriming. The outcome of thermopriming was major (p ≤ 0.05) on germination percentage [59]. The maximum percentage of germination (98 %) was attained by thermopriming for 30 min, and the minimum percentage of germination (80.66 %) was achieved by the control treatment.
Similarly, the physiological study results determined that thermopriming improves the majority of the features such as chlorophyll content, protein, proline, and sugar content under treatments, i.e., T4 (PEG), T5 (PEG + 100 mM), T7 (4 °C), and T8 (4 °C + 100 mM) were evaluated as having high growth rate and plant osmoprotectant along with active antioxidant defense systems that resulted in maximum activity in the control treatment. Our results are in agreement with those of [58] and described the estimation of chlorophyll a and b contents, soluble protein, leaf soluble sugar contents, proline, and some antioxidative enzymes (POD and SOD) in Vigna radiata L. The concentration of proline was greater in plants sown in low NaCl (20 mM) [60]. The protein content was similar in plants sown at 40, 60, and 80 mM concentrations of NaCl and decreased at the highest concentration (160 mM). Our findings are consistent with [61,62] and described the maximal chlorophyll “a” and “b” contents when seedlings were primed. The osmopriming PEG increased carotenoid levels and chlorophyll level in leaf tissues of tomato [63]. The priming causes tolerance in salinity-stressed melon seedlings [64]. The concentration of sugar had a major rise in shoots under salt stress [65]. Non-reducing and reducing sugar concentration showed improvement in roots. Phaseolus vulgaris, sodium chloride concentration increases, and antioxidant enzymes such as APX, CAT, and GR considerably declined while SOD (super oxidase) action improved under salt-induced stress [66]. The activity of antioxidant enzymes enhanced under stress conditions. SOD activity increased at 50, 100, and 200 mM NaCl in comparison with the control. In this cultivar, there was a significant difference (p < 5%) between the control and 50 mM NaCl at other levels. Catalase activity was significantly increased in two cultivars at 50 mM NaCl in comparison with the control. However, at higher levels of NaCl, i.e., 100, 150, and 200 mM, catalase activity significantly decreased (p < 5%) in comparison with 50 mM NaCl by [67]. Similar result has been evaluated [68] concluded that sorghum was osmoprimed by using PEG improved germination, osmolyte, and chlorophyll content and enzymes antioxidant activities i.e., SOD, POD, APOX, and CAT. However, although several biochemical and physiological changes have been shown to be involved in the salinity acclimation process, little is known about the responses of antioxidant enzymes against salt stress, which induces the overproduction of active oxygen species.
5. Conclusions
The current study demonstrated the impact of salinity at different concentration on the agronomical, physiological and biochemical mechanisms accompanying the acquisition of Vigna radiata L. variety ‘Ramzan’ by seed osmo- and thermopriming in the presence of PEG-4000 and 4 °C. Overall, experiments T5 (PEG + 100 mM NaCl), T6 (PEG + 150 mM NaCl), and T9 (4 °C + 150 mM NaCl) have positive impacts on the agronomic features of mungbean plant, while plant physiological traits such as proline and SOD were enhanced by T1 and carotenoid by T2. The chlorophyll and protein contents were the highest under T4, whereas sugar and POD were highest under T7 and T8. We observed from the estimated results that agronomic characters, i.e., shoot fresh weight and shoot dry weight in T9 (4 °C + 150 mM NaCl); root fresh weight and root dry weight in T4 (PEG + 100 mM NaCl); shoot moisture content in T5 (PEG + 100 mM NaCl); and root moisture content in T6 (PEG + 150 mM NaCl), were the highest followed by lowest in T1 (both shoot and root fresh weight) and T2 (shoot and root dry weight), respectively. Similarly, shoot moisture content was the highest in T5 and lowest in T6, and root moisture was the highest in T6. We observed from the estimated results that both agronomical parameters including dry masses (T4, T6, and T4), leaf area index, germination index, leaf area, total biomass, seed vigor index under treatment T9, while relative water content and water use efficiency during T5 and T6, were observed as being the highest. Principal component analysis enclosed 63.75% of the total variation among all biological components. These estimated results confined the positive resistance by Vigna radiata during osmopriming (PEG) and thermopriming (4 °C) on most of the features with great tolerance under low saline treatments such as T4, T5, T7, and T8 while they were susceptible in the case of T6 and T9 to high salt application. Our findings suggest that the constraining impact of several priming techniques improved low salinity, which was regarded as economically inexpensive and initiated numerous metabolic processes in plants, hence decreasing germination time. Such techniques will be considered adaptive procedures to cope with the upcoming increase in salinity induced by climate change in the region.
Author Contributions
Conceptualization, S.A. and S.A.K.B.; data curation, S.W.; formal analysis, M.N.K., S.A.R., A.H. and S.A.K.B.; funding acquisition, P.P.; investigation, S.A.; methodology, S.A. and W.M.K.; software, M.N.K., W.M.K., S.W. and A.H.; supervision, S.U. and P.P.; validation, S.U.; visualization, S.A.R.; writing—original draft, S.A.; writing—review and editing, S.U., M.N.K., W.M.K., S.A.R., S.W., A.H., S.A.K.B. and P.P. All authors have read and agreed to the published version of the manuscript.
Funding
Peter Poczai acknowledges the support of the iASK Grant.
Institutional Review Board Statement
Not applicable.
Informed Consent Statement
Not applicable.
Data Availability Statement
Not applicable.
Acknowledgments
Open access funding provided by University of Helsinki. Peter Poczai acknowledges the support of the Eötvös Research Fund.
Conflicts of Interest
The authors declare no conflict of interest.
Correction Statement
This article has been republished with a minor correction to resolve spelling and grammatical errors. This change does not affect the scientific content of the article.
References
- Kalaji, H.M.; Jajoo, A.; Oukarroum, A.; Brestic, M.; Zivcak, M.; Samborska, I.A.; Cetner, M.D.; Łukasik, I.; Goltsev, V.; Ladle, R.J. Chlorophyll a fluorescence as a tool to monitor physiological status of plants under abiotic stress conditions. Acta Physiol. Plant. 2016, 38, 1–11. [Google Scholar] [CrossRef]
- Corwin, D.L. Climate change impacts on soil salinity in agricultural areas. Eur. J. Soil Sci. 2021, 72, 842–862. [Google Scholar] [CrossRef]
- Redondo-Gómez, S.; Mesa-Marín, J.; Pérez-Romero, J.A.; López-Jurado, J.; García-López, J.V.; Mariscal, V.; Molina-Heredia, F.P.; Pajuelo, E.; Rodríguez-Llorente, I.D.; Flowers, T.J.; et al. Consortia of Plant-Growth-Promoting Rhizobacteria Isolated from Halophytes Improve Response of Eight Crops to Soil Salinization and Climate Change Conditions. Agronomy 2021, 11, 1609. [Google Scholar] [CrossRef]
- Zou, M.; Yuan, L.; Zhu, S.; Liu, S.; Ge, J.; Wang, C. Effects of heat stress on photosynthetic characteristics and chloroplast ultrastructure of a heat-sensitive and heat-tolerant cultivar of wucai (Brassica campestris L.). Acta Physiol. Plant. 2017, 39, 1–10. [Google Scholar] [CrossRef]
- Pandolfi, C.; Mancuso, S.; Shabala, S. Physiology of acclimation to salinity stress in pea (Pisum sativum). Environ. Exp. Bot. 2012, 84, 44–51. [Google Scholar] [CrossRef]
- Abd El-Hack, M.E.; Samak, D.H.; Noreldin, A.E.; Arif, M.; Yaqoob, H.S.; Swelum, A.A. Towards saving freshwater: Halophytes as unconventional feedstuffs in livestock feed: A review. Environ. Sci. Pollut. Res. 2018, 25, 14397–14406. [Google Scholar] [CrossRef] [PubMed]
- Ivushkin, K.; Bartholomeus, H.; Bregt, A.K.; Pulatov, A. Satellite Thermography for Soil Salinity Assessment of Cropped Areas in Uzbekistan. Land Degrad. Dev. 2016, 28, 870–877. [Google Scholar] [CrossRef]
- El-Beltagi, H.S.; Mohamed, H.I.; Mohammed, A.H.M.; Zaki, L.M.; Mogazy, A.M. Physiological and Biochemical Effects of γ-Irradiation on Cowpea Plants (Vigna sinensis) under Salt Stress. Not. Bot. Horti Agrobot. Cluj-Napoca 2013, 41, 104–114. [Google Scholar] [CrossRef]
- Latef, A.A. Growth and some physiological activities of pepper (Capsicum annuum L.) in response to cadmium stress and mycorrhizal symbiosis. J. Agr. Sci. Tech. 2013, 37, 1437–1448. [Google Scholar]
- Mohammed, A. Physiological aspects of mungbean plant (Vigna radiata L. Wilczek) in response to salt stress and gib-berellic acid treatment. Res. J. Agr. Biol. Sci. 2007, 3, 200–213. [Google Scholar]
- Alharby, H.F.; Al-Zahrani, H.S.; Hakeem, K.R.; Iqbal, M. Identification of physiological and biochemical markers for salt (NaCl) stress in the seedlings of mungbean [Vigna radiata (L.) Wilczek] genotypes. Saudi J. Biol. Sci. 2018, 26, 1053–1060. [Google Scholar] [CrossRef] [PubMed]
- Ikram-ul-Haq, A.A.K.; Azhar, F.; Ullah, E. Genetic basis of variation for salinity tolerance in okra (Abelmoschus esculentus L.). Pak. J. Bot 2010, 42, 1567–1581. [Google Scholar]
- Rengasamy, P. World salinization with emphasis on Australia. J. Exp. Bot. 2006, 57, 1017–1023. [Google Scholar] [CrossRef] [PubMed]
- Pal, A.; Ali, M.A.; Pal, A.K. Effect of seed priming on germination behavior, oxidative stress and antioxidant enzyme activities in groundnut (Arachis hypogaea L.) under salinity stress. Bull. Environ. Pharmacol. Life Sci. 2017, 6, 479–485. [Google Scholar]
- Nasri, N.; Kaddour, R.; Mahmoudi, H.; Baatour, O.; Bouraoui, N.; Lachaâl, M. The effect of osmopriming on germination, seedling growth and phosphatase activities of lettuce under saline condition. Afr. J. Biotechnol. 2011, 10, 14366–14372. [Google Scholar]
- Mouradi, M.; Bouizgaren, A.; Farissi, M.; Makoudi, B.; Kabbadj, A.; Very, A.-A.; Sentenac, H.; Qaddoury, A.; Ghoulam, C. Osmopriming improves seeds germination, growth, antioxidant responses and membrane stability during early stage of Moroccan alfalfa populations under water deficit. Chil. J. Agric. Res. 2016, 76, 265–272. [Google Scholar] [CrossRef][Green Version]
- Siri, B.; Vichitphan, K.; Kaewnaree, P.; Vichitphan, S.; Klanrit, P. Improvement of quality, membrane integrity and anti-oxidant systems in sweet pepper (’Capsicum annuum’Linn.) seeds affected by osmopriming. Aust. J. Crop Sci. 2013, 7, 2068–2073. [Google Scholar]
- Piwowarczyk, B.; Tokarz, B.; Kamińska, I. Responses of grass pea seedlings to salinity stress in in vitro culture conditions. Plant Cell, Tissue Organ Cult. (PCTOC) 2015, 124, 227–240. [Google Scholar] [CrossRef]
- Nascimento, W.M.; Huber, D.J.; Cantliffe, D.J. Carrot seed germination and ethylene production at high temperature in response to seed osmopriming. Hortic. Bras. 2013, 31, 554–558. [Google Scholar] [CrossRef]
- De Souza, M.O.; Pelacani, C.R.; Willems, L.A.; De Castro, R.D.; Hilhorst, H.W.; Ligterink, W. Effect of osmopriming on germination and initial growth of Physalis angulata L. under salt stress and on expression of associated genes. Anais Acad. Bras. Ciênc. 2016, 88, 503–516. [Google Scholar] [CrossRef]
- Singh, A.; Dahiru, R.; Musa, M.; Sani Haliru, B. Effect of Osmopriming duration on germination, emergence, and early growth of Cowpea (Vigna unguiculata (L.) Walp.) in the Sudan Savanna of Nigeria. Int. J. Agron. 2014, 2014. [Google Scholar] [CrossRef]
- Khan, R.; Khan, M.N.; Ullah, H.; Basit, A.; Razzaq, A.; Ahmad, M.; Ozdemir, F. A comparative assessment of proximate and elemental composition six weedy grasses for their potential use as fodder. Prog. Nutr. 2018, 20, 182–190. [Google Scholar]
- Rehman, I.; Rahim, H.U.; Rafiq, S. Comparative analysis of soil physio-chemical properties of two different districts Peshawar and Swabi, KP, Pakistan. Int. J. Environ. Sci. Nat. Resour. 2017, 7, 58–62. [Google Scholar]
- Warwate, S.; Kandoliya, U.; Bhadja, N.; Golakiya, B. The effect of seed priming with plant growth promoting rhizobacteria (PGPR) on growth of Coriander (Coriandrum sativum L.) seedling. Int. J. Curr. Microbiol. Appl. Sci. 2017, 6, 1926–1934. [Google Scholar]
- Marcińska, I.; Czyczyło-Mysza, I.; Skrzypek, E.; Filek, M.; Grzesiak, S.; Grzesiak, M.T.; Janowiak, F.; Hura, T.; Dziurka, M.; Dziurka, K.; et al. Impact of osmotic stress on physiological and biochemical characteristics in drought-susceptible and drought-resistant wheat genotypes. Acta Physiol. Plant. 2013, 35, 451–461. [Google Scholar] [CrossRef]
- Ali, B.; Hafeez, A.; Ahmad, S.; Javed, M.A.; Sumaira Afridi, M.S.; Dawoud, T.M.; Almaary, K.S.; Muresan, C.C.; Marc, R.A.; Alkhalifah, D.H.M.; et al. Bacillus thuringiensis PM25 ameliorates oxidative damage of salinity stress in maize via regulating growth, leaf pigments, antioxidant defense system, and stress responsive gene expression. Front. Plant Sci. 2022, 13, 921668. [Google Scholar] [CrossRef]
- McLean, E. Soil pH and lime requirement. In Methods of Soil Analysis: Part 2 Chemical and Microbiological Properties; American Society of Agronomy, Soil Science Society of America: Madison, WI, USA, 1983; Volume 9, pp. 199–224. [Google Scholar]
- Kader, M. A comparison of seed germination calculation formulae and the associated interpretation of resulting data. J. Proc. Royal Soc. N. S. W. 2005, 138, 65–75. [Google Scholar]
- Bina, F.; Bostani, A. Effect of Salinity (NaCl) stress on germination and early seedling growth of three medicinal plant species. Adv. Life Sci. 2017, 4, 77–83. [Google Scholar]
- Chuyong, G.B.; Acidri, T. Light and moisture levels affect growth and physiological parameters differently in Faidherbia albida (Delile) A. Chev. seedlings. Acta Physiol. Plant. 2017, 39, 117. [Google Scholar] [CrossRef]
- Zainab, N.; Amna; Khan, A.A.; Azeem, M.A.; Ali, B.; Wang, T.; Shi, F.; Alghanem, S.M.; Hussain Munis, M.F.; Hashem, M.; et al. PGPR-Mediated Plant Growth Attributes and Metal Extraction Ability of Sesbania sesban L. in Industrially Contaminated Soils. Agronomy 2021, 11, 1820. [Google Scholar] [CrossRef]
- Mehmood, S.; Khatoon, Z.; Amna Ahmad, I.; Muneer, M.A.; Kamran, M.A.; Ali, J.; Ali, B.; Chaudhary, H.J.; Munis, M.F. Bacillus sp. PM31 harboring various plant growth-promoting activities regulates Fusarium dry rot and wilt tolerance in potato. Arch. Agron. Soil Sci. 2021, 1971654. [Google Scholar] [CrossRef]
- Faryal, S.; Ullah, R.; Khan, M.N.; Ali, B.; Hafeez, A.; Jaremko, M.; Qureshi, K.A. Thiourea-Capped Nanoapatites Amplify Osmotic Stress Tolerance in Zea mays L. by Conserving Photosynthetic Pigments, Osmolytes Biosynthesis and Antioxidant Biosystems. Molecules 2022, 27, 5744. [Google Scholar] [CrossRef] [PubMed]
- Ali, B.; Hafeez, A.; Javed, M.A.; Ahmad, S.; Afridi, M.S.; Sumaira Nadeem, M.; Khan, A.U.R.; Malik, A.; Ullah, A.; Alwahibi, M.S.; et al. Bacterial-mediated salt tolerance in maize: Insights into plant growth promotion, antioxidant defense system, oxidative stress, and surfactant production. Front. Plant Sci. 2022, 13, 978291. [Google Scholar] [CrossRef]
- Ali, B.; Wang, X.; Saleem, M.H.; Azeem, M.A.; Afridi, M.S.; Nadeem, M.; Ghazal, M.; Batool, T.; Qayyum, A.; Alatawi, A.; et al. Bacillus mycoides PM35 Reinforces Photosynthetic Efficiency, Antioxidant Defense, Expression of Stress-Responsive Genes, and Ameliorates the Effects of Salinity Stress in Maize. Life 2022, 12, 219. [Google Scholar] [CrossRef]
- Ali, B.; Wang, X.; Saleem, M.H.; Sumaira; Hafeez, A.; Afridi, M.S.; Khan, S.; Zaib-Un-Nisa; Ullah, I.; Amaral Júnior, A.T.; et al. PGPR-Mediated Salt Tolerance in Maize by Modulating Plant Physiology, Antioxidant Defense, Compatible Solutes Accumulation and Bio-Surfactant Producing Genes. Plants 2022, 11, 345. [Google Scholar] [CrossRef]
- Ma, J.; Saleem, M.H.; Ali, B.; Rasheed, R.; Ashraf, M.A.; Aziz, H.; Ercisli, S.; Riaz, S.; Elsharkawy, M.M.; Hussain, I.; et al. Impact of foliar application of syringic acid on tomato (Solanum lycopersicum L.) under heavy metal stress-insights into nutrient uptake, redox homeostasis, oxidative stress, and antioxidant defense. Front. Plant Sci. 2022, 13, 950120. [Google Scholar] [CrossRef]
- Ma, J.; Saleem, M.H.; Yasin, G.; Mumtaz, S.; Qureshi, F.F.; Ali, B.; Ercisli, S.; Alhag, S.K.; Ahmed, A.E.; Vodnar, D.C.; et al. Individual and combinatorial effects of SNP and NaHS on morpho-physio-biochemical attributes and phytoextraction of chromium through Cr-stressed spinach (Spinacia oleracea L.). Front. Plant Sci. 2022, 13, 973740. [Google Scholar] [CrossRef]
- Ma, J.; Ali, S.; Saleem, M.H.; Mumtaz, S.; Yasin, G.; Ali, B.; Al-Ghamdi, A.A.; Elshikh, M.S.; Vodnar, D.C.; Marc, R.A.; et al. Short-term responses of Spinach (Spinacia oleracea L.) to the individual and combinatorial effects of Nitrogen, Phosphorus and Potassium and silicon in the soil contaminated by boron. Front. Plant Sci. 2022, 13, 983156. [Google Scholar] [CrossRef]
- Al-Zaban, M.I.; Alhag, S.K.; Dablool, A.S.; Ahmed, A.E.; Alghamdi, S.; Ali, B.; Al-Saeed, F.A.; Saleem, M.H.; Poczai, P. Manufactured Nano-Objects Confer Viral Protection against Cucurbit Chlorotic Yellows Virus (CCYV) Infecting Nicotiana benthamiana. Microorganisms 2022, 10, 1837. [Google Scholar] [CrossRef]
- Solanki, M.K.; Solanki, A.C.; Rai, S.; Srivastava, S.; Kashyap, B.K.; Divvela, P.K.; Kumar, S.; Yandigeri, M.S.; Kashyap, P.L.; Shrivastava, A.K.; et al. Functional interplay between antagonistic bacteria and Rhizoctonia solani in the tomato plant rhizosphere. Front. Microbiol. 2022, 13, 990850. [Google Scholar] [CrossRef]
- Naz, R.; Khan, M.K.; Hafeez, A.; Fazil, M.; Khan, M.N.; Ali, B.; Javed, M.A.; Imran, M.; Shati, A.A.; Alfaifi, M.Y.; et al. Assessment of phytoremediation potential of native plant species naturally growing in a heavy metal-polluted industrial soils. Braz. J. Biol. 2022, 84, e264473. [Google Scholar] [CrossRef] [PubMed]
- Bibi, S.; Ullah, S.; Hafeez, A.; Khan, M.N.; Javed, M.A.; Ali, B.; Din, I.U.; Bangash, S.A.K.; Wahab, S.; Wahid, N.; et al. Exogenous Ca/Mg quotient reduces the inhibitory effects of PEG induced osmotic stress on Avena sativa L. Braz. J. Biol. 2022, 84, e264642. [Google Scholar] [CrossRef] [PubMed]
- Nawaz, H.; Ali, A.; Saleem, M.H.; Ameer, A.; Hafeez, A.; Alharbi, K.; Ezzat, A.; Khan, A.; Jamil, M.; Farid, G. Comparative effectiveness of EDTA and citric acid assisted phytoremediation of Ni contaminated soil by using canola (Brassica napus). Braz. J. Biol. 2022, 82, e261785. [Google Scholar] [CrossRef] [PubMed]
- Saleem, K.; Asghar, M.A.; Saleem, M.H.; Raza, A.; Kocsy, G.; Iqbal, N.; Ali, B.; Albeshr, M.F.; Bhat, E.A. Chrysotile-Asbestos-Induced Damage in Panicum virgatum and Phleum pretense Species and Its Alleviation by Organic-Soil Amendment. Sustainability 2022, 14, 10824. [Google Scholar] [CrossRef]
- Farooq, T.H.; Rafay, M.; Basit, H.; Shakoor, A.; Shabbir, R.; Riaz, M.U.; Ali, B.; Kumar, U.; Qureshi, K.A.; Jaremko, M. Morpho-physiological growth performance and phytoremediation capabilities of selected xerophyte grass species toward Cr and Pb stress. Front. Plant Sci. 2022, 13, 997120. [Google Scholar] [CrossRef]
- Dola, D.B.; Mannan, M.A.; Sarker, U.; Mamun, M.A.A.; Islam, T.; Ercisli, S.; Saleem, M.H.; Ali, B.; Pop, O.L.; Marc, R.A. Nano-iron oxide accelerates growth, yield, and quality of Glycine max seed in water deficits. Front. Plant Sci. 2022, 13, 992535. [Google Scholar] [CrossRef]
- Wahab, A.; Abdi, G.; Saleem, M.H.; Ali, B.; Ullah, S.; Shah, W.; Mumtaz, S.; Yasin, G.; Muresan, C.C.; Marc, R.A. Plants’ Physio-Biochemical and Phyto-Hormonal Responses to Alleviate the Adverse Effects of Drought Stress: A Comprehensive Review. Plants 2022, 11, 1620. [Google Scholar] [CrossRef]
- Amna Ali, B.; Azeem, M.A.; Qayyum, A.; Mustafa, G.; Ahmad, M.A.; Javed, M.T.; Chaudhary, H.J. Bio-Fabricated Silver Nanoparticles: A Sustainable Approach for Augmentation of Plant Growth and Pathogen Control. In Sustainable Agriculture Reviews 53; Springer: Cham, Switzerland, 2021; pp. 345–371. [Google Scholar]
- Ali, B.; Hafeez, A.; Javed, M.A.; Afridi, M.S.; Abbasi, H.A.; Qayyum, A.; Batool, T.; Ullah, A.; Marc, R.A.; Al-Jouni, S.K.; et al. Role of endophytic bacteria in salinity stress amelioration by physiological and molecular mechanisms of defense: A comprehensive review. South Afr. J. Bot. 2022, 151, 33–46. [Google Scholar] [CrossRef]
- Afridi, M.S.; Javed, M.A.; Ali, S.; De Medeiros, F.H.V.; Ali, B.; Salam, A.; Sumaira; Marc, R.A.; Alkhalifah, D.H.M.; Selim, S.; et al. New opportunities in plant microbiome engineering for increasing agricultural sustainability under stressful conditions. Front. Plant Sci. 2022, 13, 899464. [Google Scholar] [CrossRef]
- Hussain, S.Q.; Rasheed, M.; Saleem, M.H.; Ahmed, Z.I.; Hafeez, A.; Jilani, G.; Alamri, S.; Hashem, M.; Ali, S. Salt tolerance in maize with melatonin priming to achieve sustainability in yield on salt affected soils. Pak. J. Bot. 2021, 55, 1. [Google Scholar] [CrossRef]
- Saeed, S.; Ullah, A.; Ullah, S.; Noor, J.; Ali, B.; Khan, M.N.; Hashem, M.; Mostafa, Y.S.; Alamri, S. Validating the Impact of Water Potential and Temperature on Seed Germination of Wheat (Triticum aestivum L.) via Hydrothermal Time Model. Life 2022, 12, 983. [Google Scholar] [CrossRef] [PubMed]
- Adnan, M.; Fahad, S.; Saleem, M.H.; Ali, B.; Mussart, M.; Ullah, R.; Arif, M.; Ahmad, M.; Shah, W.A.; Romman, M.; et al. Comparative efficacy of phosphorous supplements with phosphate solubilizing bacteria for optimizing wheat yield in calcareous soils. Sci. Rep. 2022, 12, 11997. [Google Scholar] [CrossRef] [PubMed]
- Ahmad, M.; Ishaq, M.; Shah, W.A.; Adnan, M.; Fahad, S.; Saleem, M.H.; Khan, F.U.; Mussarat, M.; Khan, S.; Ali, B.; et al. Managing Phosphorus Availability from Organic and Inorganic Sources for Optimum Wheat Production in Calcareous Soils. Sustainability 2022, 14, 7669. [Google Scholar] [CrossRef]
- Sani, B.; Jodaeian, V. The Role of Thermo Priming on Improving Seedling Production Technology (Ispt) in Soybean [Glycine max (L.) Merrill] Seeds. Int. J. Agric. Biosyst. Eng. 2015, 9, 753–756. [Google Scholar]
- Johnson, R.; Puthur, J.T. Seed priming as a cost effective technique for developing plants with cross tolerance to salinity stress. Plant Physiol. Biochem. 2021, 162, 247–257. [Google Scholar] [CrossRef]
- Ahmad, I.; Ullah, S.; Nafees, M. Effect of osmopriming and thermopriming on amelioration of mercuric chloride stress tolerance in mungbean (Vigna radiata L.). Plant Physiol. Rep. 2020, 25, 516–528. [Google Scholar] [CrossRef]
- Abdolahpour, M.; Lotfi, R. Seed priming affected physiology and grain yield of chickpea under salt stress. J. Biodivers. Environ. Sci 2014, 5, 442–446. [Google Scholar]
- Maroufi, K.; Farahani, H.A.; Moradi, O. Thermo priming influence on seedling production in wheat (Triticum Aestivum L.). Adv. Environ. Biol. 2011, 3664–3668. [Google Scholar]
- Moreira, G.S.; Jillett, J.B.; Vernberg, W.B.; Weinrich, M. The combined effects of temperature and salinity on the survival of Euterpina acutifrons (Dana) (Copepoda, Harpacticoida) from the New Zealand and Brazilian coasts. J. Plankton Res. 1982, 4, 85–91. [Google Scholar] [CrossRef]
- Farahmandfar, E.; Shirvan, M.B.; Sooran, S.A.; Hoseinzadeh, D. Effect of seed priming on morphological and physiological parameters of fenugreek seedlings under salt stress. Int. J. Agric. Crop Sci. 2013, 5, 811. [Google Scholar]
- Mirlotfi, A.; Bakhtiari, S.; Bazrgar, A.B. Effect of seed priming on germination and seedling traits of Marigold (Calendula officinalis) at saline condition. Biol. Forum –Int. J. 2015, 7, 1626–1630. [Google Scholar]
- El-Saifi, S.; Ahmed, H.; Hasan, S.M.; Morsi, M.; El-Shatoury, R.S. Seed priming influences seed germination and seedling growth of tomato under different salinity levels. J. Plant Prod. 2010, 1, 159–170. [Google Scholar] [CrossRef]
- Aloui, H.; Souguir, M.; Latique, S.; Hannachi, C. Germination and growth in control and primed seeds of pepper as affected by salt stress. Cercet. Agron. În Mold. 2014, 47, 83–95. [Google Scholar] [CrossRef]
- Mohamed, I.A.; Shalby, N.; El-Badri, A.M.A.; Saleem, M.H.; Khan, M.N.; Nawaz, M.A.; Qin, M.; Agami, R.A.; Kuai, J.; Wang, B. Stomata and xylem vessels traits improved by melatonin application contribute to enhancing salt tolerance and fatty acid composition of Brassica napus L. plants. Agronomy 2020, 10, 1186. [Google Scholar] [CrossRef]
- Gama, P.B.S.; Tanaka, K.; Eneji, A.E.; Eltayeb, A.E.; Siddig, K.E. Salt-induced stress effects on biomass, photosynthetic rate, and reactive oxygen species-scavenging enzyme accumulation in common bean. J. Plant Nutr. 2009, 32, 837–854. [Google Scholar] [CrossRef]
- Esfandiari, E.; Shekari, F.; Shekari, F.; Esfandiari, M. The effect of salt stress on antioxidant Enzymes’ activity and lipid peroxidation on the wheat seedling. Not. Bot. Horti Agrobot. Cluj-Napoca 2007, 35, 48. [Google Scholar]


Publisher’s Note: MDPI stays neutral with regard to jurisdictional claims in published maps and institutional affiliations. |
© 2022 by the authors. Licensee MDPI, Basel, Switzerland. This article is an open access article distributed under the terms and conditions of the Creative Commons Attribution (CC BY) license (https://creativecommons.org/licenses/by/4.0/).