Article

Reducing Tillage Affects Long-Term Yields but Not Grain Quality of Maize, Soybeans, Oats, and Wheat Produced in Three Contrasting Farming Systems

1
Rodale Institute, Kutztown, PA 19530, USA
2
Department of Agricultural and Environmental Sciences, Tennessee State University, Nashville, TN 37209, USA
3
West Central Research and Outreach Center, University of Minnesota, Morris, MN 56267, USA
*
Author to whom correspondence should be addressed.
Sustainability 2022, 14(2), 631; https://doi.org/10.3390/su14020631
Submission received: 17 November 2021 / Revised: 18 December 2021 / Accepted: 23 December 2021 / Published: 6 January 2022
(This article belongs to the Special Issue Sustainable Organic Agriculture)

Abstract

:
Reducing tillage has been widely promoted to reduce soil erosion, maintain soil health, and sustain long-term food production. The effects of reducing tillage on crop nutritional quality in organic and conventional systems, however, has not been widely explored. One possible driver of crop nutritional quality might be the changing soil nitrogen (N) availability associated with reduced tillage in various management systems. To test how reducing tillage affects crop nutritional quality under contrasting conventional and organic farming systems with varied N inputs, we measured nutritional quality (protein, fat, starch, ash, net energy, total digestible nutrients, and concentrations of Ca, K, Mg, P, and S) of maize, wheat, oats, and soybeans harvested from a long-term trial comprised of three farming systems under two tillage regimes: a conventional grain system (CNV); a low-input organic grain system (LEG); and an organic, manure-based grain + forage system (MNR) under conventional full-tillage (FT) and reduced-till (RT) management. Although maize and wheat yields were 10–13% lower under RT management, grain quality metrics including protein, fat, starch, energy, and mineral concentrations were not significantly affected by reducing tillage. Differences in nutrient quality were more marked between farming systems: protein levels in maize were highest in the MNR system (8.1%); protein levels in soybeans were highest in the LEG system (40.4%); levels of protein (12.9%), ash (2.0%), and sulfur (1430 ppm) in wheat were highest in the CNV system, and oat quality was largely consistent between the LEG and MNR systems. As grain quality did not significantly respond to reducing tillage, other management decisions that affect nutrient availability appear to have a greater effect on nutrient quality.

Graphical Abstract

1. Introduction

Modern agriculture is often characterized by limited crop diversity, heavy tillage, and a reliance on inorganic fertilizers [1]. Although these intensive practices helped double average grain yields during the second half of the 20th century [2], these practices have also dramatically increased soil erosion, disrupted soil structure, depleted soil organic matter and natural fertility, and diminished soil biology [1]. This widespread soil degradation not only undermines water quality, soil carbon (C) sequestration, and many other ecosystem services [3], but may also jeopardize long-term crop productivity and quality [4].
To reverse or mitigate soil degradation in agroecosystems, a range of agricultural practices have been proposed and include strategies such as reducing tillage, retaining crop residues, diversifying crop rotations, and replacing or substituting synthetic fertilizers with organic fertilizers [5]. Among these conservation practices, reducing tillage has been the most widely adopted by conventional farmers, with nearly 75% of crop acres in the United States under reduced-till management (37% under no-till management) [6]. The promise of improved soil health has even driven a growing number of organic farmers to adopt reduce-till practices, despite the added challenge of managing weeds without herbicides or intensive tillage [7]. Most reduced-till organic farms in the United States are managed through cover crop-based rotational no-till, where conventional (full) tillage is still used for certain phases of a crop rotation, while other crops are no-till planted into freshly terminated cover crops [7,8,9,10,11]. However, despite erosion control and other soil health benefits associated with tillage reduction [12,13,14], the long-term effects on crop yield and nutrient quality have not been widely documented.
Existing research shows that reducing tillage does not consistently improve crop yield in agricultural systems. A global meta-analysis of 610 studies that compared no-till and conventional tillage showed that, on average, no-till reduces yields by 5.7% [15]. The largest yield declines were observed when no-till was implemented alone, whereas co-adoption of other conservation practices (e.g., residue retention and diverse crop rotations) usually minimized the yield-limiting impacts of no-till. A more recent review of 49 meta-analyses found that no-till production led to a significant decline of crop yield by 8.0% to 10.0% [16]. Reduced soil nitrogen (N) availability under reduced tillage may have contributed to this yield decline, as numerous studies have reported that reduced or no tillage, although often improving soil organic matter in the long run (>10 years), can cause declines in available soil N in the short term [17,18,19,20,21]. While soil compaction and nutrient stratification may also have contributed to these yield declines in agrochemical-based conventional systems [22,23], it is unclear if reducing tillage—especially through cover crop-based rotational no-till—would have similar impact in organic systems.
Unlike most conventional systems, which rely on inorganic fertility inputs, organic systems usually rely on leguminous cover crops and/or periodically applied organic amendments (e.g., compost, manure) as sources of fertility [24]. When cover crop residues and organic amendments provide sufficient nitrogen (N), organic systems will often produce crops at similar yields [25,26] and of similar quality [27,28,29] as conventional systems. Heavy tillage, however, is often relied upon to incorporate cover crop residues and organic amendments into soil, which can improve N availability for crops; in the absence of heavy tillage, organic systems may have lower N availability despite sufficient N inputs [9]. Alternatively, as organic practices and reducing tillage encourage greater densities of bioturbators (i.e., earthworms and soil arthropods) [30,31,32,33], biological activity may be sufficient to incorporate organic inputs and ensure adequate N availability in reduced-till organic systems.
Although a growing number of studies have measured how yield responds to reducing tillage, the response of grain quality to reducing tillage has not been comprehensively studied in either conventional or organic systems (Table A1; [34,35,36,37,38,39,40,41,42,43,44,45,46,47,48,49,50,51,52,53,54,55,56,57,58,59,60,61,62,63,64,65,66,67,68,69,70,71]). Moreover, few studies have measured grain quality under the management practices employed in cover crop-based rotational no-till; of the studies found through a literature search (Table A1), only one included cover crops [44], only two explored minimal [42] or rotational no-till [61], and none measured how reducing tillage affects grain quality of multiple crops harvested from well-established, side-by-side organic and conventional systems. To address this knowledge gap, we analyzed the nutritional quality of maize (Zea mays L), winter wheat (Triticum aestivum L), oats (Avena sativa L.), and soybeans (Glycine max L.) harvested from the long-term Farming Systems Trial (FST; Kutztown, Pennsylvania). We hypothesized that (1) reducing tillage would lower crop yields in conventional and low-input legume-based organic systems, but not in a manure-based organic system; (2) compared to conventionally-grown crops, grain quality would be equivalent in a manure-based organic system (MNR), but lower in a low-input legume-based organic system (LEG); (3) reducing tillage would not affect the quality of grain produced under CNV or MNR management, as sufficient N was supplied by inorganic fertilizers and manure applications, but reducing tillage would decrease the quality of crops grown in the LEG system because N inputs from leguminous cover crops were not incorporated as effectively as under conventional tillage. Lower grain yields and reduced grain quality can directly decrease food security [2] and can dramatically affect livestock health and the quality of animal products [72,73].

2. Materials and Methods

2.1. Field Site, System Management, and Nitrogen Inputs

Yield and grain quality were measured from crops grown in the Farming Systems Trial (FST) at the Rodale Institute in Kutztown, PA (Berks Co., 40°33′5″–75°43′47″) from 2008–2013 and 2016–2020. Two years (2014 and 2015) were excluded from this analysis because crop rotations were interrupted in 2014 to plant the entire field to oats, the nutritional quality of which was previously assessed in Omondi et al. (2021) [74].
The FST is a long-term experiment that was originally established in 1981 to study how soil health, agronomy, and economics change after transitioning to organic management. The FST field-site is located in a subhumid climate (12.4 °C mean temperature and 1.105 m annual precipitation) on a moderately well-drained Clarksburg silt loam (≤3% slope; fine-loamy, mixed, superactive, mesic Oxyaquic Fragiudalf) with minimal slope (3% maximum slope) [75]. Additional details on the long-term FST experiment can be found in Liebhardt et al. (1989) [76] and Seidel et al. (2017) [77]. In brief, the FST initially comprised three replicated farming systems under full tillage (FT): (1) a conventional grain cropping system with inorganic fertilizer inputs (CNV); (2) a low-input organic grain cropping system that relies on leguminous cover crops to supply N (LEG); and (3) an organic system with occasional composted manure inputs and 3–4 years of forage production during each crop rotation (MNR).
In 2008, the reduced-till treatment was introduced to the study by reducing tillage in four of the eight system replicates (RT-CNV, RT-LEG, and RT-MNR) while standard tillage (full-till = FT) continued in the other four replicates (FT-CNV = chisel plow + disking, FT-LEG and FT-MNR = moldboard plow + disking + cultivation). Herbicide-based no-till was adopted in the RT-CNV treatment while cover crop-based rotational no-till was adopted in the RT-LEG and RT-MNR treatments. For cover crop-based rotational no-till, organic maize and soybeans were no-till planted into cover crop mulches (hairy vetch (Vicia villosa) or annual rye (Secale cereale) that were terminated with the use of a roller-crimper [8,78], whereas moldboard plowing, disking, and packing preceded all other crops and cover crops. Each system replicate was divided into three, 0.05-ha subplots (6 × 92 m) which were planted at different phases of each crop rotation, so more crops within each rotation could be represented within any given year (Table 1). Crop varieties, planting rates, and crop rotations are included in Supplemental Table S1 and Figures S1 and S2. Above-ground N inputs were estimated from inorganic fertilizers, composted manure, and terminated hairy vetch cover crops (Table 1; detailed methods for N input estimates are included in Appendix B).

2.2. Grain Yields and Nutrient Analyses

Maize, wheat, oat, soybean, and barley plants were hand-sampled immediately before harvest in 2008–2013 and 2016–2020. Maize plants were sampled along one 5.3 m transect per plot while soybeans, wheat, oats, and barley were sampled from three, 0.56 m2 quadrats per plot. After drying full plant samples at 48 °C for a minimum of three days, grain and beans were separated, cleaned (threshed and winnowed as needed), weighed for yield estimates, and subsampled for grain quality analyses. All grain quality analyses were performed by Dairy One (Ithaca, NY, USA). Maize, wheat, and oat dry matter was analyzed for crude protein; starch; crude fat; ash; and concentrations of Ca, K, Mg, P, and S through the use of near-infrared reflectance (NIR) spectroscopy [79]. Crude protein in soybeans was determined based on the combustion method [80,81]. Measures of energy value for dairy cows were estimated for all four grains: total digestible nutrients (TDN) was estimated as sum of digestible protein, digestible carbohydrates, and 2.25× digestible fat; net energy for maintenance (NEm, Mcal kg−1) was estimated as the energy value to maintain cow weight; net energy for lactation (NEl, Mcal kg−1) which was estimated as the energy value for NEm + milk production and the last two months of gestation for cows; and net energy for gain (NEg, Mcal kg−1) was estimated as the energy value for weight gain [82]. Additional NIR-based analyses included acid and neutral detergent fiber (ADF, NDF) and insoluble crude protein (ADICP, NDICP); adjusted, degradable, and soluble crude protein (ACP, DP_CP, SP_CP); lignin; and non-fibrous carbohydrates. The results of these additional analyses are summarized in Tables S2 and S3. As barley (Hordeum vulgare L.) was only grow in in the FT-LEG treatment, only crude protein values from barley (determined through NIR) were included in this analysis as part of the assessment of cumulative protein production.

2.3. Average Annual and Cumulative Protein Production

We calculated annual and cumulative protein production from 2008–2013 and 2016–2020 to integrate a measure of crop quality (protein content) with crop quantity (yield). We calculated annual protein production for each subplot for each year, then summed protein production across all crops and all years (2008–2013, 2016–2020) as a cumulative protein value for each subplot. Annual protein production was calculated as crude protein concentration (%) × crop yield (kg ha−1 year−1 at 0% moisture) for soybeans, maize, wheat, oats, and barley. To account for protein production from forages grown in the MNR system (maize silage and hay (7:4 Dactylis glomerata L. and Medicago sativa L.)), we approximated crude protein content from total N content based on the Kjeldahl method (protein = total N × 6.25). Forage biomass was sampled at three locations within each subplot (three 0.25 m2 quadrats per plot), dried at 48 °C for a minimum of three days, then analyzed for total N content by dry combustion [83].

2.4. Statistical Analyses

All statistical analyses were performed in RStudio (v.1.4.1103) running R version 4.0.4 [84,85]. We used linear mixed effect models (lmer from the “lme4” package [86]) to compare measures of grain quality, yields, and annual protein production for each crop, with system and tillage as fixed effects and harvest year included as a random factor. As the reduced-till treatments were distinctly different between the CNV and organic systems (having eliminated tillage in the CNV system but not in the organic systems), tillage was nested within system rather than treating tillage and system as fully crossed factors [87]; we denote this nested factor as tillage (system). We checked model criteria by visually inspecting factor boxplots to test for homogenous variance and running Shapiro–Wilk tests (shapiro.test) on model residuals to test for normality. Full mixed effect models were compared to null models (models excluding fixed effects) to test overall model significance (p < 0.05; anova function) while the significance of individual fixed factors was determined based on χ2 tests (ANOVA from the “car” package [88]). Pairwise mean comparisons were generated using the emmeans function from the “emmeans” package, with “mvt” p-value adjustments to account for multiple comparisons [89]. We used ANOVA (aov) and emmeans to assess cumulative protein production across the three systems and between the tillage treatments.

3. Results

3.1. Maize

Maize yields and grain quality differed across the farming systems, while reducing tillage only affected maize yields. Maize yields were significantly lower in the LEG system compared to the CNV and MNR systems (Table 2). These lower yields corresponded with the lower average N inputs in the LEG system (Table 1; CNV = MNR > LEG; χ22 = 13.2, p = 0.001). Yields were marginally even lower where tillage was reduced in the LEG system (t = −1.8, p = 0.08), but this did not correspond with differences in N inputs (Table 1; χ21 = 1.2, p = 0.28). Yields were significantly lower where tillage was reduced in the CNV system (t = −2.4 p = 0.02) despite significantly higher N inputs in the RT-CNV treatment compared to the FT-CNV treatment (Table 1; χ21 = 5.4, p = 0.02). Neither N inputs before maize nor maize yields differed between the RT-MNR and FT-MNR treatments (Table 1; χ21 < 0.0001, p = 1.00). Measures of maize grain quality differed across the three cropping systems but were not affected by reducing tillage in any of the systems (Table 3 and Table 4). Maize grown in the CNV system contained significantly less protein compared to maize from the organic systems (4% less than in the LEG system and 12.5% less than in the MNR system) and significantly less Mg but more starch than maize from the MNR system (Table 4). The CNV and MNR systems produced maize with similar energy densities (Table 4; TDN, NEg, NEl, and NEm) that were significantly higher than maize from the LEG system. Maize from the LEG system also had significantly lower crude protein, crude fat, and NEm levels compared to the MNR system and significantly lower NEg, NEl, NEm, and TDN compared to the CNV system. Ash, Ca, K, P, and S levels in maize were not significantly different across the three systems (Table 4).

3.2. Wheat

Farming system significantly affected wheat yields and wheat quality while reducing tillage only affected wheat yields. Overall wheat yields in the MNR system were significantly higher than in the LEG system (t120 = −3.6, p = 0.001), while CNV wheat yields fell between the two organic systems (Table 2). Reducing tillage significantly decreased wheat yields in the RT-MNR treatment relative to yields in the FT-MNR treatment (Table 2; t115 = −3.0, p = 0.004), but did not affect yields in the other two system. CNV wheat received significantly more N inputs (Table 1; χ22 = 134.8, p < 0.0001) compared to LEG and MNR wheat, as organic wheat was never preceded by vetch and never received any external N inputs. N inputs also did not significantly differ for wheat grown in the FT-CNV and RT-CNV treatments (χ21 = 0.2, p = 0.65).
As with maize, most measures of wheat grain quality differed across the three cropping systems but not between tillage treatments (Table 3). Wheat protein and starch showed an opposite response to cropping-system as maize (Table 4); compared to organic wheat, the CNV wheat had significantly higher crude protein (+13%) and significantly lower starch levels (−1.8% and −3.0% compared to LEG and MNR, respectively). CNV wheat also had significantly higher levels of ash and S yet significantly lower energy densities (NEg, NEl, NEm, and TDN) than wheat grown in the two organic systems (Table 4). Mg and P levels were significantly lower in wheat harvested from the MNR system compared to the CNV and LEG systems (−9% Mg and −7% P in the MNR system), while S levels were significantly higher in wheat from the CNV system (+6% compared to organic wheat). Crude fat, Ca, and K levels in wheat were not significantly different across the three systems (Table 4). Reducing tillage had a marginally significant effect on P levels in wheat (Table 3; χ2 = 7.6, p = 0.06); P levels were 10% lower in the RT-CNV treatment compared to the FT-CNV treatment (CNV: FT = 0.397%, RT = 0.356%, t125 = 2.5, p = 0.01), although P levels were consistent between the FT and RT treatments in the two organic systems (LEG: t123 = −1.2, p = 0.23; MNR: t125 = 0.08, p = 0.94). Reducing tillage did not affect any other measures of wheat quality (Table 3).

3.3. Oats

Oat yields significantly differed between the two organic systems while oat quality was largely consistent between the two organic systems and between tillage treatments. Oats were grown in both the LEG and MNR systems, and like with wheat, oat yields in the LEG system were significantly lower than in the MNR system (t107 = −5.0, p < 0.0001; Table 2), which corresponded with the significantly higher above-ground N inputs in the MNR system (Table 1; χ21 = 53.6, p < 0.0001). Although N inputs from manure were identical between FT-MNR and RT-MNR treatments (χ21 = 0, p = 1), reducing tillage had a marginal effect on oat yields in the MNR system (t99 = −2.0, p = 0.05). K levels were the only measure of oat quality that differed between the LEG and MNR systems, and no measures of oat quality responded to reducing tillage (Table 3). K levels were significantly higher in oats grown in the LEG system compared to the MNR system (+6%; Table 4). Levels of protein, fat, starch, ash, energy density (TDN, NEg, NEl, and NEm), and all other minerals measured (Ca, Mg, P, and S) in oats did not significantly differ between the two organic systems nor between tillage treatments (Table 3 and Table 4).

3.4. Soybeans

Soybean yields and grain quality differed across farming systems but not between tillage treatments. Soybean yields were significantly lower under organic management, especially in the LEG system, but reducing tillage did not significantly affect soybeans yields (Table 2). Soybean quality was only measured as crude protein content and energy density (TDN, NEg, NEl, and NEm), both of which significantly differed among cropping systems but not between tillage treatments (Table 3). Crude protein levels were significantly higher in soybeans harvested from the LEG system compared to the CNV system (+3.5%). NEg and NEl were significantly higher in soybeans harvested from the MNR system compared to the CNV system, but only by less than 1% (Table 3 and Table 4). NEm and TDN did not differ among cropping systems nor tillage treatments (Table 3 and Table 4).

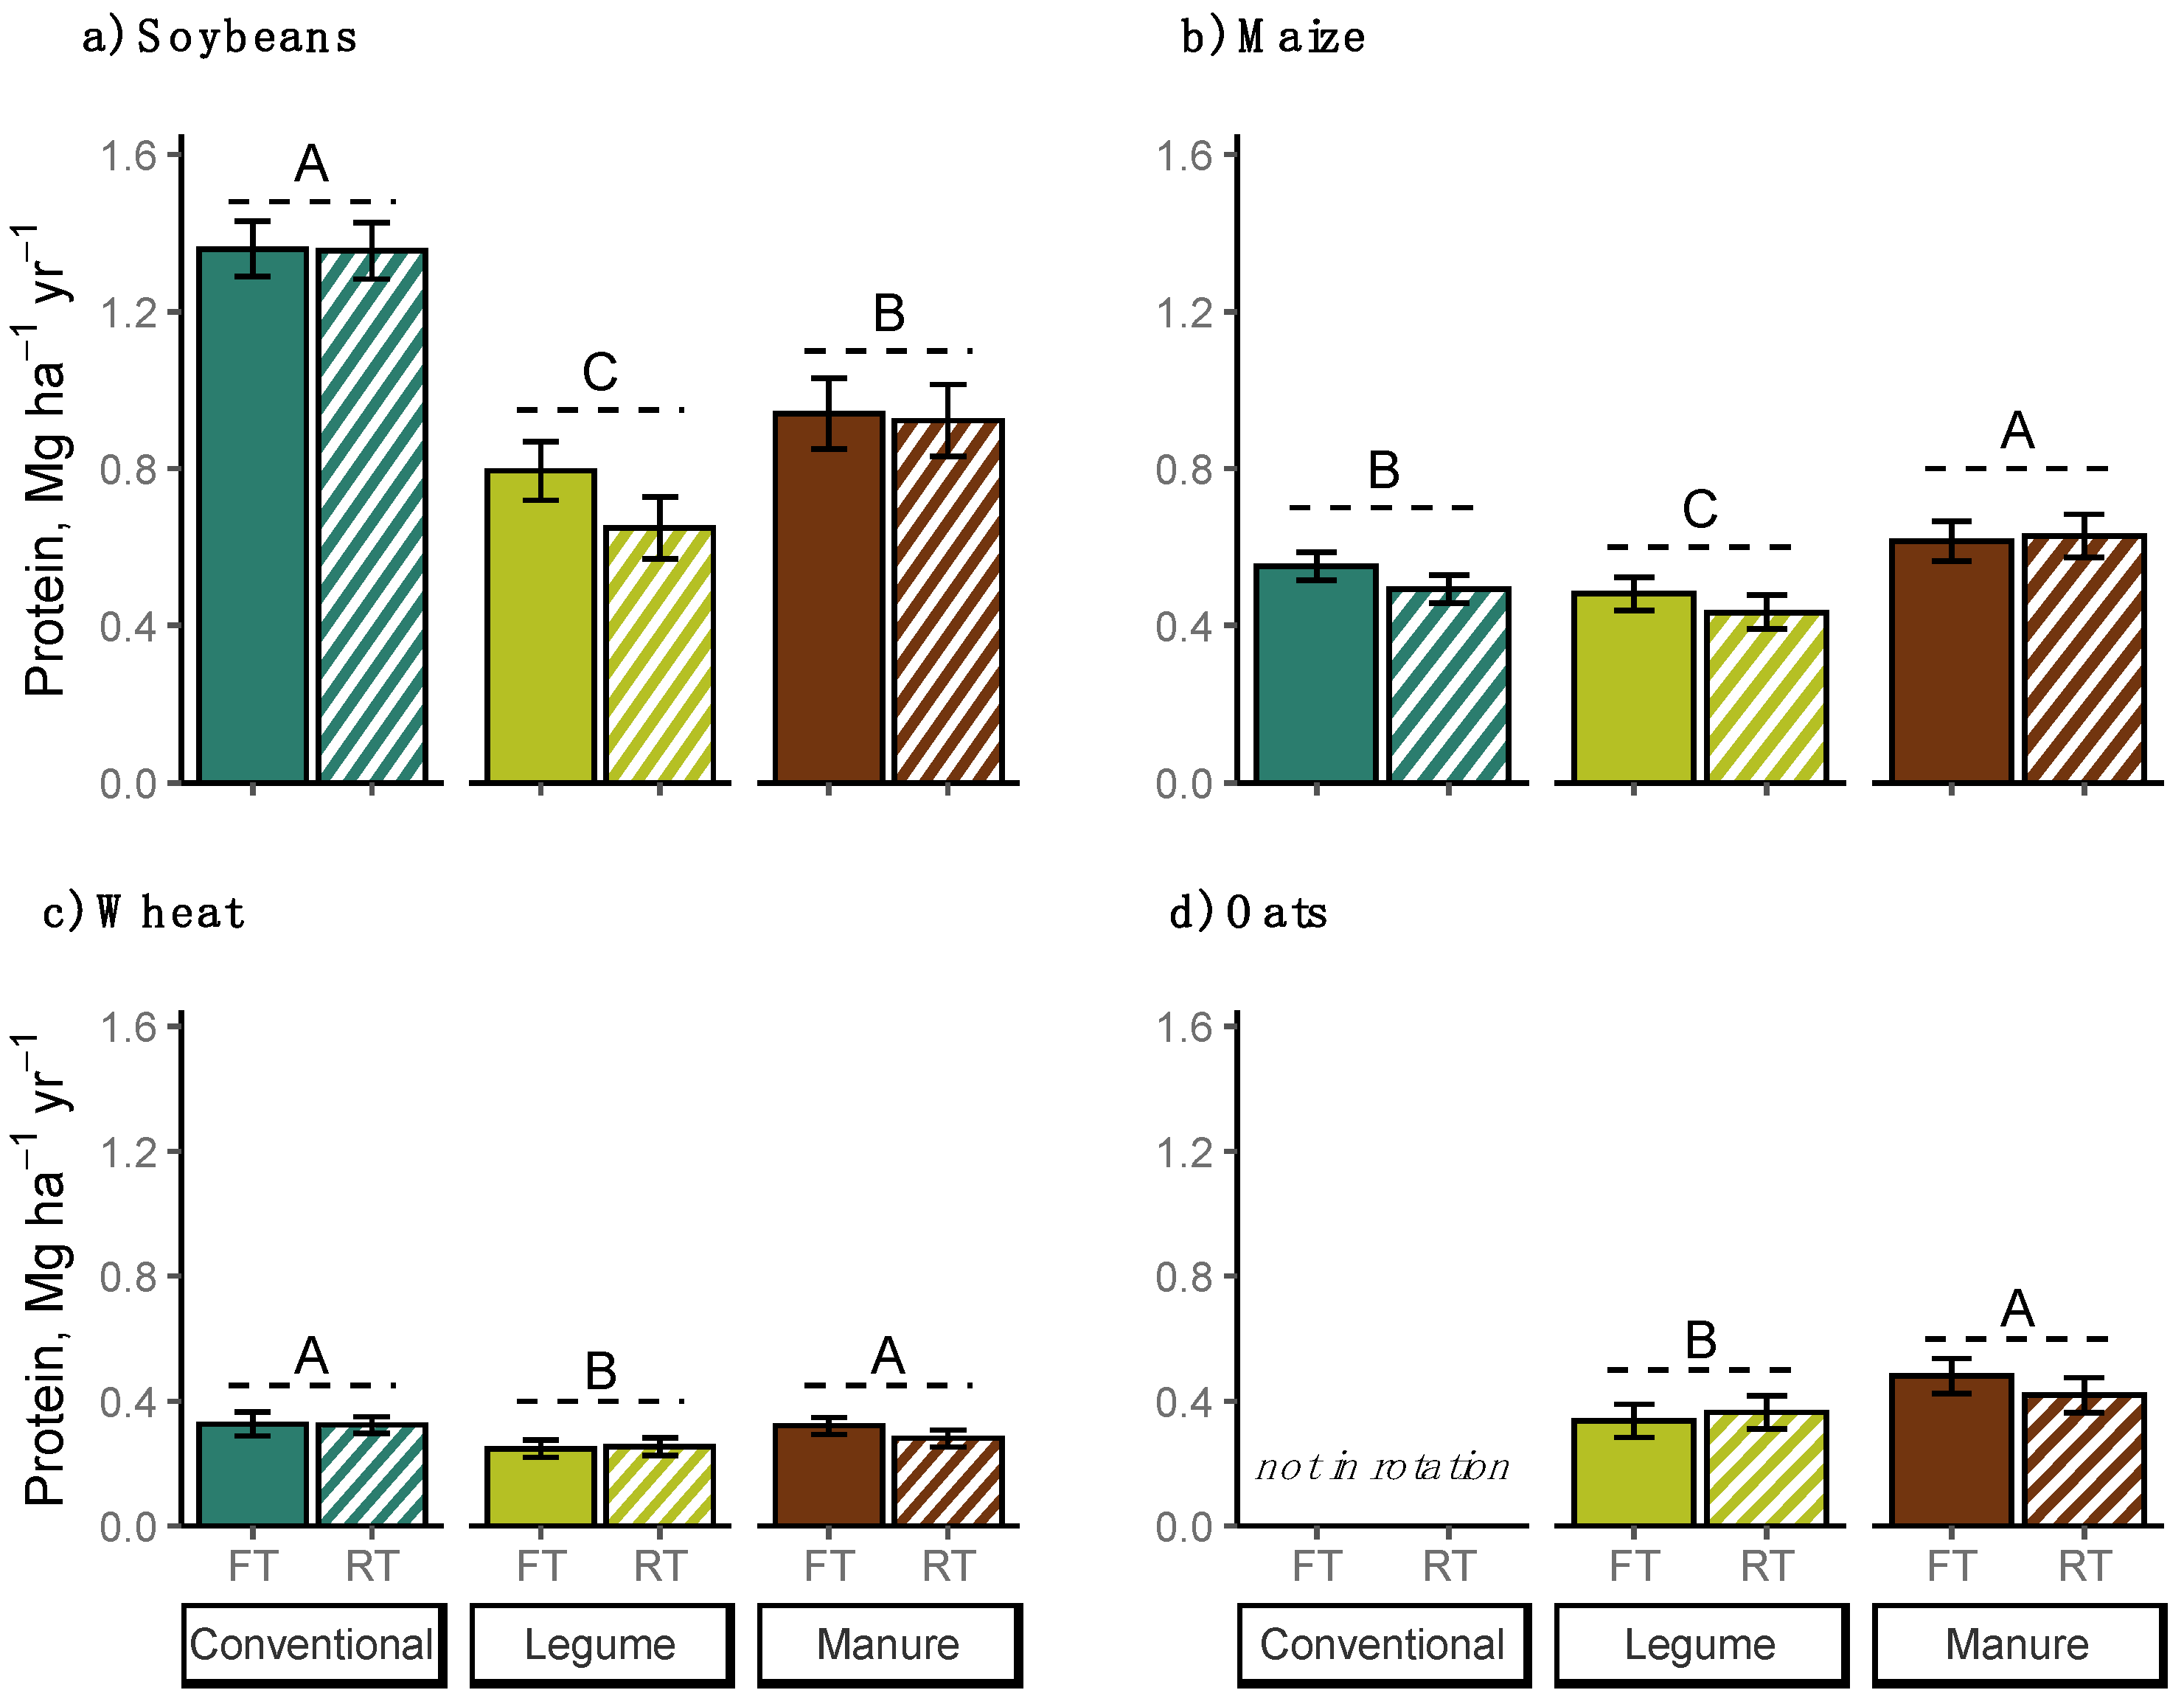
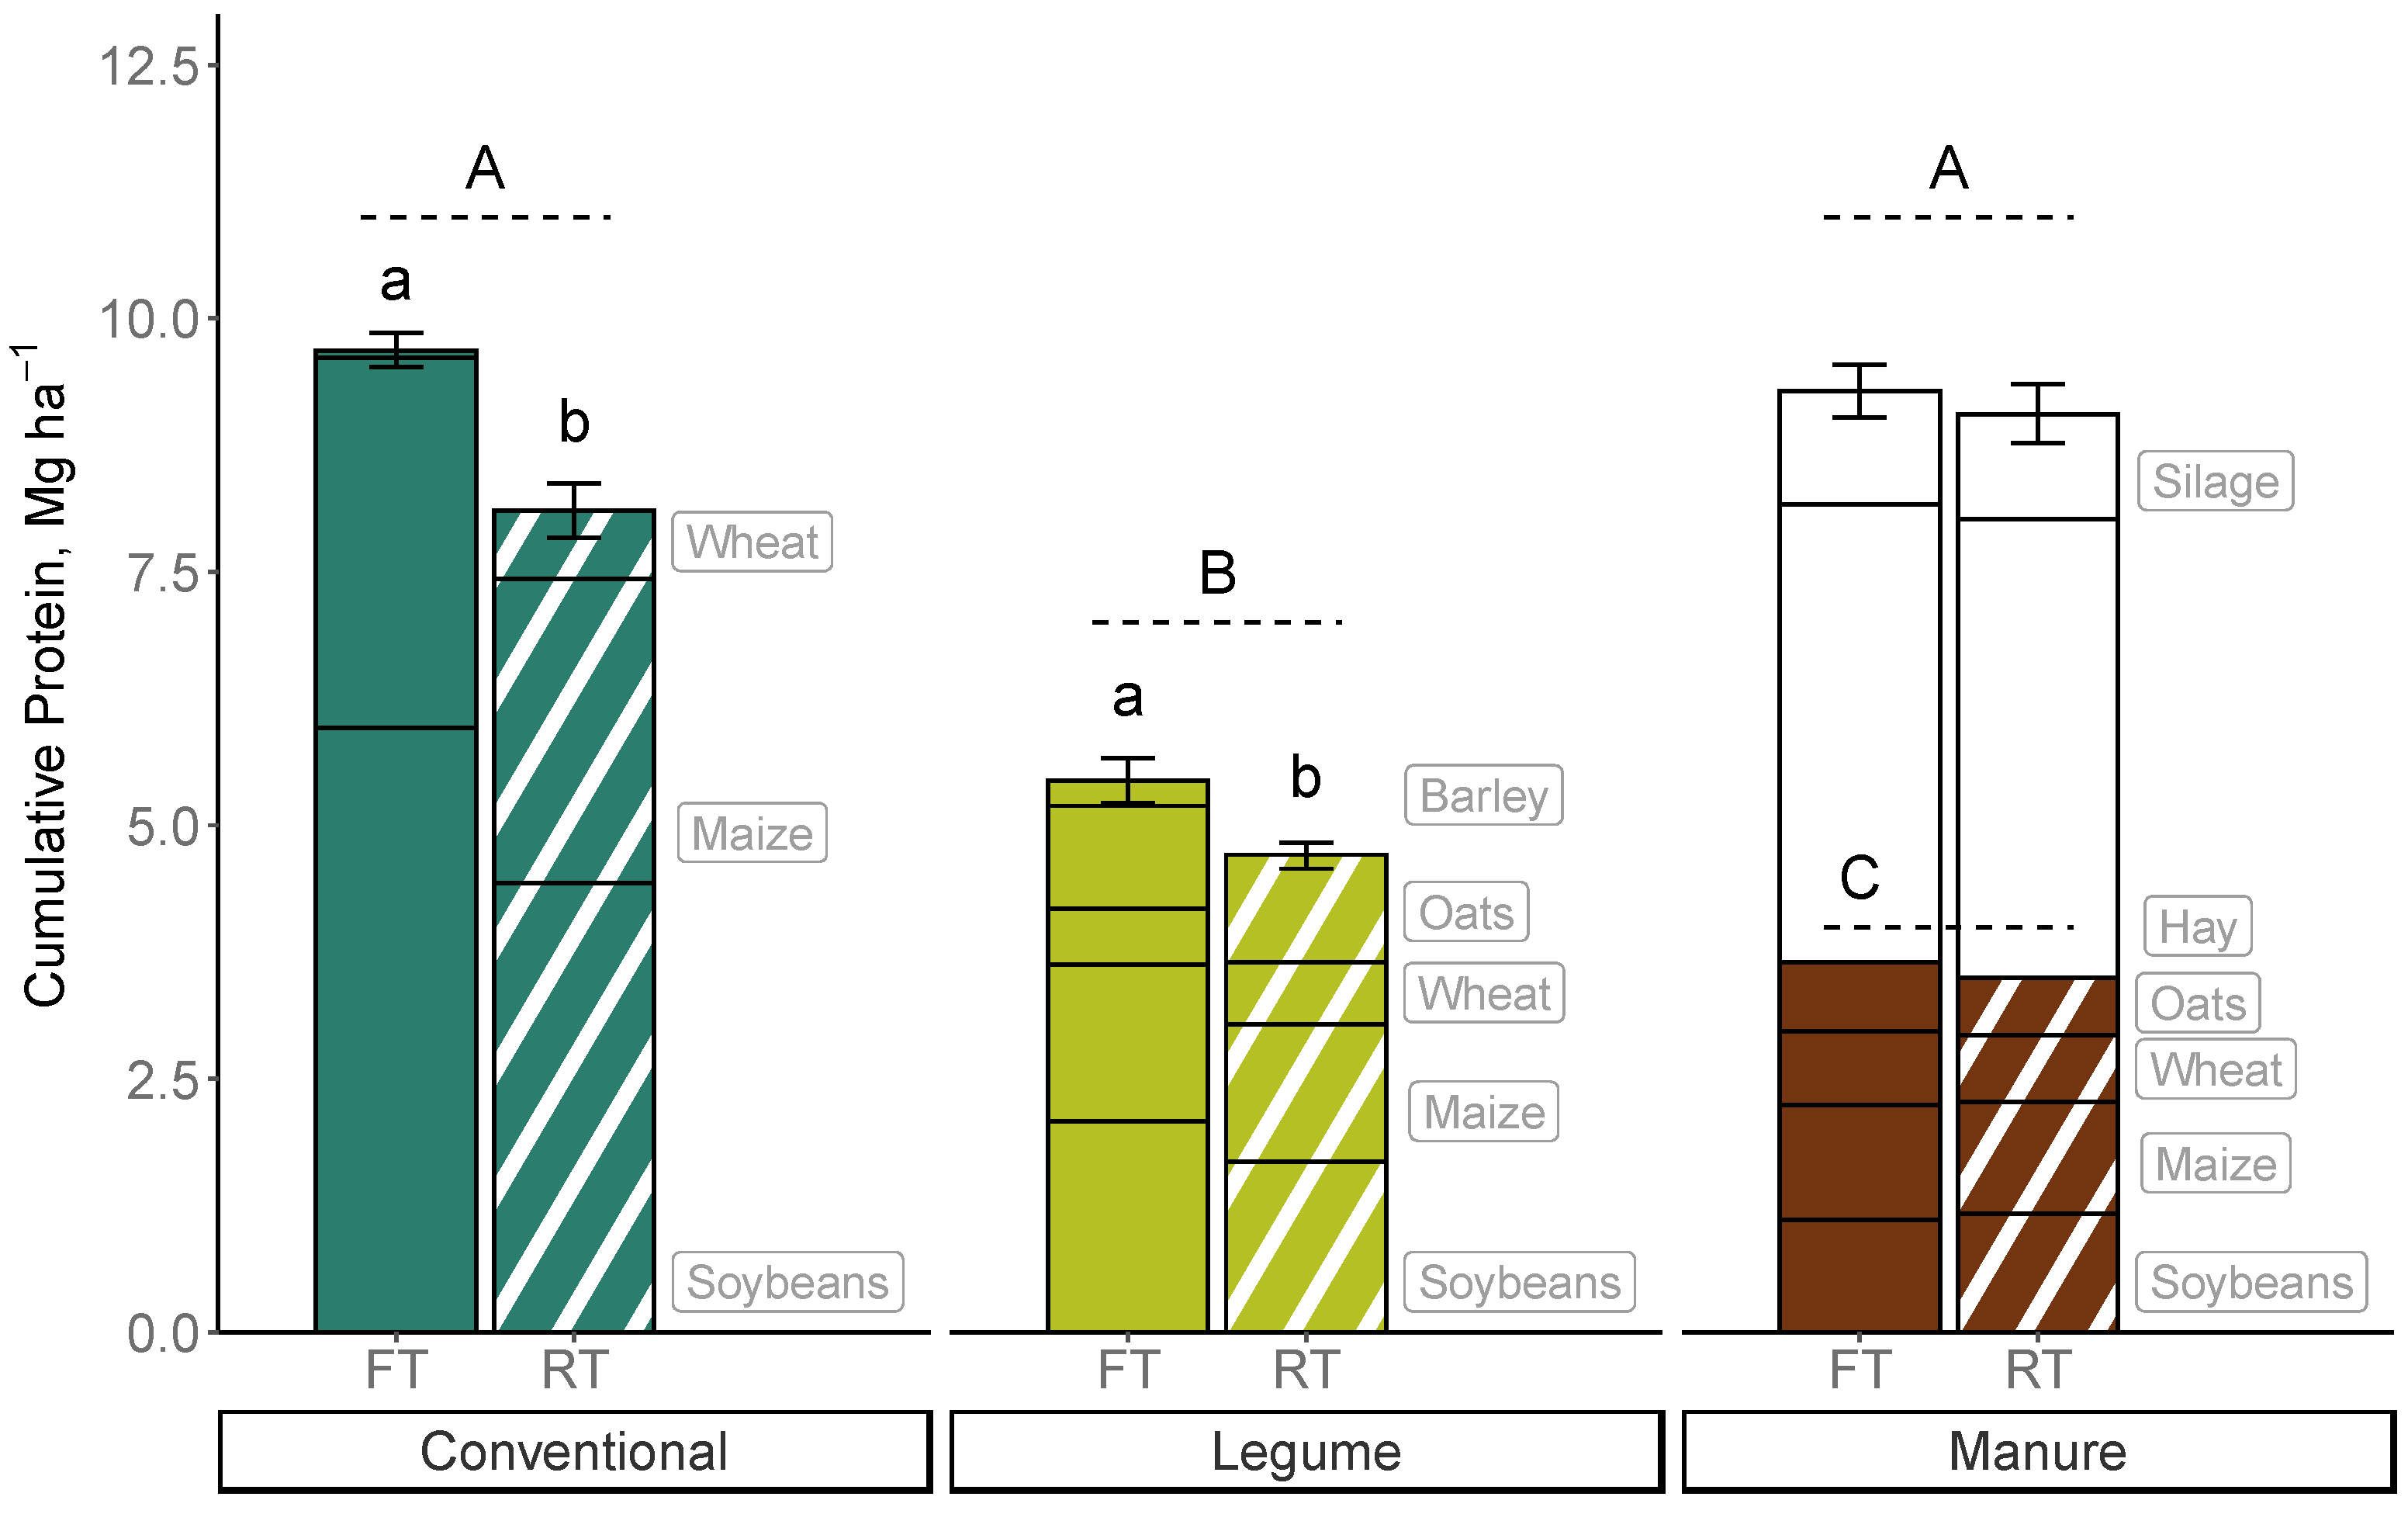
3.5. Average Annual and Cumulative Protein Production

Average annual protein production (% protein × annual grain yield, Mg ha−1 year−1) for soybeans, maize, wheat, and oats did not differ between tillage treatments but did largely follow the same cropping-system trends as crop yields (Figure 1). For all four crops, annual protein production was significantly lower in the LEG system compared to the CNV and MNR systems. Wheat and maize grown in the CNV and MNR systems produced similar amounts of protein, while CNV soybeans produced more protein per hectare than MNR soybeans.
Cumulative protein production (sum of average annual protein production from 2008–2013 and 2016–2020) differed across cropping systems and between the CNV tillage treatments (Figure 2). Cumulative protein from grain was significantly lower in organic systems; compared to the CNV system, cumulative protein from grain was 43% lower in the LEG system and 60% lower in the MNR system. Although the MNR system produced the least amount of protein from grain, forages provided 1.6× the amount of protein provided by grain in the MNR system, so overall protein production (grain + forages) was similar between the MNR and CNV systems (Figure 2). Cumulative protein production in the MNR system did not differ between tillage treatments (± forages), but the RT-CNV and RT-LEG treatments produced significantly less (−16% and −13%) cumulative protein than their FT counterparts.

4. Discussion

As hypothesized, reducing tillage did not reduce crop quality in the conventional grain system (CNV) nor the manure-based grain + forages system (MNR). Contrary to our hypothesis, reducing tillage also did not reduce grain quality in the low-input organic grain system (LEG). Although the LEG system consistently had lower crop yields, LEG crops were often of similar or higher quality as crops from the other two systems. Grain quality did differ across the three cropping systems, but the magnitude and direction of those differences were crop specific and did not always decrease under lower N-availability as we had hypothesized.
Of the four grain crops grown in the FST, maize may be particularly sensitive to changes in N availability as it requires the highest N inputs [90]. As N inputs were significantly higher for maize in the RT-CNV treatment compared to the FT-CNV treatment (additional N provided by vetch that was planted once or twice in the RT-CNV subplots between 2009 and 2013) we would have expected to see higher maize yield and quality in the RT treatment. Maize yields, however, were 11% lower in the RT-CNV treatment compared to the FT-CNV, and maize quality did not differ between the FT-CNV and RT-CNV treatments. Maize yields under conventional no-till production are often lower than full-till production [15], and the additional N from vetch may not have been substantial enough to counteract the other factors that often limit maize productivity in no-till systems (such as lower soil temperatures at planting and increased weed competition) [91]. In addition to continued tillage in cultivation in the organic RT rotations, robust cover-crop mulches may have helped maintain maize yields in the organic RT treatments. Additionally, similar to some previous findings [92], maize quality was not significantly lower in the RT treatments and appears to be dictated more by large differences in total N inputs and a quality–quantity trade-off.
Unlike for the other three crops in this study, maize received N inputs in all three systems (Table 1) and differences in the type and quantity of N inputs appear to have affected both maize yield and maize quality. Vetch cover crops were used as a green manure to provide N for maize in both the LEG and MNR systems, but vetch tended to perform better in the MNR system; at termination, vetch above-ground biomass had the potential to provide 22% more N in the MNR system compared to the LEG system. Lower N availability in the LEG system likely contributed to lower yields, protein content, and fat content of maize grown in the LEG system compared to the MNR system. Other system characteristics, including manure inputs earlier in the crop rotation, also likely contributed to the better performance of maize in the MNR system. Although CNV maize also received more N inputs than LEG maize, protein concentrations were lower in CNV maize compared to LEG maize. Despite higher N inputs, the higher denitrification and leaching rates of inorganic N [93] may have decreased N availability in the CNV system, which could have limited N uptake and protein production by CNV maize. As maize yields were significantly higher in the CNV system; however, lower protein concentrations more likely reflect a nutrient dilution effect at high crop yields. Conventional crop breeding has largely focused on increasing grain yields without considering grain quality, so most high-yielding conventional varieties tend to increase carbohydrate production without corresponding increases in protein or fat production [94]. This would explain why energy densities and average annual protein production was similar across the four CNV and MNR treatments despite different protein levels and crop yields. A dilution effect could also explain the lower Mg concentration in CNV maize compared to the MNR system.
Unlike maize, wheat was planted with full tillage in the RT-LEG and RT-MNR treatments, so any effect of reducing tillage on wheat yields or quality would likely be a legacy effect from previously no-till planted maize or soybeans. Reducing tillage had no effect on wheat quality, even in the CNV system where it was no-till planted in the RT-CNV treatment. This result is consistent with many of the nutritional studies comparing full-till and reduced-till wheat [35,36,41,42,43,44,45,47,50,60,61,67,70], but it appears just as likely for reducing tillage to have a significant negative effect [34,37,39,40,53,54,59,65,68,71] or positive effect [46,52,56,58] on wheat quality (Table 1), suggesting some other factor such as wheat variety or climate has a strong influence on how wheat responds to reduced tillage practices.
Wheat quality had a clearer response to N inputs, as the fertilized CNV wheat had significantly higher protein levels than the unfertilized wheat grown in the two organic systems. The CNV wheat, however, had lower starch and higher ash content compared to the organic wheat, which led the CNV wheat to have significantly lower energy densities The magnitude of this difference was very low, <1%, and wheat typically comprises a smaller proportion of livestock diet compared to corn, soy, and other forages, so it is unlikely that livestock growth or lactation would be noticeably lower when fed CNV wheat. Higher protein, higher ash, and lower carbohydrate contents may indicate differences in nutrient uptake or resource partitioning in wheat kernels [95], with CNV wheat potentially partitioning more resources to protein- and mineral-rich germ and/or aleurone tissue as a response to higher N availability [96]. However, as quality measures were relatively consistent between LEG and MNR wheat, differences in kernel composition may have mostly resulted from cultivar characteristics [94,97] rather than management practices. Cultivar differences in tissue partitioning may also account for the higher mineral concentrations (Mg, P, and S) in the CNV wheat. Lower mineral concentrations in MNR wheat compared to the LEG wheat. However, most likely resulted from a dilution effect due to the higher wheat yields in the MNR system compared to the LEG. A dilution effect could similarly explain why annual protein production was comparable for wheat grown in the RT-MNR and FT-MNR treatments, despite significantly lower wheat yields in the RT-MNR treatment. As wheat in the organic RT treatments was planted following full tillage, lower wheat yields in the RT treatment likely resulted from some legacy effect of no-till planting maize or soybeans. It is possible that no-till planting preceding crops led to changes in nutrient availability or weed pressure in the MNR system, which may have affected subsequent wheat yields. The specific mechanisms behind this legacy effect are unknown, however, and warrant further study if growers continue to adopt rotational no-till strategies.
Like wheat, oats were planted with full tillage in the RT-LEG and RT-MNR treatments, so we expected oats to have a stronger response to cropping system than reducing tillage. As expected, oats did not respond to reducing tillage in either of the organic systems, but oat quality was also largely consistent between the LEG and MNR systems, consistent with the analyses performed on oats harvested from the FST in 2014 [74]. Despite applying over 200 kg N ha−1 before planting oats in the MNR system, the only significant quality difference between oats in the LEG and MNR systems was 5.4% higher K levels in LEG oats. Although N inputs appear to have increased oat yields in the MNR system, they did not contribute to higher oat quality.
Although soybean quality was assessed based on fewer indicators than the other grains, soybeans quality did differ between the CNV and organic systems. Protein levels were significantly lower in the CNV soybeans compared to the LEG soybeans, likely driven by a dilution effect, as soybean yields were nearly 2× higher in the CNV system. As soybeans from all three systems had similar energy densities, it is likely that CNV soybeans had higher starch or fat content which compensated for lower protein content. Lower yields in the LEG system could have been driven by lower nutrient availability; however, as soybeans can house N-fixing rhizobacteria, it is less likely that soybeans were N-limited in the LEG system [98]. More likely, lower soybeans yield in the LEG system were driven by other nutrient limitation (e.g., phosphorus) or by competition from weeds [99]. Like with maize, soybeans were no-till planted in all the RT treatments, so we expected that soybean quality would differ between tillage treatments; system-level factors (overall nutrient availability, crop rotations, soybean varieties, etc.), however, appear to overshadow any yield or quality response to no-till planting soybeans in any of the three systems.
Considering all the different management practices employed across the three cropping systems and between tillage treatments, crop yields and the frequency of specific crops are greater drivers of overall system quality than tillage practices or conventional versus organic management. Although quality measures did significantly differ across the three systems, differences in crop frequency and crop yields had a much greater impact on long-term cumulative protein production. Regarding protein content in grain, the greatest difference was between CNV and MNR maize, with CNV maize having 11% lower protein concentrations than MNR maize. With similar maize yields in the CNV and MNR systems (Table 2), protein production per hectare was significantly higher in maize grown in the MNR system compared to the CNV system (Figure 1). However, cumulative maize protein production was 3× higher in the CNV system because maize was planted 3–4× more often than in the MNR system (Figure 1).
Between tillage treatments, higher cumulative protein production in the FT-CNV system was mostly driven by differences in crop rotations between the FT-CNV and RT-CNV treatments. In the years assessed (2008–2013, 2016–2020), wheat was planted 1–3 times in each RT-CNV plot, but only one time in one of the FT-CNV subplots; substituting wheat for just one year of high-protein soybeans could decrease cumulative protein production by over 1.0 Mg ha−1, more than 10% of total protein production across the 11 years assessed. This crop-rotation effect was even more noticeable in the MNR system, which supported significantly higher grain yields than the LEG system yet produced 30% less cumulative protein from grains. Forage crops more than compensate for this difference, and although people do not consume forages directly, livestock that consume more forages tend to produce higher quality dairy products [100].
As organically-raised livestock are usually fed more forages than conventionally-raised livestock, organic dairy tends to be of higher nutritional quality (protein, omega-3 fatty acids, and other metrics) than conventional dairy [100]. Even for conventional dairy, grains generally comprise less than 20% of dairy cattle feed and may be completely absent from diets depending on the time of year, feed availability, and the type of dairy enterprise [101]. Although crude protein, starch content, and ruminal passage rates do affect the digestibility of grains [101], the grain produced within all six FST treatments were of similar enough and high enough nutritional quality to support productive dairy operations. Differences in farming systems and tillage treatments would more likely affect the profitability of a dairy operation by influencing grain yields (i.e., the lower grain yields in the LEG system) and crop diversity (i.e., inclusion of forages in the MNR system) rather than by causing some dramatic shift in grain quality. Therefore, while a mixed grain/forage cropping system may not produce higher yields or quality of specific grains, the choice to include high-quality forages in the crop rotation could play a greater role in improving the overall nutritive value of organic-based diets for both livestock and people.

5. Conclusions

Our results suggest that reducing tillage did not significantly affect nutrient quality of grains produced in either organic or conventional systems, although these results may be unique to the climate and farming conditions where this study took place. More broadly, this study highlights the importance of exploring grain quality in response to specific farming practices under different management systems. By comparing two organic systems within one field experiment, this study clearly demonstrate how organic farming systems are not all created equal, as changes to fertility inputs, crop rotations, and crop diversity can significantly influence grain quality and overall protein productivity under organic management. Although organic certification does require farmers to implement specific management practices, not all organic farmers adopt the same suite of practices under the same conditions [27,102]. Rather than making broad comparisons between organic and conventional management, future research should focus on how specific conservation-based practices can improve grain quality; such studies would help conventional and organic farmers select the best practices to optimize long-term productivity and sustainability.

Supplementary Materials

The following are available online at https://www.mdpi.com/article/10.3390/su14020631/s1, Figure S1: Crop rotations for each entry point in the FST from 2008–2013; Figure S2: Cop rotations for each entry point in the FST from 2014–2020; Table S1: Crop varieties used in the FST from 2008–2020; Table S2: Statistical summaries for additional measures of grain quality; Table S3: Estimated marginal mean comparisons for additional measures of grain quality.

Author Contributions

Conceptualization, E.C.O., A.S. and Y.R.; Data curation, K.A.P.; Formal analysis, K.A.P. and B.J.H.; Funding acquisition, E.C.O., A.S. and Y.R.; Investigation, K.A.P., E.C.O., G.Z. and Y.R.; Project administration, E.C.O., A.S. and Y.R.; Visualization, K.A.P.; Writing—original draft, K.A.P., A.S. and Y.R.; Writing—review and editing, K.A.P., A.S., Y.R., B.J.H. and G.Z. All authors have read and agreed to the published version of the manuscript.

Funding

This material is based upon work supported by the William Penn Foundation under Grant Award Number 188-17. Additional funding was provided by the Towards Sustainability Foundation the Blooming Prairie Foundation, and the Rockefeller Foundation. The opinions expressed in this publication are those of the author(s) and do not necessarily reflect the views of the William Penn Foundation, Towards Sustainability Foundation, Blooming Prairie Foundation, or Rockefeller Foundation.

Data Availability Statement

The datasets analyzed in this study are available upon agreement with the corresponding author.

Acknowledgments

We would like to acknowledge the farm operations team, researchers, technicians, and interns that have kept FST running for the past 40 years, including farm managers: Ross Duffield, Daniel Kemper, Rick Carr, Jeff Moyer; research staff: Rita Seidel, Alex Dutt, Jessica Lang, Anne Benson; and research interns. We thank Reza Afshar for his insights and feedback while drafting this manuscript.

Conflicts of Interest

The authors declare no conflict of interest. The funders had no role in the design of the study; in the collection, analyses, or interpretation of data; in the writing of the manuscript, or in the decision to publish the results.

Appendix A

Table A1. Summary of a Web of Science (© 2021, Clarivate Analytics) search using the terms “tillage” + “grain” + “quality”. The original search generated 1375 papers, which were filtered down to 38 studies based on the criteria that studies (A) included a side-by-side comparisons of reduced-till and conventional tillage and (B) grain quality was measured as protein content and/or mineral content. Overall effect of reducing tillage on grain quality and yield are denoted as: negative (−), positive (+), or no effect (.). CT = conventional tillage; RT = reduced till; NT = no-till; SS = subsoiling; VT = vertical tillage; rNT = rotational no-till; MT = minimum till (i.e., reducing tillage frequency). n.a. = no yield measurements.
CropTillage TreatmentsQuality
Variable(s)
Quality ResponseYield
Response
No. Harvest YearsCountryStudy
BarleyCT, RT, NTprotein, mineralsn.a.3PolandWoźniak et al., 2014a
MaizeCT, RT (chisel), NTprotein8RomaniaCociu and Alionte, 2017
CT, RT, NTprotein3SerbiaSimić et al., 2020
CT, RTprotein.n.a.2PakistanWasaya et al., 2018
RapeseedCT, RT, NTprotein.n.a.1IranVanda et al., 2009
RiceCT, RTprotein..2Turkey Çay, 2018
SoybeansCT, RT (chisel), NTprotein8RomaniaCociu and Alionte, 2017
CT, NTprotein, minerals..2USAHoux III et al., 2014
TriticaleCT, RT (cultivate)mineralsn.a.3PolandJaskiewicz 2019
CT, RTprotein+.2ItalyLestingi et al., 2010
CT, RT, NTprotein3PolandWoźniak 2016
CT, RT, NTprotein+3PolandWoźniak and Soroka 2014
WheatCT, RT, NTprotein.18ItalyAmato et al., 2013
CT, RT, NTprotein.3PolandBuczek et al., 2021
CT vs. RT (SS)protein..6ItalyCampiglia et al., 2015
CT, RT, NTprotein.6USACarr et al., 2008
CT, RT (chisel), NTprotein8RomaniaCociu and Alionte, 2017
CT, NTprotein+3ItalyDevita et al., 2007
rotary till, rotary till 2×, NTprotein..2ChinaDing et al., 2020
CT, RT (MT), NTprotein..2AlgeriaDjouadi et al., 2021
CT, RT (mulch till), NTminerals.n.a.1SerbiaDolijanović et al., 2019
CT, RTprotein.5CanadaFernandez et al., 2019
CT, NTprotein..3PolandGawęda and Haliniarz, 2021
CT, NTprotein+2RomaniaGrigoras et al., 2012
CT, RT (disking)protein..3TurkeyGürsoy et al., 2010
CT, RT (disking)protein..4RussiaKorostylev et al., 2019
CT, NTprotein, minerals+.1ChinaLi et al., 2020
CT, NTprotein.3, 6SpainLópez-Bellido et al., 1998; 2001
CT, RT (VT), NTprotein.1ArgentinaMiravalles et al., 2013
CT, NTprotein++2ItalyPagnani et al., 2019
CT, RT (disking)protein+.2PolandSulek et al., 2019
CT, NTprotein1ChinaSun et al., 2015
CT, RT, NTprotein..4TurkeyTaner et al., 2015
CT (rotary-till), RT (rNT)protein.+7ChinaTang et al., 2013
CT, RT (cultivate), NTprotein3PolandWoźniak and Rachoń, 2020
CT, RT (cultivate), NTminerals..3PolandWoźniak and Stępniowska, 2017
CT, RT (cultivate), NTprotein, minerals.1PolandWoźniak et al., 2014b
CT, RT (cultivate), NTprotein.6PolandWoźniak et al., 2015
CT, RT, NTprotein2IranYousefian et al., 2021

Appendix B

Additional Methods and Results for Estimated Above-Ground Nitogen Inputs

Above-ground nitrogen (N) inputs were estimated from inorganic fertilizers, composted manure, and terminated hairy vetch cover crops. N inputs from inorganic fertilizers were calculated from records of at-planting and side-dress applications to CNV maize and wheat. N inputs from composted manure were estimated based on manure application rates and total N analysis performed by the Agricultural Analytical Services Laboratory at the Pennsylvania State University (University Park, PA, USA). Above-ground N inputs from vetch cover crops were estimate based on aboveground vetch biomass collected immediately before: (1) plowing in the FT systems; (2) herbicide burn-down in the RT-CNV system; or (3) rolling/crimping in the RT organic systems. Following biomass collection (three 0.25 m2 quadrats per plot), vetch samples were dried at 48 °C for a minimum of three days then analyzed for total N content by dry combustion [83]. Total N in vetch samples was analyzed following the same combustion method in all years, but the analysis was performed by three different laboratories: from 2008–2010, N analysis was performed by the Agricultural Analytical Services Laboratory at the Pennsylvania State University (University Park, PA, USA); from 2011–2013, the Rodale Institute (Kutztown, PA, USA); and from 2016–2020, by the Cornell Nutrient Analysis Laboratory (Ithaca, NY, USA). We used non-parametric Kruskal–Wallis tests (krustal.test) followed by Dunn tests for post-hoc mean comparisons (dunnTest from the “FSA” package [103]) to assess differences in N inputs for each crop across the cropping systems and between tillage treatments.

References

  1. Doran, J.W. Soil health and global sustainability. In Soil Quality Is in the Hands of the Land Manager—Proceedings of an International Symposium—Advances in Soil Quality for Land Management: Science, Practice and Policy; MacEwan, R.J., Carter, M.R., Eds.; Centre for Environmental Management, University of Ballarat: Ballarat, Australia, 1996; pp. 46–52. ISBN 978-0-908026-77-7. [Google Scholar]
  2. Ramankutty, N.; Mehrabi, Z.; Waha, K.; Jarvis, L.; Kremen, C.; Herrero, M.; Rieseberg, L.H. Trends in Global Agricultural Land Use: Implications for Environmental Health and Food Security. Annu. Rev. Plant Biol. 2018, 69, 789–815. [Google Scholar] [CrossRef] [PubMed] [Green Version]
  3. Fine, A.K.; van Es, H.M.; Schindelbeck, R.R. Statistics, Scoring Functions, and Regional Analysis of a Comprehensive Soil Health Database. Soil Sci. Soc. Am. J. 2017, 81, 589–601. [Google Scholar] [CrossRef]
  4. Schipanski, M.E.; MacDonald, G.K.; Rosenzweig, S.; Chappell, M.J.; Bennett, E.M.; Kerr, R.B.; Blesh, J.; Crews, T.; Drinkwater, L.; Lundgren, J.G.; et al. Realizing Resilient Food Systems. BioScience 2016, 66, 600–610. [Google Scholar] [CrossRef] [Green Version]
  5. Palm, C.; Blanco-Canqui, H.; DeClerck, F.; Gatere, L.; Grace, P. Conservation Agriculture and Ecosystem Services: An Overview. Agric. Ecosyst. Environ. 2014, 187, 87–105. [Google Scholar] [CrossRef] [Green Version]
  6. USDA NASS. 2017 Census of Agriculture: Pennsylvania State and County Data; Geographic Area Series; United States Department of Agriculture, National Agricultural Statistics Service: Washington, DC, USA, 2019; Volume 1. [Google Scholar]
  7. Mirsky, S.B.; Ryan, M.R.; Curran, W.S.; Teasdale, J.R.; Maul, J.; Spargo, J.T.; Moyer, J.; Grantham, A.M.; Weber, D.; Way, T.R.; et al. Conservation Tillage Issues: Cover Crop-Based Organic Rotational No-till Grain Production in the Mid-Atlantic Region, USA. Renew. Agric. Food Syst. 2012, 27, 31–40. [Google Scholar] [CrossRef] [Green Version]
  8. Ashford, D.L.; Reeves, D.W. Use of a Mechanical Roller-Crimper as an Alternative Kill Method for Cover Crops. Am. J. Altern. Agric. 2003, 18, 37–45. [Google Scholar] [CrossRef]
  9. Wallace, J.; Williams, A.; Liebert, J.; Ackroyd, V.; Vann, R.; Curran, W.; Keene, C.; VanGessel, M.; Ryan, M.; Mirsky, S. Cover Crop-Based, Organic Rotational No-till Corn and Soybean Production Systems in the Mid-Atlantic United States. Agriculture 2017, 7, 34. [Google Scholar] [CrossRef] [Green Version]
  10. Frasconi, C.; Martelloni, L.; Antichi, D.; Raffaelli, M.; Fontanelli, M.; Peruzzi, A.; Benincasa, P.; Tosti, G. Combining Roller Crimpers and Flaming for the Termination of Cover Crops in Herbicide-Free No-till Cropping Systems. PLoS ONE 2019, 14, e0211573. [Google Scholar] [CrossRef] [Green Version]
  11. Peters, T.J.; Borgen, R.M.; Lystad, A.L. Weed control using high volatage electricity. In 2020 Sugarbeet Research and Extension Reports; North Dakota State University Agriculture and Extension: Fargo, ND, USA, 2021; Volume 51, pp. 40–43. [Google Scholar]
  12. Nunes, M.R.; Karlen, D.L.; Moorman, T.B. Tillage Intensity Effects on Soil Structure Indicators—A US Meta-Analysis. Sustainability 2020, 12, 2071. [Google Scholar] [CrossRef] [Green Version]
  13. Nunes, M.R.; Karlen, D.L.; Veum, K.S.; Moorman, T.B.; Cambardella, C.A. Biological Soil Health Indicators Respond to Tillage Intensity: A US Meta-Analysis. Geoderma 2020, 369, 114335. [Google Scholar] [CrossRef]
  14. Nunes, M.R.; Karlen, D.L.; Moorman, T.B.; Cambardella, C.A. How Does Tillage Intensity Affect Chemical Soil Health Indicators? A United States Meta-analysis. Agrosyst. Geosci. Environ. 2020, 3, 3. [Google Scholar] [CrossRef]
  15. Pittelkow, C.M.; Linquist, B.A.; Lundy, M.E.; Liang, X.; van Groenigen, K.J.; Lee, J.; van Gestel, N.; Six, J.; Venterea, R.T.; van Kessel, C. When Does No-till Yield More? A Global Meta-Analysis. Field Crops Res. 2015, 183, 156–168. [Google Scholar] [CrossRef] [Green Version]
  16. Xiao, L.; Kuhn, N.J.; Zhao, R.; Cao, L. Net Effects of Conservation Agriculture Principles on Sustainable Land Use: A Synthesis. Glob. Chang. Biol. 2021, 27, 6321–6330. [Google Scholar] [CrossRef]
  17. Rice, C.W.; Smith, M.S.; Blevins, R.L. Soil Nitrogen Availability after Long-Term Continuous No-Tillage and Conventional Tillage Corn Production. Soil Sci. Soc. Am. J. 1986, 50, 1206–1210. [Google Scholar] [CrossRef]
  18. Dou, Z.; Fox, R.H.; Toth, J.D. Tillage Effect on Seasonal Nitrogen Availability in Corn Supplied with Legume Green Manures. Plant Soil 1994, 162, 203–210. [Google Scholar] [CrossRef]
  19. Salinas-Garcia, J.R.; Hons, F.M.; Matocha, J.E.; Zuberer, D.A. Soil Carbon and Nitrogen Dynamics as Affected by Long-Term Tillage and Nitrogen Fertilization. Biol. Fertil. Soils 1997, 25, 182–188. [Google Scholar] [CrossRef]
  20. Amado, T.J.C.; Fernandez, S.B.; Mielniczuk, J. Nitrogen Availability as Affected by Ten Years of Cover Crop and Tillage Systems in Southern Brazil. J. Soil Water Conserv. 1998, 53, 268. [Google Scholar]
  21. Malhi, S.S.; Lemke, R.; Wang, Z.H.; Chhabra, B.S. Tillage, Nitrogen and Crop Residue Effects on Crop Yield, Nutrient Uptake, Soil Quality, and Greenhouse Gas Emissions. Soil Tillage Res. 2006, 90, 171–183. [Google Scholar] [CrossRef]
  22. Crozier, C.R.; Naderman, G.C.; Tucker, M.R.; Sugg, R.E. Nutrient and PH Stratification with Conventional and No-till Management. Commun. Soil Sci. Plant Anal. 1999, 30, 65–74. [Google Scholar] [CrossRef]
  23. Badalíková, B. Influence of soil tillage on soil compaction. In Soil Engineering; Springer: Berlin/Heidelberg, Germany, 2010; pp. 19–30. [Google Scholar]
  24. Gomiero, T.; Pimentel, D.; Paoletti, M.G. Environmental Impact of Different Agricultural Management Practices: Conventional vs. Organic Agriculture. Crit. Rev. Plant Sci. 2011, 30, 95–124. [Google Scholar] [CrossRef]
  25. Seufert, V.; Ramankutty, N.; Foley, J.A. Comparing the Yields of Organic and Conventional Agriculture. Nature 2012, 485, 229–232. [Google Scholar] [CrossRef]
  26. Benaragama, D.; Shirtliffe, S.J.; Johnson, E.N.; Duddu, H.S.N.; Syrovy, L.D. Does Yield Loss Due to Weed Competition Differ between Organic and Conventional Cropping Systems? Weed Res. 2016, 56, 274–283. [Google Scholar] [CrossRef]
  27. Smith-Spangler, C.; Brandeau, M.L.; Hunter, G.E.; Bavinger, J.C.; Pearson, M.; Eschbach, P.J.; Sundaram, V.; Liu, H.; Schirmer, P.; Stave, C.; et al. Are Organic Foods Safer or Healthier than Conventional Alternatives? A Systematic Review. Ann. Intern. Med. 2012, 157, 348–366. [Google Scholar] [CrossRef] [PubMed] [Green Version]
  28. Reeve, J.R.; Hoagland, L.A.; Villalba, J.J.; Carr, P.M.; Atucha, A.; Cambardella, C.; Davis, D.R.; Delate, K. Organic Farming, Soil Health, and Food Quality: Considering Possible Links. In Advances in Agronomy; Elsevier: Amsterdam, The Netherlands, 2016; Volume 137, pp. 319–367. ISBN 978-0-12-804692-0. [Google Scholar]
  29. Mie, A.; Andersen, H.R.; Gunnarsson, S.; Kahl, J.; Kesse-Guyot, E.; Rembiałkowska, E.; Quaglio, G.; Grandjean, P. Human Health Implications of Organic Food and Organic Agriculture: A Comprehensive Review. Environ. Health 2017, 16, 111. [Google Scholar] [CrossRef] [PubMed] [Green Version]
  30. House, G.J.; Parmelee, R.W. Comparison of Soil Arthropods and Earthworms from Conventional and No-Tillage Agroecosystems. Soil Tillage Res. 1985, 5, 351–360. [Google Scholar] [CrossRef]
  31. Hendrix, P.F.; Parmelee, R.W.; Crossley, D.A.; Coleman, D.C.; Odum, E.P.; Groffman, P.M. Detritus Food Webs in Conventional and No-Tillage Agroecosystems. BioScience 1986, 36, 374–380. [Google Scholar] [CrossRef]
  32. Werner, M.R.; Dindal, D.L. Effects of Conversion to Organic Agricultural Practices on Soil Biota. Am. J. Altern. Agric. 1990, 5, 24–32. [Google Scholar] [CrossRef]
  33. Lindsey-Robbins, J.; Vázquez-Ortega, A.; McCluney, K.; Pelini, S. Effects of Detritivores on Nutrient Dynamics and Corn Biomass in Mesocosms. Insects 2019, 10, 453. [Google Scholar] [CrossRef] [Green Version]
  34. Amato, G.; Ruisi, P.; Frenda, A.S.; Di Miceli, G.; Saia, S.; Plaia, A.; Giambalvo, D. Long-Term Tillage and Crop Sequence Effects on Wheat Grain Yield and Quality. Agron. J. 2013, 105, 1317–1327. [Google Scholar] [CrossRef]
  35. Buczek, J.; Migut, D.; Jańczak-Pieniążek, M. Effect of Soil Tillage Practice on Photosynthesis, Grain Yield and Quality of Hybrid Winter Wheat. Agriculture 2021, 11, 479. [Google Scholar] [CrossRef]
  36. Campiglia, E.; Mancinelli, R.; De Stefanis, E.; Pucciarmati, S.; Radicetti, E. The Long-Term Effects of Conventional and Organic Cropping Systems, Tillage Managements and Weather Conditions on Yield and Grain Quality of Durum Wheat (Triticum Durum Desf.) in the Mediterranean Environment of Central Italy. Field Crops Res. 2015, 176, 34–44. [Google Scholar] [CrossRef]
  37. Carr, P.M.; Martin, G.B.; Horsley, R.D. Wheat Grain Quality Response to Tillage and Rotation with Field Pea. Agron. J. 2008, 100, 1594–1599. [Google Scholar] [CrossRef] [Green Version]
  38. Çay, A. Impact of Different Tillage Management on Soil and Grain Quality in the Anatolian Paddy Rice Production. Plant Soil Environ. 2018, 64, 303–309. [Google Scholar] [CrossRef]
  39. Cociu, A.I.; Alionte, E. Effect of Different Tillage Systems on Grain Yield and Its Quality of Winter Wheat, Maize and Soybean under Different Weather Conditions. Rom. Agric. Res. 2017, 34, 59–67. [Google Scholar]
  40. Devita, P.; Dipaolo, E.; Fecondo, G.; Difonzo, N.; Pisante, M. No-Tillage and Conventional Tillage Effects on Durum Wheat Yield, Grain Quality and Soil Moisture Content in Southern Italy. Soil Tillage Res. 2007, 92, 69–78. [Google Scholar] [CrossRef]
  41. Ding, J.; Li, F.; Le, T.; Wu, P.; Zhu, M.; Li, C.; Zhu, X.; Guo, W. Nitrogen Management Strategies of Tillage and No-Tillage Wheat Following Rice in the Yangtze River Basin, China: Grain Yield, Grain Protein, Nitrogen Efficiency, and Economics. Agronomy 2020, 10, 155. [Google Scholar] [CrossRef] [Green Version]
  42. Djouadi, K.; Mekliche, A.; Dahmani, S.; Ladjiar, N.I.; Abid, Y.; Silarbi, Z.; Hamadache, A.; Pisante, M. Durum Wheat Yield and Grain Quality in Early Transition from Conventional to Conservation Tillage in Semi-Arid Mediterranean Conditions. Agriculture 2021, 11, 711. [Google Scholar] [CrossRef]
  43. Dolijanović, Ž.; Roljević Nikolić, S.; Kovačević, D.; Djurdjić, S.; Miodragović, R.; Jovanović Todorović, M.; Popović Djordjević, J. Mineral Profile of the Winter Wheat Grain: Effects of Soil Tillage Systems and Nitrogen Fertilization. Appl. Ecol. Environ. Res. 2019, 17, 11757–11771. [Google Scholar] [CrossRef]
  44. Fernandez, M.R.; Zentner, R.P.; Schellenberg, M.P.; Leeson, J.Y.; Aladenola, O.; McConkey, B.G.; St. Luce, M. Grain Yield and Quality of Organic Crops Grown under Reduced Tillage and Diversified Sequences. Agron. J. 2019, 111, 793–804. [Google Scholar] [CrossRef] [Green Version]
  45. Gawęda, D.; Haliniarz, M. Grain Yield and Quality of Winter Wheat Depending on Previous Crop and Tillage System. Agriculture 2021, 11, 133. [Google Scholar] [CrossRef]
  46. Grigoras, M.A.; Popescu, A.; Pamfil, D.; Has, I.; Gidea, M. Influence of No-Tillage Agriculture System and Fertilization on Wheat Yield and Grain Protein and Gluten Contents. J. Food Agric. Environ. 2012, 10, 532–539. [Google Scholar]
  47. Gürsoy, S.; Sessiz, A.; Malhi, S.S. Short-Term Effects of Tillage and Residue Management Following Cotton on Grain Yield and Quality of Wheat. Field Crops Res. 2010, 119, 260–268. [Google Scholar] [CrossRef]
  48. Houx III, J.H.; Wiebold, W.J.; Fritschi, F.B. Rotation and Tillage Affect Soybean Grain Composition, Yield, and Nutrient Removal. Field Crops Res. 2014, 164, 12–21. [Google Scholar] [CrossRef]
  49. Jaskiewicz, B. Chemical Composition of Winter Triticale Grain Depending on Type of Tillage in Crop Rotation. Eng. Rural. Dev. 2019, 24, 319–323. [Google Scholar]
  50. Korostylev, S.; Esaulko, A.; Ozheredova, A.; Gromova, N.; Grechishkina, Y. Influence of Tillage Methods on Optimization of Nutrition, Yield and Filling Grain of Winter Wheat on Leached Chernozem. Eng. Rural. Dev. 2019, 18, 379–385. [Google Scholar]
  51. Lestingi, A.; Bovera, F.; De Giorgio, D.; Ventrella, D.; Tateo, A. Effects of Tillage and Nitrogen Fertilisation on Triticale Grain Yield, Chemical Composition and Nutritive Value: Tillage and Nitrogen Effects on Characteristics of Triticale Grain. J. Sci. Food Agric. 2010, 90, 2440–2446. [Google Scholar] [CrossRef] [PubMed]
  52. Li, Y.; Hou, R.; Tao, F. Interactive Effects of Different Warming Levels and Tillage Managements on Winter Wheat Growth, Physiological Processes, Grain Yield and Quality in the North China Plain. Agric. Ecosyst. Environ. 2020, 295, 106923. [Google Scholar] [CrossRef]
  53. López-Bellido, L.; Fuentes, M.; Castillo, J.E.; López-Garrido, F.J. Effects of Tillage, Crop Rotation and Nitrogen Fertilization on Wheat-Grain Quality Grown under Rainfed Mediterranean Conditions. Field Crops Res. 1998, 57, 265–276. [Google Scholar] [CrossRef]
  54. López-Bellido, L.; López-Bellido, R.J.; Castillo, J.E.; López-Bellido, F.J. Effects of Long-Term Tillage, Crop Rotation and Nitrogen Fertilization on Bread-Making Quality of Hard Red Spring Wheat. Field Crops Res. 2001, 72, 197–210. [Google Scholar] [CrossRef]
  55. Miravalles, M.; Fioretti, M.; Mirassón, H.; Faraldo, M.; Möck, L.; Brevedan, R. Efecto del sistema de labranza sobre el rendimiento y la calidad del grano de trigo pan en la zona semiárida central templada de La Pampa. Phyton-Int. J. Exp. Bot. 2013, 82, 263–273. [Google Scholar]
  56. Pagnani, G.; Galieni, A.; D’Egidio, S.; Visioli, G.; Stagnari, F.; Pisante, M. Effect of Soil Tillage and Crop Sequence on Grain Yield and Quality of Durum Wheat in Mediterranean Areas. Agronomy 2019, 9, 488. [Google Scholar] [CrossRef] [Green Version]
  57. Simić, M.; Dragičević, V.; Mladenović Drinić, S.; Vukadinović, J.; Kresović, B.; Tabaković, M.; Brankov, M. The Contribution of Soil Tillage and Nitrogen Rate to the Quality of Maize Grain. Agronomy 2020, 10, 976. [Google Scholar] [CrossRef]
  58. Sulek, A.; Wyzinska, M.; Cacak-Pietrzak, G. Impact of Tillage on Yield and Quality Traits of Grains of Spring Wheat Cultivars. Eng. Rural. Dev. 2019, 18, 600–606. [Google Scholar]
  59. Sun, M.; Deng, Y.; Gao, Z.; Zhao, H.; Ren, A.; Li, G.; Yang, Z.; Hao, X.; Zong, Y. Effects of Tillage in Fallow Period and Sowing Methods on Water Storage and Grain Protein Accumulation of Dryland Wheat. Pak. J. Agric. Sci. 2015, 52, 1–8. [Google Scholar]
  60. Taner, A.; Arısoy, R.Z.; Kaya, Y.; Gültekin, İ.; Partigöç, F. The Effects of Various Tillage Systems on Grain Yield, Quality Parameters and Energy Indices in Winter Wheat Production under the Rainfed Conditions. Fresenius Environ. Bull. 2015, 24, 1463–1473. [Google Scholar]
  61. Tang, Y.; Wu, X.; Li, C.; Wu, C.; Ma, X.; Huang, G. Long-Term Effect of Year-Round Tillage Patterns on Yield and Grain Quality of Wheat. Plant Prod. Sci. 2013, 16, 365–373. [Google Scholar] [CrossRef]
  62. Vanda, S.F.; Aynehband, A.; Naraki, F. Effects of Tillage Method, Seed Rate and Microelement Spraying Time on Grain Yield and Yield Components of Rapeseed (Brassica Napus) in Warm Dryland Condition. J. Food Agric. Environ. 2009, 7, 627–633. [Google Scholar]
  63. Wasaya, A.; Tahir, M.; Yasir, T.A.; Akram, M.; Farooq, O.; Sarwar, N. Soil Physical Properties, Nitrogen Uptake and Grain Quality of Maize (Zea mays L.) as Affected by Tillage Systems and Nitrogen Application. Ital. J. Agron. 2018, 13, 324–331. [Google Scholar] [CrossRef]
  64. Woźniak, A. Yield and Chemical Composition of Spring Triticale Grain Depending on Cropping and Tillage Systems. Int. J. Plant Prod. 2016, 10, 45–52. [Google Scholar]
  65. Woźniak, A.; Wesołowski, M.; Soroka, M. Effect of Long-Term Reduced Tillage on Grain Yield, Grain Quality and Weed Infestation of Spring Wheat. J. Agric. Sci. Technol. 2015, 17, 899–908. [Google Scholar]
  66. Woźniak, A.; Soroka, M.; Stępniowska, A.; Makarski, B. Chemical Composition of Spring Barley (Hordeum VulgareI L.) Grain Cultivated in Various Tillage Systems. J. Elem. 2014, 19, 597–606. [Google Scholar]
  67. Woźniak, A.; Makarski, B.; Stępniowska, A. Effect of Tillage System and Previous Crop on Grain Yield, Grain Quality and Weed Infestation of Durum Wheat. Rom. Agric. Res. 2014, 31, 129–137. [Google Scholar]
  68. Woźniak, A.; Rachoń, L. Effect of Tillage Systems on the Yield and Quality of Winter Wheat Grain and Soil Properties. Agriculture 2020, 10, 405. [Google Scholar] [CrossRef]
  69. Woźniak, A.; Soroka, M. Effects of a 3-Year Reduced Tillage on the Yield and Quality of Grain and Weed Infestation of Spring Triticale (Triticosecale Wittmack). Int. J. Plant Prod. 2014, 8, 231–242. [Google Scholar]
  70. Woźniak, A.; Stępniowska, A. Yield and Quality of Durum Wheat Grain in Different Tillage Systems. J. Elem. 2017, 22, 817–829. [Google Scholar] [CrossRef]
  71. Yousefian, M.; Shahbazi, F.; Hamidian, K. Crop Yield and Physicochemical Properties of Wheat Grains as Affected by Tillage Systems. Sustainability 2021, 13, 4781. [Google Scholar] [CrossRef]
  72. Phillips, H.N.; Heins, B.J.; Delate, K.; Turnbull, R. Impact of Grazing Dairy Steers on Winter Rye (Secale Cereale) versus Winter Wheat (Triticum Aestivum) and Effects on Meat Quality, Fatty Acid and Amino Acid Profiles, and Consumer Acceptability of Organic Beef. PLoS ONE 2017, 12, e0187686. [Google Scholar] [CrossRef] [Green Version]
  73. Phillips, H.N.; Heins, B.J.; Delate, K.; Turnbull, R. Fatty Acid Composition Dynamics of Rye (Secale Cereale L.) and Wheat (Triticum Aestivum L.) Forages under Cattle Grazing. Agronomy 2020, 10, 813. [Google Scholar] [CrossRef]
  74. Omondi, E.C.; Wagner, M.; Mukherjee, A.; Nichols, K. Long-Term Organic and Conventional Farming Effects on Nutrient Density of Oats. Renew. Agric. Food Syst. 2021, 1–15. [Google Scholar] [CrossRef]
  75. Soil Survey Staff Web Soil Survey. Available online: https://websoilsurvey.sc.egov.usda.gov/ (accessed on 20 April 2019).
  76. Liebhardt, W.C.; Andrews, R.W.; Culik, M.N.; Harwood, R.R.; Janke, R.R.; Radke, J.K.; Rieger-Schwartz, S.L. Crop Production during Conversion from Conventional to Low-input Methods. Agron. J. 1989, 81, 150–159. [Google Scholar] [CrossRef]
  77. Seidel, R.; Moyer, J.; Nichols, K.; Bhosekar, V. Studies on Long-Term Performance of Organic and Conventional Cropping Systems in Pennsylvania. Org. Agric. 2017, 7, 53–61. [Google Scholar] [CrossRef]
  78. Moyer, J. Roller/Crimper No-Till: Advancing No-Till Agriculture—Crops, Soil, Equipment; Acres USA: Greenly, CO, USA, 2021. [Google Scholar]
  79. Agelet, L.E.; Hurburgh Jr, C.R. A Tutorial on Near Infrared Spectroscopy and Its Calibration. Crit. Rev. Anal. Chem. 2010, 40, 246–260. [Google Scholar] [CrossRef]
  80. AOAC. International AOAC Official Method 990.03, Protein (Crude) in Animal Feed, Combustion Method. In Official Methods of Analysis of AOAC International; AOAC International: Gaithersburg, MD, USA, 2006; pp. 30–31. [Google Scholar]
  81. Dairy One. Forage Laboratory Equi-Analytical, Zooquarius Analytical Procedures. 2020. Available online: https://dairyone.com/download/forage-forage-lab-analytical-procedures/ (accessed on 20 October 2021).
  82. Dairy One. Forage Laboratory Understanding Your Forage Test Results. Available online: https://www.feedcentral.com.au/Feed_Test_Fact_Sheet.pdf (accessed on 2 November 2021).
  83. Horneck, D.A.; Miller, R.O. Determination of total nitrogen in plant tissue. In Handbook and Reference Methods for Plant Analysis; Kalra, Y.P., Ed.; CRC Press: New York, NY, USA, 1998. [Google Scholar]
  84. R Core Team. R: A Language and Environment for Statistical Computing; R Foundation for Statistical Computing: Vienna, Austria, 2021. [Google Scholar]
  85. RStudio Team. Rstudio: Integrated Development Environment for R; Rstudio, PBC: Boston, MA, USA, 2021. [Google Scholar]
  86. Bates, D.; Mächler, M.; Bolker, B.; Walker, S. Fitting Linear Mixed-Effects Models Using Lme4. J. Stat. Softw. 2015, 67, 1–48. [Google Scholar] [CrossRef]
  87. Dean, A.; Voss, D.; Draguljić, D. Nested Models. In Design and Analysis of Experiments; Springer International Publishing: Cham, Switzerland, 2017; pp. 671–701. ISBN 978-3-319-52250-0. [Google Scholar]
  88. Fox, J.; Weisberg, S. An R Companion to Applied Regression, 3rd ed.; Sage: Thousand Oaks, CA, USA, 2019. [Google Scholar]
  89. Lenth, R.V. Emmeans: Estimated Marginal Means, Aka Least-Squares Means. 2021. Available online: https://CRAN.R-project.org/package=emmeans (accessed on 6 October 2021).
  90. Welch, L.F.; Mulvaney, D.L.; Oldham, M.G.; Boone, L.V.; Pendleton, J.W. Corn Yields with Fall, Spring, and Sidedress Nitrogen. Agron. J. 1971, 63, 119–123. [Google Scholar] [CrossRef]
  91. Lundy, M.E.; Pittelkow, C.M.; Linquist, B.A.; Liang, X.; van Groenigen, K.J.; Lee, J.; Six, J.; Venterea, R.T.; van Kessel, C. Nitrogen Fertilization Reduces Yield Declines Following No-till Adoption. Field Crops Res. 2015, 183, 204–210. [Google Scholar] [CrossRef] [Green Version]
  92. Wasaya, A.; Tahir, M.; Yasir, T.A.; Javed, M.M.; Raza, M.A.; Akram, M. Tillage Systems and Nitrogen Timings Effect on Growth, Stay Green and Grain Quality in Maize (Zea Mays L.). Semin. Ciências Agrárias 2019, 40, 3007. [Google Scholar] [CrossRef]
  93. Hepperly, P.; Lotter, D.; Ulsh, C.Z.; Seidel, R.; Reider, C. Compost, Manure and Synthetic Fertilizer Influences Crop Yields, Soil Properties, Nitrate Leaching and Crop Nutrient Content. Compost. Sci. Util. 2009, 17, 117–126. [Google Scholar] [CrossRef]
  94. Marles, R.J. Mineral Nutrient Composition of Vegetables, Fruits and Grains: The Context of Reports of Apparent Historical Declines. J. Food Compos. Anal. 2017, 56, 93–103. [Google Scholar] [CrossRef]
  95. Morris, C.F.; Li, S.; King, G.E.; Engle, D.A.; Burns, J.W.; Ross, A.S. A Comprehensive Genotype and Environment Assessment of Wheat Grain Ash Content in Oregon and Washington: Analysis of Variation. Cereal Chem. J. 2009, 86, 307–312. [Google Scholar] [CrossRef]
  96. Meziani, S.; Nadaud, I.; Tasleem-Tahir, A.; Nurit, E.; Benguella, R.; Branlard, G. Wheat Aleurone Layer: A Site Enriched with Nutrients and Bioactive Molecules with Potential Nutritional Opportunities for Breeding. J. Cereal Sci. 2021, 100, 103225. [Google Scholar] [CrossRef]
  97. Barraclough, P.B.; Lopez-Bellido, R.; Hawkesford, M.J. Genotypic Variation in the Uptake, Partitioning and Remobilisation of Nitrogen during Grain-Filling in Wheat. Field Crops Res. 2014, 156, 242–248. [Google Scholar] [CrossRef] [Green Version]
  98. Cafaro La Menza, N.; Monzon, J.P.; Specht, J.E.; Grassini, P. Is Soybean Yield Limited by Nitrogen Supply? Field Crops Res. 2017, 213, 204–212. [Google Scholar] [CrossRef]
  99. Ryan, M.R.; Smith, R.G.; Mortensen, D.A.; Teasdale, J.R.; Curran, W.S.; Seidel, R.; Shumway, D.L. Weed-Crop Competition Relationships Differ between Organic and Conventional Cropping Systems: Weed-Crop Competition in Organic and Conventional Systems. Weed Res. 2009, 49, 572–580. [Google Scholar] [CrossRef]
  100. Palupi, E.; Jayanegara, A.; Ploeger, A.; Kahl, J. Comparison of Nutritional Quality between Conventional and Organic Dairy Products: A Meta-Analysis. J. Sci. Food Agric. 2012, 92, 2774–2781. [Google Scholar] [CrossRef] [PubMed]
  101. National Research Council. Nutrient Requirements of Dairy Cattle, 7th ed.; National Academy Press: Washington, DC, USA, 2001; ISBN 978-0-309-06997-7. [Google Scholar]
  102. Seufert, V.; Ramankutty, N. Many Shades of Gray—The Context-Dependent Performance of Organic Agriculture. Sci. Adv. 2017, 3, e1602638. [Google Scholar] [CrossRef] [Green Version]
  103. Ogle, D.H.; Doll, J.C.; Wheeler, P.; Dinno, A. FSA: Fisheries Stock Analysis; 2021. Available online: https://github.com/droglenc/FSA (accessed on 6 October 2021).
Figure 1. Average annual crude protein production (Mg ha−1 year−1) of (a) soybeans, (b) maize, (c) and wheat across the three farming systems and two tillage treatments (emmeans ± s.e.) and of (d) oats between the two organic systems and two tillage treatments. Uppercase letters indicate significant differences in average annual protein production among cropping systems (soybeans: χ22 = 218.2, p < 0.0001; maize: χ22 = 17.0, p = 0.0002; wheat: χ22 = 23.7, p < 0.0001; oats: χ22 = 18.6, p < 0.0001). Average annual protein production did not significantly differ between tillage treatments within any of the systems (soybeans: χ23 = 4.8, p = 0.19; maize: χ23 = 5.2, p = 0.16; wheat: χ23 = 5.4, p = 0.15; oats: χ23 = 5.8, p = 0.05). Significant differences (p < 0.05) were based on mean comparisons from emmeans with Tukey HSD adjustments for linear mixed effect models.
Sustainability 14 00631 g001
Figure 2. Cumulative protein (Mg ha−1) in grain (soybeans, maize, oat, wheat, and barley), and harvested forages (hay and silage = lighter bars) across the three farming systems and tillage treatments for 11 harvest years (2008–2013 and 2016–2020). Error bars are ± standard error for cumulative protein from grain + forages. Uppercase letters indicate significant differences in cumulative protein across cropping systems (grain alone: F2,66 = 228.7, p < 0.0001; grain + forages: F2,66 = 200.9, p < 0.0001) and lowercase letters indicate significant difference between tillage treatments within each system (grain + forages: F3,66 = 10.0, p < 0.0001) based on mean comparisons from emmeans with Tukey HSD adjustments.
Sustainability 14 00631 g002
Table 1. Number of years each crop (maize, wheat, oats, and soybeans) was harvested from each treatment (out of 11 possible years) and above-ground N inputs (mean ± standard error, kg N ha−1) from inorganic fertilizers, composted manure, and terminated vetch cover crops. Inorganic N was applied to CNV maize and wheat, manure was applied to MNR oats, and vetch was terminated before planting maize in all systems (only in specific years in the RT-CNV system, see Figures S1 and S2 for additional details).
CropMaizeWheatOatsSoybeans
TreatmentHarvestsN inputs HarvestsN inputs HarvestsN inputs HarvestsN inputs
FT-CNV11170 ± 2167 ± 00n.a.100
RT-CNV11199 ± 9673 ± 60n.a.100
FT-LEG9145 ± 11509080
RT-LEG9167 ± 14509080
FT-MNR5201 ± 10604266 ± 7530
RT-MNR5181 ± 24604266 ± 7530
Table 2. Statistical summaries (χ2 values, p-values, and estimated marginal means) of linear mixed effect models for measures of grain yields across cropping systems and between tillage treatments (nested within each system) with harvest year as a random effect. p-values less than 0.05 are bolded. Different uppercase letters indicate significant differences between cropping systems and different lowercase letters indicate significant differences between tillage treatments within each cropping systems (at p < 0.05 based on Kenward–Roger approximations).
Yield Model SummariesEstimated Marginal Mean Yields, kg ha −1
SystemTillage (System)CNVLEGMNR
Cropχ2pχ2pFTRT FTRT FTRT
Maize25.1***9.60.027482 a6670 bA60715260B73576937A
Wheat13.30.00111.10.0129372745AB23962587B3165 a2740 bA
Oats 125.4***6.20.04-- 19572163B29412579A
Soybeans266.8***4.90.1834483371A19801657C23272308B
1 Only in LEG and MNR systems; *** p < 0.0001
Table 3. Statistical summaries (χ2 values and p-values) of linear mixed effect models for measures of grain quality across cropping systems and between tillage treatments (nested within each system) with harvest year as a random effect. p-values less than 0.05 are bolded.
MaizeWheatOats 1Soybeans
SystemTillage (System)SystemTillage (System)SystemTillage (System)SystemTillage (System)
Responseχ2pχ2pχ2pχ2pχ2pχ2pχ2pχ2p
Protein 2, %59.3***1.20.7683.9***5.30.15n.s.23.3***4.30.23
Fat 3, %10.20.011.70.63n.s.n.s.-
Starch, %15.20.00050.30.9624.3***1.30.73n.s.-
Ash, %n.s.28.9***0.60.90n.s.-
NEg 417.20.00022.30.5127.7***1.80.62n.s.9.90.0072.80.42
NEl 515.70.00041.40.7029.9***1.90.60n.s.11.30.0041.80.61
NEm 616.80.00023.60.3124.5***2.00.58n.s.n.s.
TDN 7, %18.9***2.50.4816.10.00030.70.87n.s.n.s.
Ca, ppmn.s.n.s.n.s.-
K, %n.s.n.s.7.50.0062.30.31-
Mg, %6.00.055.70.1332.8***0.11.00n.s.-
P, %n.s.19.5***7.60.06n.s.-
S, ppmn.s.20.90.00011.50.67n.s.-
1 Only LEG and MNR systems; 2 Protein = crude protein (%); 3 Fat = crude fat (%); 4 net energy for growth Mcal kg−1; 5 net energy for lactation Mcal kg−1; 6 net energy for maintenance Mcal kg−1; 7 TDN = total digestible nutrients; n.s. = model was not significantly different from the null model at p < 0.05; *** p < 0.0001
Table 4. Estimated marginal mean comparisons of grain quality measures between cropping systems. Different letters indicate significant differences between cropping systems at p < 0.05 based on Kenward–Roger approximations.
MaizeWheatOats 1Soybeans
ResponseCNVLEGMNRCNVLEGMNRLEGMNRCNVLEGMNR
Protein 2, %7.2 c7.5 b8.1 a12.9 a11.4 b11.4 b12.912.839.0 b40.4 a39.7 ab
Fat 3, %3.79 ab3.69 b3.90 a1.781.871.895.425.32-
Starch, %73.9 a73.4 ab72.5 b65.7 c66.9 b67.7 a44.544.6-
Ash, %1.431.451.462.04 a1.80 b1.74 b3.493.49-
NEg 41.52 a1.51 b1.52 ab1.40 b1.42 a1.41 a1.331.341.90 b1.91 ab1.91 a
NEl 52.076 a2.066 b2.074 ab1.96 b1.97 a1.97 a1.891.902.48 b2.49 ab2.49 a
NEm 62.203 a2.191 b2.202 a2.07 b2.08 a2.08 a1.981.992.6722.6832.682
TDN 7, %88.22 a87.82 b88.10 ab84.6 b85.0 a84.8 ab79.7380.1797.097.497.3
Ca, ppm15915218553750448715201460-
K, %0.4050.3990.3940.4390.4350.4280.500 a0.473 b-
Mg, %0.103 b0.104 ab0.109 a0.133 a0.134 a0.121 b0.1570.154-
P, %0.2990.2960.3070.376 a0.380 a0.352 b0.4140.389-
S, ppm9169249521430 a1330 b1340 b17001900-
1 Only in LEG and MNR systems; 2 Protein = crude protein (%); 3 Fat = crude fat (%); 4 net energy for growth Mcal kg−1; 5 net energy for lactation Mcal kg−1; 6 net energy for maintenance Mcal kg−1; 7 TDN = total digestible nutrients
Publisher’s Note: MDPI stays neutral with regard to jurisdictional claims in published maps and institutional affiliations.

