1. Introduction
The environmental impact of buildings is astonishing. Every year, building construction consumes 25% of world wood harvest, 40% of materials entering the global economy, 3 billion tons of raw materials transformed into foundations, walls, pipes, and panels, and 50% of copper utilized in the United States [
1]. Building construction accounts for half of the worldwide output of greenhouse gases and acid rain agents. Buildings, as a critical component of a habitat, have an influence on their local and surrounding areas, which can have unintended consequences for people and the community. Addressing the sustainability in building can significantly reduce these negative effects [
2].
In Europe, the building maintenance industry accounts for the same amount of building production as the new construction market. Due to the aging buildings, the maintenance industry grows at a rate of 1.5 percent each year [
3]. The size and expansion of the existing market needs a greater focus on sustainable building maintenance [
4].
Sustainable buildings may ensure that their constructions and services are suitable for living, working, and other daily activities [
5]. Building maintenance is essential to ensuring the building’s long-term sustainability [
6]. Maintenance is defined by BS 3811:1984 and ISO 15686-1 as “a collection of operations required to keep an item in, or restore it to, an acceptable condition” [
7].
Another facet of enhancing quality is a construction component’s “repairability” [
8]. In terms of sustainability, there will be a significant preference for repairing rather than replacing components. This repairability has shown to be a barrier to achieving a lengthy life duration for a number of ostensibly “low-maintenance” items. Those items have a minimal maintenance requirement during their lifetime, but if a failure occurs by accident, this defect often cannot, or only at a very high price, be repaired. As a result, a fatal problem might lead to fill replacement or demolition, resulting in the waste of high-quality components. Paying attention to repair possibilities in a timely manner would have extended the component’s life. In this regard, the accessibility of components for maintenance operations should also be addressed [
9].
Facility managers (FM) rely on real-time accurate data to execute maintenance tasks and deliver correct information to senior managers [
10]. However, the operations of inspecting buildings, analyzing maintenance, and collecting data are time-consuming and labor-intensive [
11]. Furthermore, the budget and resources provided for building maintenance are restricted, and maintenance workers claim that their budget and resources are insufficient and fall short of their requirements [
12]. This trade-off affects the quality and relevance of maintenance operations and inspections, resulting in inadequate facility maintenance and quality management policies [
13].
Present building facility maintenance procedures are mostly centered on corrective maintenance: delayed operations are done in response to a user complaint or an unforeseen breakdown [
14]. Due to a shortage of funds and human resources, preventive maintenance is limited to the bare minimum of obligatory inspections in key facilities [
15]. Furthermore, predictive maintenance is built on applying data analytics tools to analyze operating data supplied via sensors [
16].
Sensing technologies, identification and recognition technologies, hardware, software and cloud platforms, communication technologies and networks, software and algorithms, position technologies, data processing solutions, power and energy storage, and security mechanisms etc., are examples of IoT enabling tools and technologies [
17]. According to [
18], IoT is defined as “interconnection of sensing and actuating devices enables information sharing across platforms via a unified framework, resulting in the development of a common operational picture for allowing novel applications”. IoT is mainly based on standard protocols and technologies, and IoT devices that are a significant component. Intelligent gadgets, smart mobile devices, single board computers, and other sorts of sensors and actuators are examples of typical IoT devices [
19].
Previous works proposed IoT and BIM integrated platform based on open standards by demonstrating the utility of such system in real-life case studies [
20]. Another study presents a platform composed of IoT and BIM that acquires real-time data and performs analytics during the working processes of on-site assembly of pre-fabricated constructions using radio frequency identification (RFID) technology [
21]. The recorded data is transferred to the cloud in real-time to be processed and analyzed providing decision support for the site managers and workers involved. IoT based real time warning system is also integrated in the underground construction of China (Wuhan) [
22]. The system informs managers about warning in real time and prevents passengers of the Yangtze Riverbed Metro from accidents and improves the safety management in underground construction. Research presented in a cloud-based building management platform for green buildings was also proposed [
23]. The research objective is to realize building operation management through the use of cloud computing and IoT technology. Cloud servers are used for data storage, processing, and hosting. The software is in charge of visualization interfaces and modularization services. Hardware development creates devices and objects that link the network. The building facility maintenance management based on IoT and BIM platform includes several functions such as automatic diagnostics, monitoring, controlling, data processing, management, and service customization in the following articles [
24,
25].
ML techniques are applied in the construction as data-driven approach to predict life cycle cost of the buildings [
26]. Some works used ML technique specifically Deep learning models to predict HVAC failures, to forecast building occupants’ complaints or thermal comfortability [
27], Other works used artificial neural networks models such as Multi-layer Perceptron (MLP) and Autoregressive Integrated Moving Average (ARIMA) [
28]. Similarly, statistical models such as linear and nonlinear regression were applied in HVAC units for problem identification and diagnostics [
29].
Despite the potential benefits of the works listed above, none has addressed the integration of IoT and ML models into BIM models presenting predicted building facility anomalies within the building’s 3D model.
To assist BIM and to develop sustainable building facility maintenance, this article offers an ML-based anomaly prediction system and an IoT wireless sensor node. In the system’s application layer, ML and IoT integrated BIM is developed for Facility Managers to monitor HVAC system components that identifies anomalies using ML models. The specific goal of this article is to find the best ML models and data management approaches for IoT facilities to connect with BIM that are suited for FM. The BIM model user interface (UI), which is linked with the IoT and ML model results, provides information about fan coil sensors data and real-time condition to the building 3D model.
2. Machine Learning based Framework
The proposed system classifies and predicts anomalies of building facility using ML methods and visualizes building facility data on the monitoring dashboard in real time.
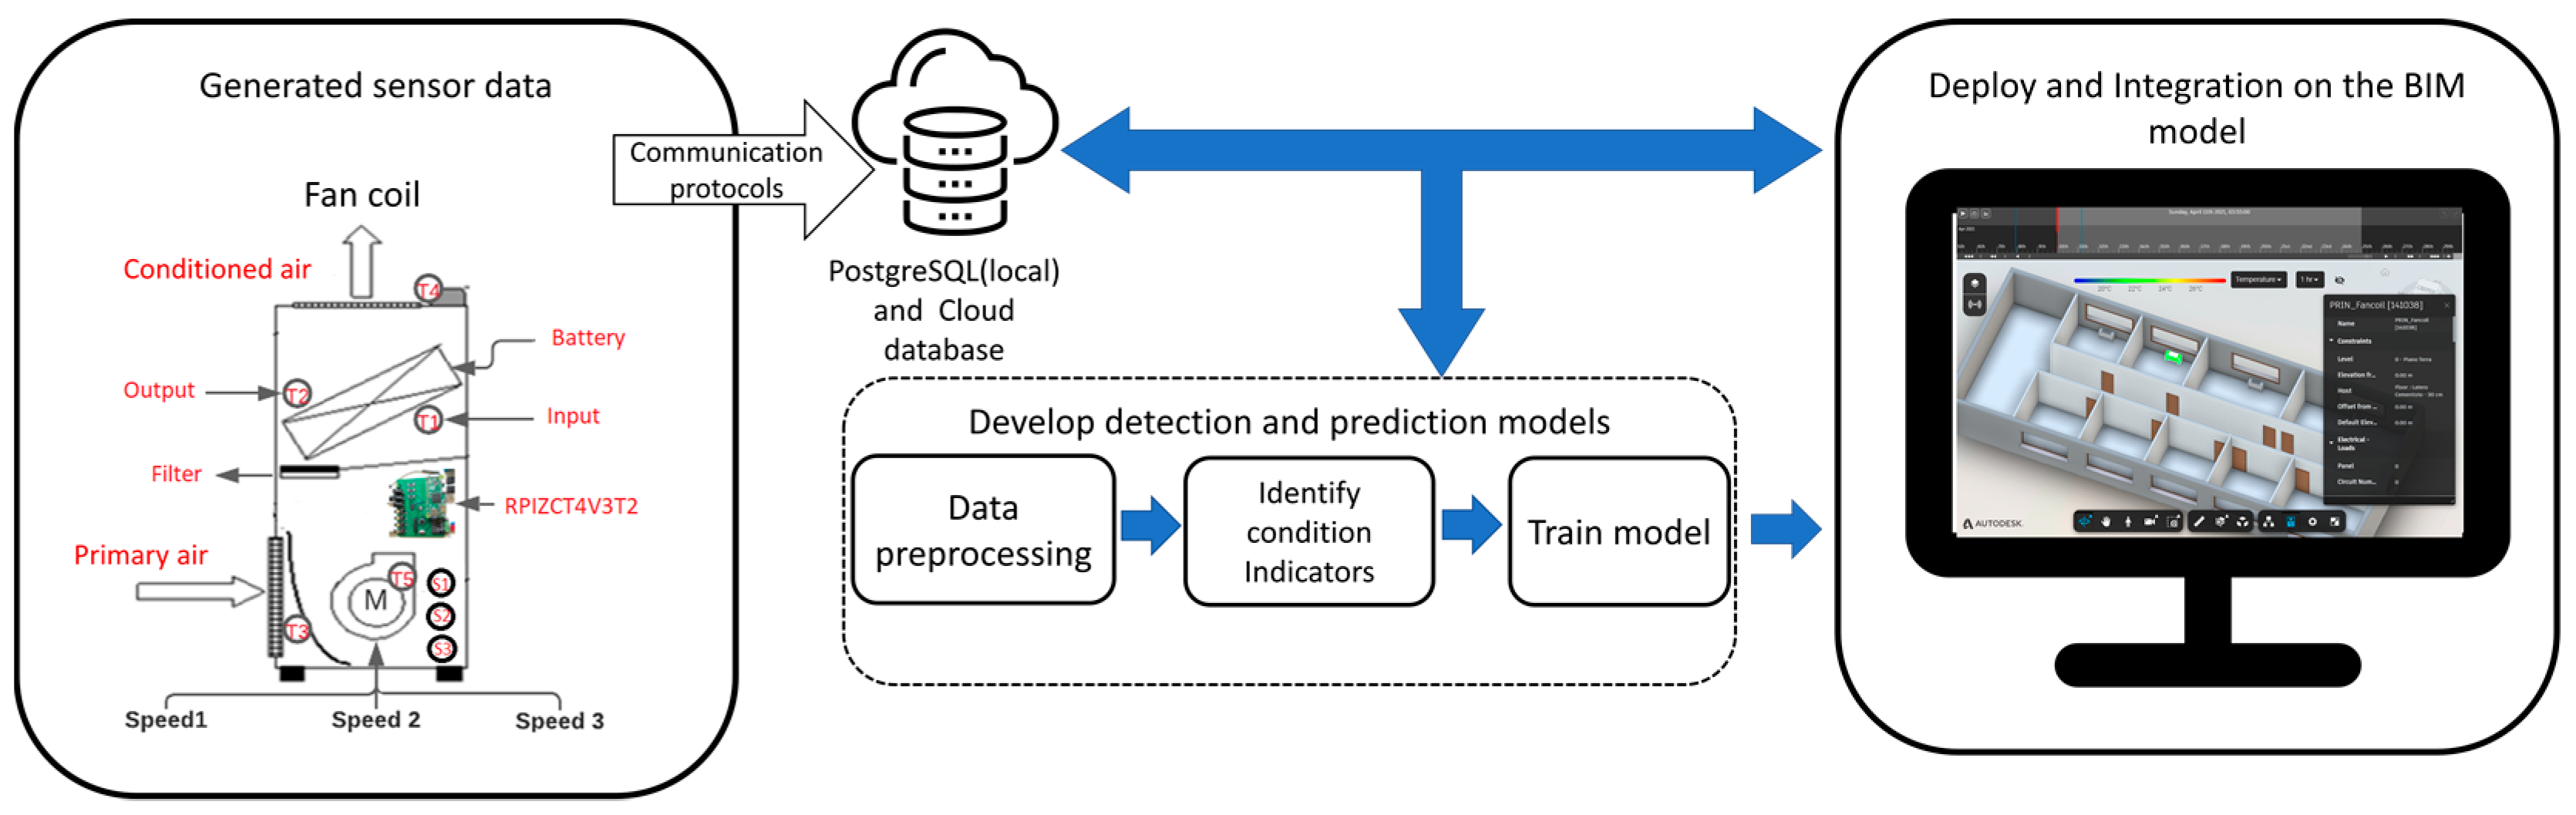
Figure 1 summarizes the anomaly prediction framework of the building facilities. ML based building facility anomaly prediction framework composed of different integrated parts: data acquisition from building facilities; communication layers, ML and deployment and integration on the BIM model.
On the framework, generated sensor data of the building facility is driven to the ML models to predict building facility anomalies. The framework’s application layer that is deployment and integration, displays IoT data and ML prediction results, as well as integrating the BIM model, to enable facility managers and operators to execute on-time building facility maintenance. Maintenance department can receive anomaly warnings and remotely monitor the location of the building facilities via the dashboard.
2.1. Utilized Components to Identify Anomalies of Indoor Facilities
The proposed framework requires number of specific sensors that is connected to the development board RPIZCT4V3T2 and then to the fan coil (FC), which is wirelessly connected to the gateway. The data coming from sensors are acquired and stored on the Raspberry Pi 3B local memory database (PostgreSQL) and on the cloud with wireless communication in different sampling frequencies. The database provides raw data to the ML models and the results of the ML and specific data from the database such as temperatures and power consumptions will be visualized on the dashboard of the BIM model. The communication and hardware block diagram of the systems is depicted in
Figure 2.
Node-Red is installed on the Raspberry Pi 3B system allows to access all sensor variables through serial protocols and display them on its own customized dashboard. A topic is assigned to each sensor, which is responsible for publishing a message to the Raspberry Pi local server, which will function as a receiver (subscriber) via the (Message Queue Telemetry Transport) MQTT protocol. Furthermore, DNSmasq open-access software is installed on the Raspberry Pi 3B to make the board as a router and to create a communication bridge between the sensor board and global network components through Internet Protocol (IP) addresses. The DNSmasq provides the possibility to configure the SSID, password, and IP address on the Raspberry Pi 3B that makes the system visible on the network to the publisher and subscriber.
The PostgreSQL database is used to store sensor data locally on the Raspberry Pi 3B. PostgreSQL obtains an IP address with a specified port number when the Raspberry Pi 3B is powered on and waits for Node-Red to deliver the data to be gathered. The functional flowchart of the system is shown in
Figure 3.
In the flowchart, PostgreSQL assigns the incoming data to the associated tables. MQTT, PostgreSQL, and Node-Red later use the same credentials to execute in the background and connect to the network, obtaining the IP address via DNSmasq. Communication is established between the RPIZCT4V3T2 sensor board and the Raspberry Pi 3B through the MQTT protocol on the specified port of the server, which receives all subscribed topic data from publishers via the TCP protocol and enables publishing devices access to the port. Simultaneously, Node-Red begins on port 1880 with the same IP address to control and monitor data flow of the server and database. The BIM dashboard receives machine learning predictive data and sensor node data in CSV format using a data-driven approach or directly from PostgreSQL through TCP/IP communication. As a result, sensor data will be shown on the Raspberry Pi 3B dashboard and via MQTT on the internet, and PostgreSQL can be monitored and seen from any device linked to the same network by opening the IP address followed by the port number.
The FC is equipped with DS18B20 and RTD PT100 sensors to measure the temperature of various sections of the FC, to measure the current sensor SCT-013-000, and to monitor the voltage 77DE-06-09 sensor. The measurement settings and ranges of the sensors vary depending on the internal elements of the fan coil. Taking these features into account, specific sensors and sensor board including all connected sensors for this study is shown in
Table 1.
The sensors presented in
Table 1 were connected to the fan coil type FC83M-2014/1 at three different speeds and placed around the room to collect data for the ML tools and display real-time conditions on the dashboard. Temperature sensors T1, T2, and T4 on the FC, which are connected to the RPIZCT4V3T2 integrated system, monitor the condition temperature in the 0–90 °C range. T3 is in charge of monitoring the air temperature in the 0–50 °C range, whereas T5 is linked to the motor case and measures in the 0–200 °C range. Voltage sensors (v1,v2,v3) and current sensors (i1,i2,i3) are responsible to monitor the behavior of the motor.
The RPIZCT4V3T2 sensor node attached to the FC supports sensors described in
Table 1 and contains a Raspberry Pi zero W to store data locally and sends measured data over Wi-Fi. A simplified block diagram of the RPIZCT4V3T2 board is presented in
Figure 4.
The RPIZCT4V3T2 board has an Arduino microcontroller (MCU) that is connected to two types of temperature sensors as well as current/voltage sensors that are linked to the MCU through an amplifier and an analog to digital converter (ADC). The MCU receives all raw data from sensors, computes required values such as Real Power, Power Factor, etc., and sends the final computation to the Raspberry pi Zero W through the universal asynchronous receiver-transmitter (UART) serial port; the Raspberry pi Zero W supports Wi-Fi, and the board connects to the server Rpi3B via IP address.
The board RPIZCT4V3T2 measures current using adjusted burden resistor. It is connected directly to the ADC and Vref/2. The burden resistor can be calculated with the equation as follows:
where,
is burden resistor value in Ohm;
is ADC max voltage range;
is number of CT sensor (2000) turns;
is maximum current.
The voltage line has a divider as well as an amplifier. When utilizing an ac/ac adapter, the amplifier gain is set to 1 and the signal amplitude is decreased using a divider.
Figure 5 depicts current and voltage connection schematics to the ADC of the MCU.
The RPIZCT4V3T2 board typically reads current
and voltage
values instantaneously at a given time
. Thus, the signals are used in ADC are in the discrete-time domain. Hence
being the iterative time sample. Instantaneous values
and
are used and are adopted to their Root Mean Square (RMS) values. Given that the ADC has direct access to the
and
the
value of the current and voltage and formulas to compute the power is given and described in
Table 2. The equations described in
Table 2 is performed in hardware level either in MCU or RPIZCT4V3T2 board.
In the next chapters, methods applied for ML models and data preparation are described.
2.2. Machine Learning Models
This subsection discusses how Machine learning models were used to monitor the condition of the building’s facilities. To commence, a correlation analysis was conducted to determine which variables are significant. The building facility’s most closely correlated variables were then loaded into an ML tool to implement prediction analyses. To optimize the efficiency and output of ML, relevant characteristics were extracted from a dataset of building facilities using initial data preparation procedures.
2.2.1. Data Preprocessing
Data preprocessing which is also known as data preparation improves data quality and allows for the extraction of advanced analytics. Data obtained from building facilities sensors is typically inaccurate, biased, and noisy. Raw data feature extraction can enhance the efficiency and accuracy of ML operations. Provided raw data must be cleaned and integrated [
30,
31,
32], feature scaled, extracted, and selected before it can be used in ML.
Feature scaling often known as data standardization which refers to the standardization of a data set’s range of features, which entails altering the values of numerical columns recorded on multiple scales to a formal common scale without affecting the ranges of the values or losing information. Data normalization entails rescaling data dimensions and avoiding over-weighting values that contributes to the overall quality of a data set [
33]. As scaling intervals, [0,1] and [1,1] are commonly employed, as indicated in equations:
Feature extraction takes into account a raw data that is made up of irrelevant and/or duplicate features that might have a significant impact on the trading activity’s success. Authors [
34] offer several feature selections such as multicollinearity, correlation coefficients, and Variance Inflation Factors (VIF) to increase the performance of ML model outputs. According to the authors [
35], correlation coefficients, such as Pearson’s for a linear correlation, or rank-based approaches for a nonlinear correlation, are the most widely employed methodologies for numerical input and output models. If the data coming from building facilities and predicting factors is numerical, the approaches used in the current framework are correlation coefficients. The multicollinearity feature selection approach is used to predict categorical variables of building facilities. Conditional data variables received from building facilities were analyzed using a correlation matrix, and the easiest method to discover collinearity is to examine the predictors’ correlation matrix. A significant absolute value element in this matrix denotes a pair of strongly linked variables, and thus a collinearity problem in the data. Correlation analysis of building facility was used to assess the significance of the relationship between predictors
and response
. Correlation analyses provide insight into the linearity of paired variables. As a parameter of the linear dependency, the correlation coefficients between two random variables are generated for all model variables [
36]. The sample estimate of the correlation coefficient
is calculated for two variables,
and Y, in the dataset as follows:
Where
and
are the standart deviations of X and Y.
Data transformation is another process of converting a numerical format to a categorical format and removing unnecessary data [
37] that used in this research.
To improve the efficiency and output of ML, the aforementioned data preparation approaches were used to extract significant features from a dataset of building facilities. Acquired features and variables were then provided to the ML processes.
2.2.2. Auto Classification Model to Predict Qualitative Variables
To identify the optimal ML model for detection building facility anomalies, the Automatic machine learning (AutoML) method is applied. H2O AutoML is an open source, user-friendly machine learning platform that was created for both advanced and intermediate machine learning users. According to recent research, H2O AutoML [
38] outperforms other competing automatic ML tools. The authors of [
39] evaluated AutoML’s robustness and efficiency in comparison to other automated models such as TPOT [
40] and AutoKeras [
41]. The authors [
42] tested the tool’s resilience using fuzzy, clean, and noisy data sets. Similar research [
43] have assessed the efficiency of the AutoML method in accordance with other tools, such as auto-sklearn [
44] and Auto-WEKA [
45] using open source datasets. To produce a large number of ML models in a short period of time, AutoML is the fastest tool to train H2O machine learning algorithms. On tabular datasets, H2O AutoML allows supervised training of regression, binary classification, and multi-class classification models. H2O AutoML platform is available in different programming tools such as Python, R, Java, and Scala, as well as via a web interface. R is considered in this research to perform ML-based classification analyses.
Generalized Linear Models (GLM), Distributed Random Forests (DRF), XGBoost, Gradient Boosting Machines (GBM), and Deep Learning are the H2O AutoML platform essential models. H2O AutoML platform selects one of the three alternative models. It can deploy only one of the base models or their hyperparameter-optimized variants. It may also select a Best Of Family Stacked Ensemble model, which contains one model from each category, and the All Models Stacked Ensemble pipeline.
The evaluation metrics used for the classification models are listed and described in
Table 3.
3. Deployment and Integration of IoT and Machine Learning Data on the BIM Model
The BIM model of the experimental building and the FC utilized in this study were both created using the Autodesk Revit software. Navisworks from Autodesk is used to integrate IoT sensor data and ML predicted results with a BIM model. Users can benefit from Navisworks to open and merge 3D models, navigate around them in real-time, and evaluate the model using a variety of features such as comments, redlining, viewpoint, and measurements. Interference detection, 4D time simulation, photorealistic rendering, and data management are among the plugins that enhance the program. In this study, Navisworks iConstruct plugin is used to manage IoT and ML data to the BIM model through Excel sheet files and/or PostgreSQL data sources, allowing users to expand the information in the BIM model. Schematic diagram of the data management and transformation into the BIM model is depicted in
Figure 6.
The integration of sensors and ML model results started with a static data on the excel sheet, which was then imported into Navisworks through the iConstruct external plugins. To link data to the BIM model, Data Links tab is configured. To link the data users must first identify an attribute that connects both the BIM model’s information and an external data source. Once a relationship is established, Data Links can be mapped for additional information between the two data sets and propagate onto the user-defined data tab. The user-defined tab then displays the external information and attributes. iConstruct allows users to customize the color of the fan-coil based on the values of the variables.
Second possibility is to visualize external data in real time on the BIM model. In order to integrate sensor data in real time through a PostgreSQL database, a node-red flow is created to transmit coming sensor data.
After that in Navisworks PostgreSQL database is configured using Data tools settings then PostgreSQL Ansi 64 driver is installed to fill Navisworks columns with a corresponding columns of the sensor variable database.
Thus, an ML-based framework for the maintenance of building facilities that visualize anomalies on the BIM is ready to conduct an experiment in a real case.
To show the reliability and applicability of the framework, the experiment was conducted at the Politecnico di Torino’s DISEG laboratory. The experimental laboratory room is located in the building’s basement. One of the fan coil units (FCU) of the room that is positioned under the windows is used as a facilities building. The FCU is a part of the HVAC system. It uses a coil and a fan to heat or cool the building’s rooms which is considered one of the important indoor facilities. For this study, FC83M-2014/1 FC with four speeds was used. The FC has a motor that produces 1100 RPM in an anti-clockwise direction. Furthermore, FC has a cooling and heating battery as well as filters that must be checked on a regular basis. Technical specifications of the FCU used for this study is provided in
Table 4.
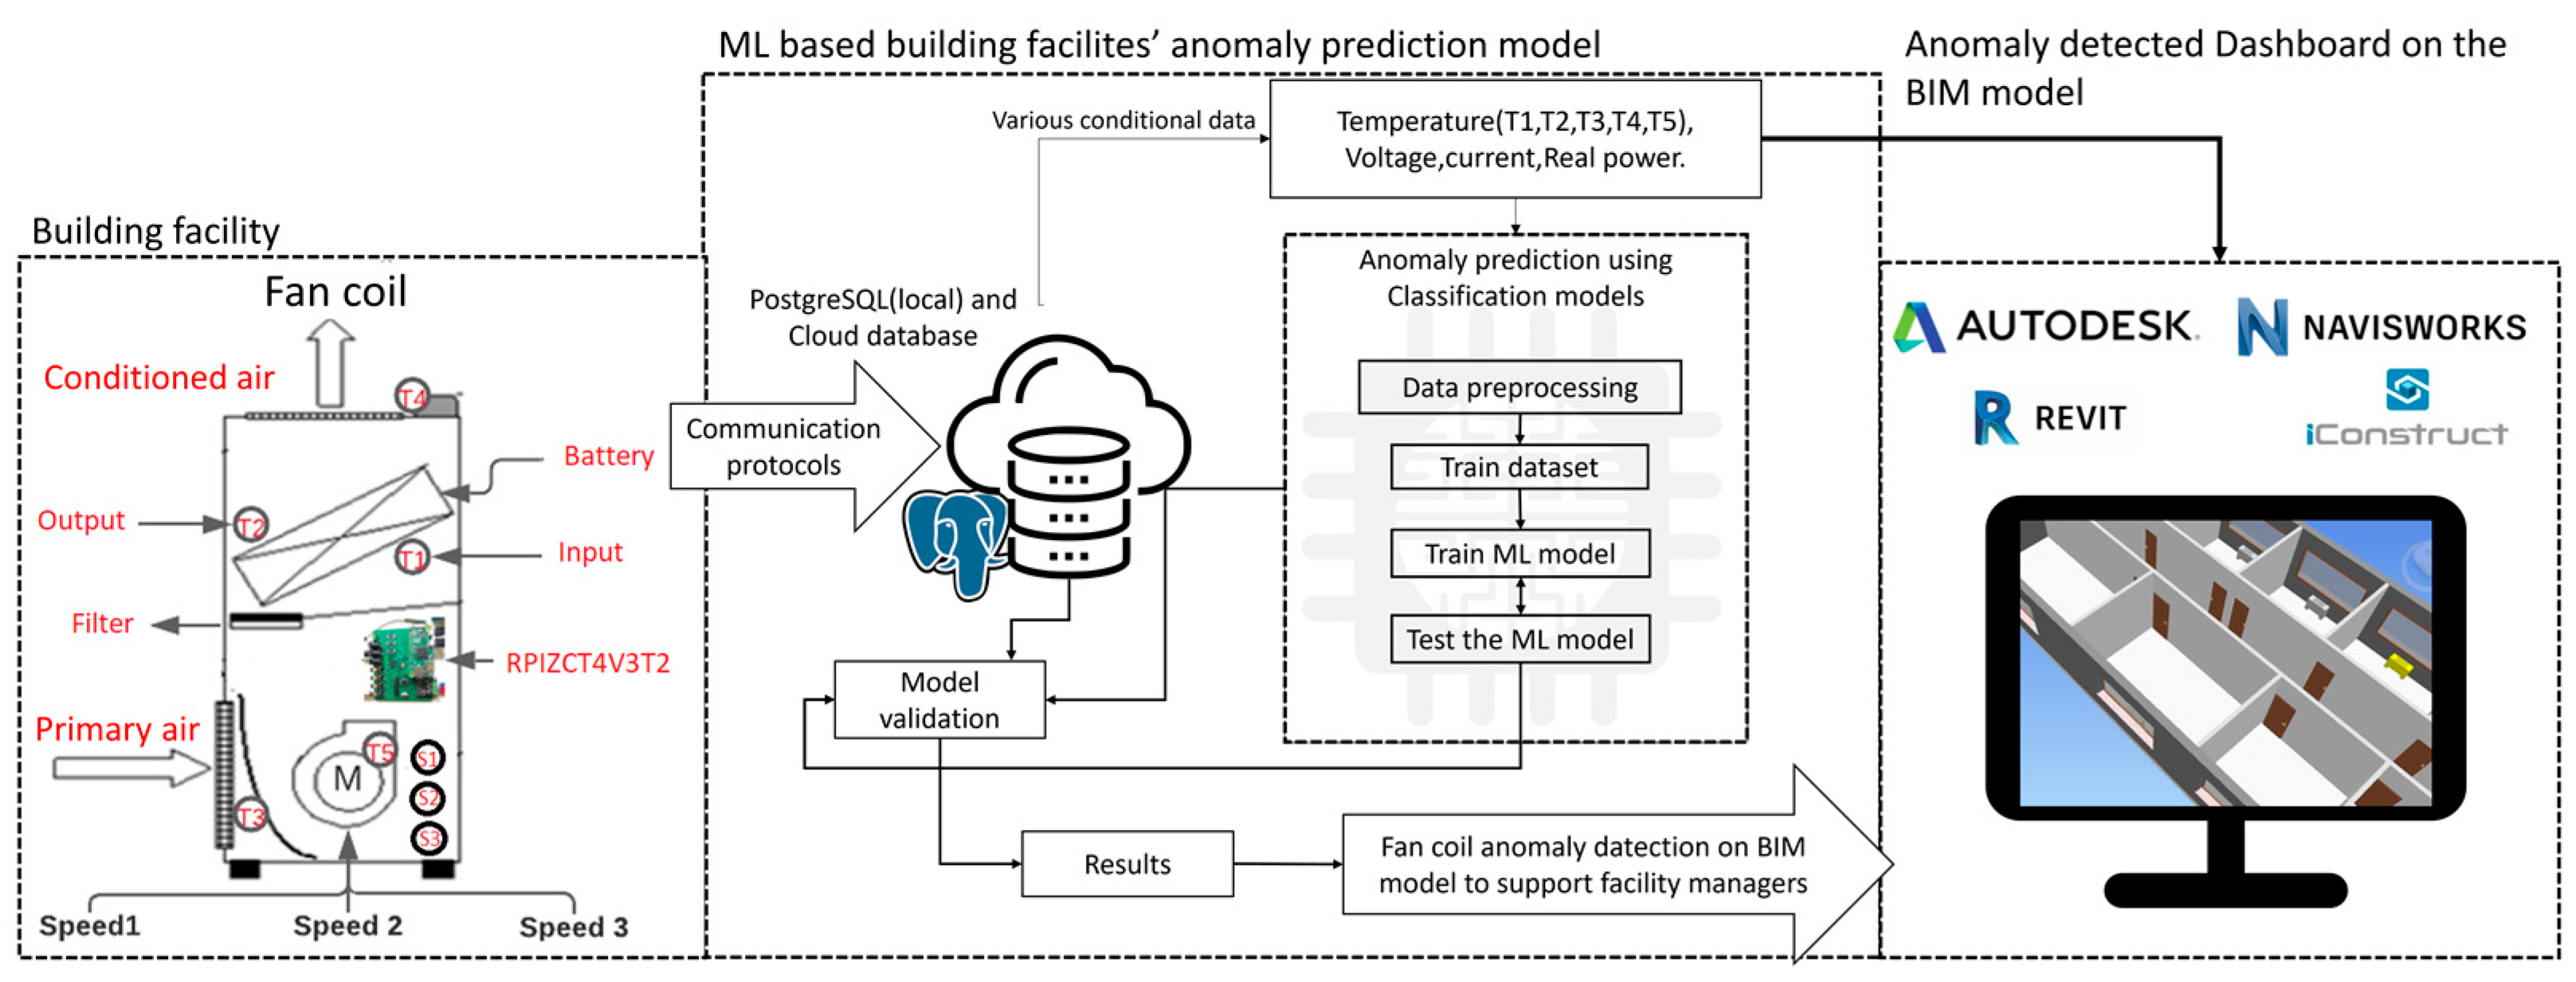
Expanded framework of the experimental setup including data acquisition, machine learning specifications and building 3D model integration is demonstrated in
Figure 7. On the framework, building facility specifically FC 83M-2014/1 is equipped with sensors and collects data locally and on the server. On the framework, the building facility fan coil (FC) is equipped with sensors that interact with the local server and the gateway cloud server through TCP/IP and MQTT protocols, performing data gathering and storing essential data for anomaly prediction models. Data collection from sensors is acquired with a memory of ~30GB that means a proposed system able to collect data from installed sensors for 26 days with a sampling frequency of 1 Hz. Furthermore, the collected data is sent into the online condition monitoring dashboard. Data preprocessing allows for the extraction of meaningful features from a dataset and their transfer to ML models.
Figure 8 depicts the FC, which has been equipped with RPIZCT4V3T2 board and sensors and is ready to conduct an experiment.
The experiment was divided into two parts: the first was to collect balanced (normal) conditional data from the FC motor, and the second was to simulate an unbalanced condition by attaching 15g of mass to one of the FC motor’s blades. The experiment was conducted three times at three different speeds. Throughout the experiment, all essential raw data was collected and saved on the database for later analysis. The collected dataset from the experiment is labeled according to the condition of the FC. The labeled sensor dataset is then trained and tested using Automatic ML classification models and the best performed model is selected for deployment on the application. The classification model results such as balanced, unbalanced or off conditions of the FC is presented on the BIM model of the construction.
In the next chapter the results of the experiment, building facility sensors’ data within the ML results integrated into BIM model are introduced.
4. Results
H2O AutoML is used to detect anomaly from the data coming from sensors. Data acquired from sensors are trained in an H2O.ai cluster using R studio with a version 3.34.0.3. The AutoML function in H2O automates the process of building a large number of models and finds the most suitable model for a given dataset. Some H2O models yield varying significance for one-hot (binary indicator) encoded categorical columns (e.g., Deep Learning, XGBoost). For the variable significance of categorical columns, a summary of the variable importance across all one-hot encoded features must be compared across all model types and produce a single variable importance for the original categorical feature. The models and variables are ordered by their proximity. The multinomial distribution approach was used to train the dataset as it was categorical.
As the main metrics of the predictive models were used error metrics to evaluate the best performed models.
Table 5 demonstrates the results of the best ML models that have been used to classify different conditions of the fan coil. According to the table “Deep learning grid 3 AutoML model 3” is the best performed model for our dataset. The deep learning model parameters are three class classification model, multinomial distribution, 6.053 weights/biases and mini-batch size is 1. The results of the model: RMSE is 0.096372 and MSE is 0.009287 which is very good multinomial classifier. However, training time is slightly higher respect to the other models.
The H2OAutoML leaderboard displays the model results together with corresponding metrics. The H2OAutoML leaderboard graph displays 5-fold cross-validated metrics.
Figure 9 depicts the variable significance of the Deep learning model produced by H2OAutoML. According to the plot, Real power (RP1) is the most influenced variable to the model.
The confusion matrix in
Table 6 represents the measurements of the highest performing model that is predicted class with actual class, indicating that the model identified anomaly with 0.0065 error and only three points out of 463 are misclassified for the provided dataset.
The results of AutoML that classifies different conditions and anomalies of the FC motor in real time are deployed on the BIM model. To understand the behavior of the balanced, off, and unbalanced condition of the FC motor a real time data of the Real Power in three speeds is depicted in
Figure 10.
Finally,
Figure 11 demonstrates an application developed on the Autodesk Navisworks that integrates ML results within the BIM model. In the application, the fan coil color changes according to the results of ML data. The color is “Blue” if the fan coil motor is under the balanced condition, “red” if the FC motor is under the unbalanced condition and “Grey” if the FC is turned off.
Moreover, Node-red dashboard displays all coming data from sensors in real time as shown in
Figure 12.
5. Discussion
Cloud based IoT and analytical platforms such as Google clouds, Microsoft Azure, IBM Watson, AWS from Amazon, Thingworx, Thingspeak give a possibility easily acquiring IoT data to perform analytics, however, most of the important services such as data storage, extra AI tool usability for prediction analyses are not free and there is no integration tools with a custom based BIM models.
A proposed ML-based framework for building facility monitoring system would enhance the building’s maintenance plan by assisting facility managers in evaluating the monitored building conditions within the 3D model. As a result, facility managers may benefit from the proposed framework to solve sustainable maintenance issues in the following: Facility managers may plan and schedule maintenance work in advance by using indoor facility anomaly or failure signals; Data visualization and anomaly data on the dashboard provide the potential of minimizing the danger of devastating failures and reducing unexpected forced outages of building components; ML-based anticipated and real-time data from sensors allow for more accurate maintenance; The use of ML predicted results for room components inside the BIM model simplifies maintenance operations; Finally, identifying the location of the failed component in real time is simple.
Thus, the research presented in this paper attempts to solve the gaps in the following studies: lack of ML framework to develop sustainable building facility maintenance [
26], a lack of automation [
46], and a need of a data collecting system [
47].
However, there are significant limits towards this work, which are as follows:
The framework is quite limited in terms of ML-based building facility maintenance. Investigations are required to conduct sizable research by connecting more building facilities such as sprinkler systems, water pipes, drains, wires, ducts, cables, fire services equipment, and so on, as well as evaluating the system’s integration with facility managers and clients to assess its reliability, repeatability, robustness, and ease of use.
More building facility sensors, such as an oxide gas sensor, a particle dust sensor, etc., as well as facility management sensors, including a motion sensor, occupancy sensor, and so on, may be added to the system and evaluated using the proposed framework.
6. Conclusions
In this research an ML framework for the sustainable maintenance of the building facilities is introduced. The proposed framework addresses the gap in maintenance procedures by assisting FM teams in taking early action and avoiding unforeseen failures without the requirement for costly extensive site inspections of the installations. The framework is composed by three main parts: (i) an IoT architecture to collect real-time data from the building, (ii) an ML algorithm to analyze the data and support the maintenance activity, and (iii) a BIM to provide a virtual representation of the building and visualize the maintenance activity.
To prove the applicability and reliability of the framework the experiment has been conducted on the indoor facility FC that is equipped with sensors and sensor node that continuously sends data to server database. On the edge of the framework, the ML model predicts anomalies of the unbalanced condition of the FC.
To classify different conditions including balanced, unbalanced, and turned off conditions, automatic ML platform tool AutoML H2O is used and according to the multinomial classification models, the “Deep learning grid 3 AutoML model 3” is the best performed model for our case study. The results of the best performed Deep Learning model: RMSE 0.096372 and MSE 0.009287 which means very good classifier. However, training time is slightly higher respect to other models. Finally, in the application layer of the framework, IoT data and ML results are integrated with a BIM model. In the 3D model of the BIM, the fan coil color changes according to the anomaly prediction results.
Future research will concentrate on transferring IoT sensor data and ML anomaly information to the three-dimensional BIM models that will be merged with virtual reality (VR), augmented reality (AR), and mixed reality (MR) technologies and visualizing anomalies on the Digital Twin of BIM model.
A proposed ML framework might serve as a starting point for developing collaborative BIM systems based on AR/MR/VR. For example, to enable information flow in facility management, create a framework based on ML, BIM, mixed reality, and a cloud platform.
Such systems are valuable to facility managers because they provide quick remote access to 3D models of buildings and allow them to analyze a scenario before making decisions about building facility operations.


 ,
, 


