Article

The Trade Effect of Trust: Evidence from Agricultural Trade between China and Its Partners

1
College of Economics & Management, Huazhong Agricultural University, Wuhan 430070, China
2
Business School, Wuzhou University, Wuzhou 543002, China
*
Author to whom correspondence should be addressed.
Sustainability 2022, 14(2), 729; https://doi.org/10.3390/su14020729
Submission received: 14 November 2021 / Revised: 1 January 2022 / Accepted: 5 January 2022 / Published: 10 January 2022

Abstract

:
High trust is a booster of trade development, while low trust is a stumbling block. The trust between two countries (regions) will be beneficial to sustainable development for bilateral trade. To investigate the impact of trade partners’ trust on the scale of China’s agricultural export trade, we put trust into the analytical models of international trade, propose a research hypothesis based on the transaction cost economics theory, and construct an extended gravity model for empirical tests. The results show that the level of trust affects the scale of export trade by affecting the size of transaction costs. Higher trust produces trade creation effect, while lower trust produces trade barrier effect. The trade partner’s trust significantly affects the scale of China’s agricultural export trade, and the effect is heterogeneous at different percent quartiles. Even after controlling the endogeneity, the conclusion still holds. We suggest that, in the international trade of agricultural products, the government should constantly improve the quality of formal institution, attach importance to constructing of the informal institution of trust and enhance the social trust to facilitate the development of agricultural trade.

1. Introduction

Trust is an important informal institution. Previous studies assumed trust impacts economic growth. The mechanism presents that high levels of trust promote the accumulation of production inputs [1], encourages enterprise innovative productivity [2,3], promotes relationship-specific transactions in the market [4], and enhances economic growth through these mechanisms. Lack of trust [5] can partly lead to the slow development of most economically backward regions, which may fall into the “low trust poverty trap” [6]. These studies show that trust is a factor of great importance to economic growth. Recent researches have integrated trust into the framework of international trade mainly from the perspective of trade scale and trade structure. Although trust has aroused many scholars’ attentions and incorporated it into analyses of economic growth, much less attention has been paid to the trade effects of trust by studying the scale and structure of trade. If countries (regions) clarify the mechanism and degree of impact of trust on bilateral trade, they will enjoy a sustainable trade development by attaching emphasis on informal institutions, such as trust during transaction.
The level of trust is closely related with the scale of trade. In international trade, low trust is something in the manner of an invisible barrier between trading parties, and lack of trust increases transaction costs, which cause that the scale of trade is lower than that predicted in standard trade theory called a “missing trade puzzle” [7]. Countries (regions) with higher levels of trust advocate trade liberalization because consumers with higher trust are more likely to buy goods imported from abroad [8,9]. Traders are stimulated to cooperate to obtain trade benefits, and the scale of trade increases accordingly [10,11]. By combining trust and finance with trade, Roy et al. [12] found that higher social trust has a positive impact on the scale of export trade in countries with relatively underdeveloped financial sectors due to the higher dependence of export enterprises on external financing. In empirical research on China, the research has extended from state to provincial levels. At the state level, Zhao and Chi [13] use the World Values Survey (WVS) data to measure the level of trust, and their empirical studies find that a higher level of trust in the importing country contributes to the growth of China’s foreign trade. Wang et al. [14] used the instrumental variable generalized moment (IVGMM) method to test the impact of social trust on economic exchanges between China and its major trading partner from 2005 to 2013. They found that social trust significantly promotes bilateral trade and FDI between China and its partners. To go a step further, Xing and Zhou [15] used an extended gravity model to study the trade effect of trust after identifying the different levels of trust among provinces. The study shows that bilateral trust has a significant positive impact on provincial trade.
Trust is an important determinant of comparative advantages for countries and industries. Countries (regions) with higher trust levels are more likely to expand the scale of enterprises and specialize in industries with higher contract intensity because higher trust levels enhance cooperation among enterprises to reduce the risk of “being held-up” after specific assets investment and the production cost showing higher value added and larger export share in contract intensive industries. Therefore, the level of trust in a country (region), just as physical capital, human capital and the quality of formal institutions, is an important source of comparative advantage [16,17,18]. On the basis of the empirical evidence of European countries, Guiso et al. [19] also found that the level of trust not only affects the volume of bilateral trade, but also affects the quality of bilateral trade. A higher level of trust promotes an increase in total trade, and trust is more important for differentiated products trade classified by Rauch [20]. The reason is that products with greater quality differences are more likely to leave a contract gap and need mutual trust to negotiate. Higher level of trust leads to a larger trade scale in more complex differentiated products.
To sum up, the existing research shows that trust, as an informal institution, is also a factor of great importance to international trade. Most of these studies combine trust with overall trade or manufacturing industries, but the impact of trust on agricultural trade is hardly addressed. It is imperative to study the trade effect of trust in international trade of agricultural products and its mechanism theoretically, and to supplement more empirical evidence. We focus mainly on the level of trust of trading partners on China’s agriculture export because (1) we can capture from whether it is “the lubricant of transactions” in Arrow [5] or “the public morality of transactions” in Hirsch [21] that trust plays an important role in transactions; and (2) international trade in agricultural products is a transnational (regional) transaction. Due to the differences in geographical location and factor endowment advantages, international trade in agricultural products is conducive to giving full play to their respective comparative advantages and achieving mutual benefit and win–win results. We also focus on China because (3) China is a major trader in agriculture, and the proportion of its trade in the world market has been increasing yearly. According to China Agricultural Trade Development Report 2020, China’s agricultural products exported USD 79.1 billion and imported USD 150.97 billion in 2019. The total trade volume reached USD 230.07 billion, an increase of 5.7% year on year, which saw a large scale of agricultural products. Studies have shown that bilateral factors, such as economic scale, latitude difference, and agricultural development, significantly affected the development of China’s agricultural trade, but how have informal institutional factors in the transaction level such as trust? Does the trust of a trading partner affect the scale of China’s agricultural export trade? What is the mechanism? How significant is the impact? It is a field worthy of in-depth study. Unfortunately, existent studies pay little attention to them.
Compared with the existing researches, we have made the following marginal contributions. First, the existing researches focus mainly on the impact of formal institutions on international trade while few consider the impact of informal institutions, such as trust, especially in agricultural trade. We introduce trust, an informal institution, into the analysis framework of international trade in agricultural products. Theoretically, we focus on the trade effects and mechanism of trust on international trade of agricultural products on the basis of transaction cost economics theory, which is a step further of the existing researches. Empirically, the facts based on China’s agricultural export trade not only verify the hypothesis that high trust in trading partner has trade creation effect, but the trust of trading partner has heterogeneous effects at different quartiles on export scales when we investigate, and it has a more evident effect at the lower quartiles, which supplements the empirical evidence of the impact of trust on international trade of agricultural products.
The paper is divided into five parts. Section 2 is the hypothesis development. Section 3 is the empirical design. Section 4 is analysis of empirical results. The last section is the conclusions and insights.

2. Hypothesis Development

The international trade of agricultural products has its particularity. Due to the influence of production conditions such as latitude, soil, light, temperature and precipitation, agricultural products in various countries (regions) of the world have different characteristics and specific comparative advantages. Heterogeneous consumers with different income levels have diversified consumption preferences in different economic development countries (regions) in the world. Differentiated agricultural products can induce higher purchase desire of heterogeneous consumers, increase consumer utility and form “outsider advantage” so as to promote the development of agricultural trade [22]. However, whether the real trade between countries (regions) takes place or not is affected greatly by transaction cost. The level of trust between partners plays a crucial role in the size of transaction cost.
Transaction costs are ubiquitous in a real economic world full of “friction” according to the theory of transaction cost economics. The size of transaction costs directly affects the explicit profits obtained by enterprises. Traders will try to reduce transaction costs as much as possible to maximize profits. The international trade of agricultural products needs to enter the foreign “anonymous society” from the local “acquaintance society”, and then extend the transaction radius which brings about the risk of trade uncertainty and the increase in transaction cost. If trading partners trust each other, they will facilitate transactions, reduce trade uncertainty and transactions cost. In doing so, the potential trade benefits based on the comparative advantage of factor endowments come true, and the scale of trade expands accordingly. In other words, a higher level of trust has a trade creation effect. On the contrary, if the level of trust between the two sides is low, the transaction will be more complicated, the uncertainty risk and the transaction cost will increase, the scale of trade will be reduced consequently. Therefore, a lower level of trust has a trade barrier effect. When the trust level between potential partners is low, rational traders turn to a new partner in the international market, which increases the cost of information searching, diverts the geographical direction of agricultural trade and results in trade diversion effect.
The mechanism of trade effect of trust is that the level of trust determines the size of transaction cost and thus affects the trade of agricultural products. Lower trust leads to higher transaction cost, which becomes a stumbling block to trade development, while higher trust leads to lower transaction cost, which becomes a booster to trade development. In particular, trust plays an important role in searching, signing and executing during trade process in agricultural products. The trust between traders reduces the cost of information search in the search stage. In order to find business opportunity, traders tend to cooperate with the partners who boast high credit standing and good reputation because they are trustworthy. The trustworthiness of traders is closely related to individual characteristics, such as personal honesty and business integrity. The good business reputation of a trader is an intangible specific asset, which can be used as “special collateral” in trade. In the signing stage, due to people’s bounded rationality, information incompleteness and asymmetry, it is difficult for trades to write all the details of the goods into the contract. Therefore, the contracts signed in trade are often incomplete. If there is trust between traders, the transaction cost of bargaining in contract signing can be reduced. In the contract execution stage, if both parties have a high level of trust, the supervision cost of contract performance can be reduced. Even if there are divergences between the two sides due to the unobservable traits such as quality, they can be solved through renegotiation to avoid expensive international arbitration, litigation or time costs and the like.
Trust is an important channel to reduce transaction costs and eliminate trade barriers, but the establishment and destruction of trade trust relationship is asymmetric in time. Mutual trust relationship takes a long time to establish, but the breakdown of that may occur in a short time. As Dasgupta [23] put it, trust is a “fragile commodity”. The maintenance of trust relationship requires both sides to strengthen business ethics and attach importance to the specificity of business reputation. Trusting each other is as giving a “gift”, which is similar to an incentive mechanism to encourage traders to abide by business ethics and promote mutual benefits and win-win results.
Transnational (regional) trade is essentially a transaction behavior at micro-level and trust plays an important role in the transaction. In reality, both sides of agricultural products trade come from different countries (regions) and have different cultural characteristics. Different national (ethnic) cultures have formed different values and behaviors, and the level of trust cannot be totally the same. Consumers in countries (regions) with higher trust level are willing to accept new things and are more likely to buy differentiated agricultural products from other places to meet diversified consumption preferences and maximize utility. A local trader is more likely to see a transaction with an unknown foreign trader as a mutually beneficial opportunity. On the contrary, consumers in countries (regions) with lower trust levels tend to be conservative and more likely to reject the goods from other countries (regions). Local traders also reduce imports of agricultural products for fear of losing profits. The results of the World Values Survey (WVS) (1981–2014) show that the level of trust varies with the country (region). However, China belongs to higher level of trust among countries with an average score of 58.80 and much higher than that of the world’s 27.85. In the new era of deep integration of economic globalization, China has vigorously developed agricultural trade worldwide to comply with the agricultural resource endowments at home and abroad and exported agricultural products with comparative advantages and imported agricultural products with comparative disadvantages. In the context of comparative advantage of agricultural products, if the level of trust between partners is high, it can alleviate the constraints of bounded rationality, incomplete and asymmetric information, reduce the transaction costs of searching, signing and executing during transaction, and increase the scale of export trade.
We put forward the following hypothesis based on the analysis above:
Hypothesis 1.
Trust is an important factor affecting the international trade of agricultural products. Higher trust in trading partners reduces transaction costs and increases China’s agricultural trade scale, while lower trust in trading partners increases transaction costs and hinders the development of China’s agricultural export trade scale.

3. Empirical Design

3.1. Model Construction and Data Sources

The trade gravity model has a solid theoretical basis [24], which emphasizes the importance of bilateral economic scale and bilateral distance in bilateral trade, and is widely used in empirical research on the determinants of bilateral trade flows. The paper underlines the impact of trading partners trust on the export size of Chinese produce. The export value of agricultural goods is the dependent variable as in the work of Sheng and Liao [25]. To test the research hypothesis based on theoretical analysis, we improved the traditional gravity model. The trust of the informal institution and the economic institution of the formal institution (trade freedom, monetary freedom, financial freedom) are included in the model, and extended gravity model is established as:
l n t r a d e i j t = α + β l n t r u s t j t + k = 1 n γ k X k + ε
where, in Equation (1), i is the exporting country, j is the trading partner, t is time, Xk is the kth dimension control variable, n is the number of control variables, α is the constant term, β and γk are parameters to be estimated, and ε is the error term.
  • Dependent Variable
The dependent variable in this paper was the trade volume of agricultural products exported by China to its trading partner (lntradeijt). The data came from the UN Comtrade Database. The unit is thousands of U.S. dollars. This is a time variable calculated at the constant price of U.S. dollars in 2010 to eliminate the impact of price factors. There are only five zero values in the export trade volume of China’s agricultural products. Considering that there are few zero values, the value is 0.025 by referring to the methods of scholars, such as Sheng and Liao [24], to avoid the loss of sample size.
  • Core Explanatory Variable
The core explanatory variable of this paper was the trust level of trading partners (lntrustjt). The trust was quantitatively measured mainly from social sampling surveyors, such as the European Social Survey (ESS), the World Values Survey (WVS), the General Social Survey (GSS), among others. Among them, the WVS covers most countries (regions). The trust level of countries (regions) worldwide can be measured by the proportion of positive answers to the question “whether most people can be trusted” in the questionnaire of the World Values Survey (WVS). This standard question about trust captures “trust in strangers”, which can be regarded as the most basic trust in all countries (regions) [7]. With its authenticity, the trust index is frequently used in empirical studies of international trade, such as Zhao and Chi [13], Ndubuisi [14], etc. The paper used the data of the World Values Survey (WVS) to measure the trust level of countries (regions). The World Values Survey (WVS) conducted six waves of survey from 1980 to 2014. The level of trust is a time variable. However, the countries (regions) of each survey are not exactly the same, and the seventh survey currently under way has not yet been completed, and the latest available data are up to 2014. The level of trust in a country (region) develops slowly and can be considered to remain unchanged in the short term [26], so the score in each survey cycle can represent the trust level in each year of the corresponding cycle. We chose trust data from the World Values Survey (WVS).
  • Control Variables
In order to more accurately analyze the impact of trust of trade partner on China’s agricultural exports, the paper designed the following control variables in the empirical study to increase the explanatory power of the model:
(1) Bilateral economic scales: China’s gross domestic product (lngdpit), the gross domestic product of its trading partner (lngdpjt), and the bilateral per capita GDP gap (lnedijt). Generally, the scale of trade is positively correlated with the scale of bilateral economy. According to Linder’s preference similarity theory [27], the smaller the bilateral per capita GDP gap is, the more similar the demand structure is, and the larger the trade scale of agricultural products is. The data were derived from the World Bank database and were calculated at USD constant prices in 2010 to eliminate the impact of price fluctuations. The variable is a time variable;
(2) Geographical distance between China and its trading partner (lndistwij). The farther the geographical distance between trading partner, the higher the transport costs, which is not conducive to agricultural trade. Head and Mayer [28] argue that the use of an unweighted measure of geographic distance in the gravity model systematically exaggerates the estimated border effect because it overestimates the effect of geographic distance between countries (regions). In order to avoid exaggerating the size of the boundary effect, this paper used the third distance in the GeoDist database provided by Mayer and Zignago [29], that is, the distance weighted by population or economic agglomeration. The variable is time invariable;
(3) The difference in latitude between China and its trading partner (abslnlatitudeij). The absolute value of latitude difference is used to depict the geographical conditions of agricultural production. If the bilateral latitude difference is wider, the agricultural product trade complementarity is stronger, which is more advantageous to China’s agricultural product export. Latitude data was obtained from La Porta et al. [30]. The variable is time invariable;
(4) The agricultural development of trading partner is expressed by the proportion of agricultural value added to GDP (lnargjt). The higher the proportion of agricultural value added in GDP, the higher the level of agricultural development of trading partner, the important position of agriculture in the national economy, and the less probability of the import demand for agricultural products, which will hinder China’s agricultural exports. These data were from the World Bank database. The variable is time variable,
(5) China’s real exchange rate with its trading partner (lnrerijt). Based on Zhu et al. [31], the following formula was used for its calculation:
r e r i j t = L U C j t / C P I j t C N Y i t / C P I i t
LUCjt and CNYit are the nominal exchange rates of the trading partner and China, respectively, denominated in US dollars in year t. CPIjt and CPIit are the consumer price indices of the trading partner and China, respectively, in year t. The larger value of the real exchange rate in this paper means the real appreciation of the RMB against foreign currencies, and the relative price of China’s agricultural products rises, which reduces the competitiveness of agricultural products. It hinders the export of China’s agricultural products. Nominal exchange rate data and consumer price indices were from the World Bank database. The variable is time variable;
(6) The quality of the trading partner’s trade institution, including trade freedom (lntfjt), monetary freedom (lnmfjt), and financial freedom (lnffjt). All these variables are time variable. Trade freedom mainly measures the impact of various tariffs and non-tariff barriers on trade, monetary freedom mainly measures price stability, and financial freedom mainly measures the independence of financial institutions and the efficiency of the banking sector. Higher trade freedom, monetary freedom and financial freedom of trading partner are conducive to the development of agricultural trade activities and promote China’s agricultural exports. The data came from the Heritage Foundation;
(7) Dummy variable. Including adjacent (adjacent), a member of the WTO (wto), and shock by the financial crisis (crisis). If China is adjacent to a trading partner, the value is 1, otherwise it is 0. If the trading partner and China are both members of the WTO, the value is 1, otherwise it is 0. If the sample years are 1997 and 2008, the value is 1; otherwise, it is 0.

3.2. Sample Selection

Chinese produce is exported mainly to Asia, Europe, and North America. The selected country (region) sample was the main export markets of China’s agricultural products over the year 1997–2014. The countries (regions) involved some in Asia; they were Singapore, Japan, Pakistan, Philippines, Thailand, Korea, Malaysia, India, Vietnam, Indonesia, Jordan, China and HKSAR of China. Australia and New Zealand in Oceania; there were 18 in Europe—Poland, Germany, Russia, Georgia, Slovenia, Ukraine, the Netherlands, Moldova, Sweden, Switzerland, the United Kingdom, Italy, Hungary, Turkey, Spain, Romania, France and Armenia. There were 3 in North America, namely the United States, Canada and Mexico; 6 in South America, including Brazil, Chile, Uruguay, Argentina, Colombia and Peru. There are 4 in Africa, namely Egypt, Morocco, Nigeria and South Africa. According to the UN Comtrade database, the value of Chinese produce exports to these sample countries (regions) catches 88.80% of the total value of that to the whole world, which have strong representativeness.

3.3. Methodology

Because the core dependent variable was the level of trust in trading partner, the existing studies all used the data of the WVS. In the six waves of surveys completed, the countries (regions) of each survey were not exactly the same, that is, not all countries (regions) involved in every wave. If only countries (regions) that have participated in all waves were selected, there would be many a sample loss. Smaller samples may lead to larger estimation bias. In order to increase the sample size as much as possible, we managed to include the latest four waves during 1995–2014. Although this kind of social survey data also had two dimensions of cross-section and time-series, it was not a real panel data, which can be called “repeated cross-section data”. For such data, the ordinary least squares (OLS) mixed regression estimation can be used [32]. To reduce the influence of multicollinearity and heteroscedasticity, this paper took the logarithm of the main variables and found that there is no serious multicollinearity among the variables in the model by observing the correlation coefficient matrix of the variables and further examining the mean value of variance inflation factor (VIF), which states 2.65, much less than 10. To sum up, it can be considered that the variable selection was reasonable.
Considering the possible endogeneity of trust, the paper used the instrumental variable two-stage least squares (IVTSLS) method to estimate the model. To reduce the impact of extreme observations on the estimated coefficient, the paper also used quartile regression to clearly depict the heterogeneous impact of trust of trade partners on the scale of China’s agricultural export at different quartiles. Meanwhile, the control function method was used by constructing a semi-parametric quartile regression model for further testing the robustness of the estimation results.

3.4. Descriptive Statistics

Descriptive statistics are presented in Table 1.

4. Results and Discussion

4.1. Preliminary Observation

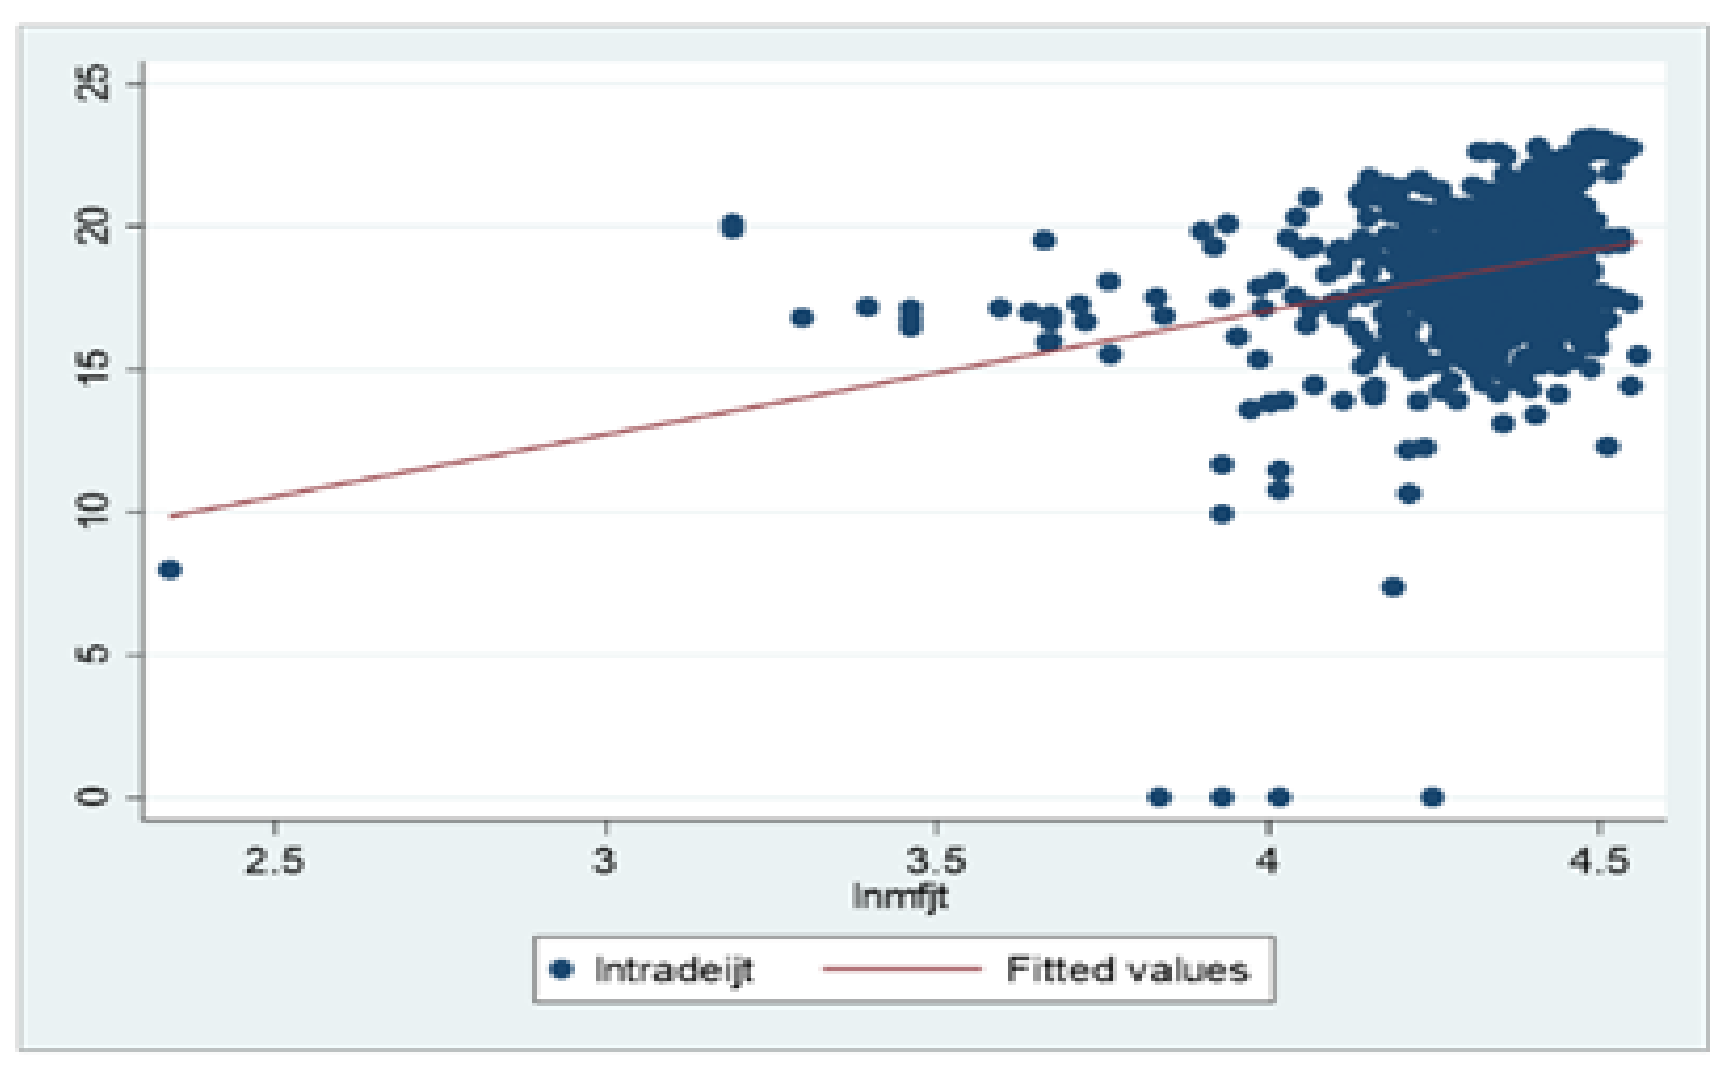
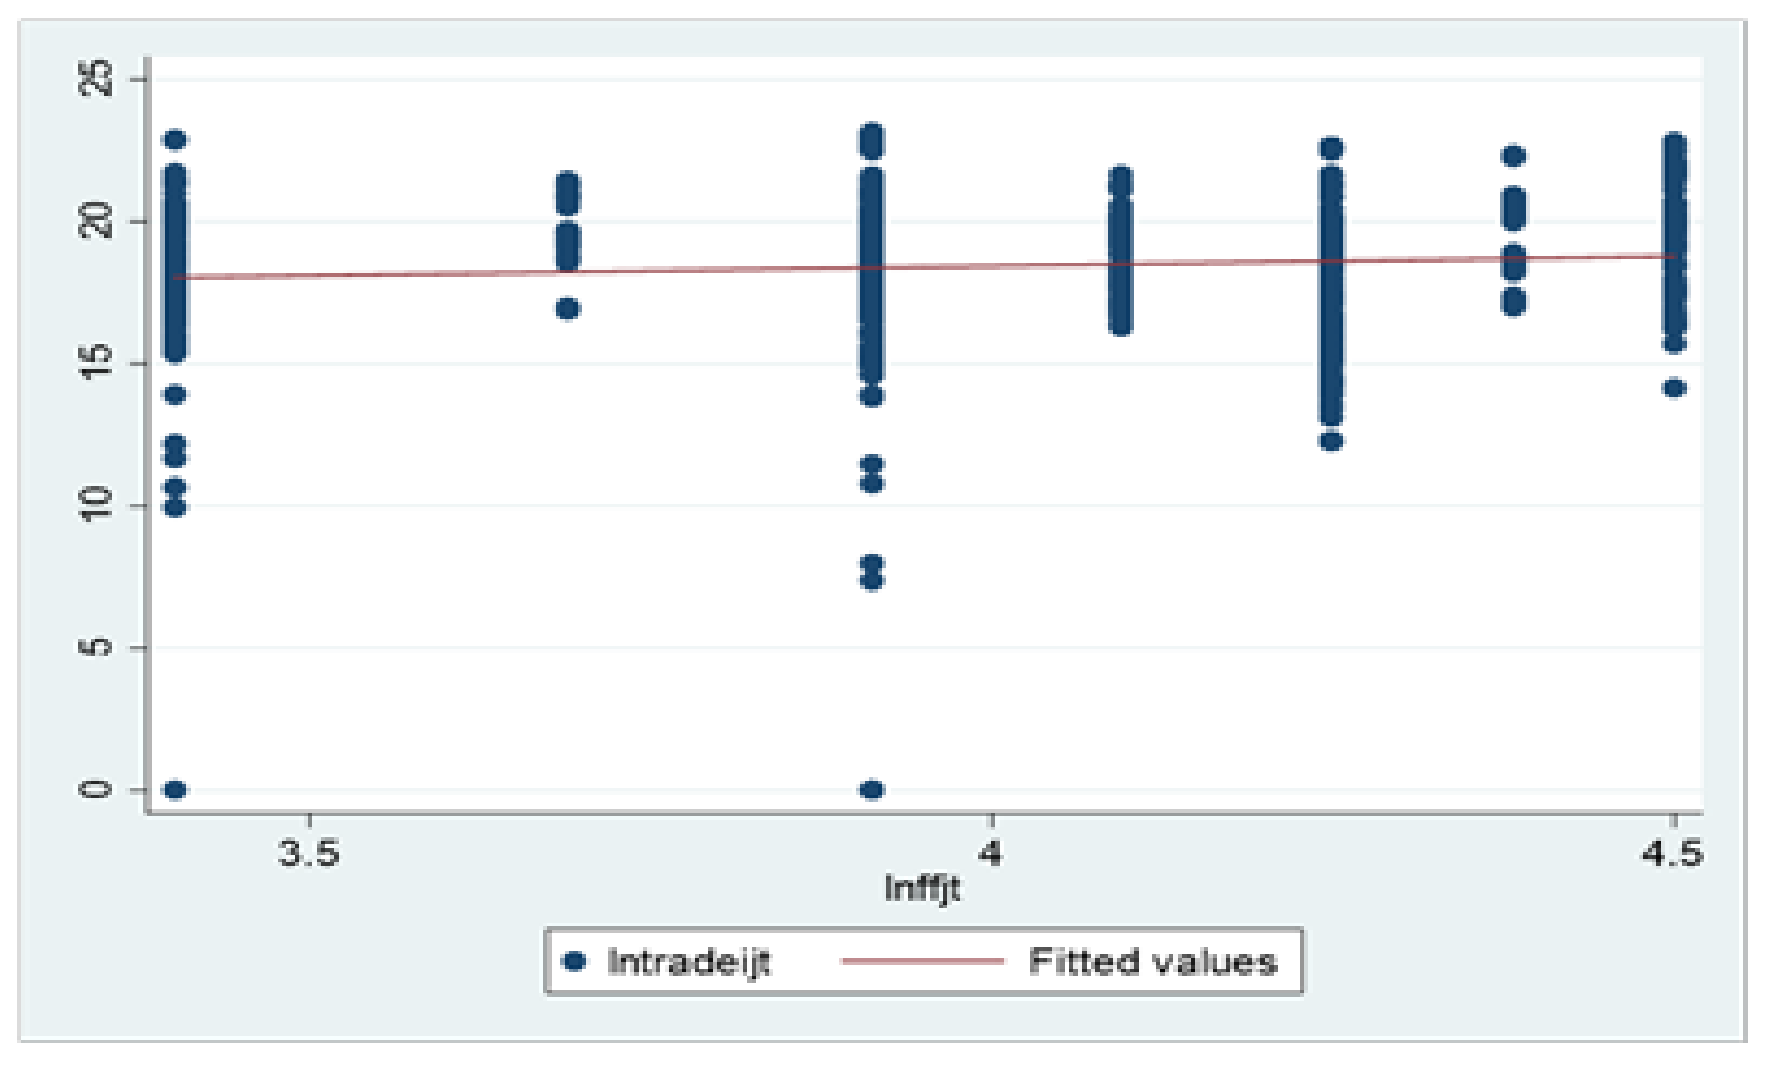
Based on the theory of transaction cost economics, the paper puts forward the hypothesis. To observe whether there is a causal relationship between the data of the main explanatory variables and the dependent variable as discussed above, a scatter diagram was drawn for preliminary observation. Figure 1, Figure 2, Figure 3 and Figure 4 show the correlation between the trust of trading partner, trade freedom, monetary freedom and financial freedom and the scale of China’s agricultural export. The scatter diagrams show the informal institutional variables and formal institutional variables included in the model are positively correlated with the scale of China’s agricultural export trade. That is to say, the higher the trust, trade freedom, monetary freedom and financial freedom of countries (regions), the larger the scale of China’s agricultural exports.
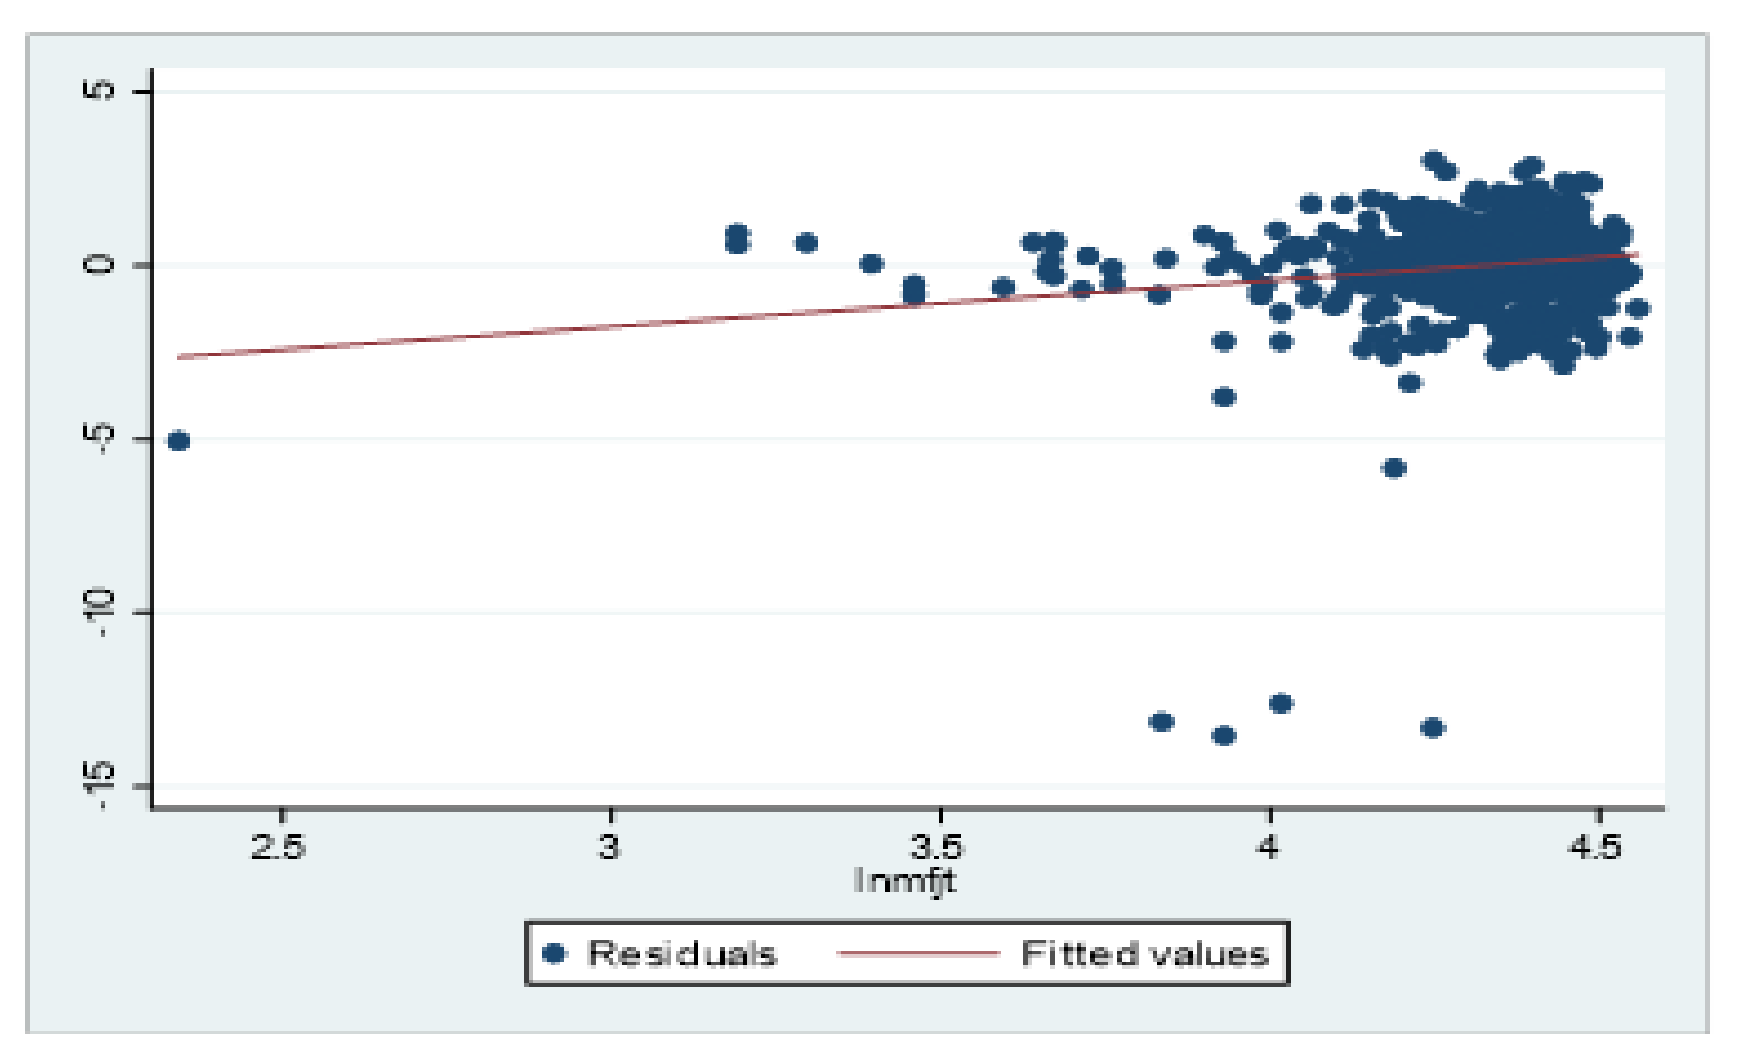
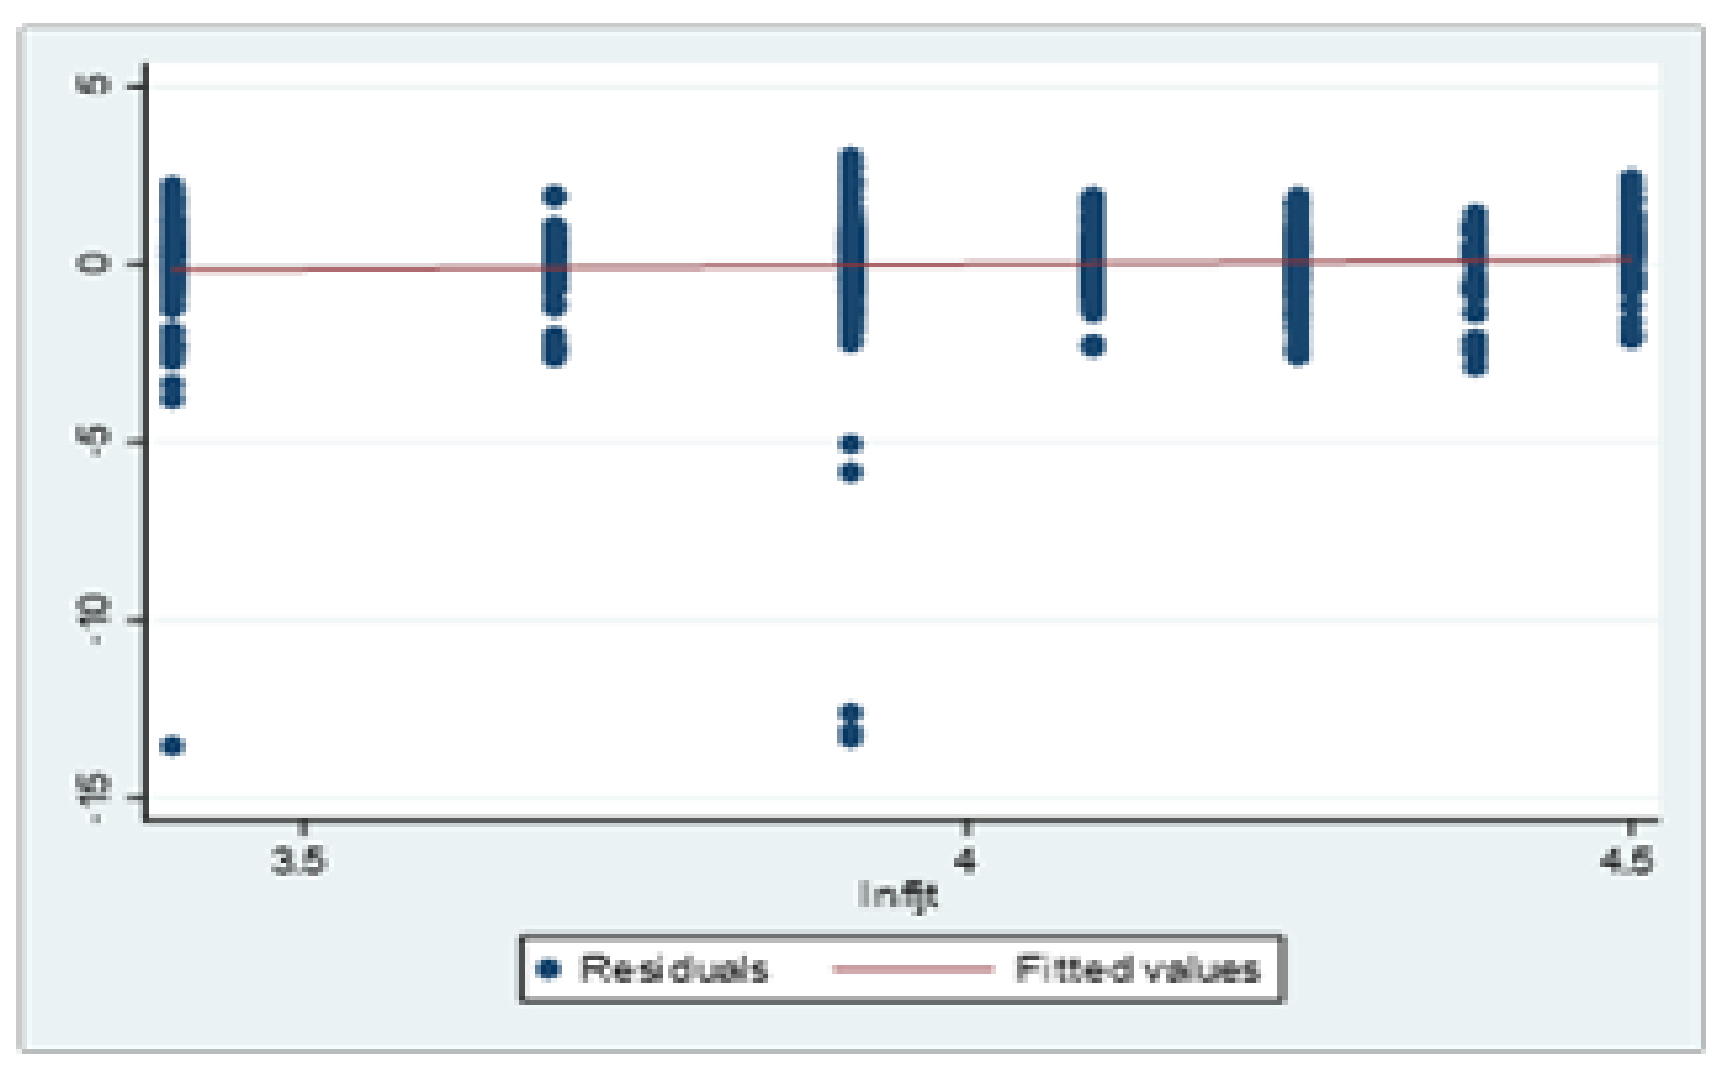
In order to further investigate the correlation between these institutional variables and China’s agricultural exports, we excluded these institutional variables in model (1), calculated the residuals (e) after least square estimation, and drew the scatter diagram of the residuals and the trust, trade freedom, monetary freedom and financial freedom of trading partners, respectively (Figure 5, Figure 6, Figure 7 and Figure 8). We also calculated the correlation coefficients between these institutional variables and China’s agricultural exports and residuals (Table 2). Combined with the scatter diagram and correlation coefficient, it can be seen that there is a positive correlation between institutional variables and China’s agricultural exports, in which the correlation coefficient between trust and China’s agricultural exports is 0.2414; these institutional variables also have a positive correlation with residuals(e), in which the correlation coefficient between trust and residuals is 0.0703, and the correlation coefficient between monetary freedom and residuals is 0.1989. It shows that these institutional variables are the factors of China’s agricultural exports, which should be included into the econometric model for further empirical test.
Although the results of scatter plots are interesting, they may not carry much conviction. This is only a preliminary judgment, and whether there is a causal relation between the main explanatory variables and the dependent variable remains to be tested by using the econometric model constructed.

4.2. Benchmark Regression

The paper incorporates informal institutional factors, such as trust and formal institutional factors, such as economic freedom into an extended trade gravity model. Stepwise regression was used. On the basis of controlling the common variables of the gravity model, we added the level of trust trading partners (lntrustjt), trade freedom (lntfjt), monetary freedom (lnmfjt) and financial freedom (lnffjt) step by step to test whether the estimation coefficient is robust. Table 3 reports the results of stepwise regression using the OLS estimation method. On the whole, F-test statistics and p-values indicate that the regression equation is significant. The adj-R2 of the model increases when we gradually add different institution variables indicating that the degree of fitting is improved.
The signs of the variables of the traditional gravity model in models (1)–(4) are in line with the theoretical expectations and with the estimation results of many scholars and all these coefficients are statistically significant. The model (4) is explained below as an example. The estimated coefficients of China’s GDP (lngdpit) and its trading partner’s GDP (lngdpjt) are 0.9898 and 0.9662, respectively, which means that China’s GDP increases of 1% drive the scale of China’s agricultural export to increase by 0.9898%. Every 1% increase in the GDP of a trading partner drives the scale of China’s agricultural export to increase by 0.9662%. This is consistent with the results of previous works. The coefficient of the bilateral distance (lndistwij) is negative and very significant. This is basically consistent with the estimated coefficient size in the trade regression based on gravity model by Mayer and Zignago [29]. The estimated coefficient of bilateral per capita GDP gap (lnedijt) is −0.4788, which passes the 1% significance level test, indicating that the larger income gap between China and its trading partner hinders China’s agricultural exports, while the smaller income gap promotes them. It conforms to Linder’s theory of similar preferences [27]. The coefficient of abslnatitudeij is 0.3102 and significant at 1% level, which means that the absolute value of latitude difference between China and its partner increasing by 1% will drive 0.3102% increase in China agricultural products. The difference of geographical production conditions forms heterogeneous agricultural products, which makes the trade more complementary and more conducive to China’s agricultural exports. The coefficient of agricultural development (lnargjt) of trading partner is −0.3126 and very significant, which means that, when the proportion of agricultural value added in GDP of trading partners increases by 1%, China’s agricultural exports decreases by 0.3126%. This shows that, if the trading partner has a higher self-sufficiency rate of agricultural products, it reduces imports, thus inhibiting China’s agricultural exports. The coefficient of real exchange rate (lnrerijt) between China and its trading partner is −0.1007, which is statistically significant at the level of 1%, indicating that every 1% appreciation of RMB against foreign currencies reduces China’s agricultural exports by 0.1007%. The estimated result is consistent with the theoretical expectation. It means that the appreciation of RMB to foreign currencies reduces the export competitiveness of China’s agricultural products and does harm to the growth of the export scale of agricultural products.
We also find that whether a trading partner is adjacent to China has a positive and significant impact on China’s agricultural exports, which indicates that China’s agricultural exports also have a proximity effect. The sign of economic crisis in Table 2 is negative, but not significance can be traced to the demand income inelasticity of agricultural products. The shock of crisis will exert little influence on export of agricultural products.
In addition, how the members of the WTO affect the trade value remains unclear. This result is in conformity to those of Rose [33,34] and Wang et al. [14], which study Chinese trade as a whole, but are not completely in line with that of Dutt [34]. The results of Rose [33,34] showed that WTO membership affects slightly the bilateral trade value. After considering trade agreements effects varying with time, Dutt [35] adopts a semi-parametric empirical method and holds that WTO membership positively affects bilateral trade if both are members, otherwise it produces a negative effect if neither of parties is a member. If one side is a member and the other is not, then the effect is insignificant. Earlier in the study of Subramanian and Wei [36], WTO membership boosts trade unevenly and mainly in developed countries. What we do differently in the paper is that we focus on export of Chinese agricultural goods and China is a developing country. The insignificance of coefficient may be attributable to three points. First, China has fulfilled its WTO commitments after the accession in 2001 and reduced the tariff rate of agricultural products. However, the tariff rate of agricultural products from developed members is still high. According to The White Paper on China and the World Trade Organization (2018), China gradually reduced the tariffs on agricultural products after 2001. By 2010, the average tariff rate on agricultural products has decreased from 23.2% to 15.2%, which is far lower than the average tariff level of 56% in developing members and 39% in developed members. China’s reduction in agricultural tariffs has a great impact on agricultural imports, but impacts little on exports, while the higher tariff rates from developed members have an adverse impact on China’s agricultural exports. Second, although the WTO requires all members to reduce tariffs, various non-tariff barriers often appear as substitute measures for protectionism. Among the main markets of China’s agricultural products export, developed countries (regions), such as Japan, the United States and the European Union, which are members of the WTO, take non-tariff measures, such as green trade barrier (GBT) and upscale sanitary and phytosanitary (SPS) standards, to restrict China’s agricultural products export. Third, under the multilateral trading system of the world trade organization, the parties to the negotiations on the liberalization of agricultural trade diverge a great deal, and the progress has been slowed since the Doha round of agricultural negotiations. Under this context, bilateral or regional trade freedom agreements weaken the multilateral importance of WTO as an international organization.
The paper focuses on the impact of trade partners’ trust on the scale of China’s agricultural export. On the basis of the extended gravity model, by adding the trade partner trust and observing the model (1), we can find that after controlling the above variables, the coefficient of trade partner trust (lntrustjt) says both economic and statistical significance, and the estimated coefficient is 0.2196 and significant at 1% level. This preliminarily verifies the fact that the trust of trading partner does have an impact on the scale of China’s agricultural export trade. In order to further test whether the trust estimation coefficient of trading partner is robust, we further added formal institutional variables, such as trade freedom of trading partner (lntfjt), monetary freedom (lnmfjt) and financial freedom (lnffjt). It is found that the estimation coefficient of trust is still positive and very significant, only a small change in the estimation coefficient, which is generally more robust. The coefficient of determination (adj-R2) of the model increased slightly, indicating that the regression line fitted the data better.
In model (4), the level of trust of trading partner’s 1% increases leads to 0.2068% increase in the scale of China’s agricultural export. This means that, if the level of trust of trading partner is improved, it becomes a booster for the development of China’s agricultural export resulting in trade creation effect and promoting the increase in the scale of China’s agricultural export. On the contrary, the decline of trade partner’s trust level becomes a stumbling block to the development of China’s agricultural export and produce trade barrier effect to inhibit the development of China’s agricultural export. This confirms the hypothesis in the paper. As stated in the previous theoretical part, the influence mechanism of trust on trade effect is that the level of trust determines the size of transaction costs which directly affects trade profits. Rational traders always carry out trading activities with the goal of maximizing profits. A higher level of trust reduces transaction costs throughout the whole process of transaction and increases trade profits thereby promoting trade development. Conversely, a lower level of trust hinders trade. The empirical results clearly show that the trust of the informal institution, which has been neglected in previous studies, is also an important factor affecting agricultural trade. In addition, the coefficient of the trading partner’s monetary freedom (lnmfjt) is positive and significant at the 1% level. Monetary freedom here mainly measures the stability of prices, indicating that the more stable the price level of trading partner is, the more conducive it is to China’s agricultural exports. At the same time, the signs of the coefficients of trade freedom (lntfjt) and financial freedom (lnffjt) of trading partner are consistent with theoretical expectations, but they are not statistically significant. It is possible that the endogeneity of variables affects the estimated results, which will be examined further.

4.3. Two Stage Least Squares Test Based on Instrumental Variable

The core explanatory variable of this paper measures the basic trust of a country (region), although it cannot directly measure the level of trust of a country (region) toward China, it alleviates the concern of reverse causality to some extent. Although the trade of agricultural products between a country (region) and China is unlikely to affect its basic trust, it may cause endogenous problems due to the measurement error. The paper searches for instrumental variable (IV) of trust to mitigate the endogeneity. According to the theory of econometrics, the IV of trust should satisfy two conditions: related to the endogenous variable (trust) and unrelated to the disturbance error of the model. In empirical research, the lag value of endogenous explanatory variables is often chosen as the proxy of IV. However, the lag value of endogenous explanatory variables cannot be taken as proxy because the value of variable trust of some countries in the paper is not completely consistent in each survey cycle as aforementioned. Studies have shown that the historical fractionalization of ethnic groups in a country (region) hinders the formation of trust. The concentration of ethnic groups promotes the formation of trust [37,38,39]. The concentration of ethnic groups in these countries (regions) has a direct impact on trust, but it is unlikely to affect China’s agricultural exports to these countries (regions) through other channels. In particular, the paper uses the Herfindahl–Hirschman Index (HHI), which reflects the historical concentration of ethnic groups in a country (region), as an IV of the level of trust of trading partner. A country (region) can be regarded as a collection of different ethnic groups. Alesina et al. [38] calculate the ethnic fractionalization index of a country (region) based on historical data, such as the Encyclopaedia Britannica. The ethnic data cover 650 different ethnic groups in 190 countries (regions). The paper uses the ethnic fractionalization index to calculate the HHI, which reflects the degree of ethnic concentration. The formula is:
H H I = i = 1 M ( n i / N ) 2 , i = 1 , , M
where, N is the total population of a country (region), ni is the number of the ith ethnic group, and M is the number of ethnic groups. For a given number of social groups, the index measures the probability that two individuals randomly selected from the country (region) belonging to the same ethnic group. Data were obtained from Alesina et al. [38].
We do two things before regression. Firstly to test whether the core explanatory variable of this paper, the trust of trading partner, is endogenous, and then test the validity of the IV. The results are reported in Table 4. In models (1)–(4), the χ2 (1) statistics of endogeneity test and the corresponding p value show that the null hypothesis that the trust variable is exogenous can be significantly rejected at the level of 10%, indicating that the trust of trading partners is endogenous and should be regressed with IV. To be more general, we do not make the assumption of iid in the disturbance term here, and heteroscedasticity is allowed. The results of the under-identification test shows that the p value corresponding to the Kleibergern–Paap rk Wald LM statistic was 0.0000, which rejects the null hypothesis of unidentifiability, indicating that the IV is related to the explanatory variables. Weak identification test results show that the Kleibergern–Paap rk Wald F value is greater than the 15% critical recommended by Stock and Yogo [40], indicating that there is no weak identification. This IV has significant explanatory power for the endogenous explanatory variable (lntrustjt). The above tests show that the IV selected is valid.
In Table 4, we also report the estimation results of instrumental variable two-stage least squares (IVTSLS) estimation and stepwise regression using heteroscedastic robust standard error by referring to the method of Baum et al. [41]. The estimated coefficient of trust in trading partners is positive and significant in models (1)–(4), and is relatively stable with statistical and economic significance regardless of whether other institutional control variables are taken into consideration. All the results once again verify the hypothesis we proposed, and also confirm the view that trust is positively correlated with trade volume put forward by Nupia [10] after analyzing and demonstrating the game model. Heterogeneous effects at different quartiles of export scale remain to be further extracted. In the model (4), the trust coefficient of trading partners is significantly positive, and demonstrates obvious trade creation effects. If the trust level of partners increases by 1%, China’s agricultural exports to that market increase by 1.2268%. The result is slightly larger than the coefficient (0.7891%) of Wang et al. [14] using IVGMM to estimate the trust of trading partners on China’s total exports. This may be due to the fact that this paper only selected the samples of China’s agricultural exports compared with the full sample of China’s total exports selected by Wang et al. [14] (2019). Due to differences in geographical location and factor endowment advantages, although there is complementarity to some extent in agricultural products among countries (regions), which is conducive to the occurrence of bilateral trade, there is also a certain degree of substitution in agricultural products, which leads to more intense competition in the export market, thus leading to a more sensitive export of agricultural products to the trust level of trading partner. At the same time, the estimation coefficient of instrumental variables (IV) is larger than that of OLS. This is similar to the results of Den Butter and Mosch [7], Guiso et al. [19], and Xing and Zhou [15] using IVTSLS to estimate the impact of trust on bilateral or unilateral trade in major European countries and provincial trade in China. The difference between the coefficients estimated by OLS and IVTSLS may be due to the fact that the trust measure is a noise measure of the true trust in trading partners, and the increase in the estimated coefficient is caused by the decrease in the standard deviation of attenuation when measuring variables. If so, the true trade effect is closer to the result estimated by IV [19]. Xing and Zhou [15] argue that, in general, OLS estimates underestimate the real causal effect of trust on trade, and IVTSLS can estimate the actual size of the effect. To sum up, although the confidence coefficient estimated by the instrumental variable method here may be overestimated, it is an undeniable fact that trust, an informal institution, does have an impact on international trade in agricultural products. Empirical evidence based on China shows that a lower trust between trading partners leads to a trade hindrance effect, while higher trust leads to a trade creation effect.
After controlling the endogeneity of the trust variable, the estimated coefficient of trade freedom (lntfjt) of trading partner is significantly positive indicating that if trading partners reduce tariff and non-tariff barriers and promote trade liberalization of agricultural products, it will be beneficial to the expansion of agricultural products export. At the same time, the estimated coefficient of monetary freedom of trading partner (lnmfjt) is still significantly positive, while the estimated coefficient of financial freedom of trading partner (lnffjt) is positive, but not significant. In combination with the results of the baseline regressions, this shows that the degree of independence of financial institutions of trading partner and the efficiency of the banking sector have no significant impact on the scale of China’s agricultural export. The estimation coefficients of other variables were basically consistent with those of the baseline regression. After controlling the endogeneity, among the institutional factors, the trust of trading partner, the improvement of trade freedom and monetary freedom have a positive impact on the scale of China’s agricultural export and have statistical and economic significance. That is to say, if the trading partner has high trust, low rate of tariff and non-tariff barriers, and stable prices, the scale of China’s agricultural export increase significantly. In addition, the results of other controlled variables basically keep in line with that of benchmark regression only see a little difference in coefficients. Among them, the coefficient of trade effect of WTO members presents a positive sign, but still insignificant, which demonstrates trade parties WTO membership is not in the line of the main factors.

4.4. Heterogeneity Test

  • Quartile Regression Test
The essence of OLS regression is on the value of sample mean. The term of random disturbance is assumed to be homoscedastic and normal distribution. Koenker and Bassett [42] (1978) relax this assumption and propose the idea of linear quartile regression. The core lies in regression of the independent variable according to the conditional distribution of the dependent variable, thus determining the linear relationship between the independent variable and the dependent variable at different quartiles. The quartile regression can produce robust estimation for non-normal distributions and extreme values of data. We adopt the quartile regression estimation method to clearly depict the heterogeneous impact of partner’s trust on the scale of China’s agricultural export at different quartiles. To make the estimation result more accurate, we tested firstly the existence of heteroscedasticity and then report the results of heteroscedasticity robust standard error according to the method proposed by Machado and Santos Silva [43].
Table 5 reports the results of quartile estimation of Equation (1). Under the control of heteroscedasticity, the influence of trust level of trading partner on each quartile is significantly positive, with both statistical and economic significance indicating that high trust of trading partner has trade creation effect. It verifies the hypothesis we put forward. The estimated coefficients of quartile regression are different at each quartile, which fully shows that the trust of partner does have a heterogeneous impact on the scale of China’s agricultural export at different quartiles. The trade creation effect is more obvious at the lower quartile and weaker at the higher quartile. At each quartile, the coefficients of trust of partner estimated by quartile regression are generally slightly larger than those estimated by OLS method of model (4) in Table 3. The reason is that the essence of OLS regression is a kind of sample mean regression, and its minimum objective function is the sum of squares of residuals (SSR), which is easily affected by extreme values. The minimum objective function of quartile regression is the weighted average of the absolute values of residuals, which is not easily affected by extreme values, so it is more robust. Comparing the coefficient of different quartiles, we can see that the trade creation effect of the trust of partner is more obvious at 0.25 and 0.5 quartiles. By contrast, the robust standard error of heteroscedasticity at the 0.5 quartile is smaller reflecting higher estimation accuracy at the center of the distribution. In the regression estimation of formal institutional variables such as trade freedom, monetary freedom and financial freedom at the 0.5 quartile, the estimated results are consistent with expectations, positive and statistically and economically significant.
  • Quartile Regression Test Based on the Control Function Method
Because of the endogeneity of core explanatory variables in the previous Section, we used the method of Ma and Koenker [44] and Lee [45] to construct a semi-parametric quartile regression model by using the control function method to solve the endogenous variable problem in quartile regression. The Herfindahl–Hirschman Index (HHI) reflects the degree of ethnic concentration calculated above and was still used as an instrumental variable of trust. Additionally, we then conducted a two-stage quartile regression. Drawing from the approach of Kim and Muller [46], in the first and second stage, we used the same quartile for quartile regression, which ensures the robustness of the estimation procedure. More specifically, the first step is to establish a quartile regression equation with the trust of partners as the dependent variable, the instrumental variable HHI and the control variable in Equation (1). Additionally, we then conducted quartile regression at different quartiles and calculated the residuals at different quartiles. In the second step, the residuals are introduced into Equation (1) as a new explanatory variable, and the estimated coefficients were obtained by the quartile regression of different quartiles.
Table 6 reports estimation results. After controlling a series of other variables affecting the scale of China’s agricultural exports and using heteroscedastic robust error for quartile regression estimation, it can be found that the core explanatory variable trust of partners, which is the focus of the paper, is significantly positive at other quartiles except 0.9, and has statistical and economic significance. It presents a very obvious trade creation effect. This confirms the hypothesis once again. There are also significant differences in the estimated coefficients at each quartile, which illustrates that the trust of partners has heterogeneous effects at different levels of China’s agricultural export. The estimated coefficients at lower quartiles are larger means that the trade creation effect is more obvious, and vice versa. The reason behind this is that, under a transnational (regional) unfamiliar business environment, the initial cooperation between the two sides of the trade is often in a state of uncertainty, and the purchase of foreign products by the importing country (region) is more likely to be tentative often starting from a small volume [47]. Despite the small volume, it requires a high level of trust from trading partners to ensure a successful transaction. At the 0.5 quartile, the coefficient of the trust is very close to the estimated result of the model (4) in Table 4 based on the instrumental variable two-stage least squares (IVTSLS) regression, and the smaller standard error makes the estimated coefficient more significant. The coefficients of trade freedom, monetary freedom and financial freedom estimated are also very similar to the estimated results of model (4) in Table 4. In most cases, the sign is positive and shows statistical and economic significance. The sign and size of the estimated coefficients of other control variables are basically the same as those of the previous estimates, with slight differences.
In order to further test whether the estimation results are robust, we tested again after changing the sample size. Table 7 reports the results based on the control function method for the sample excluding Hong Kong, China. The estimated coefficients of the core explanatory variable, partner’s trust, at 0.25, 0.5 and 0.75 are still significantly positive, and the size of the coefficient is very close to that in Table 6, with statistical and economic significance. The coefficients both in size and significance of trade freedom, monetary freedom and financial freedom are also similar to those in Table 6. To sum up, the results of quartile regression test based on the control function method verify once again the robustness of previous estimation.

5. Conclusions and Insights

With the purpose of investigating the influence of a trade partner’s trust on the scale of China’s agricultural export trade, the paper integrates the trust of the informal institution into the analysis framework, puts forward a research hypothesis based on the theory of transaction cost economics, constructs the extended gravity model, and makes an empirical test by using the data of China’s agricultural export to 45 countries (regions). The main findings are: (1) bilateral economic scale and latitude difference significantly promote China’s agricultural export, while bilateral economic gap, real exchange rate and agricultural development of a trading partner significantly hinder China’s agricultural export; and (2) the higher level of trust of trade partners, the larger the growth of China’s agricultural export. The level of trust of partners affects the size of transaction costs. Low trust is as a stumbling block to trade development, which increases transaction costs and hinders the expansion of export. High trust is a form of a booster for trade development, reducing transaction costs and increasing the scale of trade. The trust of trading partner has a heterogeneous impact on the scale of China’s agricultural export at different quartiles, and the trade creation effect is more obvious at the lower quartiles, but weaker at the higher quartiles. In addition, trade freedom and currency freedom of trading partners positively affect the size of China’s agri-exports.
Some implications and insights can be drawn from the results: when exporting agricultural goods, China should not only consider the economic scale of a partner, the agricultural development, latitude differences, and real exchange rate, but also consider formal institutional factors, such as trade and monetary freedom. The country should especially put emphasis on the impact of informal institutions, such as trust. It is necessary to enhance trust and cooperation in agricultural trade. At present, while the scale of China’s agricultural export continues to expand, the scale of imports has also increased substantially, and the trade deficit has been widening. China should know the trust level and consumption preferences of export destinations and export agricultural products with comparative advantages of its own. Moreover, various approaches should be undertaken to promote the understanding of China’s history, culture and enhance trust levels by the source of imports to expand the scale of bilateral trade. With the implementation of the “Belt and Road” initiative, there is great potential for the development of agricultural trade between China and the countries along the “Belt and Road” for high complementarity in agriculture and similar in consumption. The people-to-people tie is a key to the trust development of bilateral trade. China can rely on the “Belt and Road” Initiative International Cooperation Summit Forum to establish dialogue mechanisms with countries along the line, increase bilateral and multilateral exchanges, and narrow cultural barriers. It is imperative to establish closer people-to-people ties to enhance mutual trust and reducing international transaction costs. China is advised to increase trade cooperation in agricultural products, jointly build infrastructure along the “Belt and Road”, reduce logistics and transportation costs, and promote smooth trade in agricultural products, and so as to enjoy mutual benefit and win–win results.

Author Contributions

Supervision, C.Q.; Writing—original draft, H.C. All authors have read and agreed to the published version of the manuscript.

Funding

This paper is supported by the National Social Science Fund Project of China “Research on Reforming the Price Formation Mechanism of Agricultural Products” (Project No.16BJY136), the Special Fund Project for Basic Scientific Research Business of the Central Universities “Research on Ensuring Effective Supply of Important Agricultural Products under the Normalization of Epidemic Prevention and Control” (Project No.2662020JGPY001), the Guangxi Philosophy and Social Sciences Planning Project “Research on the Economic Effects and Countermeasures of Sino-US Trade Friction—The Way Out from Innovation Induced by Domestic Demand” (Project No.20FJL011), and the Major Scientific Research Project of Wuzhou University “Research on the Upgrading of China’s Export Structure of Manufactured Goods under Sino-US Trade Friction—From the Perspective of Great Power Effect” (Project No.2018A002).

Institutional Review Board Statement

Not applicable.

Informed Consent Statement

Not applicable.

Data Availability Statement

We haven’t created any new data. All data are available in public.

Acknowledgments

This paper has received helpful comments from Zhong Changbiao, a distinguished professor of Changjiang Scholars of the Ministry of Education in China. The paper is also honored to have been presented at the 5th China Academic Forum of World Economic Experts and Young Scholars hosted by the Institute of World Economics of Fudan University, the Key Research Base of Humanities and Social Sciences of the ministry of education. We thank Feng Xiaoming of the Chinese Academy of Social Sciences and other experts for their useful comments. We also thank three anonymous referees for their useful feedback on the paper and editor’s work. We thank Yan Wenshou (Zhongnan University of Economics and Law), Zhang Jianzhong, Zhu Xiaoming and Wei Yonggui (Guangxi University of Finance and Economics) for their useful discussions. The views expressed in this paper are those of the authors. All errors are those of the authors themselves.

Conflicts of Interest

The authors declare no conflict of interest.

References

  1. Dearmon, J.; Grier, K. Trust and Development. J. Econ. Behav. Organ. 2009, 2, 210–220. [Google Scholar] [CrossRef]
  2. Xie, F.; Zhang, B.; Zhang, W. Trust, Innovate, Grow. Available online: https://ssrn.com/abstract=2803220 (accessed on 13 November 2021).
  3. Kondo, J.; Li, D.; Papanikolaou, D. Trust, Collaboration, and Economic Growth. Manag. Sci. 2021, 3, 1825–1850. [Google Scholar] [CrossRef]
  4. Lü, C.; Chen, H.; Santos, L. Social Trust, Incomplete Contracts and Long-term Growth. Econ. Res. J. 2019, 3, 4–20. [Google Scholar]
  5. Arrow, K.J. Gifts and Exchanges. Philos. Public Aff. 1972, 4, 343–362. [Google Scholar]
  6. Zak, P.J.; Knack, S. Trust and Growth. Econ. J. 2001, 470, 295–321. [Google Scholar] [CrossRef]
  7. Butter, F.; Mosch, R. Trade, Trust and Transaction Costs; Tinbergen Institute Working Paper: Amsterdam, The Netherlands, 2003. [Google Scholar]
  8. Spilker, G.; Schaffer, L.; Bernauer, T. Does Social Capital Increase Public Support for Economic Globalization? Eur. J. Polit. Res. 2012, 6, 756–784. [Google Scholar] [CrossRef] [Green Version]
  9. Kaltenthaler, K.; Miller, W.J. Social Psychology and Public Support for Trade Liberalization. Int. Stud. Q. 2013, 57, 784–790. [Google Scholar] [CrossRef] [Green Version]
  10. Nupia, O. Trust and Trade. Available online: https://ssrn.com/abstract=1485835 (accessed on 13 November 2021).
  11. Yu, S.; Beugelsdijk, S.; de Haan, J. Trade, trust and the rule of law. Eur. J. Polit. Econ. 2015, 37, 102–115. [Google Scholar] [CrossRef]
  12. Roy, D.; Munasib, A.; Chen, X. Social trust and international trade: The interplay between social trust and formal finance. Rev. World Econ. 2014, 150, 693–714. [Google Scholar] [CrossRef]
  13. Zhao, J.; Chi, J. Trust, Formal Institution and China’s Foreign Trade Development—Evidence from 65 Countries. China Soft Sci. 2014, 1, 43–53. [Google Scholar]
  14. Wang, C.; Li, Z.; Zhong, T. Social Trust, Rule of Law, and Economic Exchange: Evidence from China and Its Major Trading Partners. Emerg. Mark. Financ. Trade 2019, 55, 3134–3150. [Google Scholar] [CrossRef]
  15. Xing, W.; Zhou, L.-A. Bilateral trust and trade: Evidence from China. World Econ. 2018, 41, 1918–1940. [Google Scholar] [CrossRef]
  16. Wang, Y.; Sheng, D. Social Trust and Export Comparative Advantage: An Empirical Investigation Based on IVTSLS and PSM Method. J. Int. Trade 2010, 10, 64–71. [Google Scholar]
  17. Cingano, F.; Pinotti, P. Trust, Firm Organization, and the Pattern of Comparative Advantage. J. Int. Econ. 2016, 100, 1–13. [Google Scholar] [CrossRef]
  18. Ndubuisi, G.O. Contractual Frictions and the Patterns of Trade: The Role of Generalized Trust. J. Int. Trade Econ. Dev. 2020, 7, 775–796. [Google Scholar] [CrossRef] [Green Version]
  19. Guiso, L.; Sapienza, P.; Zingales, L. Cultural Biases in Economic Exchange. Q. J. Econ. 2009, 3, 1095–1131. [Google Scholar] [CrossRef] [Green Version]
  20. Rauch, J.E. Networks versus markets in international trade. J. Int. Econ. 1999, 48, 7–35. [Google Scholar] [CrossRef] [Green Version]
  21. Hirsch, F. Social Limits to Growth; Harvard University Press: Cambridge, MA, USA, 1976. [Google Scholar]
  22. Fang, H.; Zhao, T. Does Cultural Difference Influence Agricultural Product Trade—A Research Based on the Countries along the Belt and Road. Int. Econ. Trade Res. 2018, 9, 64–78. [Google Scholar]
  23. Dasgupta, P.S. Trust as a Commodity. In Trust: Making and Breaking Cooperative Relations; Gambetta, D., Ed.; Basil Blackwell: Oxford, UK, 2000; pp. 49–72. [Google Scholar]
  24. Anderson, J.E. The Gravity Model. Annu. Rev. Econ. 2011, 1, 133–160. [Google Scholar] [CrossRef] [Green Version]
  25. Sheng, B.; Liao, M. Trade Flow and Export Potential in China: A Study of Gravity Model. J. World Econ. 2004, 2, 3–12. [Google Scholar]
  26. Bjørnskov, C. Determinants of generalized trust: A cross-country comparison. Public Choice 2007, 130, 1–21. [Google Scholar] [CrossRef]
  27. Linder, S.B. An Essay on Trade and Transformation; Almqvist & Wiksell: Stockholm, Sweden, 1961. [Google Scholar]
  28. Head, K.; Mayer, T. Illusory Border Effects: Distance Mismeasurement Inflates Estimates of Home Bias in Trade. In CEPII Working Papers 2002-01; CEPII Research Center: Paris, France, 2002. [Google Scholar]
  29. Mayer, T.; Zignago, S. Notes on CEPII’s Distances Measures: The GeoDist Database. In CEPII Working Papers 2011-25; CEPII Research Center: Paris, France, 2011. [Google Scholar]
  30. La Porta, R.; Florencio, L.; Shleifer, A.; Vishny, R. The Quality of Government; NBER Working Paper No. 6727; National Bureau of Economic Research: Cambridge, MA, USA, 1998. [Google Scholar]
  31. Zhu, S.; Duan, F.; Shao, X.; Zhong, T. Informal Institutions, Generalized Morality and Quality of Export Products. J. World Econ. 2019, 8, 121–145. [Google Scholar]
  32. Chen, Q. Advanced Econometrics and Stata Applications, 2nd ed.; Higher Education Press: Beijing, China, 2014. [Google Scholar]
  33. Rose, A.K. Do We Really Know That the WTO Increases Trade? Am. Econ. Rev. 2004, 94, 98–114. Available online: https://www.aeaweb.org/articles?id=10.1257/000282804322970724 (accessed on 13 November 2021). [CrossRef] [Green Version]
  34. Rose, A.K. Do We Really Know That the WTO Increases Trade? Reply. Am. Econ. Rev. 2007, 97, 2019–2025. [Google Scholar] [CrossRef]
  35. Dutt, P. The WTO is not passé. Eur. Econ. Rev. 2020, 128, 103507. [Google Scholar] [CrossRef]
  36. Subramanian, A.; Wei, S.J. The WTO promotes trade strongly, but unevenly. J. Int. Econ. 2007, 1, 151–175. [Google Scholar] [CrossRef] [Green Version]
  37. Knack, S.; Keefer, P. Does Social Capital Have an Economic Payoff? A Cross-Country Investigation. Q. J. Econ. 1997, 112, 1251–1288. [Google Scholar] [CrossRef]
  38. Alesina, A.; Devleeschauwer, A.; Easterly, W.; Kurlat, S.; Wacziarg, R. Fractionalization; NBER Working Paper No. 9411; National Bureau of Economic Research: Cambridge, MA, USA, 2002. [Google Scholar]
  39. Delhey, J.; Newton, K. Predicting Cross-National Levels of Social Trust: Global Pattern or Nordic Exceptionalism? Eur. Sociol. Rev. 2005, 21, 311–327. [Google Scholar] [CrossRef]
  40. Stock, J.; Yogo, M. Testing for Weak Instruments in Linear IV Regression. In Andrews DWK Identification and Inference for Econometric Models; Cambridge University Press: New York, NY, USA, 2005; pp. 80–108. [Google Scholar]
  41. Baum, C.F.; Schaffer, M.E.; Stillman, S. Enhanced Routines for Instrumental Variables/GMM Estimation and Testing. Stata J. 2007, 4, 465–506. [Google Scholar] [CrossRef]
  42. Koenker, R.; Bassett, G. Regression Quartiles. Econometrica 1978, 1, 33–50. [Google Scholar] [CrossRef]
  43. Machado, J.; Santos Silva, J. Glejser’s Test Revisited. J. Econom. 2000, 1, 189–202. [Google Scholar] [CrossRef]
  44. Ma, L.; Koenker, R. Quartile Regression Methods for Recursive Structural Equation Models. J. Econom. 2006, 2, 471–506. [Google Scholar] [CrossRef] [Green Version]
  45. Lee, S. Endogeneity in Quartile Regression Models: A Control Function Approach. J. Econom. 2007, 2, 1131–1158. [Google Scholar] [CrossRef] [Green Version]
  46. Kim, T.H.; Muller, C. Two-Stage Quartile Regression When the First Stage is Based on Quartile Regression. Econom. J. 2004, 1, 218–231. [Google Scholar] [CrossRef]
  47. Rauch, J.; Watson, J. Starting Small in an Unfamiliar Environment. Int. J. Ind. Organ. 2003, 21, 1021–1042. [Google Scholar] [CrossRef] [Green Version]
Figure 1. Scatter plot of lntrustjt and lntradeijt.
Sustainability 14 00729 g001
Figure 2. Scatter plot of lntfjt and lntradeijt.
Sustainability 14 00729 g002
Figure 3. Scatter plot of lnmfjt and lntradeijt.
Sustainability 14 00729 g003
Figure 4. Scatter plot of lnffjt and lntradeijt.
Sustainability 14 00729 g004
Figure 5. Scatter plot of residuals and lntrustjt.
Sustainability 14 00729 g005
Figure 6. Scatter plot of residuals and lntfjt.
Sustainability 14 00729 g006
Figure 7. Scatter plot of residuals and lnmfjt.
Sustainability 14 00729 g007
Figure 8. Scatter plot of residuals and lnffjt.
Sustainability 14 00729 g008
Table 1. Summary statistics of variables.
VariableMeanS.D.MinMaxObservables
lntradeijt18.45442.52300.025023.1418810
lngdpit28.97400.4991528.203229.7505810
lngdpjt26.45941.691522.023230.4194810
lnedijt1.17981.3019−1.75613.7801810
lndistwij8.86740.63357.06329.8580810
abslnlatitudeij0.57090.71130.02813.3533810
lnargjt1.41811.3340−3.40143.6100810
lnrerijt0.56192.6768−2.73368.0164810
adjacent0.22220.416001810
WTO0.72220.448201810
crisis0.11110.314501810
lntrustjt3.09730.62501.02964.1912639
lntfjt4.28270.22582.58024.5539810
lnmfjt4.32150.18162.34184.5581810
lnffjt4.01980.33853.40124.4998810
Table 2. Correlation coefficient of some variables.
Variablelntrustjtlntfjtlnmfjtlnffjt
lntradeijt0.24140.16710.34120.1181
Residuals (e)0.07030.07380.19890.0951
Table 3. The results of benchmark regression estimation.
VariableModel (1)Model (2)Model (3)Model (4)
lngdpit1.1884 ***
(0.1423)
1.0838 ***
(0.1971)
1.0078 ***
(0.1894)
0.9898 ***
(0.1886)
lngdpjt0.9342 ***
(0.0663)
0.9464 ***
(0.0572)
0.9589 ***
(0.0565)
0.9662 ***
(0.0590)
lnedijt−0.3284 ***
(0.0805)
−0.3792 ***
(0.1000)
−0.4547 ***
(0.0981)
−0.4788 ***
(0.0992)
lndistwij−0.7640 ***
(0.1308)
−0.7315 ***
(0.1215)
−0.7678 ***
(0.1252)
−0.7537 ***
(0.1299)
abslnlatitudeij0.3259 ***
(0.0693)
0.3232 ***
(0.0682)
0.3045 ***
(0.0634)
0.3102 ***
(0.0633)
lnargjt−0.3880 ***
(0.0735)
−0.3906 ***
(0.0716)
−0.3234 ***
(0.0682)
−0.3126 ***
(0.0644)
lnrerijt−0.0931 ***
(0.0316)
−0.0953 ***
(0.0320)
−0.1021 ***
(0.0308)
−0.1007 ***
(0.0313)
adjacent0.7370 ***
(0.2040)
0.7962 ***
(0.1952)
0.7308 ***
(0.2058)
0.7740 ***
(0.2155)
WTO0.1015
(0.1687)
0.1173
(0.1570)
−0.0275
(0.1557)
−0.0167
(0.1588)
crisis−0.2334
(0.2848)
−0.2312
(0.2869)
−0.0979
(0.2769)
−0.1065
(0.2799)
lntrustjt0.2196 **
(0.0874)
0.2408 **
(0.0967)
0.2013 **
(0.0973)
0.2068 **
(0.0971)
lntfjt 0.3383
(0.5214)
0.5397
(0.4981)
0.5033
(0.5084)
lnmfjt 1.6792 ***
(0.4739)
1.6223 ***
(0.4789)
lnffjt 0.2387
(0.2468)
constant−34.0367 ***
(4.5292)
−33.0867 ***
(5.0006)
−38.7786 ***
(5.4111)
−39.1557 ***
(5.4856)
F Test88.75
{0.0000}
97.58
{0.0000}
95.57
{0.0000}
87.65
{0.0000}
adj-R20.68190.68180.69280.6928
Obsvations639639639639
Note: Robust standard errors are in parentheses. *** and ** indicate significance at 0.01, 0.05 level, respectively. The p-value of F test statistic is in brackets.
Table 4. Regression results of instrumental variable two-stage least squares (IVTSLS).
VariableModel (1)Model (2)Model (3)Model (4)
lngdpit1.2678 ***
(0.1862)
0.8772 ***
(0.2297)
0.8464 ***
(0.2093)
0.8357 ***
(0.2053)
lngdpjt0.8687 ***
(0.0844)
0.9205 ***
(0.0659)
0.9354 ***
(0.0651)
0.9480 ***
(0.0668)
lnedijt−0.5175 ***
(0.1146)
−0.6813 ***
(0.1607)
−0.6960 ***
(0.1479)
−0.7080 ***
(0.1461)
lndisij−0.3212
(0.2660)
−0.2529
(0.2769)
−0.3623
(0.2722)
−0.3799
(0.2637)
abslnlatitudeij0.6335 ***
(0.1758)
0.5887 ***
(0.1586)
0.5292 ***
(0.1566)
0.5164 ***
(0.1528)
lnargjt−0.3009 ***
(0.1034)
−0.3206 ***
(0.0923)
−0.2749 ***
(0.0840)
−0.2639 ***
(0.0808)
lnrerijt−0.1480 ***
(0.0478)
−0.1500 ***
(0.0484)
−0.1467 ***
(0.0467)
−0.1405 ***
(0.0468)
adjacent1.0338 ***
(0.2791)
1.2158 ***
(0.3179)
1.0914 ***
(0.3186)
1.1200 ***
(0.3200)
WTO0.1066
(0.1817)
0.1637
(0.1662)
0.0329
(0.1637)
0.0429
(0.1642)
crisis−0.1424
(0.2952)
−0.1447
(0.2936)
−0.0456
(0.2797)
−0.0630
(0.2820)
lntrustjt1.6631 **
(0.7366)
1.5765 **
(0.6798)
1.3239 **
(0.6721)
1.2268 *
(0.6508)
lntfjt 1.2342 *
(0.6832)
1.2585 **
(0.6389)
1.1387 *
(0.6358)
lnmfjt 1.4275 **
(0.5724)
1.3690 **
(0.5688)
lnffjt 0.3442
(0.2510)
constant−43.1144 ***
(7.2393)
−38.6174 ***
(6.3717)
−42.5492 ***
(6.3961)
−42.7396 ***
(6.3382)
Unidentifiable test
Kleibergen−Paap rk LM χ2 (1)
15.993
{0.0001}
18.697
{0.0000}
16.971
{0.0000}
17.823
{0.0000}
Weak identification test
Kleibergen−Paap rk Wald F
17.113
[8.96]
{0.0000}
19.691
[8.96]
{0.0000}
17.863
[8.96]
{0.0000}
18.880
[8.96]
{0.0000}
Endogenous Test
χ2 (1)
5.422
{0.0199}
5.038
{0.0248}
3.456
{0.0630}
2.956
{0.0856}
F test78.20
{0.0000}
77.00
{0.0000}
75.41
{0.0000}
69.85
{0.0000}
Centered R20.60430.61970.65120.6601
Obsvations639639639639
Note: The robust standard error of heteroscedasticity is in parentheses; the 15% critical value of the Stock and Yogo (2005) weak instrumental variable test is in middle parentheses; χ2(n) is chi-square statistic with (n) degree of freedom, for example, n = 1, 2 …. the same as the following tables, and the p-value of the corresponding test statistic is in brackets. ***, ** and * represent significance at 0.01, 0.05 and 0.1 level, respectively.
Table 5. Quartile regression estimation results.
VariableQR_10QR_25QR_50QR_75QR_90
lngdpit1.0809 ***
(0.2709)
0.4186
(0.2998)
0.6567 ***
(0.1460)
0.8160 ***
(0.1843)
1.0357 ***
(0.1869)
lngdpjt1.1385 ***
(0.1195)
0.9785 ***
(0.0840)
0.9125 ***
(0.0276)
0.8294 ***
(0.0314)
0.7351 ***
(0.0336)
lnedijt−0.4369 **
(0.2037)
−0.8250 ***
(0.1519)
−0.6834 ***
(0.0911)
−0.4317 ***
(0.0866)
−0.2508 ***
(0.0941)
lndistwij−0.9294 ***
(0.3088)
−0.7665 ***
(0.1368)
−0.7520 ***
(0.1168)
−0.9598 ***
(0.1786)
−0.9384 ***
(0.0945)
abslnlatitudeij0.1928
(0.1971)
0.2730
(0.2960)
0.3929 ***
(0.0532)
0.2080 ***
(0.0566)
0.1232 ***
(0.0437)
lnargjt−0.3294 **
(0.1354)
−0.3307
(0.3433)
−0.2000 ***
(0.0399)
−0.1657 ***
(0.0439)
−0.0973 **
(0.0431)
lnrerijt−0.0343
(0.0677)
−0.1765 ***
(0.0456)
−0.1681 ***
(0.0214)
−0.1134 ***
(0.0268)
−0.0680 ***
(0.0195)
adjacent−1.1502
(0.8467)
0.7081 **
(0.3478)
1.0689 ***
(0.1683)
0.9804 ***
(0.2555)
0.9522 ***
(0.1473)
WTO−0.3158 *
(0.1761)
−0.2403
(0.1933)
−0.1561
(0.1187)
−0.0979
(0.1240)
−0.0899
(0.1135)
crisis0.0804
(0.2263)
0.2839 *
(0.1452)
0.0604
(0.1006)
0.0781
(0.1333)
0.0008
(0.0919)
lntrustjt0.2404 **
(0.1204)
0.5534 ***
(0.1541)
0.3976 ***
(0.0735)
0.2417 ***
(0.0869)
0.2314 ***
(0.0780)
lntfjt0.5677
(0.4678)
2.5852 ***
(0.4616)
1.7819 ***
(0.3002)
0.2230
(0.8705)
−0.7210
(0.5524)
lnmfjt1.9683 ***
(0.4738)
0.9845 *
(0.5306)
1.4937 ***
(0.2883)
1.0189 **
(0.5114)
0.8246 ***
(0.2123)
lnffjt−0.2928
(0.2521)
−0.3093
(0.2888)
0.3785 **
(0.1608)
0.4081 **
(0.1840)
0.6556 ***
(0.1758)
constant−45.2370 ***
(8.9660)
−27.7626 **
(12.3018)
−33.8551 ***
(3.3122)
−25.1554 ***
(4.4073)
−25.1178 ***
(3.1075)
R20.64180.66430.68510.67720.6574
Heteroscedasticity test
χ2 (1)
95.755
{0.000}
87.516
{0.000}
99.138
{0.000}
116.414
{0.000}
136.794
{0.000}
Obsvations639639639639639
Note: Heteroscedastic robust standard errors are in parentheses. The test of heteroscedasticity is the MSS test (Machado–Santos Silva test), and the p value of the corresponding χ2 (1) test statistic is in brackets. ***, **, * are significant at 0.01, 0.05, 0.1 levels, respectively.
Table 6. Quartile regression estimation results based on the control function method (full sample).
VariableQR_10QR_25QR_50QR_75QR_90
lngdpit0.0547
(0.3022)
0.5406
(0.2799)
0.6301 ***
(0.1460)
−0.1392
(0.3995)
0.4912
(0.8790)
lngdpjt1.1513 ***
(0.0581)
0.9210 ***
(0.0531)
0.8443 ***
(0.0463)
0.9036 ***
(0.0447)
0.7420 ***
(0.0363)
lnedijt−1.8743 ***
(0.3233)
−1.0260 ***
(0.1335)
−0.7282 ***
(0.0937)
−1.2301 ***
(0.3137)
−0.8291
(0.9635)
lndistwij0.2750
(0.2617)
−0.3781 **
(0.1832)
−0.4278 **
(0.2039)
−0.1742
(0.2572)
0.2582
(1.8743)
abslnlatitudeij2.1654 ***
(0.2784)
0.6514 ***
(0.1457)
0.6331 ***
(0.1055)
0.1681 ***
(0.0548)
0.1481 **
(0.0643)
lnargjt0.4104 ***
(0.1265)
−0.0492
(0.1253)
−0.1002 *
(0.0583)
−0.4918 ***
(0.1144)
−0.4346
(0.5476)
lnrerijt−0.0852
(0.0529)
−0.1775 ***
(0.0487)
−0.1868 ***
(0.0211)
−0.1492 ***
(0.0286)
−0.0845 ***
(0.0321)
adjacent0.1214
(0.4969)
0.9168 *
(0.4862)
1.5070 ***
(0.2747)
0.9177 ***
(0.2348)
1.3349 **
(0.5219)
WTO−0.0547
(0.1259)
0.1386
(0.1761)
−0.0762
(0.1231)
0.1348
(0.1442)
−0.0718
(0.1054)
crisis0.4833 ***
(0.1696)
0.2341 *
(0.1344)
0.0740
(0.1117)
0.1458
(0.1180)
0.0738
(0.1800)
lntrustjt5.2744 ***
(0.8039)
2.5486 ***
(0.4009)
1.2636 ***
(0.3601)
2.1909 ***
(0.6997)
1.8136
(2.6155)
lntfjt3.5358 ***
(0.5927)
3.0098 ***
(0.5999)
2.2658 ***
(0.3807)
1.1761
(0.8526)
−0.2569
(0.9062)
lnmfjt−1.1608 **
(0.5886)
0.8959 **
(0.4531)
1.3333 ***
(0.3000)
0.3042
(0.4629)
0.4876
(0.5882)
lnffjt0.0760
(0.1947)
0.4144
(0.2889)
0.4741 ***
(0.1749)
0.4050 **
(0.1791)
0.6985 ***
(0.1822)
constant−40.3823 ***
(8.1944)
−43.7732 ***
(7.5385)
−38.9687 ***
(3.8140)
−12.9113 **
(6.2431)
−25.6468 ***
(3.3305)
R20.64640.67170.68490.67380.6596
Heteroscedasticity test
χ2 (2)
86.491
{0.000}
87.084
{0.000}
96.153
{0.000}
108.093
{0.000}
136.724
{0.000}
Obsvations639639639639639
Note: Heteroscedastic robust standard errors are in parentheses. The test of heteroscedasticity is the MSS test (Machado–Santos Silva test), and the p value of the corresponding χ2 (2) test statistic is in brackets. ***, **, * are significant at 0.01, 0.05, 0.1 level, respectively.
Table 7. Quartile regression estimation results based on the control function method (change samples size).
VariableQR_10QR_25QR_50QR_75QR_90
lngdpit1.0218 ***
(0.2759)
0.5665 **
(0.2686)
0.7739 ***
(0.1511)
−0.0633
(0.3469)
0.6727
(0.5145)
lngdpjt1.1141 ***
(0.1400)
0.9457 ***
(0.0586)
0.8901 ***
(0.0576)
0.9160 ***
(0.0432)
0.7641 ***
(0.0449)
lnedijt−1.1314 *
(0.6085)
−1.0115 ***
(0.1422)
−0.6013 ***
(0.1135)
−1.1621 ***
(0.2862)
−0.6703
(0.6110)
lndistwij0.2294
(0.8485)
−0.3929 **
(0.1859)
−0.5710 **
(0.2278)
−0.2436
(0.2776)
−0.2240
(1.0463)
abslnlatitudeij2.2395
(1.3939)
0.7847 ***
(0.1728)
0.5818 ***
(0.1374)
0.2510 ***
(0.0570)
0.1447 ***
(0.0528)
lnargjt0.9474
(0.8689)
0.0228
(0.1336)
0.0501
(0.1951)
−0.3833 ***
(0.1191)
−0.2543
(0.2833)
lnrerijt−0.0561
(0.0851)
−0.1834 ***
(0.0430)
−0.1820 ***
(0.0227)
−0.1369 ***
(0.0329)
−0.0655 ***
(0.0232)
adjacent−0.1081
(1.1179)
0.6227
(0.4166)
1.1875 ***
(0.3392)
0.5584 *
(0.3107)
0.7995 ***
(0.2128)
WTO−0.1142
(0.2266)
0.1512
(0.1839)
−0.2243
(0.1396)
0.1280
(0.1471)
−0.0521
(0.1147)
crisis0.6152
(0.4305)
0.1773
(0.1779)
0.1047
(0.1047)
0.0880
(0.1254)
0.0928
(0.1977)
lntrustjt4.8539
(3.4648)
2.5085 ***
(0.4686)
1.0033 ***
(0.3798)
2.1380 ***
(0.6897)
1.3333
(1.5624)
lntfjt2.1592
(1.4397)
2.8113 ***
(0.5757)
2.1309 ***
(0.3787)
1.1352
(0.8086)
−0.4723
(0.6278)
lnmfjt−0.4734
(1.7404)
1.0818 **
(0.5049)
1.7922 ***
(0.4017)
0.4973
(0.5532)
0.6819
(0.4815)
lnffjt−0.0341
(0.2063)
0.4324
(0.3153)
0.2587
(0.1884)
0.3880 *
(0.2041)
0.8148 ***
(0.2712)
constant−64.4094 ***
(11.5513)
−45.1088 ***
(7.7872)
−43.0240 ***
(5.9121)
−15.4403 ***
(5.9541)
−26.1923 ***
(3.6755)
R20.64350.66510.67630.66650.6501
Heteroscedasticity test
χ2 (2)
93.609
{0.000}
91.507
{0.000}
92.135
{0.000}
111.952
{0.000}
158.617
{0.000}
Obsvations627627627627627
Note: Same as Table 6.
Publisher’s Note: MDPI stays neutral with regard to jurisdictional claims in published maps and institutional affiliations.