Article

Few-Layers Graphene-Based Cement Mortars: Production Process and Mechanical Properties

by
Salvatore Polverino
1,2,*,
Antonio Esau Del Rio Castillo
2,3,
Antonio Brencich
4,
Luigi Marasco
2,
Francesco Bonaccorso
2,3 and
Renata Morbiducci
1
1
Department Architecture and Design (DAD), University of Genoa, 16123 Genoa, Italy
2
Graphene Labs, Italian Institute of Technology (I.I.T.), 16163 Genoa, Italy
3
Bedimensional S.p.a., 16163 Genoa, Italy
4
Department of Civil, Chemical and Environmental Engineering (DICCA), University of Genoa, 16145 Genoa, Italy
*
Author to whom correspondence should be addressed.
Sustainability 2022, 14(2), 784; https://doi.org/10.3390/su14020784
Submission received: 16 November 2021 / Revised: 6 January 2022 / Accepted: 7 January 2022 / Published: 11 January 2022
(This article belongs to the Special Issue Sustainable Concrete Materials and Technologies)

Abstract

:
Cement is the most-used construction material worldwide. Research for sustainable cement production has focused on including nanomaterials as additives to enhance cement performance (strength and durability) in recent decades. In this concern, graphene is considered one of the most promising additives for cement composites. Here, we propose a novel technique for producing few-layer graphene (FLG) that can fulfil the material demand for the construction industry. We produced specimens with different FLG loadings (from 0.05% to 1% by weight of cement) and curing processes (water and saturated air). The addition of FLG at 0.10% by weight of cement improved the flexural strength by 24% compared to the reference (bare) sample. Similarly, a 0.15% FLG loading by weight of cement led to an improvement in compressive strength of 29% compared to the reference specimen. The FLG flakes produced by our proposed methodology can open the door to their full exploitation in several cement mortar applications, such as cementitious composites with high durability, mechanical performance and high electrical conductivity for electrothermal applications.

1. Introduction

Any material or building element is considered sustainable if it combines environmental conservation and economic feasibility [1]. Thanks to technological innovation, the construction industry must provide sustainable solutions, but many building materials are not environmentally friendly [2]. In particular, studies of the life-cycle of construction materials [3] (in terms of annual production, effects of raw material use, energy consumption and pollution for its production and recycling) have led to a reconsidering of their production and use, focusing mainly on choices that lead to or favours the reduction of the carbon emission footprint [4].
In this context, concrete undoubtedly needs to become a sustainable material [5]. More than 4 billion tons of cement are produced every year, representing ~8% of global CO2 emissions [6]. The worldwide consumption of concrete reached 33 billion tons per year, which means 4.7 tons per capita worldwide [6]. Improving the cement production cycle and enhancing the lifetime of cement composite mixes have been identified as possible ways to reduce CO2 emissions substantially [7].
The inclusion of binders into Portland cement or nano-additives can enhance the cement composites’ environmental performance (a reduced carbon footprint characterises the use of these materials compared to ordinary Portland cement) [8]. The scope of using alternative binders is to explore possible materials that could replace the Portland cement, e.g., geo-polymers, silica fume and flying ashes (residual products of silicon production and coal combustion) [9,10].
The inclusion of nano-additives in cement composites reduces the degradation of the cementitious conglomerate, avoiding deterioration of the final construction, thus limiting the material consumption used either for its maintenance or replacement [11]. In addition, the use of nano-additives also improves the mechanical performance of the concrete, producing high-strength cementitious composites [12,13,14,15].
Numerous nano-additives, e.g., nanoparticles of silicon dioxide (nano-SiO2) [16], aluminium oxide (nano-Al2O3) [17] and titanium dioxide (nano-TiO2) [18], have been tested to improve the mechanical performance of cement. The addition of these nanomaterials improved the mechanical properties and durability (i.e., the ability of the cement composites to resist weathering action, chemical attack and mechanical loading during their service life [19]). For example, nano-SiO2 (5% wt.) used as an additive improves the compressive strength up to 27% compared to the control sample [16]. Similarly, the addition of nano-SiO2 and nano-Al2O3 into cementitious composites reaches a 19% improvement in compressive strength compared to the reference sample [17]. Furthermore, the nano-SiO2- and nano-Al2O3-based cement composites show a reduced capillary permeability coefficient (<30% compared to the control sample), increasing the durability of the composite. Likewise, the addition of nano-TiO2 in cement pastes increases the compressive strength by 24% compared to the control samples and prevents the degradation of the composites [18]. The use of nanoparticles reduces the porosity of the cementitious composites (up to 22%), improving material durability, limiting the degradation of concrete due to carbonation, sulphate attack and alkali-silica reactions [20].
The use of carbon nano-additives, such as carbon nanotubes (CNTs) [21] and graphene-related materials (GRM) [22], in cement composites, has recently gained increasing interest in this field [23]. The addition of CNTs into the cement composites enhanced both its mechanical and durability properties compared to the reference counterpart [24]. In this regard, a CNTs loading of 0.1% by weight of cement (bwoc) can lead to an improvement in compressive strength of 21% compared to the bare sample, reducing the permeability of the material to degrading agents (e.g., chlorides and carbon dioxide) [21]. A CNTs loading of 0.1% bwoc can also cause a reduction of the absorption coefficient (12% improvement over the control specimen), carbonation coefficient (reduction of 16% compared to reference sample) and chloride diffusion coefficient (reduction of 12% concerning the control sample) of cement composites [21]. The synergistic effects of CNTs on the mechanical and durability properties are mainly due to the induced pore-filling effect that reduces the porosity of the cement composites [25].
Similarly, the use of graphene oxide (GO) modifies the cement hydration mechanism, [26] improving the mechanical strength and durability of the composite [27]. The addition of 0.02 wt.% (0.03%) of GO into cementitious mortars determined a >25% increase of compressive strength (~22% flexural strength) compared to the control sample [28]. The improvement in the mechanical properties of the cement composite is mainly ascribed to the bridging effect of GO flakes that promotes a better interaction between the cement-hydration components (e.g., calcium silicate hydrate and calcium aluminate hydrate) and the sand [29]. In this context, the use of electrochemically exfoliated graphene (EEG) (EEG has a non-negligible C/O ratio, it also has a morphology and defects similar to reduced GO [30,31]) has also been demonstrated to be beneficial in improving the mechanical performance of the cement composites [32]. The addition of EEG flakes at 0.05% wt. of the cement increased 8%, 79% and 9% in compressive, tensile and flexural strength, respectively, compared to the control sample [32].
Besides GO, the most widespread GRMs used for cement composites are the so-called graphene nanoplatelets [33] (GNPs) (i.e., the carbon-based product used for industry application, composed of few-(FLG) and multi-(MLG) layer graphene mixed with graphite [34,35]). GNPs in cement composites can improve the compressive strength, e.g., adding a GNPs loading of 0.01% by weight in cement can achieve a 19% improvement over the control sample [36]. The mechanical improvement is also due to the filling effect of GNPs in the cement matrix [37]. The addition of GNPs also increases the durability of concrete due to the barrier-effect, blocking chloride attacks [38], and improves the electric and thermal conduction [39,40], e.g., adding 1% of GNPs by the weight of cement used, a significant reduction in electrical resistance is achieved, i.e., passing from 311 kΩ (control sample) to 19 kΩ [39].
The inclusion of GRMs in cement-based materials, improving their physical properties (e.g., thermal and electrical conductivity), can also be used to produce so-called smart concretes, which are cementitious composites that can react to external stimuli (e.g., mechanical stresses and the passage of electrical current) [41,42]. For example, the addition of GNPs enhances the piezoelectric properties of the cementitious composite, valid for the detection of changes in the mechanical strains (i.e., the addition of conductive nano-additives decreases the electrical resistance and amplifies its relation with the applied load, signalling the breakage of the material) [39,43]. The characteristics of smart concrete allow their use in new applications, e.g., (i) structural health control of the construction performed by the structure material itself [44]; (ii) warming of road pavement to prevent icing of the road surface [45]; (iii) shadowing of electromagnetic fields [46].
Despite the potential applications, the uses of FLGs in the construction sector are still seldom [47], mainly due to current large-scale production limitations [48].
In recent years, innovation funding programmes have promoted collaboration between the academic research sector and the cement manufacturer to facilitate the transition of FLG (and GRM to a large extend) from the lab scale to the industrial one [49]. At this stage, one of the main challenges is to transfer the FLG (GRMs) production from the laboratory to the market in a cost-effective manner. [50,51].
Among the different alternatives to synthesise FLG and GRM, liquid-phase exfoliation (LPE) is one of the most promising since it could fulfil the industrial demand of FLG and GRM [52]. The LPE consists mainly of a three-step process [53,54,55,56,57]:
  • dispersion of the layered crystals in a solvent;
  • exfoliation;
  • separation or purification.
Recently, high-pressure homogenisers have been promising techniques to scale up the LPE production of FLG [58]. Specifically, it has been demonstrated the production of 1 g of FLG in less than 1 minute employing the wet-jet mill (WJM) [59], which is three orders of magnitude faster than the typical exfoliation using the sonic bath [60]. The high-pressure homogenisers, particularly the WJM, use high shear forces and cavitation to exfoliate the layered materials. In general, pure organic solvents are used for the exfoliation of graphite, e.g., N-methyl-2-pyrrolidone (NMP) [53] and dimethylformamide (DMF) [61]; since their surface tensions (ca. 40 mN/m2) enable the dispersion of graphene or FLG flakes. Unfortunately, the solvents used for exfoliation usually harm the environment or health, also having high boiling points (>100 °C) or high vapour pressures (>100 kPa) [52]. The properties require large amounts of energy to remove them (by evaporation or sublimation), thus increasing the production costs [62]. A possible alternative to the use of organic solvents for the LPE process is the exfoliation in water with the aid of surfactants [55,63]. Using surfactants or stabilisers already used in the construction market is attractive for the construction sector. Other stabilisers commonly used to exfoliate graphite in water, e.g., sodium cholate or [64] sodium dodecyl sulphate [64,65,66], could be detrimental for the cement composite, deteriorating its durability. In this regard, ions present in dispersants not formulated for application in cementitious compounds can activate material degradation mechanisms such as alkali-silica reaction or sulphate attack [67,68].
Here we present a sustainable FLG production method suitable for the cement sector. The proposed FLG production process avoids using toxic solvents, is scalable, and most importantly, uses a stabiliser compatible with cement composite. The proposed LPE protocol is based on the exfoliation of graphite in water with a stabiliser additive used in the construction sector, i.e., a non-toxic modified-acrylic-based superplasticiser. This additive is commonly used in the cement industry to improve the workability of cementitious composites and to facilitate the dispersion of filler within the cementitious matrix [69]. Exfoliation of graphite directly into the mixing water used for cement production (i.e., eliminating the freeze-drying phase) simultaneously cuts the production costs of FLG production and makes the process environmentally friendly, i.e., avoiding the use of toxic solvents [57]. In addition, the WJM method allows scalability and high-quality materials production [57,69,70].
A dispersion of FLG in water was used to produce cement mortar to evaluate the effects of FLG on the mechanical strength of cementitious composites. Two FLG-based water dispersions with different FLG contents were tested to investigate their concentration in the mixing water; consequently, the cement matrix can influence the final composite properties. Compared to the control sample, the FLG-based cement mortar samples have improved the compressive and flexural strength of 29% and 24%, respectively. Besides, to investigate the most suitable curing method, the samples were aged into two different environments: water and saturated air.

2. Materials and Methods

The graphite flakes (+100 mesh, ≥75% min) were purchased from Sigma-Aldrich and used without further purification (see Figure S1a for the particle size gradation curve in supplementary materials). The water was Milli-Q®, Reference Water Purification System.
The superplasticiser was a powder-based additive on the acrylic modified polymer used for concretes with a low water/cement ratio (≤0.5).
The cement used was 32.5 R CEM II/A-LL, according to the European standard EN:197-1, a type II limestone Portland cement (80% to 94% clinker with the remainder consisting of limestone, see Table S1 for the chemical composition in supplementary materials).
Natural silica sand washed and sieved (mesh size between 0.250 mm and 4.00 mm, see Figure S1b for the particle size gradation curve) from sand quarries was used for the mortar sample production, described in Section 2.2.

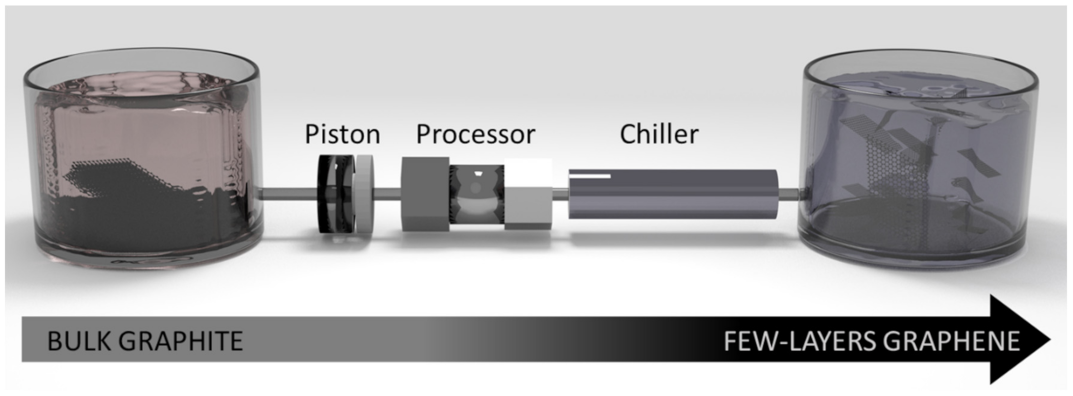
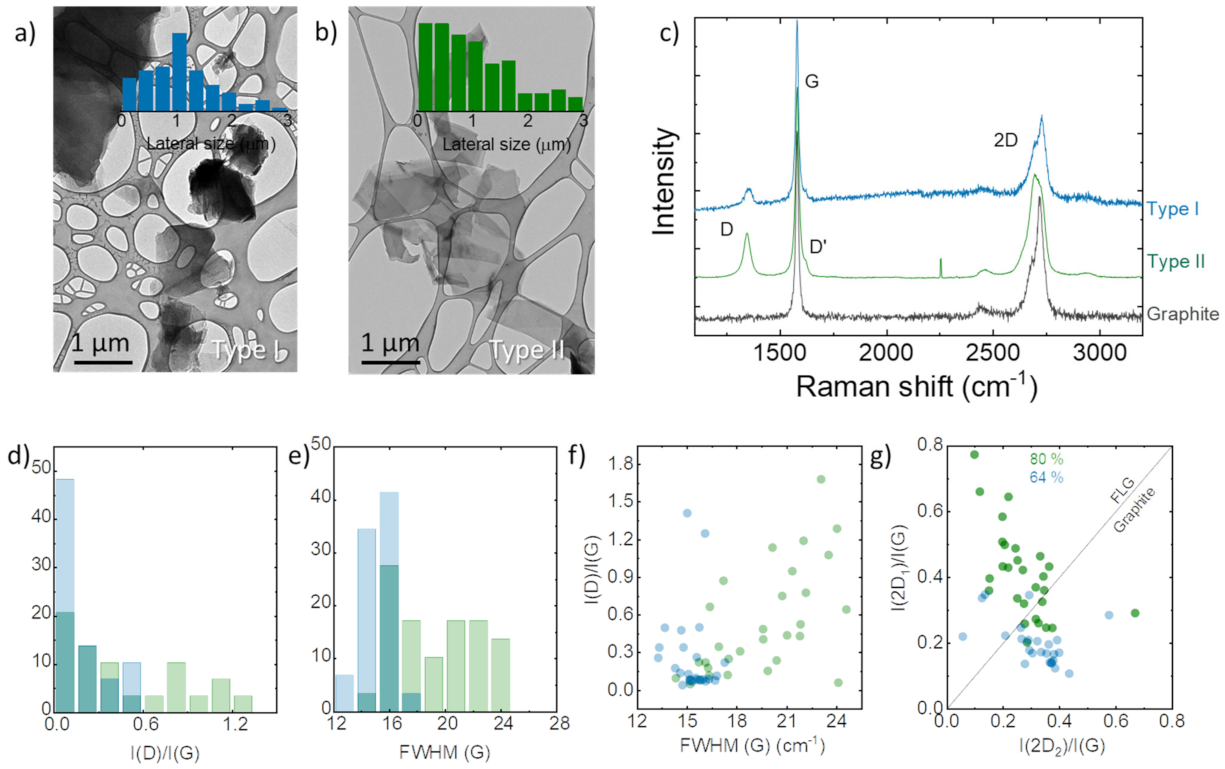
2.1. Few-Layers Graphene Production

FLG was produced using a WJM technique described in previous work [59,70,71,72]. The concentration of the superplasticiser was 0.5% by the weight of the water. The production process is the scheme in Figure 1: the FLG solution flows through a pneumatic piston into a processor where a 180–250 MPa pressure is applied; then cavitation and shear forces promote the exfoliation of the graphite. The exfoliation is carried out using different nozzle diameters in the processor, i.e., 0.1, 0.15, 0.2 and 0.3 mm used consecutively. After passing through the processor, the exfoliated samples are cooled down using a chiller.
Two different exfoliation processes have been tested (keeping constant the concentration of 20 g of graphite per litre of solvent and a superplasticiser loading of 0.5% by weight of water used), varying the processor nozzle diameter and the number of passes:
  • Type I sample is exfoliated through the processors with 0.3, 0.2, 0.15 (two times) and 0.1 mm diameter nozzles consecutively;
  • Type II sample is exfoliated using the 0.3, 0.2, 0.15 (two times), and 0.1 mm (three times) diameter nozzles consecutively.

2.2. Production of the FLG-Based Specimens

Few-layers graphene dispersions were used in the cement composite to evaluate the effect induced in the mechanical properties of the mortar.
Mortars with different FLG loading were produced using the two different morphologies of FLG. The FLG loadings of 0.05, 0.1, 0.15, 0.5 and 1% by the weight of cement were used for the samples named G005, G01, G015, G05 and G1, respectively. In addition to the FLG inclusion, the weight composition of the individual castings consisted of 2700 g of sand, 900 g of cement and 450 g of mixing water. This composition was used to produce reference samples for evaluating mechanical properties; specifically, two types of control samples were made: the first one without any additives (Control); the second was with superplasticiser (SP) with a quantity equal to 0.25% by the weight of cement used, that is, the average amount specified by the manufacturer.
As indicated in the UNI EN standard for the components’ weight dosage, the water-cement ratio was 1:2, whereas the sand-cement ratio was 1:3. For the FLG-based samples, the amount of superplasticiser used was the sum of two quantities:
  • one part corresponded to the minimum quantity recommended by the manufacturer (0.20% by the weight of cement used);
  • the second amount was relative to the quantity of FLG added (30%).
The composition of a single cast of cement mortar for each sample type is given in Table 1.
The water-FLG dispersion was mixed with cement and sand according to the modified UNI EN 196-1 standard, i.e., the addition of superplasticiser and a longer final mixing time was introduced. The following steps describe the process:
  • Water and cement were placed in the mixing bowl, and the addition was completed in 10 s;
  • The stirring started, and it was set at 140 ± 5 rpm;
  • After 30 s, the sand was added with a steady flow for 30 s;
  • The composite was mixed for an additional 30 s at 285 ± 10 rpm;
  • After the 30 s, the mechanical mixing was stopped for 90 s and the mortar adhered to the container was hand-mixed;
  • The superplasticiser was added, and the mixing continued at 285 ± 10 rpm for 120 s.
The samples were poured into steel formworks, vibrated for 30 s to eliminate air bubbles, and removed from the moulds after 48 h from the casting. Two different curing methods were tested to evaluate the mechanical performance. The samples (40 × 40 × 160 mm3) were divided into two groups: the first one was cured in water (labelled as A). The second one was stored in a glass box with a constant humidity level of 95% ± 5% (labelled as B). All the samples were stored at the standard temperature of 20 °C ± 2 °C. Four specimens were tested using a single cement mortar typecast for the mechanical test at each specific ageing date.

2.3. Material Characterisation, FLG Dispersion and Mechanical Measurement

Raman Spectroscopy. The dispersions were deposited by drop-casting on a Si wafer (IDB Technologies Ltd., Whitley, UK) covered with 300 nm SiO2. Raman measurements were carried out using a Renishaw InVia micro-Raman spectrometer with a 50× objective with a numerical aperture of 0.75, an excitation wavelength of 514 nm line of an Ar+ laser, and an incident power less than one mW and a resolution of 1 cm−1. A total of 20 points per sample were measured to perform the statistical analysis. Raman mappings were performed on an area of 0.4 × 0.4 µm2, using a 50 × objective (numerical aperture 0.75), a laser with a wavelength of 514.5 nm with an incident power of ~5 mW. The diameter of the laser spot was 1 µm. Mapping was performed by quantifying the presence or absence of the G-band using Renishaw’s WiRE 4.4 software.
Transmission Electron Microscope. TEM images are taken using a JEOL JEM-1011 transmission electron microscope, operated at an acceleration voltage of 100 kV. Experimentally, 10 µL of FLG-based water dispersion was diluted in 10 mL of water and deposited on an ultrathin formvar polymer film on Cu 400 mesh grids (Ted Pella Inc. Redding, CA, USA). The grids were stored under a vacuum at room temperature.
Scanning Electron Microscopy (SEM). The samples were analysed by a (low vacuum) scanning electron microscope using a JSM-6490LA SEM (JEOL) operating at 10 kV acceleration voltage. Portions of approximately 0.25 cm2 were extracted from the fracture plane and coated with gold (thickness: 10 nm).
Mechanical Measurements. The flexural (Three-Point Bending test, TBP) and compressive strength tests were carried out, according to UNI EN 196-1, using Metrocom material testing machines, with a resolution of 0.01 kN and a load cell of 600 kN. The loading rate applied for the bending tests was (50 ± 10)N/s until sample fracture. For the compression tests, the loading rate applied was (2400 ±200) N/s until sample fracture.
The data acquisition software was Metrocom-Dina960xp. For the evaluation of the flexural strength of the specimens, four TBP tests were performed. Subsequently, the tests for the evaluation of the compressive strength were performed on the portions of prisms broken in flexure as indicated in UNI EN 196-1 and ASTM C 349. Since four samples were subjected to the three-point bending test, eight samples were obtained for the compressive strength test.

3. Results and Discussion

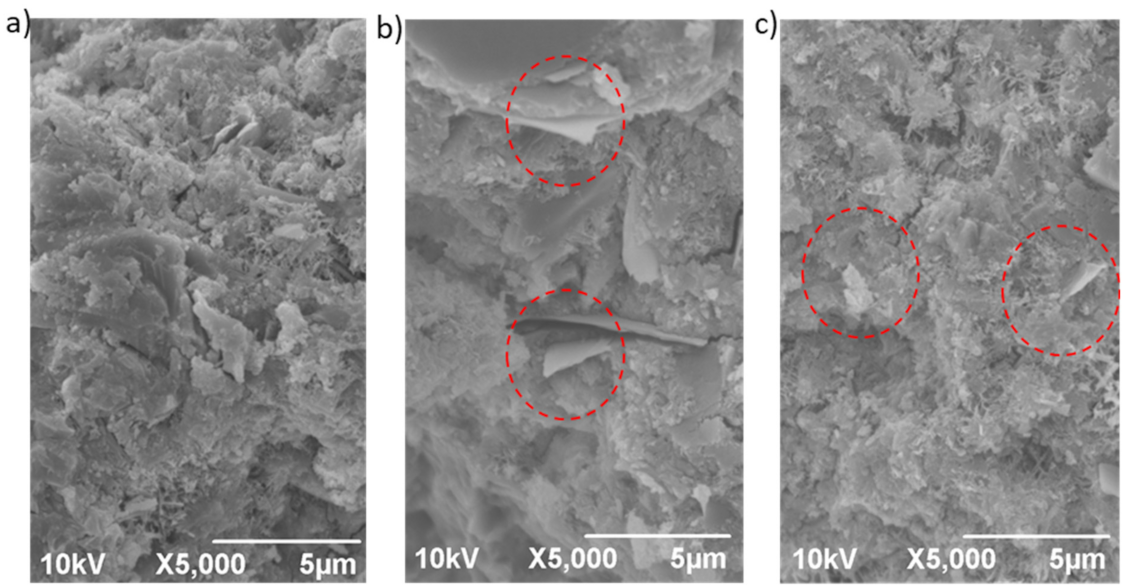
3.1. Characterisation of Few-Layers-Graphene

Transmission electron microscopy was performed to verify the morphology of the samples. The images demonstrate that the FLG flakes have irregular shapes (see Figure 2a,b). Statistical analysis (insets in Figure 2a,b) shows that the flakes’ lateral size followed a lognormal distribution, typical for fragmented systems [73]. In Type I graphene, the distribution is characterised by a narrow distribution (lognormal standard deviation of 0.793) with the lateral size mode at 1 µm. On the contrary, the Type II graphene presents a broad distribution of the lateral size (lognormal standard deviation of 1.208), i.e., it is a heterogeneous sample with flakes of different sizes.
Similarly, the FLG samples were analysed using Raman spectroscopy. The results are summarised in Figure 2. Raman spectroscopy allows estimating the thickness (number of layers), structural defects, and material doping [74]. The Raman spectrum of FLG is composed mainly of the G and the 2D bands. When the graphene flakes present defects, such as substitutional atoms or the edges of the flakes, the D band is also observable [74,75]. The G peak, located at 1585 cm−1, corresponds to the E2g phonon at the Brillouin zone centre [74,75]. The D peak is due to the breathing modes of the broken symmetry of the hexagonal honeycomb carbon ring [76,77,78]. The 2D peak is the second order of the D peak [74,79]. In this case, for single-layer graphene (SLG), the 2D peak is a single peak centred at ≈2680 cm−1 [74,75], while, for FLG, the 2D band is generally an overlap of the 2D1 and 2D2 components [74,75]. In graphite, the intensity of the 2D2 band is about twice as high as the 2D1 band [74,75,80], while for graphene, the 2D band is a single, sharp Lorentzian peak, which is about four times as intense as the G peak [74]. In this context, and taking into account the intensity ratios of 2D1 and 2D2 - I(2D1)/I(2D2), it is possible to estimate the thickness of the exfoliated flake [81]. Figure 2c shows the Raman spectrum of graphite (black) and the two spectra of FLG samples (green and blue). The changes in the D and 2D bands are observable. For the case of highly exfoliated samples, the D band increases following the number of piston passes [59]. The Type I graphene sample shows a less intense D-band than the Type II graphene sample processed with several passes: the D mode for Type I graphene is 0.08 with a lognormal standard deviation of 0.74 instead of the mode of 0.11 with a lognormal standard deviation of 1.05 for Type II graphene.
Similarly, the full-width statistical analysis at half the maximum of the G band, FWHM (G), shows a broader distribution in Type II graphene, ranging from 15.2 to 24.6 cm−1, compared to Type I graphene, which ranges from 13.3 to 17.7 cm−1. The widening of the G band is correlated with contaminants and defects that alter the energy levels of the material. This characteristic means that Type II graphene is the most defective, i.e., it has more edge-carbon atoms than in-plane atoms. Furthermore, the ratio between I(D)/I(G) and FWHM (G) (Figure 2d,e,f) gives additional information on the form of defects present on the exfoliated samples, i.e., there is no linear correlation between the I(D)/I(G) and FWHM (G), suggesting that the defects are mainly present on the edges and not on the basal plane of the graphene structure [74,75].
Finally, the ratio I(2D1)/I(2D2) was analysed to estimate the thickness of the samples produced (Figure 2g). The grey line represents the multi-layer conditions (~5 layers) I(2D1)/I(G) = I(2D2)/I(G) [82]: above this limit, there are flakes with a thickness of fewer than five layers (i.e., FLG and SLG) and below there are flakes which tend to have more than five layers [83]. Statistical analysis of the two samples produced indicates that Type II graphene has 80% flakes with a thickness lower than five layers, demonstrating the predominance of FLG. On the contrary, Type I graphene has 64% flakes with a thickness lower than five layers.
These results demonstrate the efficiency of the WJM technique for the production of FLG dispersed in a superplasticiser-water mixture. In particular, varying the number of steps in the process makes adjusting the percentage of FLG and lateral dimensions possible. Besides, the entire WJM process allows scalable FLG production in the form of concentrated dispersions.

3.2. Few-Layers Graphene-Based Mortar Dispersion Method

The homogeneous distribution of FLG within the cement matrix is fundamental for improving the mechanical properties of cement composites [84]. However, a heterogeneous dispersion of FLG within the mortar can cause the formation of agglomerates that can adversely affect the flexural and compressive strength of the material. To address this issue, the method of mixing and incorporating FLG into the cement mortar are of paramount importance [85].
Fragments of cementitious mortar with an FLG loading of 1% by weight of cement were analysed by SEM microscopy to verify the FLG distribution. Figure 3 shows the SEM images of the control sample and Type I and Type II graphene mortars. A comparison of the images shows that FLG does not alter the structure of the cement composite. Finally, the FLG (marked in red) appears to be distributed in the structure, showing the stability of the suspension even during the preparation phases.

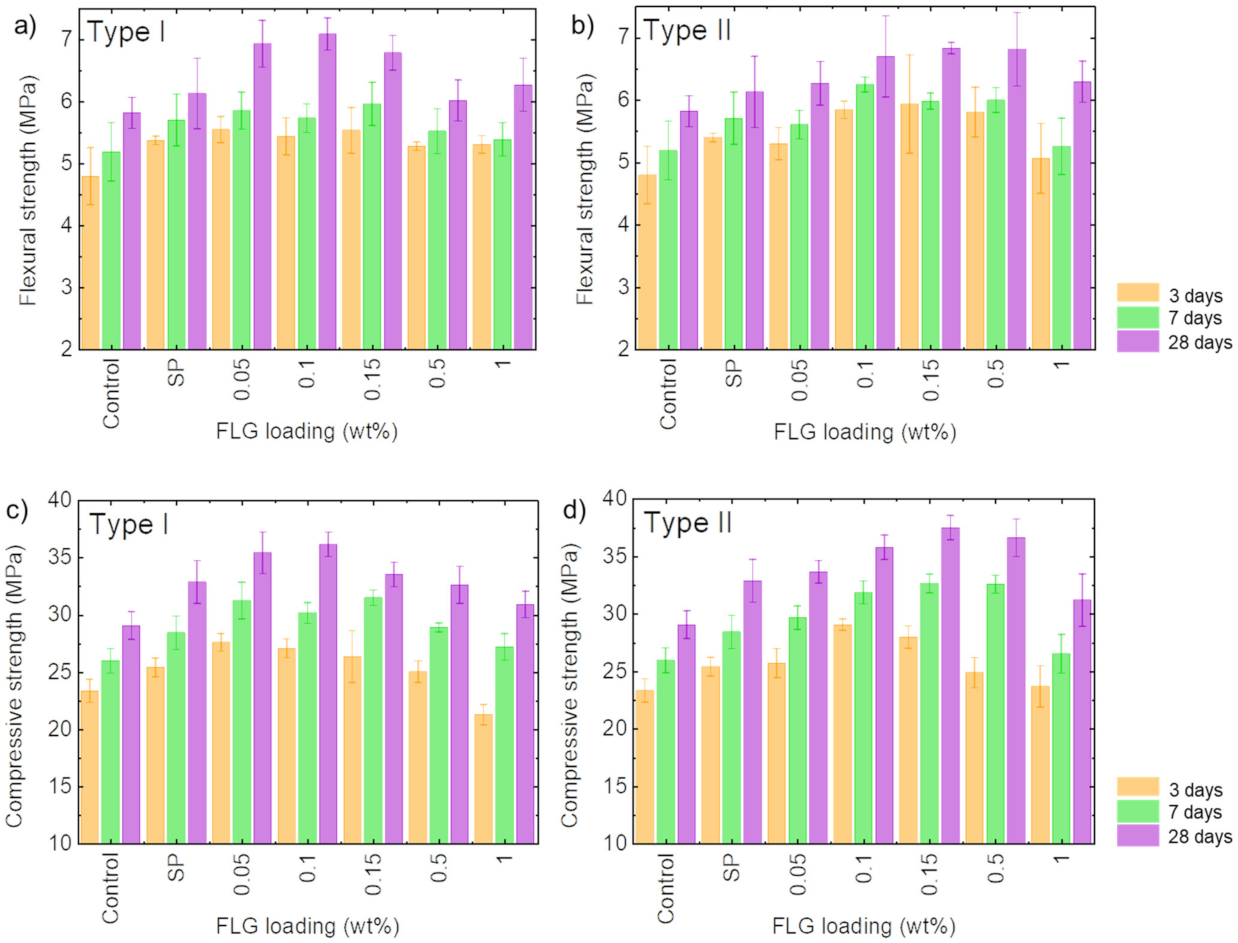
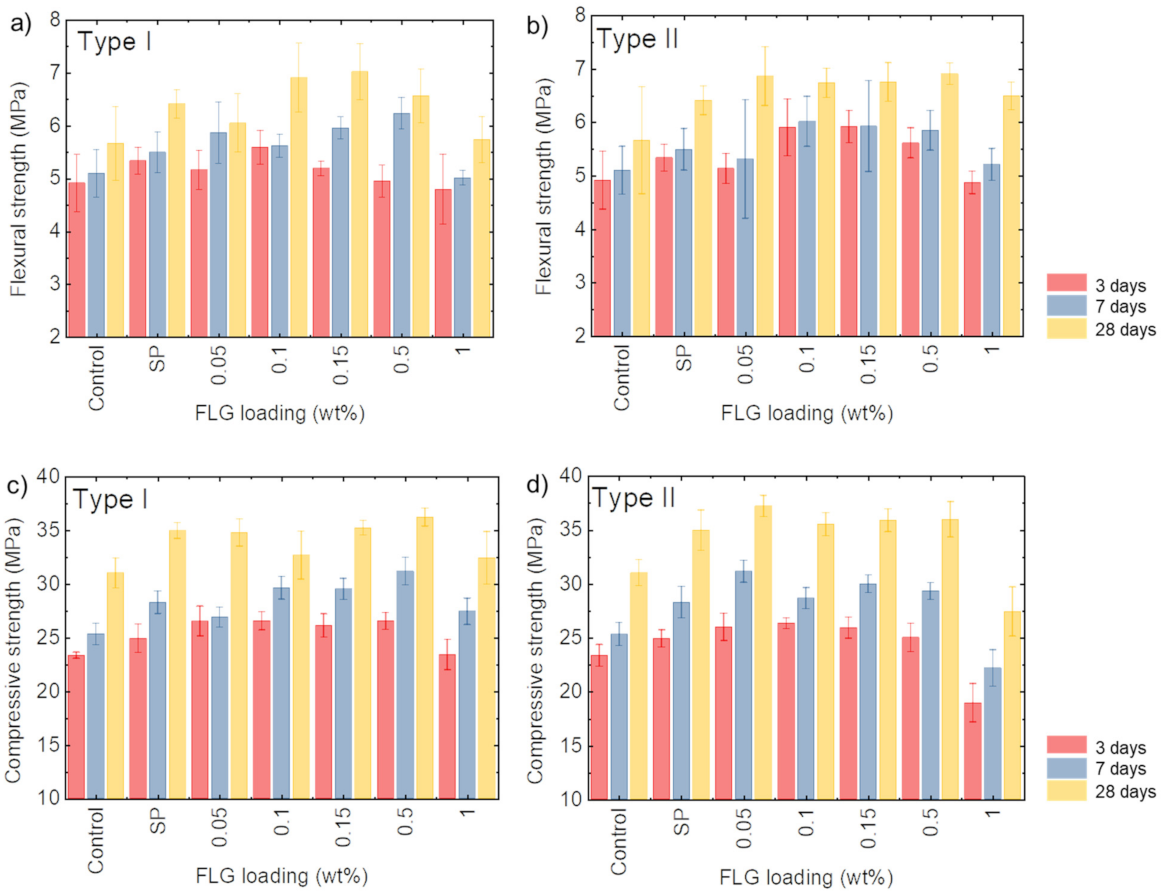
3.3. Flexural and Compressive Strength

The specimens produced were subjected to the UNI EN 196-1 standard tests to evaluate the FLG effects on the mechanical properties of cementitious mortar. The samples were subjected to the three-point bending test to assess the mortar flexural strength; then, each of the two halves (the sample was divided by the flexural test) was subjected to a compression test. The results of the mechanical test of the samples are shown in Table 2.
Figure 4a shows the results of the three-point bending (TPB) tests of cement mortar samples produced with Type I graphene. After three days of curing, samples A-G005 show an increase in flexural strength of 15.7% compared to the control samples; similarly, samples A-G015 after 7 days show an increase in flexural strength of 14.6% compared to the results of the control mortar. For the same curing days, the A-SP specimens show a significant increase in flexural strength of 12.5% and 9.6% compared to the control specimen; this improvement in the performance results from using the superplasticiser, in accordance with ref. [86]. After 28 days, the A-G01 samples achieve a 22.2% improvement in flexural strength compared to the A-Control samples; considering that the addition of superplasticiser has led to an increase in A-SP samples of only 5.7% compared to A-Control, after 28 days, the addition of FLG develops the improvement in flexural strength due to better integration of the flakes in the cementitious matrix [33].
Figure 4b shows the results of the TPB tests for specimens packed with Type II graphene. After three days of curing, the A-G015 specimens show an improvement over A-Control of 24.6%, which is higher than that of A-SP (12.5%): for Type II graphene, the influence of the FLG addition is evident already in the early stages of curing. Moreover, sample A-G015 shows the most significant increase in flexural strength after 7 and 28 days, respectively 20.8% and 17.7% more than the control specimen. Type II graphene samples have also improved the flexural strength due to FLG bridging, limiting micro-cracking formation [87].
Figure 4c shows the compression test results for samples prepared with Type I graphene. Samples A-G005 show an increase in compressive strength of 18.3% compared to the control sample. The FLG addition effects are evident after 3 days of casting, and the difference with just the superplasticiser (8.8% improvement) is remarkable. At 7 days of curing, the maximum improvement in compressive strength is obtained with the A-G015 samples, which is 21.3% greater than the compressive strength of A-Control. After 28 days of ageing, the A-G01 samples show a percentage increase of 24.5% compared to the compressive strength of standard mortar. The values at 3, 7 and 28 days of curing suggest that the FLG percentage should be between 0.05 and 0.15%. This outcome is due to the filling effect being amplified for extended curing times [87].
Finally, Figure 4d shows the results of the compression tests for samples produced with Type II graphene. After 3 days of curing, specimens A-G01 show the maximum increase in compressive strength of 24.6% over the control specimens due principally to the filling effect of FLG [46]; in fact, the A-SP specimens achieve a maximum increase in mechanical strength of 8.9%. After 7 days, compared to the control sample, the A-G015 samples increased the compressive strength to 25.7%. This effect is repeated at 28 days of curing with an improvement of 29%. The Type II graphene specimens show the most considerable compressive strength for the 0.1 and 0.15% of FLG loading. In contrast to Type I graphene, the percentage of 0.05% FLG loading does not improve the mechanical performance [88].
Figure 5 shows the results of the mechanical tests for samples cured in saturated air. The samples with Type I graphene (Figure 5a) after 3 days of curing (samples B-G01) show the best flexural strength with an increase of 13.7% compared to the control sample. At 7 days of curing, the samples B-G05 show the best flexural strength with an increase of 22.1% compared to the control. Finally, after 28 days of curing, samples B-G015 show the best flexural strength (23.9% compared to control samples). As seen for the water-cured Type I graphene samples, the results show an improvement in flexural performance after 28 days, with FLG loading between 0.1 and 0.15 by the weight of cement. Compared to the control specimen, the higher strength is due to the FLG filling effect, which reduces the voids, limiting microcrack formation, as reported in ref. [87].
Type II graphene samples show similar flexural characteristics (Figure 5b). In this case, B-G015 and B-G01 show the best flexural strength after 3 days, increasing about 20% compared to the control sample. B-G01 samples have the best performance in flexural strength after 7 days (+18% compared to control samples). Lastly, after 28 days of curing, B-G05 samples show an increase in flexural strength of about 22% compared to Control samples. The FLG-filling effect [33] seen with Type I graphene is also seen with Type II graphene samples; the flexural strength increase shows similar values to Type I graphene samples.
Figure 5c shows the compression tests result of samples cast using Type I graphene and cured in saturated air. B-G05 specimens show the improvement in the compressive strength of 13.7%, 23.1% and 16.7% compared to the control specimen after 3, 7 and 28 days of curing. The increase in strength due to the filling effect [33] of the FLG occurs for loads equal to 0.5% by the weight cement, whereas for the Type I graphene water-cured samples, a loading of 0.1% by the weight of cement was sufficient.
Even for the Type II graphene specimens cured in saturated air (Figure 5d), there is an improvement in compressive strength due to low FLG loadings relative to the cement weight. After 3 days, sample B-G01 increased 12.8% compared to the control specimen. For 7 and 28 days of curing, there is an increase in compressive strength of 23% and 20%, respectively, compared to the control specimen. For the Type II graphene-based B-G005 samples, it can be noted that the effect of FLG on the mechanical strength due to its filling effect can be obtained already for loads equal to 0.05% by the weight of cement, evidence of a correct dispersion of the addition in the cement matrix. Finally, B-G1 samples have shown a decrease in mechanical strength of 19% compared to the control sample after 3 days of curing; similarly, there was a decay in compressive strength after 7 and 28 days with decreases of 12.5% and 12%. In this regard, FLG loads of 1% have a worsening effect on compressive strength due to weaknesses caused by the formation of FLG clusters [85].
The increase in mortar strength can be attributed to two complementary effects: the filling effect of the FLG addition, limiting the formation of internal cracks by reducing the internal voids of the mortars [33]. Conversely, the addition of FLG above the threshold value of 1% of the weight of cement used may lead to a decrease in mechanical strength due to the formation of FLG clusters within the cement matrix [85].
Another exciting outcome of the tests is the beneficial effect of the superplasticiser turning out into better workability and fluidity of the material with a consequent reduction in voids.
The effect of FLG on the hydration of cement mortar can be deduced from the mechanical strength characterisation, i.e., the FLG-based samples showed an increase in flexural strength of 26.5%, compared to the 8% in the control samples. Furthermore, the increase in compressive strength for the FLG-based samples is 30.9%, while in the control samples (it achieves just 11.8%. The increases in mechanical strength for the FLG-based specimens indicate more significant hydration of the cement granules than in the control sample [89].
The water curing method shows more reliable results and highlights the effects of FLG on the mortar by increasing the difference between 2-D materials-based and control mortars. Besides, curing in water improves the mechanical resistance to compression with lower use of lightly processed FLG 0.1 instead of 0.5 by the weight of cement used; this feature lowers the cost of use and makes it more compatible with the cement composite sector.
Finally, it was found that the differences between the results obtained with the two different types of FLG are negligible, and consequently, a more elaborate material does not imply a significant increase in the mechanical performance of the mortar.

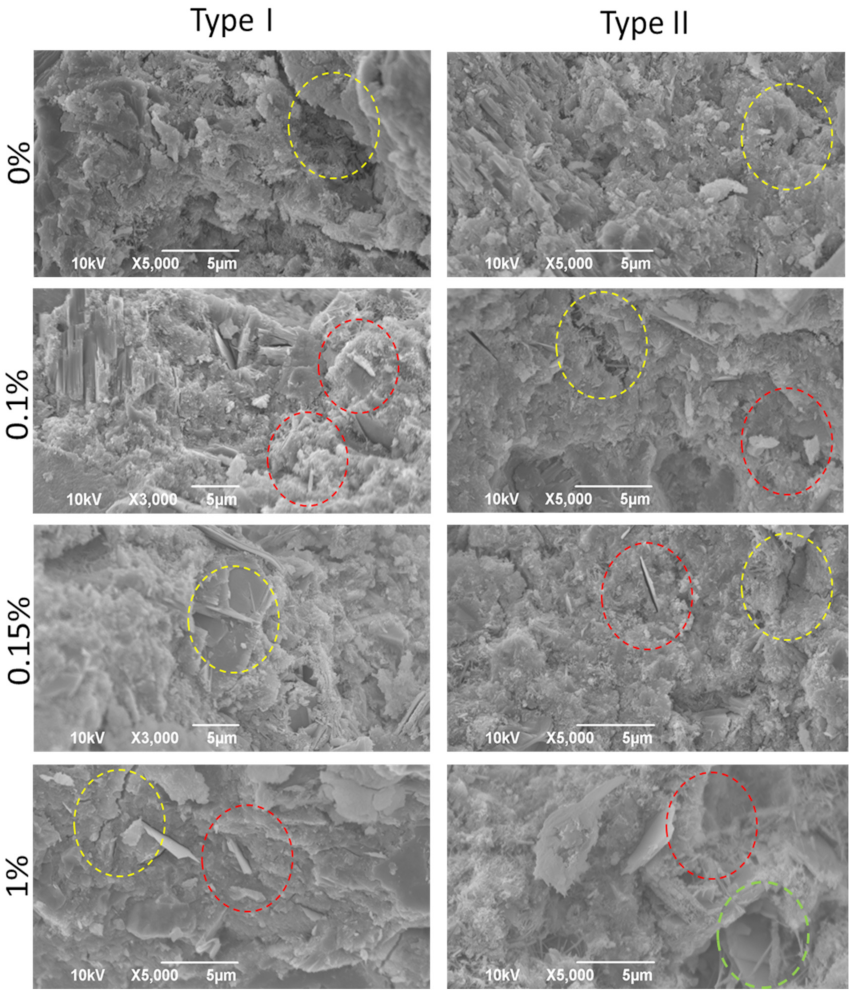
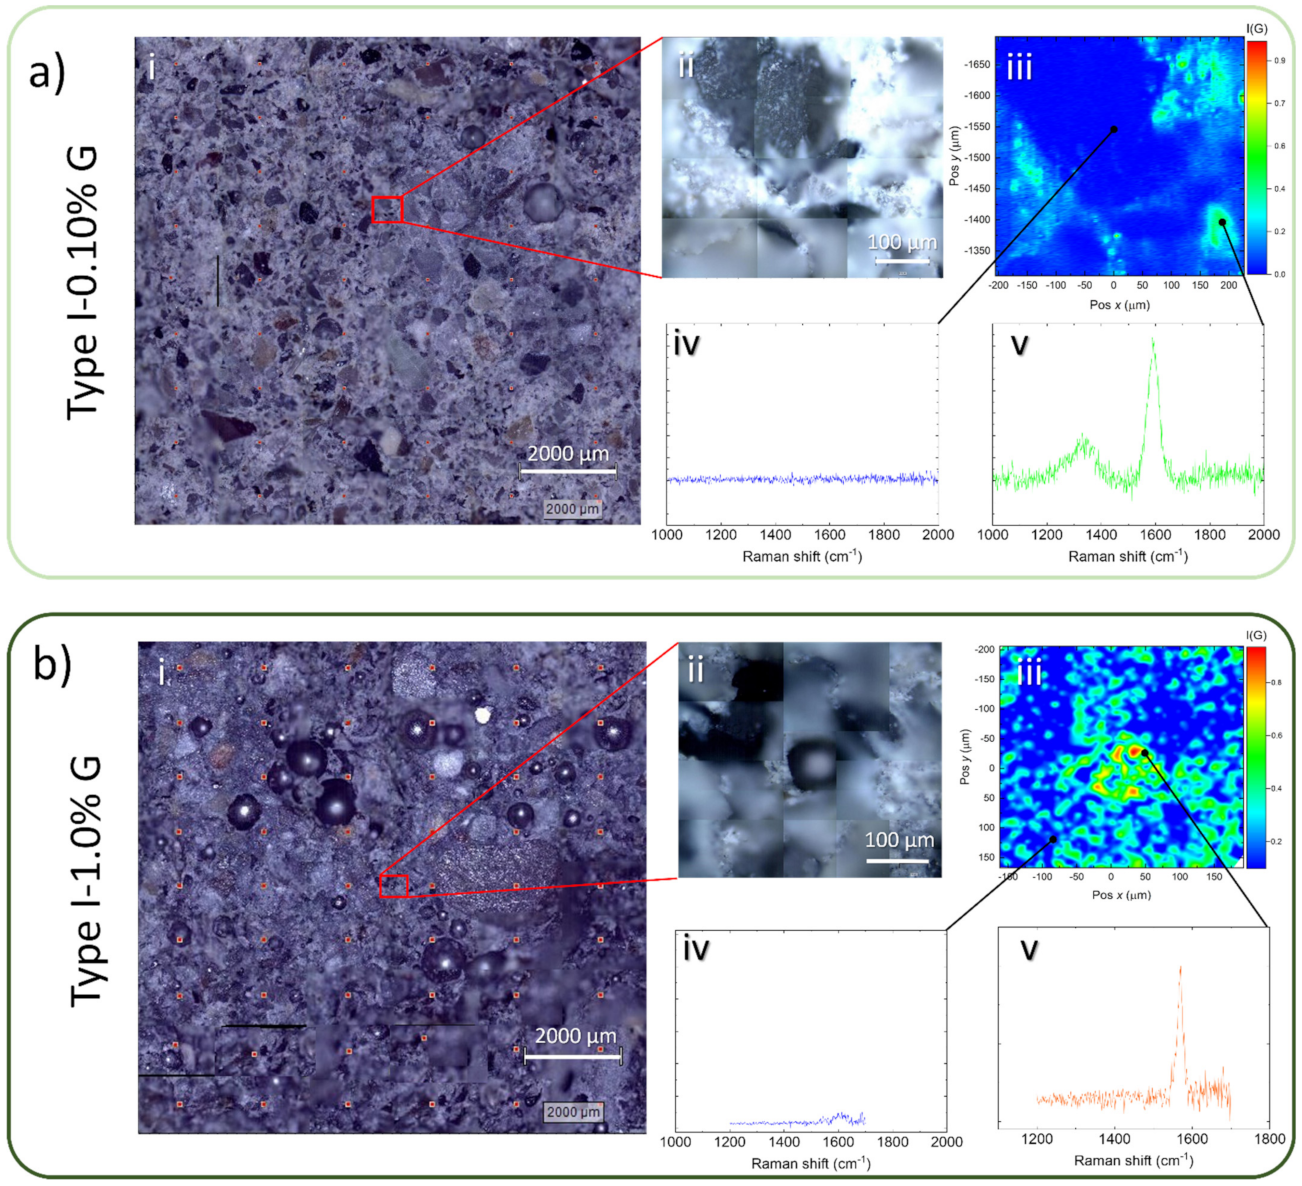
3.4. Graphene Dispersion in the Cementitious Matrix

The optical microscope, Raman spectroscopy and SEM were used to analyse the fractured surfaces of the Type I graphene water-cured specimen. Type I water-cured samples were chosen mainly for two reasons. As seen in Section 3.3, Type I graphene improves compressive strength (+25% compared to the control sample after 28 days) with a shorter production process, making it more attractive for industrial application. Besides, curing in water provides more significant growth in the compressive strength after 28 days than the samples cured in saturated air.
Optical microscope images of the fracture surfaces for mortars at 28 days, with an FLG loading of 0.01 and 1% by the weight of cement, are shown in Figure 6a(i),b(i). The number of voids is reduced for the A-G01 sample. Contrarily, the A-G1 sample presents voids affecting the mechanical properties and the durability of the mortar [31,36].
The spatial distribution of FLG in the cementitious composite is analysed exploiting Raman mapping. There are no statistical differences between the Raman spectra for the produced FLG and the FLG in the mortars, meaning that the process of mixing and curing cement mortar does not alter either physically or chemically the FLG. Figure 6a(iii),b(iii) show the Raman mappings. The presence of FLG is highlighted in green, the clusters in red and the absence of FLG-like materials in blue. It is observed that an FLG loading of 0.1% by the weight of cement does not form aggregates or clusters, while concentrations of 1% promote the formation of the cluster (in red in Figure 6b(iii)), compromising the mortar mechanical properties [85]. High FLG loading (>1% by weight of cement) in mixing water develops agglomerates that trap air [90], which forms voids within the composite matrix during the curing of the cement mortar, decreasing its mechanical performance.
Figure 6a(iv,v),b(iv,v) show the Raman spectra of the selected fracture plane surface points, indicated in a blue and lighter colour in the Raman mapping image: as can be seen from the images, the spectra of the points in green have the peaks (G and D band) characteristic of the FLG, while the points in blue are without them.
This study reveals an FLG loading threshold for improving mechanical performance, between 0.1% and 0.15% bwoc, where the FLG flakes can be homogeneously dispersed in the cement matrix. Above this threshold, the nano additive tends to form clusters, as seen in samples with an FLG loading of 1%, where the voids are visible (Figure 6b(i,ii)).
Figure 7 shows SEM images of Type I and Type II graphene-based mortar samples with the best (A-G01 and A-G015) and worst (A-G1) compressive strength after 28 days of curing.
The SEM images of the best mechanical performance mortars show that FLG flakes (encircled in red) are dispersed in the cementitious matrix, and it is possible to observe how the FLG flakes are embedded in the cement matrix. In addition, the images show that the fracture lines (highlighted in yellow) are located at the FLG clusters while not close to the individual flakes dispersed in the cement matrix.
SEM images for the A-G1 sample (worst increment of compressive strength compared to control sample: +6.4% for Type I graphene and +7.4% for Type II graphene) show FLG flakes and cluster concentrated close to cement mortar voids (encircled in green), suggesting that FLG loading of 1% boosts the bubble formation compromising the mortar strength.

4. Conclusions and Further Developments

It is demonstrated the production of >60% of few-layers graphene (FLG) using a mixture of water and commercially available superplasticiser for the exfoliation of graphite in a high-pressure homogeniser. This methodology allows the production of 1 kg per day of FLG, becoming a promising alternative to produce high-quality FLG in large quantities.
The produced FLG dispersions were used for cement mortar production to evaluate the effects of the nano additive (at different mass loadings) on the mechanical properties of the material. Two different curing methods were tested: in water and saturated air. Samples with 0.1% and 0.15% FLG loading by the weight of cement have shown an increase in compressive strength after 28 days between 25% and 29% compared to the standard mortars.
Compared to the control sample, FLG loadings of 0.1–0.15% by the weight of cement and 28 days of curing in water improve between 22% and 24% the flexural strength of cement.
The FLG contributed to avoiding the formation of microfractures, enhancing the connection between cement hydration products and sand. Interestingly, only 1 to 1.5 g of FLG per kg of cement is needed to improve more than 20% of mechanical performance.
The results presented here highlight new opportunities for the FLG application in sustainable cement composites.
Further tests will concern the effect of the FLG dispersion on the porosity (i.e., to evaluate the durability of the composite) and the thermal and electrical conductivity of FLG-based cement mortar.

Supplementary Materials

The following are available online at https://www.mdpi.com/article/10.3390/su14020784/s1, Figure S1: Particle size gradation curve of graphite and sand. Table S1: Composition of the cement 32.5 R CEM II/A-LL.

Author Contributions

Conceptualisation, S.P. and A.E.D.R.C.; investigation, S.P., A.E.D.R.C. and L.M.; writing—original draft preparation, S.P.; writing—review and editing, S.P., A.E.D.R.C., A.B., R.M. and F.B.; supervision of graphene production A.E.D.R.C. and F.B.; supervision of mechanical experimentation A.B. and R.M. All authors have read and agreed to the published version of the manuscript.

Funding

This research received no external funding.

Institutional Review Board Statement

Not applicable.

Informed Consent Statement

Not applicable.

Acknowledgements

The authors would like to thank all the Structure Laboratory staff of the Department of Civil, Chemical and Environmental Engineering (DICCA) of Università of Genoa and Simone Lauciello of Electron Microscopy facility of IIT for the experimental support.

Conflicts of Interest

The authors declare no conflict of interest.

References

  1. Kibert, C.J. Sustainable Construction: Green Building Design and Delivery, 4th ed.; Wiley: Hoboken, NJ, USA, 2016; ISBN 9781119055327. [Google Scholar]
  2. GlobalABC/IEA/UNEP (Global Alliance for Buildings and Construction, International Energy Agency, and the U.N.E.P.). GlobalABC Roadmap for Buildings and Construction: Towards a Zero-Emission, Efficient and Resilient Buildings and Construction Sector; GlobalABC/IEA/UNEP: Paris, France, 2020. [Google Scholar]
  3. Marinova, S.; Deetman, S.; van der Voet, E.; Daioglou, V. Global construction materials database and stock analysis of residential buildings between 1970–2050. J. Clean. Prod. 2020, 247, 119146. [Google Scholar] [CrossRef]
  4. Churkina, G.; Organschi, A.; Reyer, C.P.O.; Ruff, A.; Vinke, K.; Liu, Z.; Reck, B.K.; Graedel, T.E.; Schellnhuber, H.J. Buildings as a global carbon sink. Nat. Sustain. 2020, 3, 269–276. [Google Scholar] [CrossRef]
  5. Coppola, L.; Coffetti, D.; Crotti, E.; Gazzaniga, G.; Pastore, T. An Empathetic Added Sustainability Index (EASI) for cementitious based construction materials. J. Clean. Prod. 2019, 220, 475–482. [Google Scholar] [CrossRef]
  6. Monteiro, P.J.M.; Miller, S.A.; Horvath, A. Towards sustainable concrete. Nat. Mater. 2017, 16, 698–699. [Google Scholar] [CrossRef]
  7. Lehne, J.; Preston, F. Making Concrete Change; Innovation in Low-Carbon Cement and Concrete; Chatham House Report; Energy Enivronment and Resources Department: London, UK, 2018. [Google Scholar]
  8. Habert, G.; Miller, S.A.; John, V.M.; Provis, J.L.; Favier, A.; Horvath, A.; Scrivener, K.L. Environmental impacts and decarbonization strategies in the cement and concrete industries. Nat. Rev. Earth Environ. 2020, 1, 559–573. [Google Scholar] [CrossRef]
  9. Miller, S.A.; Myers, R.J. Environmental Impacts of Alternative Cement Binders. Environ. Sci. Technol. 2020, 54, 677–686. [Google Scholar] [CrossRef]
  10. Golewski, G.L. Energy savings associated with the use of fly ash and nanoadditives in the cement composition. Energies 2020, 13, 2184. [Google Scholar] [CrossRef]
  11. Gopalakrishnan, R.; Jeyalakshmi, R. The effects on durability and mechanical properties of multiple nano and micro additive OPC mortar exposed to combined chloride and sulfate attack. Mater. Sci. Semicond. Process. 2020, 106, 104772. [Google Scholar] [CrossRef]
  12. Robalo, K.; Soldado, E.; Costa, H.; do Carmo, R.; Alves, H.; Júlio, E. Efficiency of cement content and of compactness on mechanical performance of low cement concrete designed with packing optimization. Constr. Build. Mater. 2021, 266, 121077. [Google Scholar] [CrossRef]
  13. Chakraborty, S.; Jo, B.W.; Yoon, Y.S. Development of Nano Cement Concrete by Top-Down and Bottom-Up Nanotechnology Concept. In Smart Nanoconcretes and Cement-Based Materials: Properties, Modelling and Applications; Elsevier Inc.: Amsterdam, The Netherlands, 2019; pp. 183–213. ISBN 9780128178553. [Google Scholar]
  14. Norhasri, M.S.M.; Hamidah, M.S.; Fadzil, A.M. Inclusion of nano metaclayed as additive in ultra high performance concrete (UHPC). Constr. Build. Mater. 2019, 201, 590–598. [Google Scholar] [CrossRef]
  15. Alrekabi, S.; Cundy, A.B.; Lampropoulos, A.; Whitby, R.L.D.; Savina, I. Mechanical performance of novel cement-based composites prepared with nano-fibres, and hybrid nano- and micro-fibres. Compos. Struct. 2017, 178, 145–156. [Google Scholar] [CrossRef]
  16. Seifan, M.; Mendoza, S.; Berenjian, A. Mechanical properties and durability performance of fly ash based mortar containing nano- and micro-silica additives. Constr. Build. Mater. 2020, 252, 119121. [Google Scholar] [CrossRef]
  17. Zhang, A.; Yang, W.; Ge, Y.; Du, Y.; Liu, P. Effects of nano-SiO2 and nano-Al2O3 on mechanical and durability properties of cement-based materials: A comparative study. J. Build. Eng. 2021, 34, 101936. [Google Scholar] [CrossRef]
  18. Sun, J.; Tian, L.; Yu, Z.; Zhang, Y.; Li, C.; Hou, G.; Shen, X. Studies on the size effects of nano-TiO2 on Portland cement hydration with different water to solid ratios. Constr. Build. Mater. 2020, 259, 120390. [Google Scholar] [CrossRef]
  19. Najjar, M.F.; Soliman, A.M.; Nehdi, M.L. Critical overview of two-stage concrete: Properties and applications. Constr. Build. Mater. 2014, 62, 47–58. [Google Scholar] [CrossRef]
  20. Reches, Y. Nanoparticles as concrete additives: Review and perspectives. Constr. Build. Mater. 2018, 175, 483–495. [Google Scholar] [CrossRef]
  21. Carriço, A.; Bogas, J.A.; Hawreen, A.; Guedes, M. Durability of multi-walled carbon nanotube reinforced concrete. Constr. Build. Mater. 2018, 164, 121–133. [Google Scholar] [CrossRef]
  22. Rehman, S.K.U.; Kumarova, S.; Memon, S.A.; Javed, M.F.; Jameel, M. A review of microscale, rheological, mechanical, thermoelectrical and piezoresistive properties of graphene based cement composite. Nanomaterials 2020, 10, 2076. [Google Scholar] [CrossRef]
  23. Yoo, D.Y.; You, I.; Lee, S.J. Electrical properties of cement-based composites with carbon nanotubes, graphene, and graphite nanofibers. Sensors 2017, 17, 1064. [Google Scholar] [CrossRef]
  24. Kumar, S.; Kolay, P.; Malla, S.; Mishra, S. Effect of multiwalled carbon nanotube in cement composite on mechanical strength and freeze-thaw susceptibility. Adv. Civ. Eng. Mater. 2015, 4, 257–274. [Google Scholar] [CrossRef]
  25. Gao, F.; Tian, W.; Wang, Z.; Wang, F. Effect of diameter of multi-walled carbon nanotubes on mechanical properties and microstructure of the cement-based materials. Constr. Build. Mater. 2020, 260, 120452. [Google Scholar] [CrossRef]
  26. Ruan, C.; Lin, J.; Chen, S.; Sagoe-Crentsil, K.; Duan, W. Effect of Graphene Oxide on the Pore Structure of Cement Paste: Implications for Performance Enhancement. ACS Appl. Nano Mater. 2021, 4, 10623–10633. [Google Scholar] [CrossRef]
  27. Zhao, L.; Guo, X.; Song, L.; Song, Y.; Dai, G.; Liu, J. An intensive review on the role of graphene oxide in cement-based materials. Constr. Build. Mater. 2020, 241, 117939. [Google Scholar] [CrossRef]
  28. Li, X.; Li, C.; Liu, Y.; Chen, S.J.; Wang, C.M.; Sanjayan, J.G.; Duan, W.H. Improvement of mechanical properties by incorporating graphene oxide into cement mortar. Mech. Adv. Mater. Struct. 2018, 25, 1313–1322. [Google Scholar] [CrossRef]
  29. Peng, H.; Ge, Y.; Cai, C.S.; Zhang, Y.; Liu, Z. Mechanical properties and microstructure of graphene oxide cement-based composites. Constr. Build. Mater. 2019, 194, 102–109. [Google Scholar] [CrossRef]
  30. Parviz, D.; Irin, F.; Shah, S.A.; Das, S.; Sweeney, C.B.; Green, M.J. Challenges in Liquid-Phase Exfoliation, Processing, and Assembly of Pristine Graphene. Adv. Mater. 2016, 28, 8796–8818. [Google Scholar] [CrossRef]
  31. Nagyte, V.; Kelly, D.J.; Felten, A.; Picardi, G.; Shin, Y.Y.; Alieva, A.; Worsley, R.E.; Parvez, K.; Dehm, S.; Krupke, R.; et al. Raman Fingerprints of Graphene Produced by Anodic Electrochemical Exfoliation. Nano Lett. 2020, 20, 3411–3419. [Google Scholar] [CrossRef]
  32. Krystek, M.; Pakulski, D.; Patroniak, V.; Górski, M.; Szojda, L.; Ciesielski, A.; Samorì, P. High-Performance Graphene-Based Cementitious Composites. Adv. Sci. 2019, 6, 1801195. [Google Scholar] [CrossRef] [Green Version]
  33. Yang, H.; Cui, H.; Tang, W.; Li, Z.; Han, N.; Xing, F. A critical review on research progress of graphene/cement based composites. Compos. Part A Appl. Sci. Manuf. 2017, 102, 273–296. [Google Scholar] [CrossRef]
  34. Bianco, A.; Cheng, H.M.; Enoki, T.; Gogotsi, Y.; Hurt, R.H.; Koratkar, N.; Kyotani, T.; Monthioux, M.; Park, C.R.; Tascon, J.M.D.; et al. All in the graphene family—A recommended nomenclature for two-dimensional carbon materials. Carbon 2013, 65, 1–6. [Google Scholar] [CrossRef]
  35. Cataldi, P.; Bonaccorso, F.; Esau del Rio Castillo, A.; Pellegrini, V.; Jiang, Z.; Liu, L.; Boccardo, N.; Canepa, M.; Cingolani, R.; Athanassiou, A.; et al. Cellulosic Graphene Biocomposites for Versatile High-Performance Flexible Electronic Applications. Adv. Electron. Mater. 2016, 2, 1600245. [Google Scholar] [CrossRef]
  36. Tong, T.; Fan, Z.; Liu, Q.; Wang, S.; Tan, S.; Yu, Q. Investigation of the effects of graphene and graphene oxide nanoplatelets on the micro- and macro-properties of cementitious materials. Constr. Build. Mater. 2016, 106, 102–114. [Google Scholar] [CrossRef]
  37. Baomin, W.; Shuang, D. Effect and mechanism of graphene nanoplatelets on hydration reaction, mechanical properties and microstructure of cement composites. Constr. Build. Mater. 2019, 228, 116720. [Google Scholar] [CrossRef]
  38. Du, H.; Pang, S.D. Enhancement of barrier properties of cement mortar with graphene nanoplatelet. Cem. Concr. Res. 2015, 76, 10–19. [Google Scholar] [CrossRef]
  39. Tao, J.; Wang, X.; Wang, Z.; Zeng, Q. Graphene nanoplatelets as an effective additive to tune the microstructures and piezoresistive properties of cement-based composites. Constr. Build. Mater. 2019, 209, 665–678. [Google Scholar] [CrossRef]
  40. Pisello, A.L.; D’Alessandro, A.; Sambuco, S.; Rallini, M.; Ubertini, F.; Asdrubali, F.; Materazzi, A.L.; Cotana, F. Multipurpose experimental characterization of smart nanocomposite cement-based materials for thermal-energy efficiency and strain-sensing capability. Sol. Energy Mater. Sol. Cells 2017, 161, 77–88. [Google Scholar] [CrossRef]
  41. Loh, K.J.; Ryu, D. Multifunctional Materials and Nanotechnology for Assessing and Monitoring Civil Infrastructures; Woodhead Publishing Limited: Sawston, UK, 2014; Volume 1, pp. 295–326. ISBN 9780857094322. [Google Scholar]
  42. Han, B.; Zhang, L.; Ou, J. Smart and Multifunctional Concrete Towards Sustainable Infrastructures; Springer: Singapore, 2017; ISBN 9789811043482. [Google Scholar]
  43. Zheng, Q.; Han, B.; Cui, X.; Yu, X.; Ou, J. Graphene-engineered cementitious composites: Small makes a big impact. Nanomater. Nanotechnol. 2017, 7, 1–18. [Google Scholar] [CrossRef]
  44. Bai, S.; Jiang, L.; Jiang, Y.; Jin, M.; Jiang, S.; Tao, D. Research on electrical conductivity of graphene/cement composites. Adv. Cem. Res. 2018, 32, 45–52. [Google Scholar] [CrossRef]
  45. Wang, P.; Yao, T.; Li, Z.; Wei, W.; Xie, Q.; Duan, W.; Han, H. A superhydrophobic/electrothermal synergistically anti-icing strategy based on graphene composite. Compos. Sci. Technol. 2020, 198, 108307. [Google Scholar] [CrossRef]
  46. Lin, Y.; Du, H. Graphene reinforced cement composites: A review. Constr. Build. Mater. 2020, 265, 120312. [Google Scholar] [CrossRef]
  47. Krystek, M.; Ciesielski, A.; Samorì, P. Graphene-Based Cementitious Composites: Toward Next-Generation Construction Technologies. Adv. Funct. Mater. 2021, 31, 2101887. [Google Scholar] [CrossRef]
  48. Makul, N. Advanced smart concrete—A review of current progress, benefits and challenges. J. Clean. Prod. 2020, 274, 122899. [Google Scholar] [CrossRef]
  49. Graphene Flagship. Annual Report 2018; Graphene Flagship: Munich, Germany, 2018. [Google Scholar]
  50. Yang, L.; Chen, W.; Yu, Q.; Liu, B. Mass production of two-dimensional materials beyond graphene and their applications. Nano Res. 2021, 14, 1583–1597. [Google Scholar] [CrossRef]
  51. Ferrari, A.C.; Bonaccorso, F.; Fal’ko, V.; Novoselov, K.S.; Roche, S.; Bøggild, P.; Borini, S.; Koppens, F.H.L.L.; Palermo, V.; Pugno, N.; et al. Science and technology roadmap for graphene, related two-dimensional crystals, and hybrid systems. Nanoscale 2015, 7, 4598–4810. [Google Scholar] [CrossRef] [PubMed] [Green Version]
  52. Paton, K.R.; Varrla, E.; Backes, C.; Smith, R.J.; Neill, A.O.; Boland, C.; Lotya, M.; Istrate, O.M.; King, P.; Pennycook, J.; et al. Scalable production of large quantities of defect-free few-layer graphene by shear exfoliation in liquids. Nat. Mater. 2014, 13, 624–630. [Google Scholar] [CrossRef] [PubMed]
  53. Hernandez, Y.; Nicolosi, V.; Lotya, M.; Blighe, F.M.; Sun, Z.; De, S.; McGovern, I.T.; Holland, B.; Byrne, M.; Gunko, Y.; et al. High-yield production of graphene by liquid-phase exfoliation of graphite. Nat. Nanotechnol. 2008, 3, 563–568. [Google Scholar] [CrossRef] [PubMed] [Green Version]
  54. Bonaccorso, F.; Bartolotta, A.; Coleman, J.N.; Backes, C. 2D-Crystal-Based Functional Inks. Adv. Mater. 2016, 28, 6136–6166. [Google Scholar] [CrossRef]
  55. Marago, O.M.; Bonaccorso, F.; Saija, R.; Privitera, G.; Gucciardi, P.G.; Iatì, M.A.; Calogero, G.; Jones, P.H.; Borghese, F.; Denti, P.; et al. Brownian motion of graphene. ACS Nano 2010, 4, 7515–7523. [Google Scholar] [CrossRef] [Green Version]
  56. Bonaccorso, F.; Lombardo, A.; Hasan, T.; Sun, Z.Z.; Colombo, L.; Ferrari, A.C. Production and processing of graphene and 2d crystals. Mater. Today 2012, 15, 564–589. [Google Scholar] [CrossRef]
  57. Capasso, A.; Del Rio-Castillo, A.E.; Sun, H.; Ansaldo, A.; Pellegrini, V.; Bonaccorso, F. Ink-jet printing of graphene for fl exible electronics: An environmentally-friendly approach. Solid State Commun. 2015, 224, 53–63. [Google Scholar] [CrossRef] [Green Version]
  58. Zhang, Z.; Jin, H.; Wu, C.; Ji, J. Efficient Production of High-Quality Few-Layer Graphene Using a Simple Hydrodynamic-Assisted Exfoliation Method. Nanoscale Res. Lett. 2018, 13, 416. [Google Scholar] [CrossRef]
  59. Del Rio Castillo, A.E.; Pellegrini, V.; Ansaldo, A.; Ricciardella, F.; Sun, H.; Marasco, L.; Buha, J.; Dang, Z.; Gagliani, L.; Lago, E.; et al. High-yield production of 2D crystals by wet-jet milling. Mater. Horizons 2018, 5, 890–904. [Google Scholar] [CrossRef] [Green Version]
  60. Khan, U.; Porwal, H.; Neill, A.O.; Nawaz, K.; May, P.; Coleman, J.N. Solvent-Exfoliated Graphene at Extremely High Concentration. Langmuir 2011, 27, 9077–9082. [Google Scholar] [CrossRef]
  61. Essig, S.; Marquardt, C.W.; Vijayaraghavan, A.; Ganzhorn, M.; Dehm, S.; Hennrich, F.; Ou, F.; Green, A.A.; Sciascia, C.; Bonaccorso, F.; et al. Phonon-assisted electroluminescence from metallic carbon nanotubes and graphene. Nano Lett. 2010, 10, 1589–1594. [Google Scholar] [CrossRef] [PubMed]
  62. Henderson, R.K.; Jiménez-González, C.; Constable, D.J.C.; Alston, S.R.; Inglis, G.G.A.; Fisher, G.; Sherwood, J.; Binks, S.P.; Curzons, A.D. Expanding GSK’s solvent selection guide—Embedding sustainability into solvent selection starting at medicinal chemistry. Green Chem. 2011, 13, 854–862. [Google Scholar] [CrossRef]
  63. Bonaccorso, F.; Hasan, T.; Tan, P.H.; Sciascia, C.; Privitera, G.; Di Marco, G.; Gucciardi, P.G.; Ferrari, A.C. Density Gradient Ultracentrifugation of Nanotubes: Interplay of Bundling and Surfactants Encapsulation. J. Phys. Chem. C 2010, 114, 17267–17285. [Google Scholar] [CrossRef] [Green Version]
  64. Lotya, M.; King, P.J.; Khan, U.; De, S.; Coleman, J.N. High-concentration, surfactant-stabilized graphene dispersions. ACS Nano 2010, 4, 3155–3162. [Google Scholar] [CrossRef] [PubMed]
  65. Wang, S.; Yi, M.; Shen, Z. The effect of surfactants and their concentration on the liquid exfoliation of graphene. RSC Adv. 2016, 6, 56705–56710. [Google Scholar] [CrossRef] [Green Version]
  66. Xu, Y.; Cao, H.; Xue, Y.; Li, B.; Cai, W. Liquid-Phase Exfoliation of Graphene: An Overview on Exfoliation Media, Techniques, and Challenges. Nanomaterials 2018, 8, 942. [Google Scholar] [CrossRef] [Green Version]
  67. Dehwah, H.A.F.; Maslehuddin, M.; Austin, S.A. Long-term effect of sulfate ions and associated cation type on chloride-induced reinforcement corrosion in Portland cement concretes. Cem. Concr. Compos. 2002, 24, 17–25. [Google Scholar] [CrossRef] [Green Version]
  68. Figueira, R.B.; Sousa, R.; Coelho, L.; Azenha, M.; de Almeida, J.M.; Jorge, P.A.S.; Silva, C.J.R. Alkali-silica reaction in concrete: Mechanisms, mitigation and test methods. Constr. Build. Mater. 2019, 222, 903–931. [Google Scholar] [CrossRef]
  69. Sha, S.; Wang, M.; Shi, C.; Xiao, Y. Influence of the structures of polycarboxylate superplasticizer on its performance in cement-based materials—A review. Constr. Build. Mater. 2020, 233, 117257. [Google Scholar] [CrossRef]
  70. Del Río Castillo, A.E.; Reyes-Vazquez, C.D.; Rojas-Martinez, L.E.; Pellegrini, V.; Bonaccorso, F. Single-step exfoliation and functionalization of few-layers black phosphorus and its application for polymer composites. FlatChem 2019, 18, 100131. [Google Scholar] [CrossRef]
  71. Carbone, L.; Del Rio Castillo, A.E.; Kumar Panda, J.; Pugliese, G.; Scarpellini, A.; Bonaccorso, F.; Pellegrini, V. High-Sulfur-Content Graphene-Based Composite through Ethanol Evaporation for High-Energy Lithium-Sulfur Battery. ChemSusChem 2020, 13, 1593–1602. [Google Scholar] [CrossRef] [PubMed]
  72. Frappa, M.; Del Rio Castillo, A.E.; Macedonio, F.; Politano, A.; Drioli, E.; Bonaccorso, F.; Pellegrini, V.; Gugliuzza, A. A few-layer graphene for advanced composite PVDF membranes dedicated to water desalination: A comparative study. Nanoscale Adv. 2020, 2, 4728–4739. [Google Scholar] [CrossRef]
  73. Liscio, A.; Kouroupis-Agalou, K.; Betriu, X.D.; Kovtun, A.; Treossi, E.; Pugno, N.M.; De Luca, G.; Giorgini, L.; Palermo, V. Evolution of the size and shape of 2D nanosheets during ultrasonic fragmentation. 2D Mater. 2017, 4, 025017. [Google Scholar] [CrossRef]
  74. Ferrari, A.C.; Meyer, J.C.; Scardaci, V.; Casiraghi, C.; Lazzeri, M.; Mauri, F.; Piscanec, S.; Jiang, D.; Novoselov, K.S.; Roth, S.; et al. Raman spectrum of graphene and graphene layers. Phys. Rev. Lett. 2006, 97, 187401. [Google Scholar] [CrossRef] [Green Version]
  75. Ferrari, A.C.; Basko, D.M. Raman spectroscopy as a versatile tool for studying the properties of graphene. Nat. Nanotechnol. 2013, 8, 235–246. [Google Scholar] [CrossRef] [Green Version]
  76. Ferrari, A.; Robertson, J. Interpretation of Raman spectra of disordered and amorphous carbon. Phys. Rev. B Condens. Matter Mater. Phys. 2000, 61, 14095–14107. [Google Scholar] [CrossRef] [Green Version]
  77. Ferrari, A.C.; Robertson, J. Resonant Raman spectroscopy of disordered, amorphous, and diamondlike carbon. Phys. Rev. B Condens. Matter Mater. Phys. 2001, 64, 075414. [Google Scholar] [CrossRef] [Green Version]
  78. Yang, L.; Deslippe, J.; Park, C.H.; Cohen, M.L.; Louie, S.G. Excitonic Effects on the Optical Response of Graphene and Bilayer Graphene. Phys. Rev. Lett. 2009, 103, 186802. [Google Scholar] [CrossRef]
  79. Casiraghi, C.; Pisana, S.; Novoselov, K.S.; Geim, A.K.; Ferrari, A.C. Raman fingerprint of charged impurities in graphene. Appl. Phys. Lett. 2007, 91, 233108. [Google Scholar] [CrossRef] [Green Version]
  80. Dresselhaus, M.S.; Dresselhaus, G.; Hofmann, M. Raman spectroscopy as a probe of graphene and carbon nanotubes. Philos. Trans. R. Soc. A Math. Phys. Eng. Sci. 2008, 366, 231–236. [Google Scholar] [CrossRef]
  81. Nuvoli, D.; Valentini, L.; Alzari, V.; Scognamillo, S.; Bon, S.B.; Piccinini, M.; Illescas, J.; Mariani, A. High concentration few-layer graphene sheets obtained by liquid phase exfoliation of graphite in ionic liquid. J. Mater. Chem. 2011, 21, 3428. [Google Scholar] [CrossRef]
  82. Ansaldo, A.; Bondavalli, P.; Bellani, S.; Del Rio Castillo, A.E.A.E.; Prato, M.; Pellegrini, V.; Pognon, G.; Bonaccorso, F. High-power graphene–Carbon nanotube hybrid supercapacitors. ChemNanoMat 2017, 3, 436–446. [Google Scholar] [CrossRef]
  83. Das, A.; Chakraborty, B.; Sood, A.K. Raman spectroscopy of graphene on different substrates and influence of defects. Bull. Mater. Sci. 2008, 31, 579–584. [Google Scholar] [CrossRef]
  84. Liu, J.; Fu, J.; Yang, Y.; Gu, C. Study on dispersion, mechanical and microstructure properties of cement paste incorporating graphene sheets. Constr. Build. Mater. 2019, 199, 1–11. [Google Scholar] [CrossRef]
  85. Du, H.; Pang, S.D. Dispersion and stability of graphene nanoplatelet in water and its influence on cement composites. Constr. Build. Mater. 2018, 167, 403–413. [Google Scholar] [CrossRef]
  86. Zhang, L.; Miao, X.; Kong, X.; Zhou, S. Retardation effect of PCE superplasticizers with different architectures and their impacts on early strength of cement mortar. Cem. Concr. Compos. 2019, 104, 103369. [Google Scholar] [CrossRef]
  87. Zhao, Y.; Liu, Y.; Shi, T.; Gu, Y.; Zheng, B.; Zhang, K.; Xu, J.; Fu, Y.; Shi, S. Study of mechanical properties and early-stage deformation properties of graphene-modified cement-based materials. Constr. Build. Mater. 2020, 257, 119498. [Google Scholar] [CrossRef]
  88. Dong, S.; Wang, Y.; Ashour, A.; Han, B.; Ou, J. Nano/micro-structures and mechanical properties of ultra-high performance concrete incorporating graphene with different lateral sizes. Compos. Part A Appl. Sci. Manuf. 2020, 137, 106011. [Google Scholar] [CrossRef]
  89. Sun, Z.; Ye, G.; Shah, S.P. Microstructure and early-age properties of Portland cement paste—Effects of connectivity of solid phases. ACI Mater. J. 2005, 102, 122–129. [Google Scholar] [CrossRef]
  90. Bepete, G.; Anglaret, E.; Ortolani, L.; Morandi, V.; Huang, K.; Pénicaud, A.; Drummond, C. Surfactant-free single-layer graphene in water. Nat. Chem. 2017, 9, 347–352. [Google Scholar] [CrossRef] [PubMed] [Green Version]
Figure 1. Scheme of the WJM process: the piston takes the solvent/graphite mixture and activates it towards the processor, where exfoliation is performed, then the exfoliated graphite is cooled in a chiller and recovered in a container.
Sustainability 14 00784 g001
Figure 2. (a,b) TEM images of the exfoliated specimens with the two different procedures. The inserts show the distribution of the lateral dimension. (c) Raman spectra for the graphite, reference state, and exfoliated specimens. (d) Histogram of the normalised intensity of the D-band. (e) Histogram of the FWHM of the G-band. (f) Correlation between I(D)/I(G) vs FWHM(G). (g) Analysis of the 2D sub-bands: graphene layers are referenced as a percentage—the dashed line sets the frontier between FLG and graphite 2D zones.
Sustainability 14 00784 g002
Figure 3. SEM images of the FLG-based mortar. (a) SEM image of the control sample. (b) SEM image of the Type I graphene sample with a 1% by weight of cement loading. (c) SEM image of the Type II graphene sample with a 1% by weight of cement loading.
Sustainability 14 00784 g003
Figure 4. Mechanical performance of the FLG-based cement mortars cured in water. (a) Flexural strength result of the Type I graphene mortars after curing 3, 7 and 28 days. (b) Flexural strength result of the Type II graphene mortars after curing 3, 7 and 28 days. (c) Compressive strength result of the Type I graphene mortars after curing 3, 7 and 28 days. (d) Compressive strength result of the Type II graphene mortars after curing 3, 7 and 28 days. Note: Control and SP are FLG-free control samples. All FLG loading percentages are relative to the weight of cement used.
Sustainability 14 00784 g004
Figure 5. Mechanical performance of the FLG-based cement mortars cured in water. (a) Flexural strength result of the Type I graphene mortars after curing 3, 7 and 28 days. (b) Flexural strength result of the Type II graphene mortars after curing 3, 7 and 28 days. (c) Compressive strength result of the Type I graphene mortars after curing 3, 7 and 28 days. (d) Compressive strength result of the Type II graphene mortars after curing 3, 7 and 28 days. Note: Control and SP are FLG-free control samples. All FLG loading percentages are relative to the weight of cement used.
Sustainability 14 00784 g005
Figure 6. Composition of images concerning the evaluation of FLG dispersion in the cement matrix, with loadings of 0.1% (a) and 1% (b) by the weight of cement. (i) Optical microscopy images of a fragment of the fracture surface; highlighted in red areas analysed by Raman mapping. (ii) Gradient on the area delineated by the red rectangle. (iii) Image obtained by Raman mapping. (iv) Raman spectrum of a mortar sample without FLG (v) Raman spectrum of a mortar sample with an FLG flake inside.
Sustainability 14 00784 g006
Figure 7. SEM images of the fracture surfaces after the three-point bending and compressive strength tests. The FLG flakes, the cracking line and the void are marked with red, yellow and green lines.
Sustainability 14 00784 g007
Table 1. Composition of the FLG loading of the cast for FLG-based mortars. All the casts were made with 900 g of cement, 2700 g of sand, 450 g of mixing water. Legend: bwoc = by weight of cement; bwog = by weight of FLG.
SampleFLGSuperplasticiser
[% bwoc][% bwoc][% bwog]
Control//////
SP.//0.25//
G0050.050.2030
G010.10.2030
G150.150.230
G050.50.230
G110.230
Table 2. Flexural and compressive strength for water-cured (A-group) and air saturated-cured (B-group) mortars with different FLG content, ageing time and exfoliation procedure. Type I and II indicate the FLG dispersion used for the specimen in the column table. All units are in MPa. Legend: f: strength. t and c subscript: flexural or compressive, respectively. The number in the subscript indicates the ageing in days from casting. Flexural strength: are the mean value of four tests. Compressive strength: are the mean value out of eight tests.
ft,3ft,7ft,28fc,3fc,7fc,28
IIIIIIIIIIIIIIIIII
A-Control4.85.25.823.326.029.1
A-SP5.45.76.125.428.432.9
A-G0055.55.35.95.66.96.327.625.731.229.735.433.7
A-G015.45.85.76.37.16.827.129.130.231.936.235.8
A-G0155.55.96.06.06.86.826.328.031.532.633.537.5
A-G055.35.85.56.06.06.825.024.928.932.632.636.6
A-G15.35.15.45.36.36.321.323.727.226.530.931.2
B-Control4.95.15.723.425.331.0
B-SP5.35.56.424.928.335.9
B-G0055.25.15.95.36.06.926.526.026.931.234.837.2
B-G015.65.95.66.06.96.726.626.329.628.732.735.5
B-G0155.25.96.05.97.06.826.125.929.530.035.335.9
B-G054.95.66.25.86.66.926.625.031.229.336.236.0
B-G14.84.95.05.25.76.523.419.027.422.232.427.4
Publisher’s Note: MDPI stays neutral with regard to jurisdictional claims in published maps and institutional affiliations.

