Article

A Data-Driven Packaging Efficiency Optimization Method for a Low Carbon System in Agri-Products Cold Chain

1
Institute of Agricultural Economics and Information, Guangdong Academy of Agricultural Sciences, Guangzhou 510640, China
2
College of Engineering, China Agricultural University, Beijing 100083, China
3
Beijing Laboratory of Food Quality and Safety, Beijing 100083, China
4
Key Laboratory of Urban Agriculture in South China, Ministry of Agriculture and Rural Affairs, Guangzhou 510640, China
*
Authors to whom correspondence should be addressed.
Sustainability 2022, 14(2), 858; https://doi.org/10.3390/su14020858
Submission received: 10 November 2021 / Revised: 14 December 2021 / Accepted: 16 December 2021 / Published: 12 January 2022
(This article belongs to the Special Issue Data-Driven Development for Sustainable Smart Product-Service Systems)

Abstract

:
The of monitoring the Internet of Things (IoT) in the cold chain allows process data, including packaging data, to be more easily accessible. Proper optimization modelling is the core driving force towards the green and low-carbon operation of cold chain logistics, laying the necessary foundation for the development of a data-driven modelling system. Since efficient packaging is necessary for loss control in the cold chain, its final efficiency during circulation is important for realizing continuous loss prevention and efficient supply. Thus, it is urgent to determine how to utilize these continuously acquired data and how to formulate a more accurate packaging efficiency control methodology in the agri-products cold chain. Through continuous monitoring, we examined the feasibility of this topic by focusing on the concept of data-driven evaluation modelling and the dynamic formation mechanism of comprehensive packaging efficiency in cold chain logistics. The packaging efficiency in the table grape cold chain was used as an example to evaluate the comprehensive efficiency evaluation index system and data-driven evaluation framework proposed in this paper. Our results indicate that the established methodology can adapt to the continuity of comprehensive packaging efficiency, also reflecting the comprehensive efficiency evaluation of the packaging for different times and distances. Through the evaluation of our results, the differences and the dynamic processes between different final packaging efficiencies at different moments are effectively displayed. Thus, the continuous improvement of a low-carbon system in cold chain logistics could be realized.

1. Introduction

1.1. Research Backgrounds

To achieve the long-term goal of “dual-carbon”, the low-carbon cold chain logistics of fresh agricultural products is the most prominent link when constructing green and low-carbon circulation systems. Advances in information technology, including IoT, blockchain, artificial intelligence (AI), big data analytics (BDA), etc., have significantly accelerated the digitalization of the cold chain. Various data acquisition methods ensure that cold chain packaging is assimilated into data-driven systems, but the benefits of BDA have not been fully explored yet [1]. The monitoring of the IoT in cold chain logistics facilitates the acquisition of cold chain process data, including cold chain packaging, forming new data sets for the cold chain packaging of fresh agricultural products. This application scenario has become imperative in promoting the cold chain packaging process, which is useful for improving its efficiency. While this type of big data application relies heavily on reliable data, data-driven systems provide a feasible solution to remedy the defects, as they are more resilient than traditional data treatments.
With the further development of Internet of Things monitoring technologies for the cold chain logistics of fresh agricultural products, the requirements for the preservation of these products continue to increase, and the innovation of cold chain packaging practices for fresh agricultural products and the evaluation of their efficiency are increasingly attracting the attention of scholars [2]. Research on comprehensive efficiency evaluation systems for the cold chain packaging of fresh agricultural products from the data perspective conforms to current research trends [3], and data collection systems and management information evaluation systems should also fully adapt to the developmental needs of data quality. With the development of intelligent packaging for various fresh agricultural products in fresh food e-commerce [4], the development of the data connection of the cold chain packaging of fresh agricultural products and the improvements in packaging have been promoted. From the gradually developed and mature intelligent packaging to research into the types of packaging that are used for various fresh agricultural products, data applications and research into analysis methods are necessary [5]. Additionally, emerging technologies and computer systems for data collection, exchange, management, and analysis are gradually being adopted by various actors in the logistics and post-logistics phases of the life cycle of a food package [6]. Therefore, the low-carbon and green development of the cold chain logistics process is also a data-driven iterative process.

1.2. Literature Review

In this area of research, many scholars have studied continuous loss prevention and low-carbon systems for agricultural products in cold chain logistics. Since continuous loss prevention is a general demand in current cold chain practices for agricultural products [7,8], research on the effects of more efficient packaging practices for keeping agricultural products fresh in cold chain logistics is an inherent requirement of industrial development [9]. The loss and waste in the supply process directly leads to the loss of fresh agricultural products in the cold chain. In the final losses of the supply chain, storage loss accounts for about 15%–20%, of which the distribution of fruits is about 5%–10% [10], which has a negative impact on resources and the environment [11] and results in more carbon emissions. Therefore, improving circulation efficiency and reducing losses is an effective way to reduce carbon emissions.
Many scholars have conducted various forms of impact analysis on the monitoring of microenvironmental factors of cold chain packaging, especially through the use of gas sensors for sensing the quality of fruits and vegetables [12]. Due to the microbial spoilage caused by the time–temperature effect in the process [13] and the loss of physiological and biochemical reactions that are related to microenvironmental stress, more delicate and green requirements are proposed for fresh-keeping engineering technology in cold chain logistics. Many researchers [14,15] have used comprehensive technology [16] in cold chain practices to solve issues of inefficient supply by optimizing packaging attributes [17], but the fluctuations in the quality of fresh agricultural products still restrict the ultimate loss prevention effect. In addition, due to the increasing demands for fresh agricultural products, the e-commerce logistics of fresh agricultural products has pushed us to seek more efficient, safe, and environmentally friendly cold chain practices. Therefore, to respond to these problems in real cold chains, continuous improvements must be made in specific quality attenuation indicators to reduce losses [18].
In the study of the continuous loss and cold chain packaging materials, some scholars have evaluated different material characteristics and packaging modes. Appropriate packaging can effectively enhance the effect of cold chain logistics and can further reduce losses in the cold chain process [19]. Many studies have tried to solve the problem of inefficient supply from the practical and comprehensive perspective of the cold chain. Efficient cold chain packaging is the key to protection and value-added processes, such as MAP (modified atmosphere packaging) [20,21,22], smart packaging [23,24,25,26,27], active packaging [28], and other packaging methods [29,30,31]. These practices effectively reduce the loss of fresh agricultural products during the supply process. Efficient cold chain packaging is not only a supplement to cold chain preservation—it is also considered to be the smallest traceable information acquisition and visualization unit [32] with continuous monitoring data, which play an important role in information mining and processing. To realize more sustainable, safer, and more concise cold chain packaging designs [33] and upgrades [34], it is important to develop more efficient packaging from the comprehensive perspective of the characteristics of cold chain packaging materials, the stable environments in the packaging, and the loss of quality. However, based on these specific data scenarios and data analysis [35], continuous improvements for effective cold chain packaging are ignored during the development of these packaging forms.
In terms of the comprehensive evaluation methods that are used for these indicators, the richness of the data sets and methods that are used by scholars is constantly increasing. However, the general practice of packaging efficiency evaluation is carried out in laboratory experiments, which are iterative and time-consuming [36]. Related research mainly focuses on the evaluation of the overall chain [37], but few in-depth introductions to packaging modes and data scenarios, and no attention to the subtle differences between packaging methods [38] have been published. Moreover, [39] some have pointed out the relationship between waste and packaging material selection for the environment, but from the perspective of material selection [40], environmental protection [41], economy, and safety [42] have not been evaluated. Similarly, for the loss prevention effect, although some researchers such as Saraiva et al. [43] have studied loss prevention for packaging modes, few have succeeded in determining a comprehensive evaluation framework [44]. In addition, the influence of time is ignored during the evaluation of efficiency, especially when products may be consumed at any time in the real cold chain. In order to obtain a more detailed efficiency evaluation, we should consider the time characteristics of the packaging efficiency. Therefore, based on the establishment of sufficient data sets and specific data scenarios in real cold chain, it is necessary to construct a data-driven comprehensive efficiency evaluation method for cold chain packaging.
In summary, there are clear research gaps that must be addressed in terms of optimization, research on which is mostly based on fragmented data and intermittent processes that are obtained and take place during the actual packaging efficiency evaluation and not from a dynamic and overall perspective, especially when modeling at the packaging data level in the actual cold chain. In other words, the dynamic process of obtaining, processing, modeling, decision-making optimization, and dynamically driven modeling of packaging efficiency-related data being organized in a system was not reflected in previous research. Although the advantages of data-based analysis for packaging efficiency in the cold chain have been highlighted in the previously published literature, there is still a lack of scientific methodology for data-driven modelling methods for packaging efficiency in the cold chain. Therefore, there is a need to provide a systematic method that contains examples to support the ability to leverage big data analytics in the field of packaging efficiency management in the agri-product cold chain.
We aim to clarify the concepts and the feasibility of data-driven packaging efficacy assessment using an example that pays attention to the dynamic effects of time difference for the final packaging efficiency in the real cold chain. The presented research also gives revelations that the comprehensive efficiency evaluation system for the cold chain packaging of fresh agricultural products could be driven by data, resulting in the comprehensive efficiency of current cold chain packaging practices being improved. The remainder of the article is as follows: Section 2 discusses the Materials and Methods, Section 3 presents the Results and Discussion, and Section 4 presents the Conclusions.

2. Materials and Methods

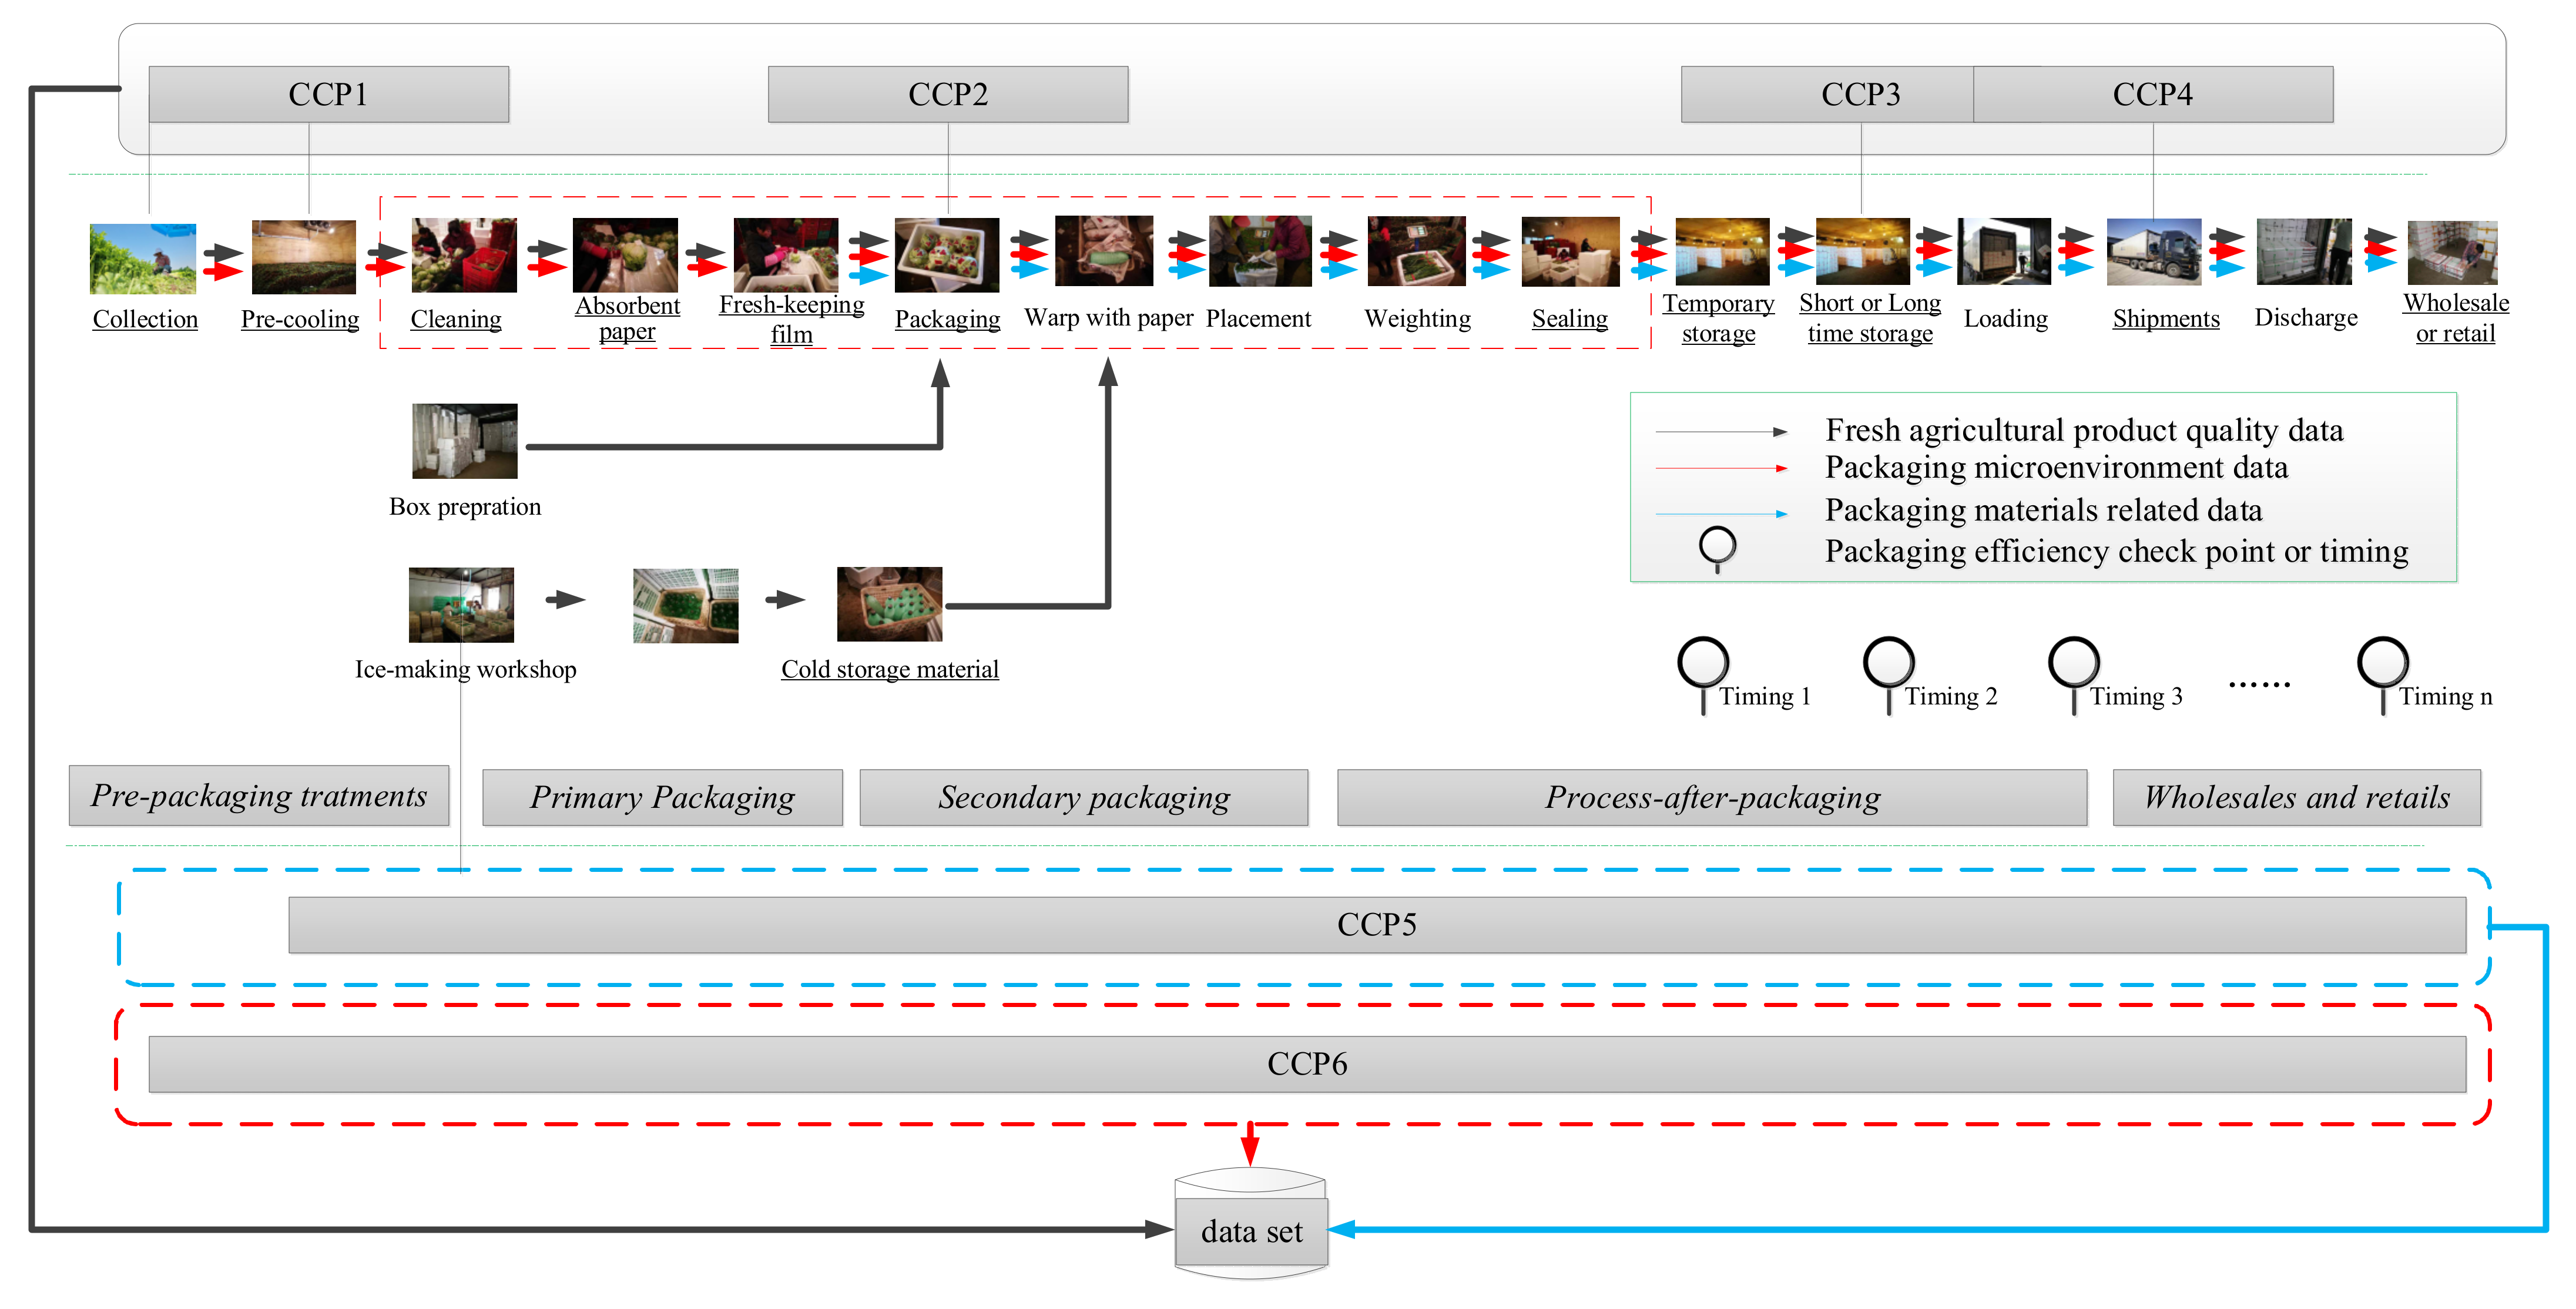
2.1. Concept of Data-Driven Packaging Efficiency Evaluation in Cold Chain

From the formation mechanism of the comprehensive efficiency for fresh products in the cold chain [28], it is clear that the evaluation of the comprehensive efficiency of the packaging used for fresh agricultural products in the cold chain is not a simple linear process. In contrast, it is a scientific evaluation process with a clear orientation and system with strong feasibility and applicability. Based on this, we proposed and constructed the concept of a data-driven packaging efficiency evaluation method in Figure 1.
The formation of the final comprehensive efficiency is a process that needs to be continuously analysed according to the dynamic characteristics of the data-driven comprehensive efficiency evaluation of cold chain packaging. Because it is time-varying, it is necessary to combine data that have been continuously obtained by monitoring technologies such as the Internet of Things. Meanwhile, data acquisition takes place at all stages in this data scenario, there is a necessity to establish a data-driven efficiency evaluation framework to support the implementation of this kind of system.
Data-driven packaging efficiency evaluation models of fresh agricultural products packaging refer to these dynamically evaluated data, which are related to packaging efficiency in the cold chain and have been retrieved through cold chain monitoring via the Internet of Things or other Internet-of-Things instruments. These data are reorganized to form a process data set. Through the mining and display of process data, a self-driven data processing evaluation model can be formed under this specific data scenario. Furthermore, when fresh agricultural product packaging practices change and when new data scenarios are generated, this modelling method can facilitate the generation of updated evaluation index sets and can perform iterative optimization based on these new input data.

2.2. Data-Driven Packaging Efficiency Assessment Framework

In the methodology mentioned above, the data collection process was divided into three types of data. Specifically, there are three types of data that are primarily involved, namely the microenvironmental parameters in the packaging itself, the characteristics of the packaging materials (cost, environmental protection characteristics, etc.), and changes in nutritional quality, which correspond to U1, U2, and U3, respectively. Then, in line with the hierarchy analysis, a data-driven packaging efficiency evaluation framework is established, which involves a total of nine indicators including U11 for volatility, U12 for effectiveness, U21 for economic characteristics, U22 for environmental protection characteristics, U23 for material safety, U31 for weight index, U32 for nutritional quality, U33 for physiological activity intensity, and U34 for physical quality changes.
Since the existing comprehensive efficiency evaluation models are not time-variant, this means that they cannot reflect changes over time. Additionally, they also cannot effectively display the comprehensive efficiency formation process of the cold chain packaging of different fresh agricultural products, let alone the operability of the continuous improvement of cold chain packaging practices with different times and distances. To demonstrate the advantages of data-driven modelling in the cold chain combined with the characteristics of the comprehensive efficiency evaluation index set of fresh agricultural products in the cold chain packaging process, a data-driven evaluation modelling process was constructed.
We regarded the entire packaging efficiency evaluation data collection process as a software subsystem. Then, the data collection points, namely the acquisition of the driving data sets for evaluation, needed to be set. A simple manual collection point layout is depicted in Figure 2, which was drawn by the authors and was based on our previous work [29]. The key data collection points that were used in the cold chain packaging evaluation process form the data burying points. The monitoring instruments are deployed and applied to the cold chain environment monitoring process of fresh agricultural products through the use of limited monitoring points. The overall efficiency of cold chain packaging is calculated to adapt to the different application scenarios that are in demand, thereby increasing the feasibility of the system. In the figure, CCP1-CCP6 refer to key control points 1–6, which are critical links that impact the data set. Additionally, the underlined packaging links are the critical links in the packaging process.
To verify the final efficiency performance changes and the differences in the different times and distances the in real cold chain, we calculated the efficiency value of the checkpoints in the cold chain. If an agricultural product is consumed at a specific moment in time, then its final efficiency is the calculation efficiency at this moment. Specifically, the model sets multiple checkpoints or timings to evaluate the efficiency of cold chain packaging through the monitoring of the Internet of Things at fixed time intervals, in which different sampling points for different times and distances are included. The model is operated to achieve green and low-carbon cold chain logistics through data sets, thereby achieving the targeted improvements in different types of cold chain packaging.

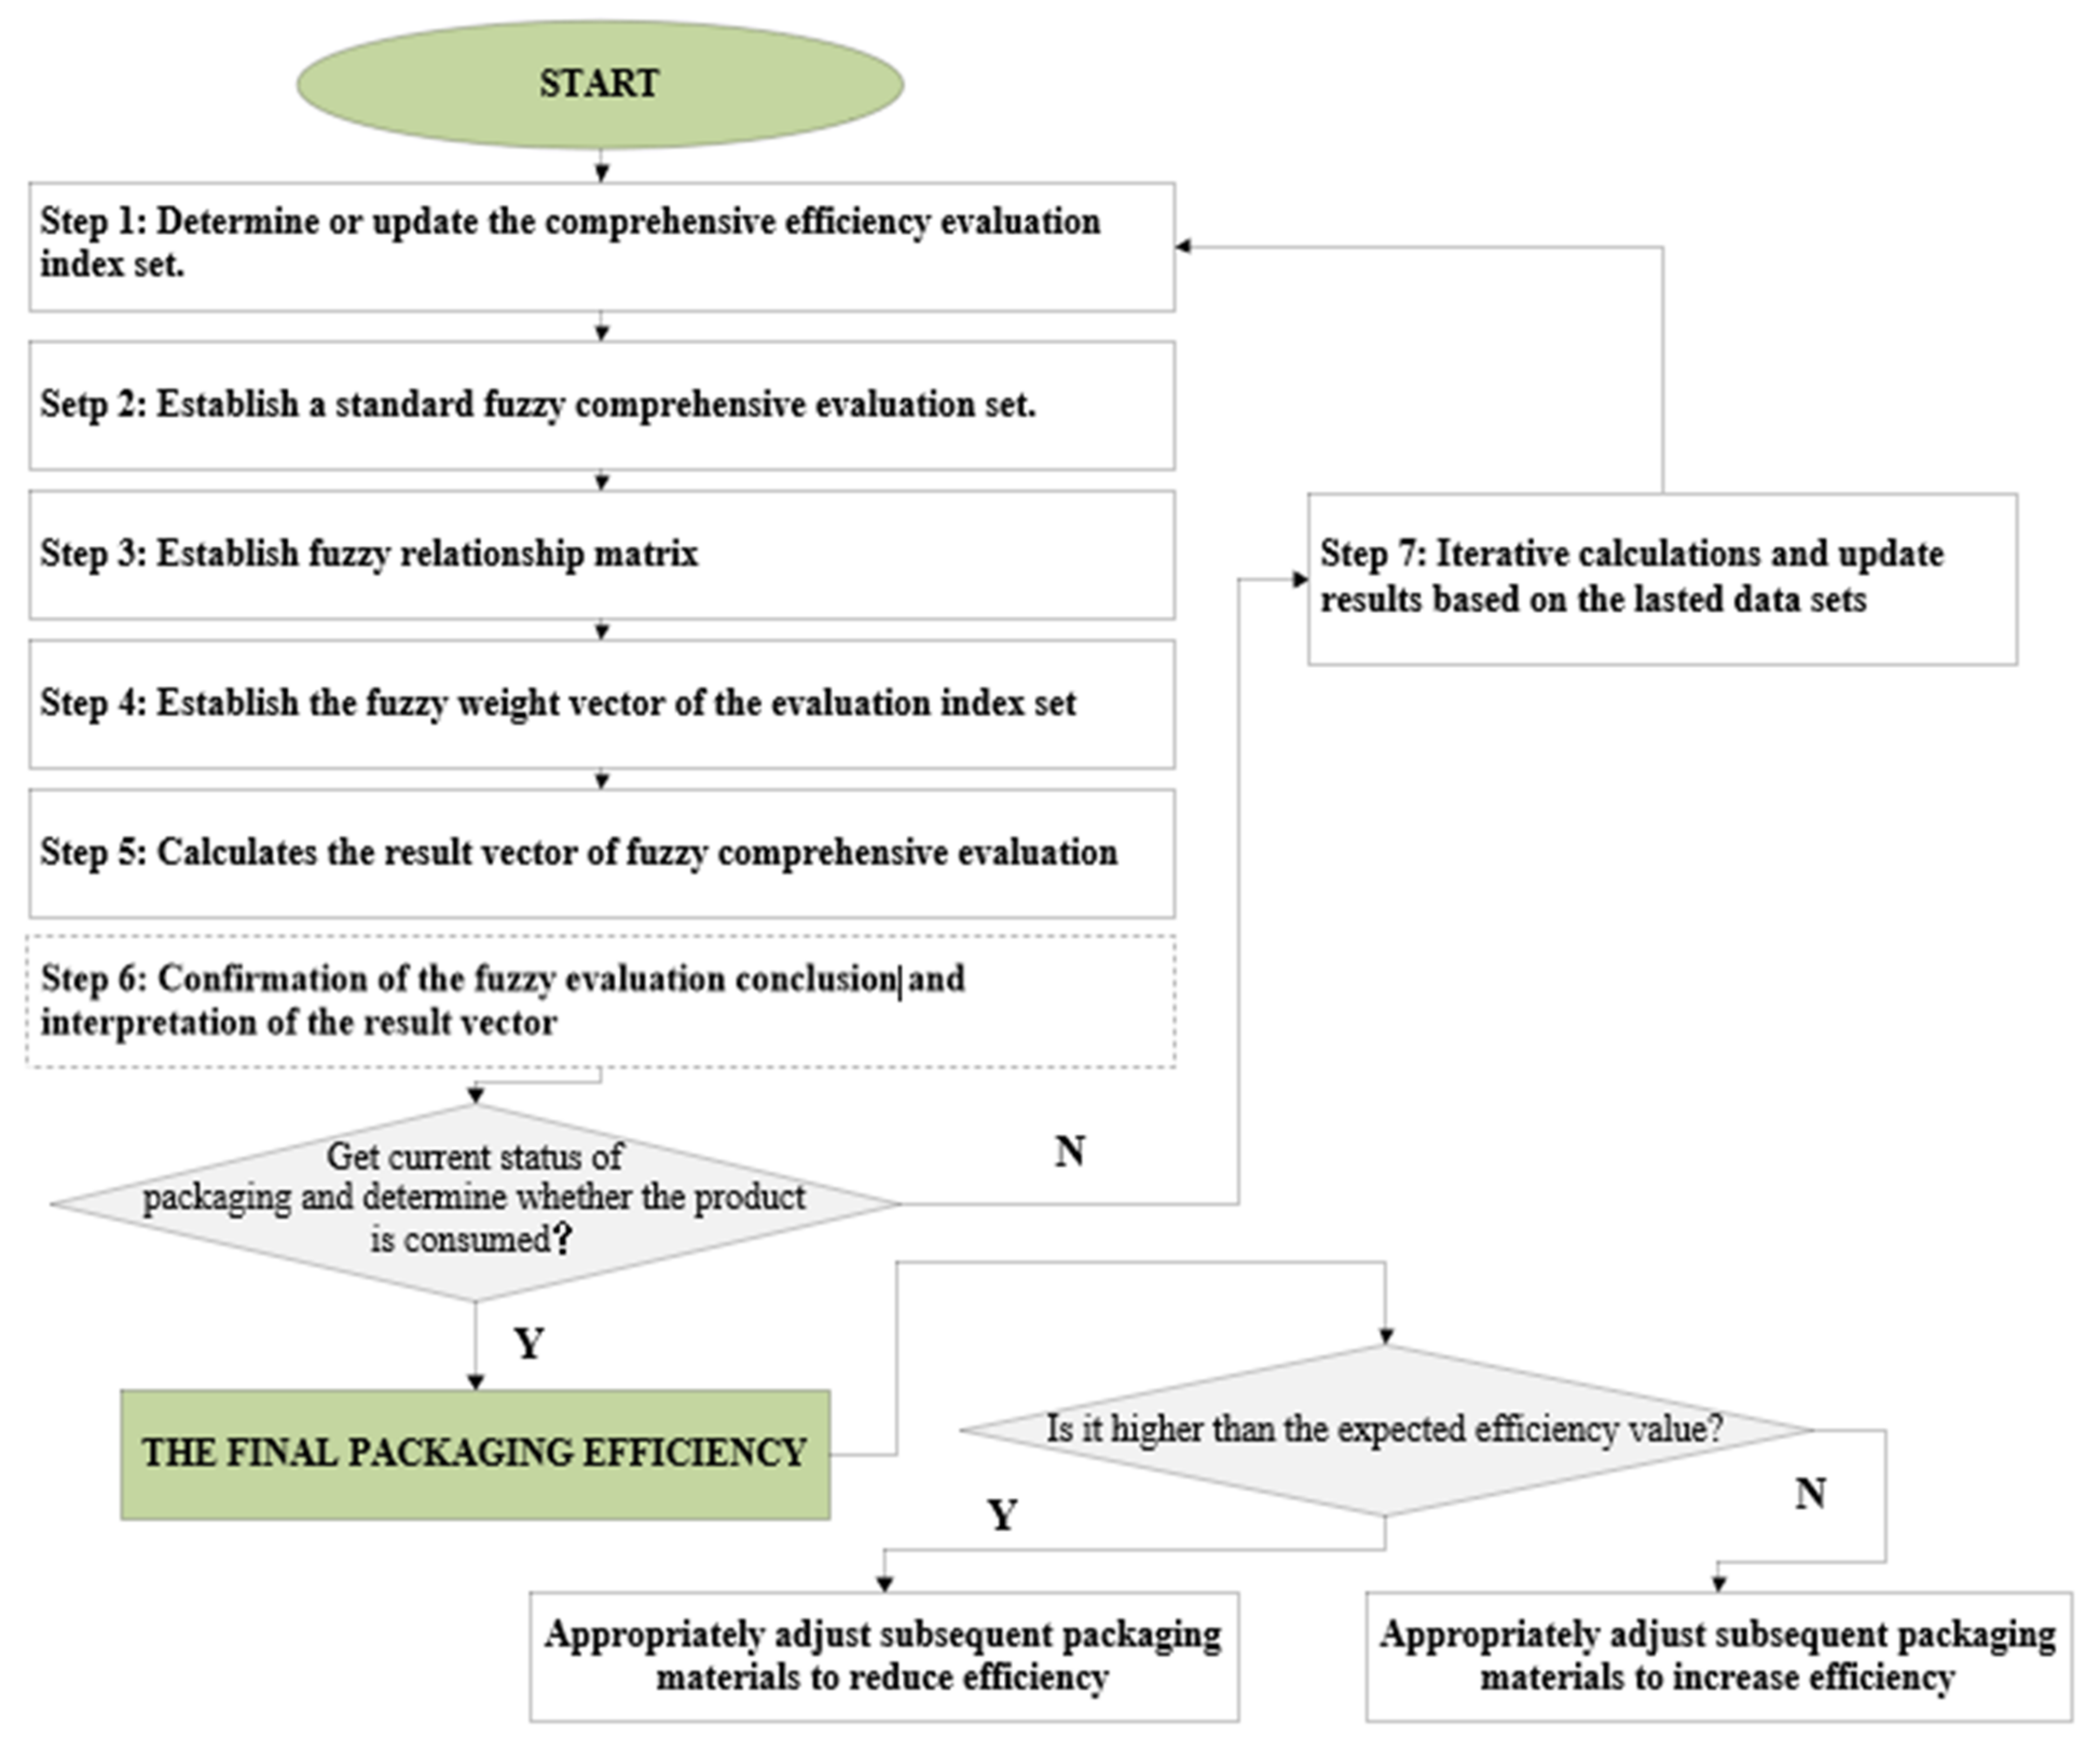
2.3. Evaluation Methods

We constructed a data-driven packaging efficiency evaluation method based on the fuzzy comprehensive evaluation method in Figure 3. The data-driven fuzzy comprehensive evaluation model is specifically composed of seven steps and decision-making for packaging practice improvements and includes index sets, evaluation sets, the fuzzy relationship matrix, and the evaluation results. Based on the data-driven packaging efficiency assessment framework, it is easy to effectively construct data-driven comprehensive packaging efficiency in the cold chain.
Step 1: Determine the comprehensive efficiency evaluation index set.
The evaluation index set contains data set indexes that affect the overall efficiency of cold chain packaging. Therefore, the index set for the fuzzy comprehensive evaluation of the comprehensive efficiency in cold chain packaging is:
X = x 1 , x 2 , x 3 , , x m
where x 1 , x 2 , x 3 , , x m are n-dimensional column vectors (n 1) that representing the collection of indicator values of the m efficiency evaluations in the n fresh agricultural product cold chain packaging process data set used for comprehensive packaging efficiency evaluation.
Step 2: Establish a standard fuzzy comprehensive evaluation set.
Combining the characteristics of the cold chain packaging data sets, this paper divides the corresponding efficiency of fresh agricultural products under different packaging practices in the real cold chain into five levels. Therefore, suppose the standard fuzzy comprehensive evaluation set for efficiency of cold chain packaging to be:
V 5 × m = v 1 , v 2 , v 3 , , v m T
where v i is the set of efficiency evaluation grade standards corresponding to the x 1 , x 2 , x 3 , , x m . Thus, the v 1 , v 2 , v 3 , , v 5 T , respectively, correspond to five different ratings.
Step 3: Establish fuzzy relationship matrix.
To find and match the membership degree of the fuzzy subset corresponding to the efficiency level of the single index, the corresponding fuzzy relationship matrix R was established, which is expressed as the following formula:
R 5 × m = r 11 r 1 m r n 1 r n m
where r n m represents the degree of membership of the index x i obtained under a certain cold chain packaging practice to the fuzzy index v j .
The calculation method of the single factor of the evaluation index is determined by the membership function of the fuzzy subset, so a clear analysis of the membership function is needed. The specific expression is applied when the corresponding efficiency of a certain index in the cold chain packaging process data is the highest; then, j = 1 , and its membership function is:
y i j = 1 ,     X i   S i j A i j X i S i j + 1 ,   S i j < X i < S i j + 1 0 ,   X i   S i j + 1
where X i is the measured value of the evaluation index; S i j is the   i t h evaluation index corresponding to the j t h standard value of efficiency; S i j + 1 is the   i t h evaluation index corresponding to the   j + 1 t h standard value of efficiency; and A i j is the coefficient. The calculation equation is as follows:
A i j = 1 S i j S i j + 1
When X i S i j + 1 > 0 , then A i j has a positive value; when X i S i j + 1 < 0 , then A i j has a negative value.
The evaluation index of the cold chain packaging process data set belongs to the   j t h efficiency, j = 1 , 2 , 3 , 4 . Its membership equation is:
y i j = 1 ,     X i   S i j 1 A i j X i S i j 1 ,   S i j 1 < X i < S i j A i j X i S i j + 1 ,   S i j X i   S i j + 1
where S i j 1 is the i t h evaluation index corresponding to the   j 1 t h standard grade efficiency index, and A i j , A i j is the coefficient. The calculation equation is as follows:
A i j =   1 S i j S i j 1 ;   A i j =   1 S i j S i j + 1  
When the evaluation index in the cold chain packaging process data belongs to the lowest efficiency level: j = m , its membership function is:
y i j = 1 ,     X i   S i j A i j X i S i j + 1 0 ,   X i   S i j + 1 ,   S i j + 1 < X i < S i j
where S i j 1 is the i t h evaluation index corresponding to the   j 1 t h level standard value of efficiency; S i j + 1 is the   i t h evaluation index corresponding to the j t h standard efficiency value plus the difference between these levels; A i j is the coefficient, and the calculation equation is as follows:
A i j = 1 S i j S i j 1
Step 4: Establish the fuzzy weight vector for the evaluation index set.
The weight of the evaluation index indicates the degree of influence of each index in the evaluation on the overall efficiency of the cold chain packaging process for fresh agricultural products, and it can be more directly reflected in the evaluation result vector, which is calculated by the standard weight vector, so the standard fuzzy weight vector A is expressed by the following equation:
A = A 1 , A 2 , A 3 , , A m
where A 1 , A 2 , A 3 , , A m are the standard weight vectors of the elements x 1 , x 2 , x 3 , , x m in the evaluation index set, and m represents the fresh agricultural products entering the fuzzy comprehensive evaluation system, representing the number of comprehensive efficiency evaluation indicators for cold chain packaging.
Step 5: The fuzzy synthesis method calculates the result vectors for fuzzy comprehensive evaluation.
B   ˜ = A ° R
Combined with the requirements of the comprehensive efficiency evaluation results of the fresh agricultural products cold chain packaging process, when there is a fuzzy matrix in the calculation process A = a i j m × n , B = b i j n × m , then c i j m × n = A ° B represents the final fuzzy comprehensive evaluation result vector. To form an analysis based on the evaluation of objective indicators and the efficiency under different influence levels and to drive the continuous improvement of the overall efficiency of the cold chain packaging of fresh agricultural products, the weighted average is used as the data-driven improvement model in this example.
Step 6: Confirmation of the fuzzy evaluation conclusion model and interpretation of the result vector.
Using the fuzzy comprehensive evaluation result vector method can strengthen the visualization of the evaluation results and the display effect of the chart, which can be used for dynamic changes in the display process and can effectively highlight the improved content that affects the overall efficiency of the process that is used for the cold chain packaging of fresh agricultural products. The vector B   ˜ represents the fuzzy comprehensive evaluation results:
B   ˜ =   b 1 , b 2 , b 3 , , b m
Although the principle of maximum membership degree can make the fuzzy comprehensive evaluation result vector of efficiency more concise, it also means that the process performance and the information display of the evaluation index is insufficient due to its rules, resulting in the information annihilation of the results of the process of dynamic formation of process data and index differences. The gap between the evaluation results and the expected state is absent, and the data-driven cold chain packaging of fresh agricultural products cannot be effectively used to improve the overall efficiency. Therefore, considering the shortcomings of the maximum membership principle in the results visualization, use 1 ,   2 ,   3 , , m to represent the rank of each evaluation level in turn, and then use the weighted average principle and the fuzzy comprehensive evaluation result vector B   ˜ to find and thus obtain the relative grade of the overall efficiency of the cold chain packaging process.
B * = j = 1 m b j k j / j = 1 m b j k  
where k is the undetermined coefficient, this paper takes k = 1 or k = 2 , and the undetermined coefficient is used to control the influence caused by a larger b j . Moreover, the composite effect of the display can be changed by adjusting the coefficient. When k , it is equivalent to the principle of maximum membership.
Step 7: Complete iterative calculations and update results based on the remaining data sets.
Therefore, the final improved fuzzy comprehensive evaluation model contains two parts, the results are shown by Equations (12) and (13). This combination can not only display the dynamic change effect based on the evaluation result vector, but it can also quickly calculate the relative efficiency level of the evaluation.
Based the above six steps, calculations are undertaken after the data set is updated, especially after the monitoring data retrieved by Internet of Things is retrieved. Every time it is calculated, the packaging efficiency results are updated and determine whether the agro-products were consumed at this time. If they have been consumed, then the efficiency value at this time is the equivalent value of the packaging efficiency in the real cold chain. Additionally, this prompts us to seek better packaging efficiencies from the corresponding index at the current moment, namely the specific time–distance.

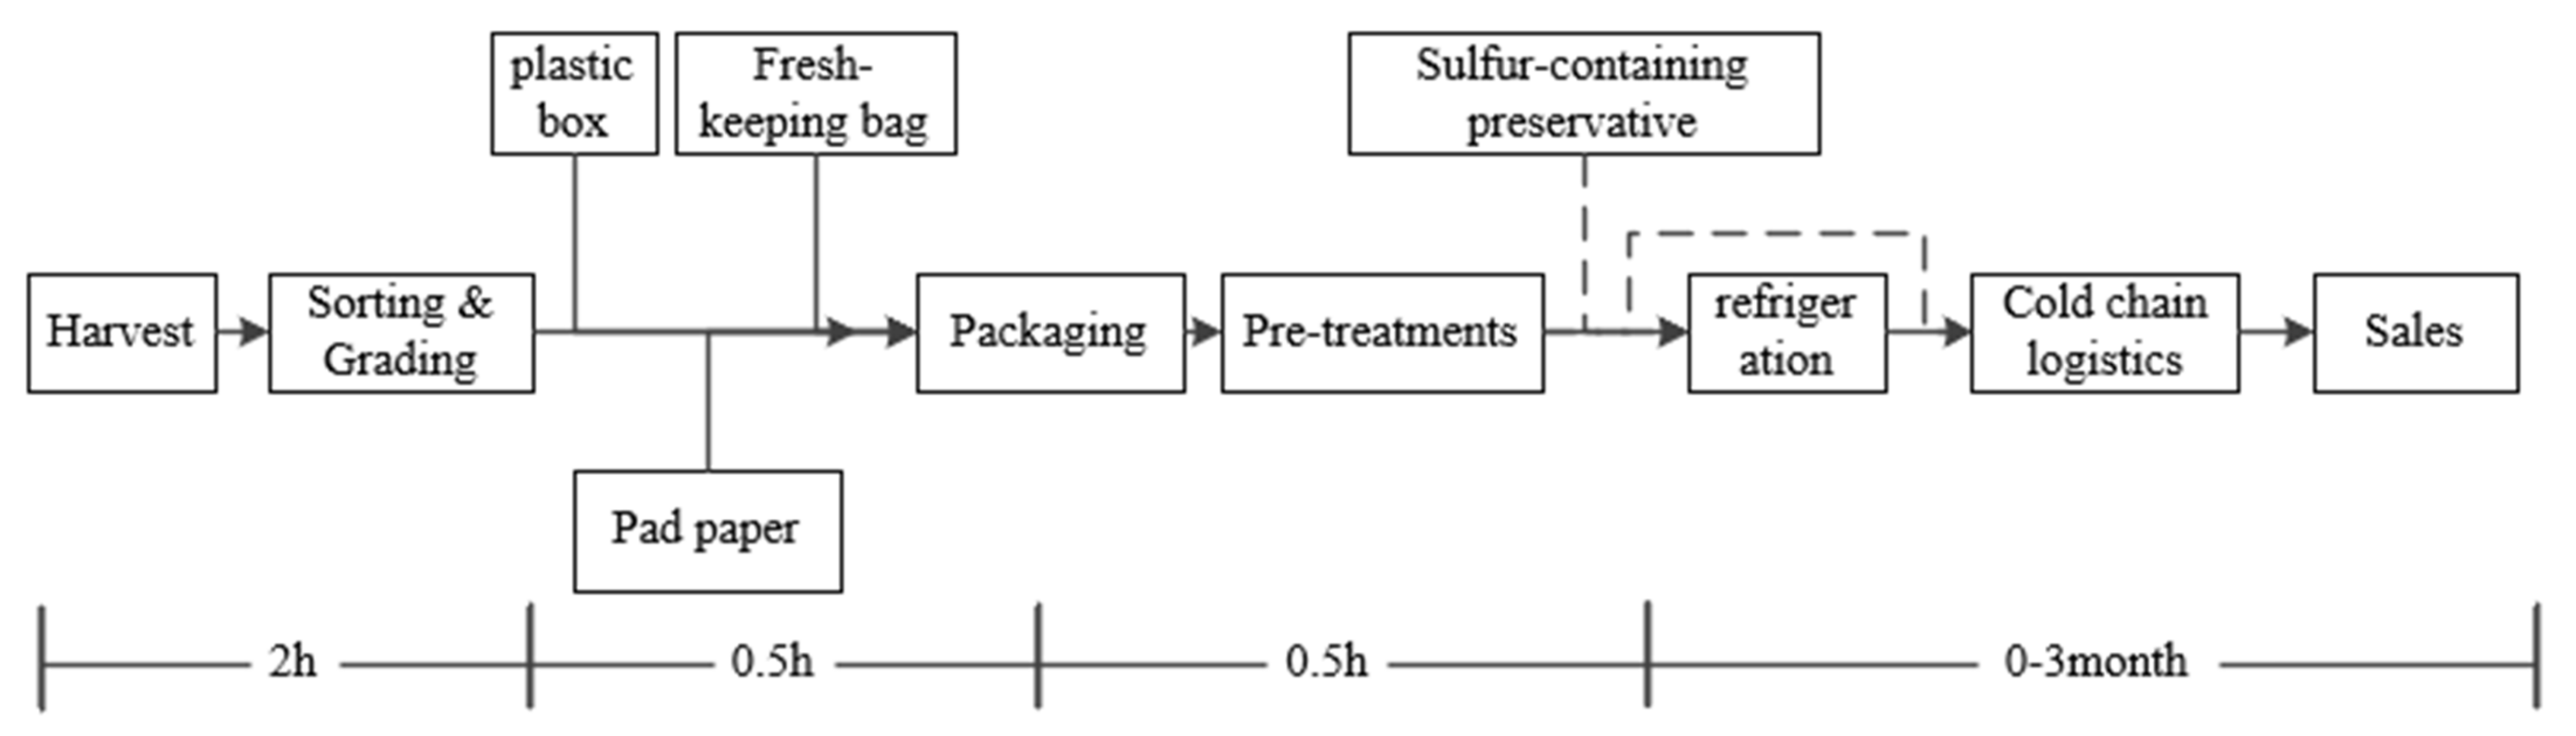
2.4. Experimental Scheme and Data Acquisition

To effectively verify the corresponding application scenarios and data sets in the data-driven comprehensive efficiency evaluation method, the efficiencies of table grapes with different packaging technologies in the actual cold chain were taken as the evaluation objects. The specifications and characteristics of the key packaging materials required in the process were analysed through on-site investigations, which served as the application scenarios and reference cold chains. There are three specific packaging materials forms that are listed in Table 1, which represent separate control groups, C1, C2, and C3, that were considered during the efficiency evaluations that were conducted in this article.
Figure 4 depicts that processes that take place after the grapes are harvested and when they are under chain conditions: classification, packaging, operation, pre-treatment, refrigeration, cold chain transportation, and sale. As a cold chain package with a long storage period, continuous measurement and evaluation indicators are used to demonstrate the procedural and dynamic nature of the overall efficiency of typical cold chain packaging for table grapes. In addition, packaging practices are in accordance with the specific requirements of the supply operator.
In this example, three different storage materials were measured during the storage period at regular intervals and were obtained from seven measurement periods. Over the first 0–3 months, we measured the quality parameters t a fixed time interval (15 days because the change in quality parameters is sufficiently obvious) to complete data set acquisition. We used CP (check point) to represent the seven measurement time points, specifically timing. Meanwhile, we evaluated the efficiency, which was determined according to the efficiency calculations for the different orders during different transportation times while the grapes were in actual transportation.
We used MATLAB (R2018a) as data treatment and analysis tool. As described in Section 2.2, the acquisition and calculation of the first five indicators are the same as those described in our previous work [28] (it can be said that this article is an extension version). Additionally, the last four indicators were modified to the quality-related index. These contents were retrieved using conventional methods via instruments, namely the weight change, nutritional quality, physiological activity intensity, and physical quality changes. Then, the calculated value was used to test and verify the data-driven packaging efficiency method mentioned above.

3. Results and Discussion

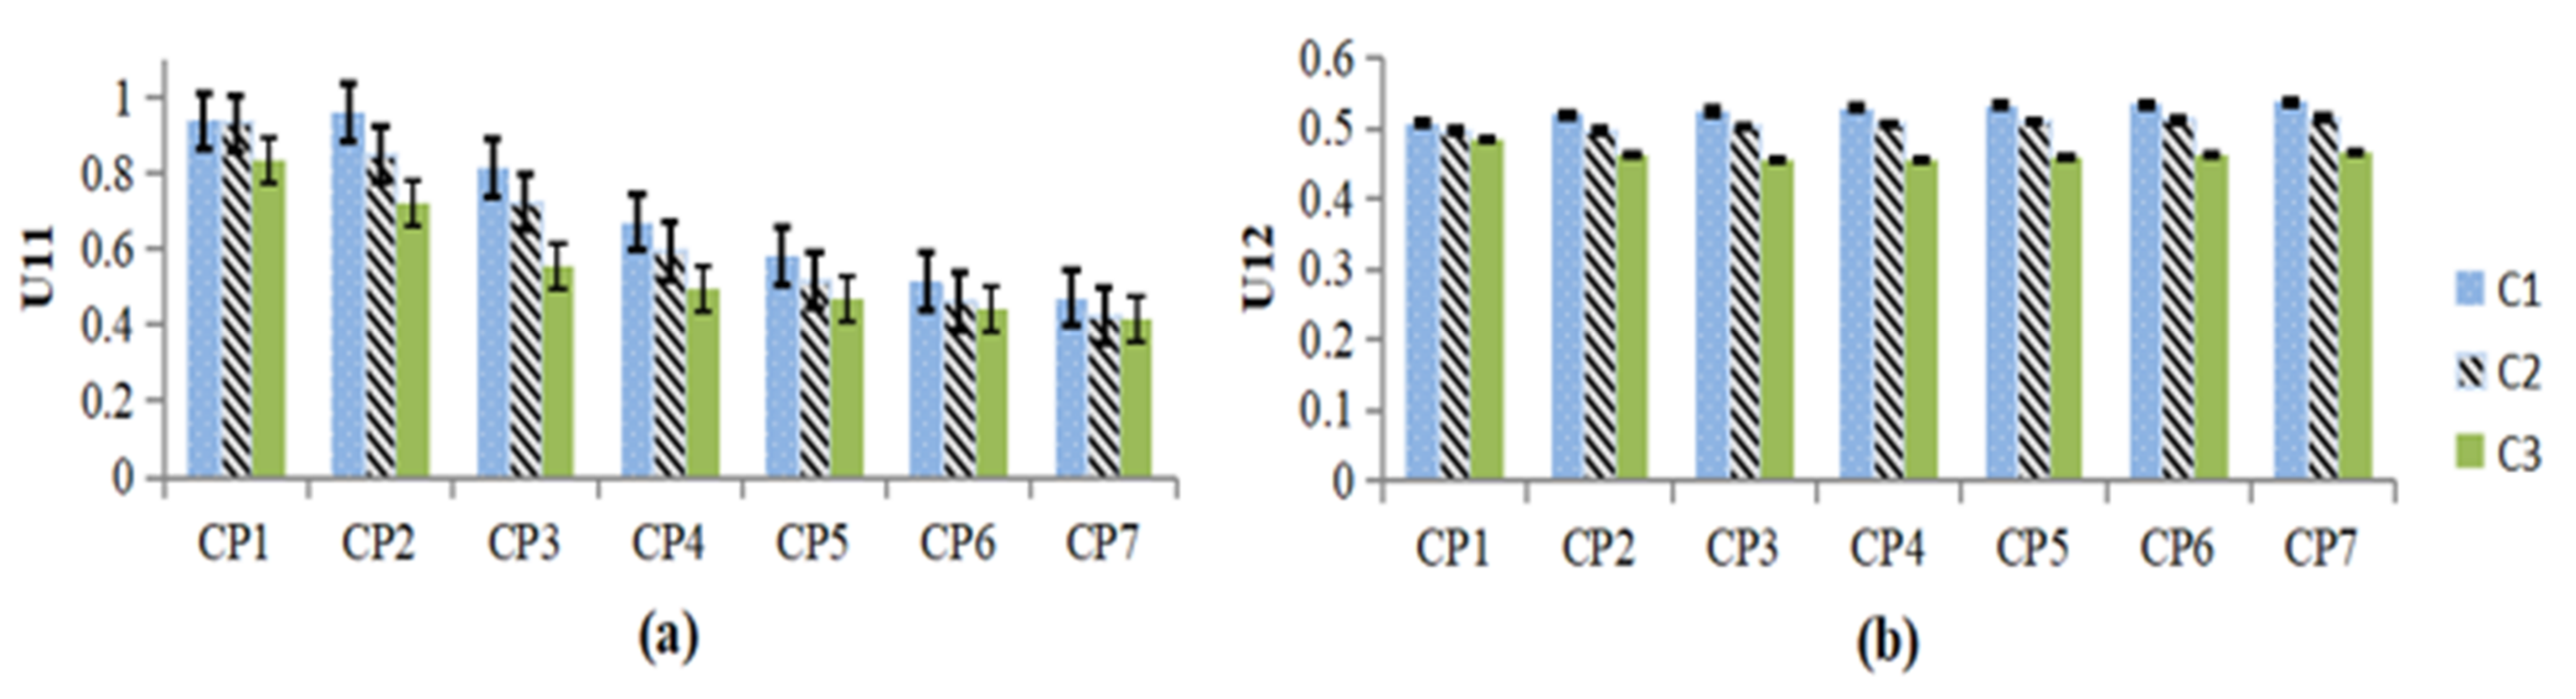
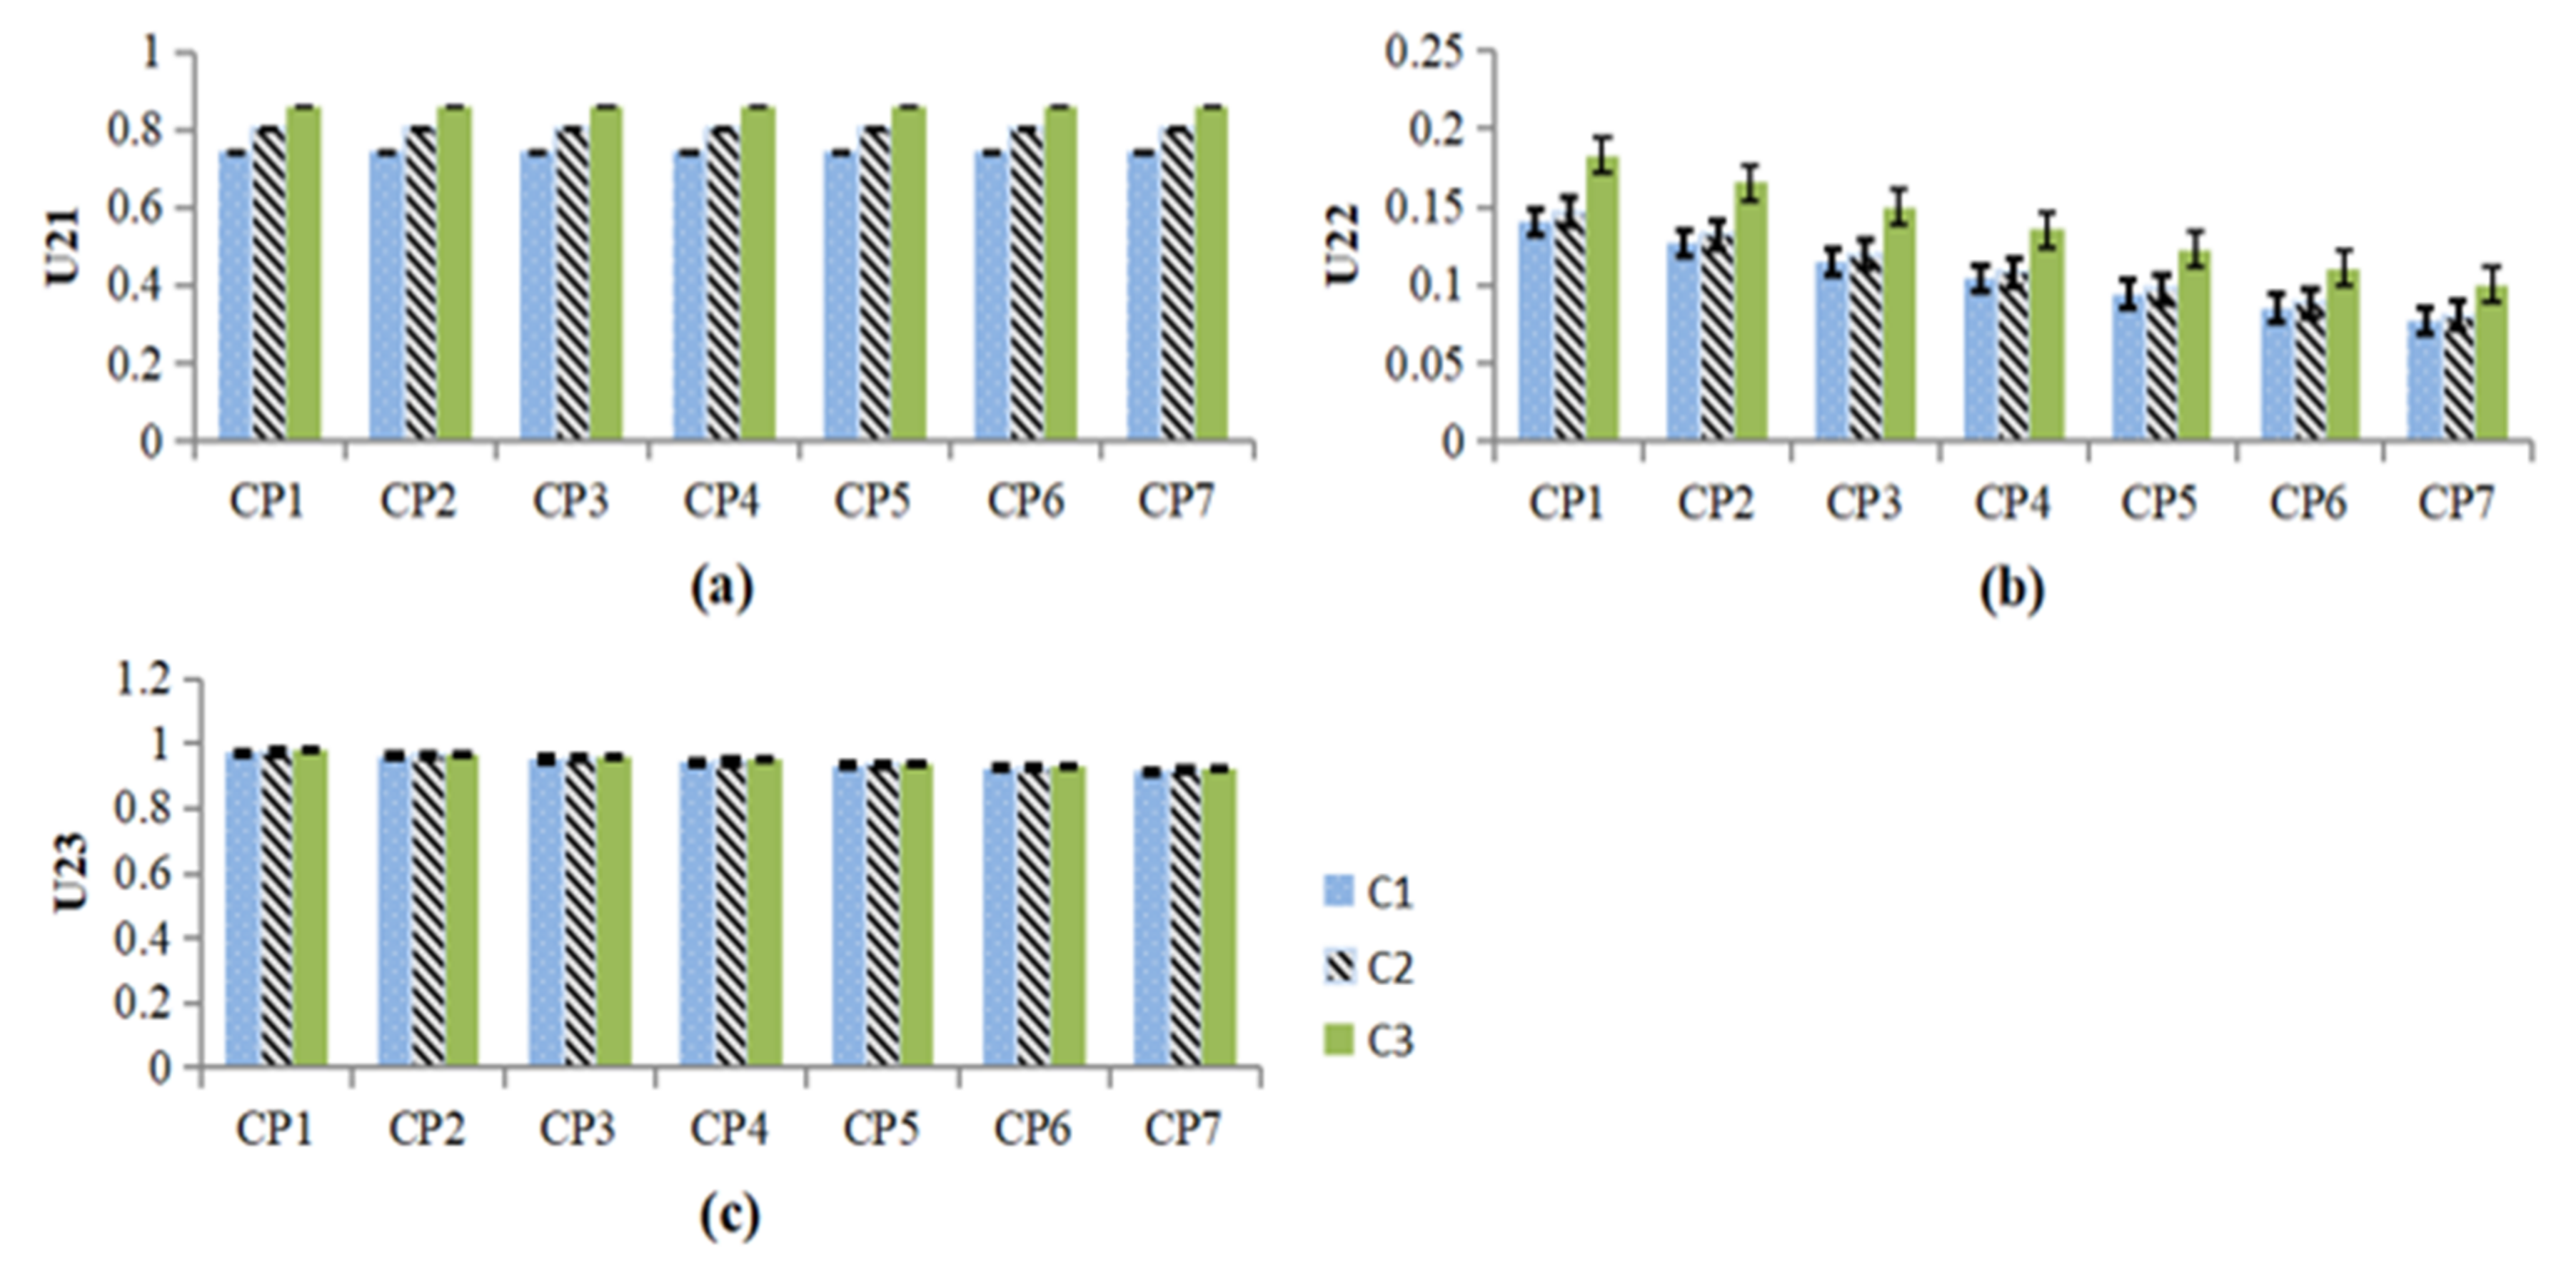
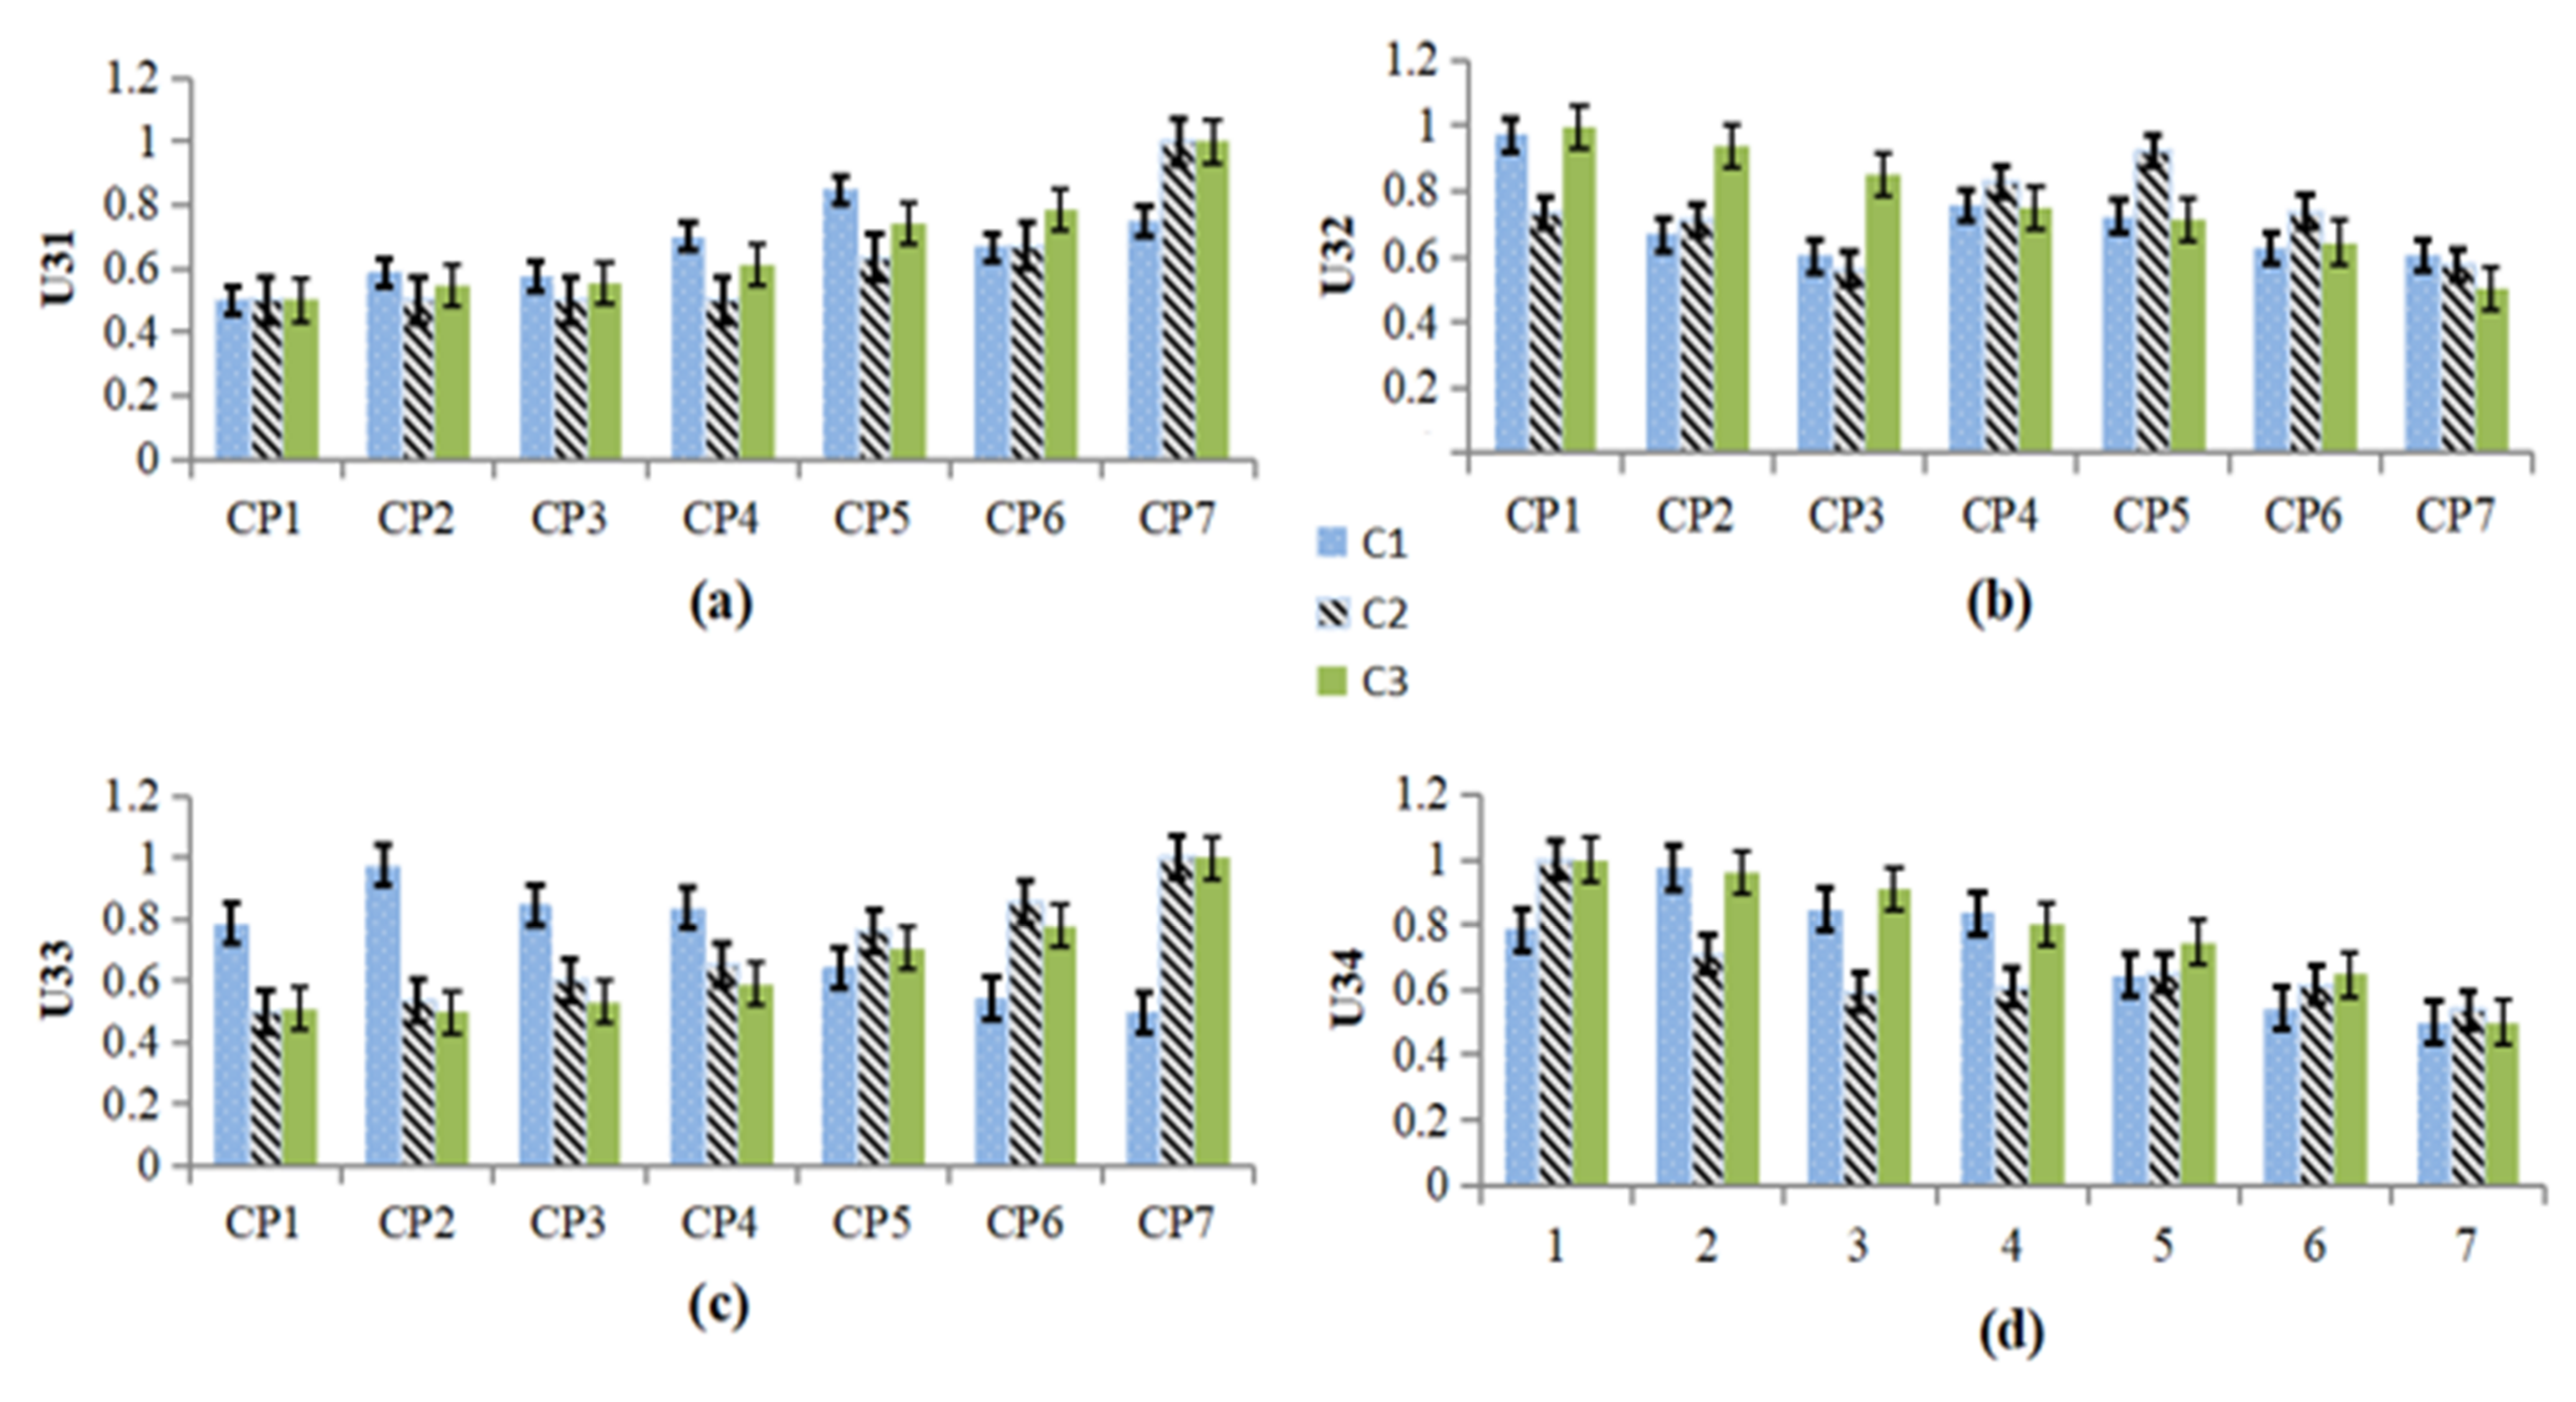
3.1. Statistical Analysis on Key Indexes of the Packaging Efficiency

The fluctuations of the microenvironment in the packaging of fresh table grapes at different times under three different packaging practices (C1, C2, C3) are shown in Figure 5. U11 and U12 show irregular fluctuations with time. Overall, microenvironmental parameters of U11 change greatly, indicating that as the data continue to enter the evaluation system, the process gradually stabilizes. Few changes are noted for U12, which proves that the three different cold chain packaging materials can better ensure the preservation period under refrigeration. Additionally, it better reduces the environmental abuse that the table grapes may experience, thereby helping to extend the shelf life.
In terms of the economic characteristics of the materials, different cold chain packaging practices have obvious differences, as shown in Figure 6. Among them, C3 has the best economics and C1 has the worst economics. Because the same packaging materials are used in one packaging practice, it does not change over time. In terms of U21, there are no obvious differences between the three different cold chain packaging practices. The environmental protection characteristics of C3 are the best, and the environmental protection characteristics of C1 are the worst. In terms of material safety, the three types of cold chain packaging have certain safety risks in the use of materials, but the differences are not obvious.
Under three cold-chain packaging practices, as in Figure 7, the evaluation indexes of weight quality U31 and physical quality change U34 gradually increased. The nutritional quality U32 and physiological activity intensity U33 reduced correspondingly, which is consistent with the definition of the index setting. The three cold chain packaging practices have similar trends in terms of their overall differences, but there are also differences. Under the indicators established in this article, C3 has the most obvious inhibitory effect on nutritional quality and sensory quality, while C1 has the most significant inhibitory effect on the weight quality U31 and the physiological activity U33.
For data monitoring to be possible in the data-driven process, it is necessary to enhance the capabilities of the model to obtain prices and other information. Follow-up research and the implementation of a data-driven packaging efficiency evaluation system should use crawler technology to automate the acquisition of data from specific websites to better realize data-driven modelling when building intelligent systems.

3.2. Fuzzy Comprehensive Evaluation on the Comprehensive Efficiency

According to the relevant methods from Section 2, the data sets, as shown in Section 3.1, are formed after normalization combined with the nine indicators of the packaging efficiency evaluation framework. Combined with the data from the three control packaging practices involved in this article, a 3 × 9 evaluation index matrix was formed.
Additionally, the corresponding indicators in the data obtained by the method described in this article can then be used to construct a specific evaluation index matrix, namely the standard values of the fuzzy comprehensive evaluation set, as shown in Table 2. Considering the distribution characteristics of the acquired cold chain packaging data set and the actual demand for the continuous improvement of cold chain packaging, which is based on Equation (2), the evaluation index classification is determined. This is then used to determine the standard set of the fuzzy evaluation set according to the range and experience of the above-mentioned input indicators.
After that, we determined the membership evaluation set of the evaluation result vector based on the principle of the maximum membership degree. Additionally, we calculated the B* value based on Equation (13), as shown in Table 3. Through multiple calculations, the changes in the overall efficiency of the cold chain packaging of different fresh agricultural products are present, which provide a basis for the continuous control of the cold chain packaging of fresh agricultural products.
The results show that the calculated overall efficiency of C3 is relatively better most of the time. In Table 3, the data-driven evaluation results reveal that the fuzzy comprehensive evaluation results of the cold chain packaging of C3 are better than C2 and C1 in terms of overall packaging efficiency. Although there are influences on data-processing in different packaging practices, they have been eliminated through data-driven modelling over a relatively long period.
Therefore, from the perspective of time, the order of the overall packaging efficiency of the cold chain packaging of fresh agricultural products is C3 > C2 > C1. At the same time, from different packaging efficiency check points (different evaluation timings), there are also differences in the packaging efficiency, even when the same packaging practices are used, which provides a richer time section. The possibility of being able to continuously evaluate the improvements in packaging efficiency for instant consumption is available. This is the significance of the data-driven packaging efficiency evaluation proposed in this article.

3.3. Evaluation Result Analysis

Through the calculation of each check point in the formation process before the final value of the packaging efficiency, we found that the calculated efficiency value differs. Specifically, the data-driven effect of U11 and U12 was determined to be different by monitoring the data from the IoT. Different packaging practices also have similar trends at different evaluation times. This suggests that we need to pay more attention to the efficiency of every time point when determining the final efficiency. In this article, we performed seven measurements to mimic and provide detailed content for the continuous improvement of packaging. Specifically, when different cold chain packaging processes have different times distances due to the logistics distance, these subtle differences will have positive effects.
The weight of the evaluation index shows the micro-environmental fluctuations, material prices, and changes in nutrients in the data for the efficiency evaluation in Figure 8, which represents the importance of their effect on agricultural product packaging. The standard weight value of the appearance performance and weight index is relatively small, indicating that the index changes during the agricultural product packaging process efficiency in the cold chain of fresh agricultural products are relatively small, reflecting that the appearance performance and weight index have little effect on efficiency, and reflecting that packaging practices can effectively reduce these two indicators.
The comprehensive evaluation results show that the final overall efficiency of C3 is the best after seven time evaluations. In the complete cold chain process, the fuzzy comprehensive evaluation results of the comprehensive efficiency of fresh agricultural product cold chain packaging show that the packaging efficiency of C3 is better than that of C2 and C1.
Driven by data sets such as the sensing data, the results of the evaluation become more stable and more adequate. In addition, the results reflect that whether the customized packaging efficiency requirements of order logistics are guaranteed to reach the corresponding packaging efficiency at the seventh measurement. In facts, the requirements are met at the fourth time point or earlier. Because of this, the corresponding packaging materials can be processed with appropriately downgraded adjustments. Meanwhile, these data-driven dynamic evaluation values also provide a basis for solving specific packaging efficiency problems.

3.4. Discussion

This method is suitable for the evaluation of the packaging efficiency of fresh agricultural products via process data sets, which can solve the increasing data volume in the evaluation process. Based on dynamically acquired and continuously enriched process data sets, this method effectively adapts to the complex dynamic process that is used to determine the comprehensive efficiency of cold chain packaging. The continuous driving of the monitoring data enhances the automation and intelligence of the data-driven process, ensuring that the efficiency evaluation is more realistic and complete.
The packaging efficiency of cold chain packaging practices under data-driven modelling show dynamic changes of the cold chain process over time. Dynamic assessment and analysis of demand provide data support and improve the accuracy and effectiveness of the model. The model effectively integrates data processing methods, data-driven logic, and fuzzy comprehensive evaluation methods to achieve a comprehensive evaluation of the packaging efficiency of typical cold chain packaging practices for fresh agricultural products. This inspired us to visualize these changes more intuitively and to examine the practices that are related to the practices of cold chain packaging fresh agricultural products from the perspective of complete process control. Moreover, this work also inspired us to continue to improve cold chain packaging through the use of more process data by building a fresh agricultural product cold chain packaging evaluation system.
The conversion of the typical steps of the above evaluation method can realize a comprehensive evaluation of the comprehensive efficiency of fresh produce cold chain packaging. After adaptively determining the standard weights, the improved fuzzy comprehensive evaluation model can adapt to the data scenario constituted by the complex dynamic processes that are implemented during cold chain packaging practices for fresh agricultural products. It also meets the needs of rapid and continuous optimization in cold chain packaging. Moreover, the evaluation model has a certain degree of adaptability and intelligence, displaying dynamic evaluation results of different indicators for different fresh agricultural products during the calculation process. The vectors perform further information extraction, thereby effectively using this information to drive the continuous improvement of corresponding indictors in order to improve the overall efficiencies of different fresh agricultural products.
The evaluation results provide a quantitative basis for the evaluation and selection of cold chain packaging practices for fresh agricultural products. According to the weight analysis between the different efficiency indices, the presented model clarifies the driving effect of different indicators in the packaging efficiency of specific fresh agricultural products. Additionally, it indicates that the evaluation results can be used for the evaluation, selection, and development of fresh agricultural products by researchers and cold chain logistics companies via providing a basis for scientific decision-making. The multi-index fuzzy comprehensive evaluation model is conducive to characterizing the influence of different factors on the efficiency of these cold chain packaging processes, completing the data-driven modelling and overcoming the shortcomings of short-time evaluation.

4. Conclusions

The feasibility of the dynamic evaluation for the packaging of fresh agricultural products in cold chain processes was verified. The comprehensive efficiency of different cold chain packaging processes was dynamically displayed to reflect the actual situation with different times and distances (time intervals). It provides a methodological basis for researchers and cold chain practitioners to make better decisions that can be implemented to continually improve packaging efficiency. A data-driven modelling methodology was constructed that realized the dynamic evaluation and continuous improvement of the overall efficiency of packaging processes with different data iterations. The data-driven model is highly systematic and can adaptively adjust weights and solve the problem of fuzzy quantification in multi-dimensional data processes in the cold chain. It provides and effective a way to solve the inadaptability of traditional methods with the big data scenarios in the real cold chain. Additionally, this model improves our ability to continuously optimize the packaging efficiencies in dynamic processes.
The data-driven comprehensive evaluation model also displays the evaluation results in multiple dimensions, which is more conducive to identifying the weak aspects in the formation of effective comprehensive efficiency. An obvious advantage is that the model characterizes the overall efficiency of cold chain packaging under different packaging practices during the whole process. It not only outputs a relatively definite dynamic evaluation result, but it also extracts further information to improve the efficiency through iterative calculations, which effectively solves the problem of efficiency differences within different times and distances.
Data-driven modelling ensures that this process has a self-driving ability with better weighting throughout the continuous growing data sets, which effectively improves the self-adaptability of the data-driven process in complex contexts. Through the multi-dimensional display of the results in the improved fuzzy comprehensive evaluation model, the analysis of the comprehensive efficiency evaluation with various process data in multiple scenarios are realized. The dynamic formation of packaging efficiency can solve the problems that are related to evaluating the sustainability of cold-chain packaging efficiencies while also attempting to continuously improve the efficiency, enhancing the analysis of processes and scenarios at different times and distances.
However, this article also has several shortcomings. In fiture research, we will try to verify this modelling methodology in more cold chains with bigger volume data sets. Additionally, the system needs to be further developed, and the effectiveness of the system needs to be discussed in terms of how to improve specific packaging design.

Author Contributions

Conceptualization, J.W. and X.Z.; methodology, J.W., X.Z. and X.W.; validation, J.W., H.H., and J.H.; investigation, J.W.; data curation, J.W. and X.W.; writing—original draft preparation, all figures and tables, J.W.; writing—review and editing, J.H. and W.L.; supervision, J.H and W.L.; project administration, W.L.; funding acquisition, W.L. All authors have read and agreed to the published version of the manuscript.

Funding

This research was funded by Guangzhou Science and Technology Planning Project-Agricultural Products Intelligent Supply Chain Comprehensive Service Platform Construction Project for Poor Mountainous Areas (Grant Number 2019030105), Guangzhou Philosophy and Social Science “13th Five-Year Plan Project “(Grant Number 2018GZZK23) and Project of the Dean of the Guangdong Academy of Agricultural Sciences (Grant Number 202033, 202102).

Institutional Review Board Statement

Not applicable.

Informed Consent Statement

Not applicable.

Data Availability Statement

Data available upon request. The data presented in this study are available upon request from the corresponding author.

Acknowledgments

This research was supported by Guangzhou Science and Technology Planning Project-Agricultural Products Intelligent Supply Chain Comprehensive Service Platform Construction Project for Poor Mountainous Areas (2019030105).

Conflicts of Interest

The authors declare that they have no conflict of interest.

References

  1. Han, J.-W.; Zuo, M.; Zhu, W.-Y.; Zuo, J.-H.; Lü, E.-L.; Yang, X.-T. A comprehensive review of cold chain logistics for fresh agricultural products: Current status, challenges, and future trends. Trends Food Sci. Technol. 2021, 109, 536–551. [Google Scholar] [CrossRef]
  2. Hu, J.; Wang, J.; Zhu, Z.; Zhang, X. Analysis of Data Quality Evaluation and Optimization in IoT in Cold Chain. Trans. Chin. Soc. Agric. Mach. 2019, 50, 1–14. (In Chinese) [Google Scholar]
  3. Sundarakani, B.; Ajaykumar, A.; Gunasekaran, A. Big data driven supply chain design and applications for blockchain: An action research using case study approach. Omega 2021, 102, 102452. [Google Scholar] [CrossRef]
  4. Soltani Firouz, M.; Mohi-Alden, K.; Omid, M. A critical review on intelligent and active packaging in the food industry: Research and development. Food Res. Int. 2021, 141, 110113. [Google Scholar] [CrossRef]
  5. Kalpana, S.; Priyadarshini, S.R.; Maria Leena, M.; Moses, J.A.; Anandharamakrishnan, C. Intelligent packaging: Trends and applications in food systems. Trends Food Sci. Technol. 2019, 93, 145–157. [Google Scholar] [CrossRef]
  6. Vanderroost, M.; Ragaert, P.; Verwaeren, J.; De Meulenaer, B.; De Baets, B.; Devlieghere, F. The digitization of a food package’s life cycle: Existing and emerging computer systems in the logistics and post-logistics phase. Comput. Ind. 2017, 87, 15–30. [Google Scholar] [CrossRef]
  7. Bresolin, C.; Schneider, P.; Rego, R.; Bandarra, E. Brazilian cold chain panorama. Int. J. Refrig. Rev. Int. Du Froid 2018, 90, 145–155. [Google Scholar] [CrossRef]
  8. Mampholo, B.; Sivakumar, D.; Thompson, A. Maintaining overall quality of fresh traditional leafy vegetables of Southern Africa during the postharvest chain. Food Rev. Int. 2016, 32, 400–416. [Google Scholar] [CrossRef]
  9. Chauhan, C.; Dhir, A.; Akram, M.U.; Salo, J. Food loss and waste in food supply chains. A systematic literature review and framework development approach. J. Clean. Prod. 2021, 295, 126438. [Google Scholar] [CrossRef]
  10. Zhao, H.; Liu, S.; Tian, C.; Yan, G.; Wang, D. An overview of current status of cold chain in China. Int. J. Refrig. Rev. Int. Du Froid 2018, 88, 483–495. [Google Scholar] [CrossRef]
  11. Sun, S.; Lu, Y.; Gao, H.; Jiang, T.; Du, X.; Shen, T.; Wu, P.; Wang, Y. Impacts of food wastage on water resources and environment in China. J. Clean. Prod. 2018, 185, 732–739. [Google Scholar] [CrossRef]
  12. Wang, X.; Feng, H.; Chen, T.; Zhao, S.; Zhang, J.; Zhang, X. Gas sensor technologies and mathematical modelling for quality sensing in fruit and vegetable cold chains: A review. Trends Food Sci. Technol. 2021, 110, 483–492. [Google Scholar] [CrossRef]
  13. Ndraha, N.; Hsiao, H.-I.; Vlajic, J.; Yang, M.-F.; Lin, H.-T.V. Time-temperature abuse in the food cold chain: Review of issues, challenges, and recommendations. Food Control 2018, 89, 12–21. [Google Scholar] [CrossRef] [Green Version]
  14. Gil, M.; Selma, M.; Suslow, T.; Jacxsens, L.; Uyttendaele, M.; Allende, A. Pre- and Postharvest Preventive Measures and Intervention Strategies to Control Microbial Food Safety Hazards of Fresh Leafy Vegetables. Crit. Rev. Food Sci. Nutr. 2015, 55, 453–468. [Google Scholar] [CrossRef]
  15. Fabbri, S.; Olsen, S.; Owsianiak, M. Improving environmental performance of post-harvest supply chains of fruits and vegetables in Europe: Potential contribution from ultrasonic humidification. J. Clean. Prod. 2018, 182, 16–26. [Google Scholar] [CrossRef] [Green Version]
  16. Conte, A.; Cappelletti, G.M.; Nicoletti, G.M.; Russo, C.; Del Nobile, M.A. Environmental implications of food loss probability in packaging design. Food Res. Int. 2015, 78, 11–17. [Google Scholar] [CrossRef]
  17. Wikstrom, F.; Williams, H.; Verghese, K.; Clune, S. The influence of packaging attributes on consumer behaviour in food-packaging life cycle assessment studies—A neglected topic. J. Clean. Prod. 2014, 73, 100–108. [Google Scholar] [CrossRef]
  18. Gardas, B.; Raut, R.; Narkhede, B. Evaluating critical causal factors for post-harvest losses (PHL) in the fruit and vegetables supply chain in India using the DEMATEL approach. J. Clean. Prod. 2018, 199, 47–61. [Google Scholar] [CrossRef]
  19. Galic, K.; Scetar, M.; Kurek, M. The benefits of processing and packaging. Trends Food Sci. Technol. 2011, 22, 127–137. [Google Scholar] [CrossRef]
  20. Garrido, Y.; Tudela, J.; Hernandez, J.; Gil, M. Modified atmosphere generated during storage under light conditions is the main factor responsible for the quality changes of baby spinach. Postharvest Biol. Technol. 2016, 114, 45–53. [Google Scholar] [CrossRef]
  21. Jalali, A.; Seiiedlou, S.; Linke, M.; Mahajan, P. A comprehensive simulation program for modified atmosphere and humidity packaging (MAHP) of fresh fruits and vegetables. J. Food Eng. 2017, 206, 88–97. [Google Scholar] [CrossRef]
  22. Yang, D.; Li, D.; Xu, W.; Liao, R.; Shi, J.; Fu, Y.; Wang, J.; Wang, Y.; He, X. Design and application of a passive modified atmosphere packaging for maintaining the freshness of Chinese cabbage. LWT Food Sci. Technol. 2018, 94, 136–141. [Google Scholar] [CrossRef]
  23. Singh, S.; Gaikwad, K.; Lee, M.; Lee, Y. Temperature sensitive smart packaging for monitoring the shelf life of fresh beef. J. Food Eng. 2018, 234, 41–49. [Google Scholar] [CrossRef]
  24. Ghaani, M.; Cozzolino, C.A.; Castelli, G.; Farris, S. An overview of the intelligent packaging technologies in the food sector. Trends Food Sci. Technol. 2016, 51, 1–11. [Google Scholar] [CrossRef] [Green Version]
  25. Tsironi, T.; Giannoglou, M.; Platakou, E.; Taoukis, P. Evaluation of Time Temperature Integrators for shelf-life monitoring of frozen seafood under real cold chain conditions. Food Packag. Shelf Life 2016, 10, 46–53. [Google Scholar] [CrossRef]
  26. Dutra Resem Brizio, A.P.; Prentice, C. Use of smart photochromic indicator for dynamic monitoring of the shelf life of chilled chicken based products. Meat Sci. 2014, 96, 1219–1226. [Google Scholar] [CrossRef]
  27. Jedermann, R.; Ruiz-Garcia, L.; Lang, W. Spatial temperature profiling by semi-passive RFID loggers for perishable food transportation. Comput. Electron. Agric. 2009, 65, 145–154. [Google Scholar] [CrossRef] [Green Version]
  28. Vilela, C.; Kurek, M.; Hayouka, Z.; Rocker, B.; Yildirim, S.; Antunes, M.; Nilsen-Nygaard, J.; Pettersen, M.; Freire, C. A concise guide to active agents for active food packaging. Trends Food Sci. Technol. 2018, 80, 212–222. [Google Scholar] [CrossRef]
  29. Wang, J.; Zhu, Z.; Moga, L.M.; Hu, J.; Zhang, X. A Holistic Packaging Efficiency Evaluation Method for Loss Prevention in Fresh Vegetable cold chain. Sustainability 2019, 11, 3874. [Google Scholar] [CrossRef] [Green Version]
  30. Beitzen-Heineke, E.; Balta-Ozkan, N.; Reefke, H. The prospects of zero-packaging grocery stores to improve the social and environmental impacts of the food supply chain. J. Clean. Prod. 2017, 140, 1528–1541. [Google Scholar] [CrossRef] [Green Version]
  31. Bovi, G.; Caleb, O.; Ilte, K.; Rauh, C.; Mahajan, P. Impact of modified atmosphere and humidity packaging on the quality, off-odour development and volatiles of ‘Elsanta’ strawberries. Food Packag. Shelf Life 2018, 16, 204–210. [Google Scholar] [CrossRef] [Green Version]
  32. Fu, Z.; Xing, S.; Zhang, X. Development Trend of Food Quality Safety Traceability Technology. Trans. Chin. Soc. Agric. Mach. 2013, 44, 144–153. (In Chinese) [Google Scholar]
  33. Svanes, E.; Vold, M.; Moller, H.; Pettersen, M.; Larsen, H.; Hanssen, O. Sustainable Packaging Design: A Holistic Methodology for Packaging Design. Packag. Technol. Sci. 2010, 23, 161–175. [Google Scholar] [CrossRef]
  34. Gerassimidou, S.; Martin, O.V.; Chapman, S.P.; Hahladakis, J.N.; IaCOVIDou, E. Development of an integrated sustainability matrix to depict challenges and trade-offs of introducing bio-based plastics in the food packaging value chain. J. Clean. Prod. 2021, 286, 125378. [Google Scholar] [CrossRef]
  35. Herbon, A.; Ceder, A. Monitoring perishable inventory using quality status and predicting automatic devices under various stochastic environmental scenarios. J. Food Eng. 2018, 223, 236–247. [Google Scholar] [CrossRef]
  36. Belay, Z.; Caleb, O.; Opara, U. Modelling approaches for designing and evaluating the performance of modified atmosphere packaging (MAP) systems for fresh produce: A review. Food Packag. Shelf Life 2016, 10, 63–70. [Google Scholar] [CrossRef]
  37. Wang, X.; Matetic, M.; Zhou, H.; Zhang, X.; Jemric, T. Postharvest Quality Monitoring and Variance Analysis of Peach and Nectarine Cold Chain with Multi-Sensors Technology. Appl. Sci. 2017, 7, 133. [Google Scholar] [CrossRef] [Green Version]
  38. Defraeye, T.; Wu, W.; Prawiranto, K.; Fortunato, G.; Kemp, S.; Hartmann, S.; Cronje, P.; Verboven, P.; Nicolai, B. Artificial fruit for monitoring the thermal history of horticultural produce in the cold chain. J. Food Eng. 2017, 215, 51–60. [Google Scholar] [CrossRef]
  39. Dilkes-Hoffman, L.; Lane, J.; Grant, T.; Pratt, S.; Lant, P.; Laycock, B. Environmental impact of biodegradable food packaging when considering food waste. J. Clean. Prod. 2018, 180, 325–334. [Google Scholar] [CrossRef]
  40. Panseri, S.; Martino, P.; Cagnardi, P.; Celano, G.; Tedesco, D.; Castrica, M.; Balzaretti, C.; Chiesa, L. Feasibility of biodegradable based packaging used for red meat storage during shelf-life: A pilot study. Food Chem. 2018, 249, 22–29. [Google Scholar] [CrossRef]
  41. Herbes, C.; Beuthner, C.; Ramme, I. Consumer attitudes towards biobased packaging—A cross-cultural comparative study. J. Clean. Prod. 2018, 194, 203–218. [Google Scholar] [CrossRef]
  42. Geueke, B.; Groh, K.; Muncke, J. Food packaging in the circular economy: Overview of chemical safety aspects for commonly used materials. J. Clean. Prod. 2018, 193, 491–505. [Google Scholar] [CrossRef]
  43. Bernstad Saraiva, A.; Pacheco, E.B.A.V.; Gomes, G.M.; Visconte, L.L.Y.; Bernardo, C.A.; Simões, C.L.; Soares, A.G. Comparative lifecycle assessment of mango packaging made from a polyethylene/natural fiber-composite and from cardboard material. J. Clean. Prod. 2016, 139, 1168–1180. [Google Scholar] [CrossRef]
  44. Defraeye, T.; Cronje, P.; Berry, T.; Opara, U.; East, A.; Hertog, M.; Verboven, P.; Nicolai, B. Towards integrated performance evaluation of future packaging for fresh produce in the cold chain. Trends Food Sci. Technol. 2015, 44, 201–225. [Google Scholar] [CrossRef]
Figure 1. Data-driven packaging efficiency evaluation logic diagram in cold chain.
Sustainability 14 00858 g001
Figure 2. The deployment of data sets for data-driven comprehensive efficiency evaluation.
Sustainability 14 00858 g002
Figure 3. Flow chart of data-driven packaging efficiency evaluation method.
Sustainability 14 00858 g003
Figure 4. Typical packaging process for table grape cold chain considered in this article.
Sustainability 14 00858 g004
Figure 5. The impacts of microenvironment-related indicators. (a) Changes in microenvironmental volatility U11 over time; (b) The microenvironment in the package changes with U12 over time.
Sustainability 14 00858 g005
Figure 6. The influence of the relevant indicators of packaging materials. (a) Changes in the economic characteristics of packaging materials U21 over time; (b) changes in environmental protection characteristics of packaging materials U22 over time; (c) changes in the safety of packaging materials U23 over time.
Sustainability 14 00858 g006
Figure 7. The influence of the related indexes of fresh agricultural product quality. (a) Changes in weight quality index U31 over time; (b) changes in the nutritional quality index of U32 over time; (c) changes in the physiological activity index of U33 over time; (d) changes in the physical properties index of U34 over time.
Sustainability 14 00858 g007
Figure 8. Index weight value change during data-driven packaging efficiency evaluation modelling.
Sustainability 14 00858 g008
Table 1. The program for data-driven packaging efficiency evaluation in the cold chain.
No.Primary PackagingKey Packaging MaterialsSecondary PackagingVarieties
C1Composite Sulfur-containing preservative CT2PE preservative film0.03 mm3# Styrofoam boxtable grapes
C2MAPpreservative film a-3# Styrofoam boxtable grapes
C3Ordinary PVCpreservative film-3# Styrofoam boxtable grapes
Note: MAP, modified atmosphere packaging; a preservative film (PE, 50 um, customized by the company).
Table 2. The standard values of fuzzy comprehensive evaluation set for packaging grades.
RatingU11U12U21U22U23U31U32U33U34
I10.40.90.2010.50.50.51
II0.8750.450.850.150.9750.60.60.60.9
III0.750.50.80.100.950.70.70.70.8
IV0.6250.550.750.050.9250.80.80.80.7
V0.50.60.700.90.90.90.90.6
Table 3. Fuzzy comprehensive evaluation of different cold chain packaging.
No. T i m i n g 1 T i m i n g 2 T i m i n g 3 T i m i n g 4 T i m i n g 5 T i m i n g 6 T i m i n g 7
R a t i n g   B * R a t i n g   B * R a t i n g   B * R a t i n g   B * R a t i n g   B * R a t i n g   B * R a t i n g   B *
C1I 2.3180II 2.0201II 2.6172II 2.6823IV 3.0023IV 3.0646IV 3.0825
C2I 2.3324II 2.5789II 2.8383III 2.8037IV 2.9666IV 3.0082II 2.9294
C3II 1.9136II 2.5789II 2.3335II 2.8157V 2.9933II 2.9690III 2.8628
Publisher’s Note: MDPI stays neutral with regard to jurisdictional claims in published maps and institutional affiliations.

