Article

Study on the Influence of Population Urbanization on Agricultural Eco-Efficiency and on Agricultural Eco-Efficiency Remeasuring in China

1
School of Economics and Management, Anhui University of Science and Technology, Huainan 232001, China
2
Academic Affairs Office and Innovation College, Anhui University of Science and Technology, Huainan 231001, China
*
Author to whom correspondence should be addressed.
Sustainability 2022, 14(20), 12996; https://doi.org/10.3390/su142012996
Submission received: 2 September 2022 / Revised: 28 September 2022 / Accepted: 6 October 2022 / Published: 11 October 2022

Abstract

:
China is still in the growth period of population urbanization; meanwhile, it is a large agricultural country where high-quality agricultural development requires a high agro-ecological efficiency level. Based on panel data from 31 provinces and cities in China from 2001 to 2020, the paper constructs an agricultural eco-efficiency evaluation index system that is more in line with China’s current agricultural production situation. Meanwhile, the undesired output super-efficiency SBM model is used to measure it. Combining the PVAR and panel Tobit models, the paper explores the effect of population urbanization on agro-ecological efficiency and the interaction mechanism in China. The results show that: (1) In the whole of China, and the western region of China in particular, agro-ecological efficiency tended to decrease during the research time, and ended up at an inefficient level. In the eastern and northeastern regions, agro-ecological efficiency has been at a moderate level for a long time, while in the central region it has fluctuated more and is now at a low level of efficiency. (2) Increases and decreases in population urbanization have both had a significant negative impact on agro-ecological efficiency, but the economic development and improved transportation infrastructure brought by population urbanization have had a positive impact on agro-ecological efficiency. (3) The paper’s results provide the current agro-ecological efficiency situation in each province of China, and clarify the causal effect of population urbanization on agro-ecological efficiency, which can provide a reference basis for subsequent policy formulation and for further research to be carried out.

1. Introduction

The urbanization of the population has important implications for sustainable economic development. As urban space continues to expand, so do the changes in industrialization and financialization. Some researchers have conducted studies on the advancement of population urbanization and the range of problems it brings. Researchers such as Wu [1] have explored the mechanisms by which regional environmental pollution affects crime rates by incorporating factors of corruption among government officials. Additionally, Wu [2] explored the potential relationship between environmental policies and green and efficient production efficiency by addressing the relationship between environmental regulations and green all-important energy efficiency. Researchers such as Su [3] explored the spatial interaction spillover effects between digital financial technology and urban eco-efficiency by addressing the financialization changes brought about by population urbanization as an entry point. Researchers such as Jia [4] explored at the national level the role of inclusive finance in improving food security efficiency.
Therefore, the impact of population urbanization, which mainly affects the outflow of people from rural to urban areas, on rural agriculture has also received attention from scholars in various countries. Moreover, the urbanization of numerous developing countries, including China, cannot be separated from the root problem of agriculture. Researchers such as Cai [5] evaluated the level of coupling and coordination between new urbanization and agroecology in China and the mechanisms of influence, while researchers such as Oueslati [6] evaluated the impact of urbanization on agricultural productivity in urban–rural areas in Europe. Pham [7] showed that agricultural land expropriation in Vietnam has a negative impact on agricultural production, pointing out that all agricultural activities must face challenges related to the allocation of agricultural land and inadequate agricultural development plans. Therefore, research on the green development of agriculture in the context of population urbanization is particularly important.
The external environment is currently undergoing profound changes, and the sustainability of economic and social development has become an urgent social need. Agriculture is the cornerstone of the national economy. The Central Rural Work Conference of China in 2021 pointed out that doing a good job in the “Three Rural Issues” and stabilizing the Issues at the basic level is of special importance to maintain a stable and healthy economic environment and a social environment of national security. However, the National Plan for Sustainable Agricultural Development (2015–2030) issued by the Ministry of Agriculture (now the Ministry of Agriculture and Rural Affairs) in 2015, in conjunction with seven other departments, pointed out that China’s agriculture was facing problems such as the intensification of hard resource constraints, prominent environmental pollution problems and an imperfect system for sustainable agricultural development, and also set out the milestones for sustainable agricultural development by 2030. The No. 1 document of the Central Government in 2021 also specifically mentions “promoting green development in agriculture”, affirming the milestones achieved in the last five-year plan for the protection of agricultural ecology and demonstrating China’s continued attention to the healthy development of agriculture.
China’s recent major agricultural and rural policies, such as the “revitalization of the countryside”, the “modernization of agriculture and rural areas” and the “Three Rural Issues” strategy, have also put forward stable and sustainable requirements for the agricultural industry. The essence is to transform the originally fragile, inefficient and ecologically backward agricultural production model into a green agricultural production system with strong resilience, sustainability, high efficiency and high quality. Therefore, Chinese agricultural production needs to be transformed into a new model of efficiency and ecology, which requires an evaluation of the eco-efficiency of China’s existing agriculture and an in-depth study on how to improve it. A high level of agricultural eco-efficiency means low levels of agricultural carbon emissions and surface source pollution, effectively meeting the needs of ecological environmental protection in the process of urbanization and modernization. Moreover, a high level of agricultural eco-efficiency means the optimization of agricultural production factors and the clustering of production services, which helps to accelerate the formation of modernized agricultural management methods and industrial organization forms and to promote industrialization. Therefore, research on the ecological efficiency of China’s agricultural systems has received much attention from domestic agricultural scholars. Especially in the context of the new era, the concept of “Clear waters and green mountains are as good as mountains of gold and silver” has been established, and the research on the ecological efficiency of Chinese agriculture has a higher application value.
From the end of 1978 to the end of 2020, more than 600 million rural people will have moved to cities and towns in China, with an urbanization rate of more than 60% of the population. Therefore, what impact will China’s rapid population urbanization have on agricultural eco-efficiency? What is the causal relationship and transmission mechanism between the two? This paper compares the relevant literature, conducts theoretical analysis, collects relevant data and conducts empirical research.

2. Literature Overview

Eco-efficiency, based on the study result of Yin [8] and Luo [9], is summarized as the ratio of increased value to increased environmental impact. Wang [10] and others extend it to agriculture as the ratio of the value of the output of agricultural production to the negative environmental impacts, such as carbon emissions and surface pollution (or positive environmental impacts such as carbon sequestration in agriculture) resulting from the production process. Meanwhile, researchers such as Yun [11] and Wang [12] have pointed out that improving agricultural eco-efficiency is equivalent to reducing the negative environmental output of agriculture or increasing the positive environmental output of the agricultural system itself. Additionally, researchers can effectively measure the level of agricultural ecology, achieve resource conservation and environmental protection, and promote the high-quality and sustainable development of agriculture.
Zhang [13] and She [14] pointed out that as China’s urbanization process has continued to accelerate and the national economy has grown rapidly, agriculture and rural areas have also undergone great changes along with it. Although research on agro-ecological efficiency and urbanization has been conducted for a long time, no consistent conclusions have been reached on the impact of urbanization on agricultural green production efficiency (i.e., agro-ecological efficiency) due to differences in research methods, data sources and sample years. The relationship between the two has become a hot topic of discussion among scholars, with one of the main debates being whether urbanization is conducive to increasing agricultural productivity.
According to Lewis’ [15] theory of dual economy, an increase in the level of urbanization will promote the development of agriculture. Meanwhile, population urbanization is an important component in urbanization and an important influencing factor leading to the transfer of people from agriculture [16], and population urbanization can directly improve agricultural production efficiency by reducing labour inputs through agricultural labour transfer. At the indirect level, Tian [17] pointed out that the institutional changes brought about by population urbanization can effectively improve the production and operation methods of farming households, and enhance the level of agricultural mechanization and the scale of operation, thus leading to the improvement in agricultural capital. Guo [18] and other researchers constructed a DEA model to study whether the acceleration of urbanization has a positive effect on the improvement in agricultural production efficiency. Taylor [19] pointed out that labour income from working outside the home can help farmers to increase production factors such as fertilizer and pesticide inputs, alleviating the financial constraints of food production and thus improving the technical efficiency of food production. In summary, researchers with a positive view mainly believe that population urbanization can improve the financial support of agricultural labour, technical support level to improve technical efficiency.
However, some scholars have argued that population urbanization has a dampening effect on agro-ecological efficiency. Urbanization has had a significant impact on the sustainable development of rural areas due to the constraints of the urban–rural dual structure. From a global perspective, the decline of rural areas along with urbanization is widespread [20], and Li [21] also pointed out that in reality, the productivity of agricultural labour in China has not improved with the increasing level of urbanization. The rural population, as the main labour stock for agricultural production, has shifted to urban areas, resulting in a reallocation of farm labour resources [22]. The emergence of issues such as the ageing of the agricultural labour force, feminization and the move towards working part-time of the male labour force has led to problems such as a decline in the quality of the agricultural labour force, which ultimately affects the efficiency of green agricultural production [23]. Berry [24] summarizes the facilitating and inhibiting effects of urbanization on agricultural efficiency. Chaolin [25] discusses the issues and challenges faced by agriculture in the urbanization process, particularly the reduction in efficiency. Yang [26] points out that urbanization can lead to the occupation of arable land and its conversion to construction land, as well as soil pollution, which in turn leads to inefficient land resource allocation. According to the 2017 China Agricultural Census, China’s agricultural labour force is “feminized”, “ageing” and “hollowed out” in the context of population urbanization. SHANG [27] and other scholars have concluded that in China′s major grain-producing regions, population urbanization has a non-significant negative impact on agricultural eco-efficiency. Gao [28] also showed that the development of population urbanization is accompanied by the expansion of urban scale and the squeeze on agricultural land, resulting in a reduction in rural arable land. The increased demand for food production as a result of population growth, the increased number of land tilling operations and the increased use of various chemicals and machinery inputs to increase food production may result in a reduction in eco-efficiency.
The analysis of “green and sustainable” agricultural production efficiency (i.e., agro-ecological efficiency) has been less frequently included in existing studies. However, at the input–output level, higher agricultural chemical inputs can also lead to higher undesired outputs (e.g., surface pollution). This makes the urbanization of the population not necessarily a contributor to agro-ecological efficiency. What is certain, however, is that urbanization has a significant impact on agro-ecological efficiency, but the direction of its effect is unclear. Chinese agriculture is in the historical transition stage of ecologization and modernization, while research on agricultural eco-efficiency in China has been enriched in recent years, such as that by Wang [29], Ren [30], Jiang [31], Huang [32] and Chenxuan [33], who have adopted the super-efficient SBM model with non-expected outputs for measuring and evaluating eco-efficiency. Thus, the application of research methods and the construction of an agricultural eco-efficiency evaluation index system have matured, and it is of practical significance and a research basis to discuss the study of the impact on ecological agricultural production efficiency of population urbanization.
Most of the above studies have examined the impact of agricultural ecology and productivity in terms of the progress of population urbanization. The impact of the degradation of urbanization on agriculture is not clear. The causal relationship and transmission links between the two are also unclear. Therefore, it is necessary to study the impact of population urbanization on the ecological efficiency of agriculture in China, with a view to promoting high-quality agricultural development in China while maintaining the modernization process. It can also provide theoretical references for subsequent studies on population urbanization and agro-ecological efficiency.
Based on that background, the paper takes the period 2001–2020 as the study period and 31 provinces and cities in China (excluding Hong Kong, Macau, and Taiwan) as the study area. With reference to existing studies, a more comprehensive index system for measuring agricultural eco-efficiency in China is constructed. The super-efficient SBM model is used to measure agro-ecological efficiency, and a panel data model is constructed to measure agro-ecological efficiency values. Using the PVAR model, the impact of agro-ecological efficiency and the causal links between the two are investigated from the perspective of reverse degradation of population urbanization. Combined with the panel Tobit model, the effects of population urbanization on agricultural eco-efficiency in China are comprehensively investigated. The study aims to provide a scientific reference for the transformation of agriculture into a high-quality and green industry in the context of China′s continuing population urbanization. On the basis of continued population urbanization, this study provides a scientific basis for the government to coordinate good urban and rural planning, adjust industrial structure and solve ecological problems.

3. Materials and Methods

3.1. Agro-Ecological Efficiency Measurement

The paper constructs an agricultural eco-efficiency evaluation index system from the input–output perspective based on the undesired output super-efficiency SBM model and on the basis of existing research (Table 1). The super-efficiency SBM model, which can avoid the problems of bias and influence caused by different quantitative scales and differences in radial and angular choices, is widely used in the evaluation of eco-efficiency, which not only can deal with desired and non-desired outputs differently, but also facilitates the optimization of eco-efficiency. Thus, the paper measures agro-ecological efficiency using the undesired output super-efficiency SBM model with reference to studies by Andersen [34] and Fukuyama [35].
In the paper, the ratio of the total agricultural output value to the total agricultural, forestry, animal husbandry and fishery output value, is multiplied by the number of people employed in agriculture, forestry, animal husbandry and fishery, to find the agriculture people employed number. Meanwhile, based on the current situation and reality of China’s family-run smallholder economy, although mechanization and modernization of agricultural production patterns are constantly promoted, traditional labour patterns still occupy a large proportion, and the role of livestock cannot be ignored. In the undesired output, the carbon emissions of agricultural system mainly refer to the studies of West [36], Tian [37], Chen [38] and Guotong [39] based on the characteristics of Chinese agricultural chemicals, from seven aspects (10 indicators) of agricultural tillage, agricultural irrigation, agricultural diesel, agricultural machinery power, pesticides, agricultural films and chemical fertilizers (subdivided into nitrogen, phosphorus, potash and compound fertilizers) to carry out carbon emission measurement of agricultural systems. Agricultural surface source pollution is mainly the excessive use or residual pollution of agricultural production input resources. With reference to the studies of Li and Ma [40] and Wang and Zhang [12], the sum of the loss of total nitrogen (TN), total phosphorus (TP) and chemical oxygen demand (CODCr) from pesticide production inputs is mainly characterized, including the loss of nitrogen and phosphorus from nitrogen and chemical fertilizers, and the loss of nitrogen and phosphorus from servant animal manure and urine. The amount of pesticides lost and the amount of agricultural film residues can be obtained from statistical data.

3.2. Association Hypothesis Testing Based on The PVAR Model

Holtz-Eakin [41] first proposed a vector autoregressive model for panel data, which relaxes the sample data requirements compared to the traditional PVAR model, while incorporating the advantages of panel data, and is now widely used in related research. The model focuses on the role of other systems in response to a negative shock to one system, and can be used to study negative correlations between systems. At the same time, the PVAR model can also analyse the long-run transmission mechanism of the response system, and can be combined with GMM estimation and variance decomposition to clarify the causal relationship between systems. The paper analyses the relationship between agro-ecological efficiency and the level of population urbanization by constructing a panel VAR model (PVAR). The PVAR model was constructed as follows.
y i t = α i + β t + j = 1 p β p y t p + τ i t
where i denotes the province, and takes values from 1 to 31. t denotes year, and t = 2001 , 2002 , , 2020 . Additionally, to reduce heteroskedasticity, logarithms are taken for the raw data in the empirical test session. p denotes the lagged order. α i denotes individual effects, i.e., geographical differences between variables. β t denotes time effects, i.e., differences in variables over time. β p denotes the 2 × 2 coefficient matrix. τ i t denotes the random disturbance term.

3.3. Panel Tobit Model Construction

To explore the factors influencing agro-ecological efficiency and the degree of influence, the article constructs a panel regression model. The undesired output super-efficient SBM model measures agro-ecological efficiency as truncated discrete data in the range of 0 to 2, which is prone to large biases if the data are brought into a traditional OLS model for regression testing. The Tobit model, on the other hand, is not only able to handle such characteristic data, but can also analyse dummy variables to avoid large bias. Therefore, the paper refer to the studies of Ghorbani [42], Yang [43], and the panel regression model is combined with the Tobit model to examine the influence of population urbanization on agro-ecological efficiency. The basic form of the model is as follows.
y i t * = X i t β + Z i t β 1 + α i + τ i t y i t = max 0 , y i t
In the model, y i t * , y i t , X i t and Z i t denote the matrix of explanatory variables, the matrix of observed explanatory variables, the matrix of explanatory variables and the matrix of control variables, in that order. The regression model results are set as follows.
A E E i t = β 0 U R B i t + j β j U R B j , i t + const
In Equations (2) and (3), j denotes the control variable of type j. const denotes the intercept term. β denotes the regression coefficient. URBit is the core explanatory variable, i.e., the level of the population urbanization.
The variables are set as follows (Table 2).
Explanatory variable: agro-ecological efficiency (AEE), as measured by the super-efficient SBM model.
Core explanatory variable: level of urbanization of the population (URB), obtained directly from statistical data.
Control variables: The core element of agro-ecological efficiency is the coexistence of ecology and efficiency, so control variables are selected from the direct effects at the level of agriculture itself and the indirect external effects that accompany the urbanization of the population.
(1)
Direct impact: Per capita agricultural value added (PADA) to a certain extent reflects the state of agricultural economic development and is the basis of agro-ecological development, and may have different impacts on agro-ecological efficiency at different stages. Rural human capital (AHM) is the basic condition for agro-ecological development. Generally speaking, the higher the quality of the rural labour force, the more favourable it is to agro-ecological development, characterised here by the average number of years of education of the rural household labour force. Agricultural water infrastructure (EIR) is measured by the proportion of effectively irrigated area to total sown area. The agricultural disaster rate (ADR) reflects the impact of natural environmental factors and is measured as the ratio of agricultural disaster area to total sown crop area.
(2)
Indirect impact: According to Lewis’ dualistic economic theory, the level of regional industrialization and the conditions of population mobility will all affect the transfer of agricultural population and thus the development of agriculture. Among them, as the share of the tertiary sector in GDP will continue to increase as the level of industrialization increases, this paper expresses the level of industrialization (IND) as the share of the value added of the tertiary sector in GDP. The ratio of the sum of railway mileage, inland waterway mileage and road mileage to national land area is used to reflect the conditions of population mobility (transport infrastructure, TRAF).

3.4. Data Sources

All primary data sources in this paper include statistical yearbooks and bulletins from 2002 to 2021, etc. The data on the agricultural workforce are from the China Population and Employment Statistical Yearbook. The urbanization level (URB), industrialization level (IND) and land area by province are from the China Statistical Yearbook. Railway mileage, inland waterway mileage and road mileage are from provincial statistical yearbooks. All remaining data are from the China Rural Statistical Yearbook. A few missing values are filled in by linear interpolation methods, and all economic indicators are deflated. Meanwhile, the super-efficient SBM model in this paper was calculated using Matlab 2019b (Available online: https://ww2.mathworks.cn/products/compiler/matlab-runtime.html, (accessed on 13 December 2021)). The PVAR model as well as the panel Tobit model were calculated in stata 16.

4. Results

4.1. Agro-Ecological Efficiency Evaluation

The paper measures the agro-ecological efficiency values of 31 provinces and cities (excluding Hong Kong, Macao and Taiwan) in China from 2001 to 2020 based on the non-expected output super-efficiency SBM model. A total of 620 data from 31 provinces and cities in 20 years were also clustered and divided into low efficiency (AEE < 1.00), medium efficiency (1.16 > AEE ≥ 1.00) and high efficiency (AEE ≥ 1.16).
(1)
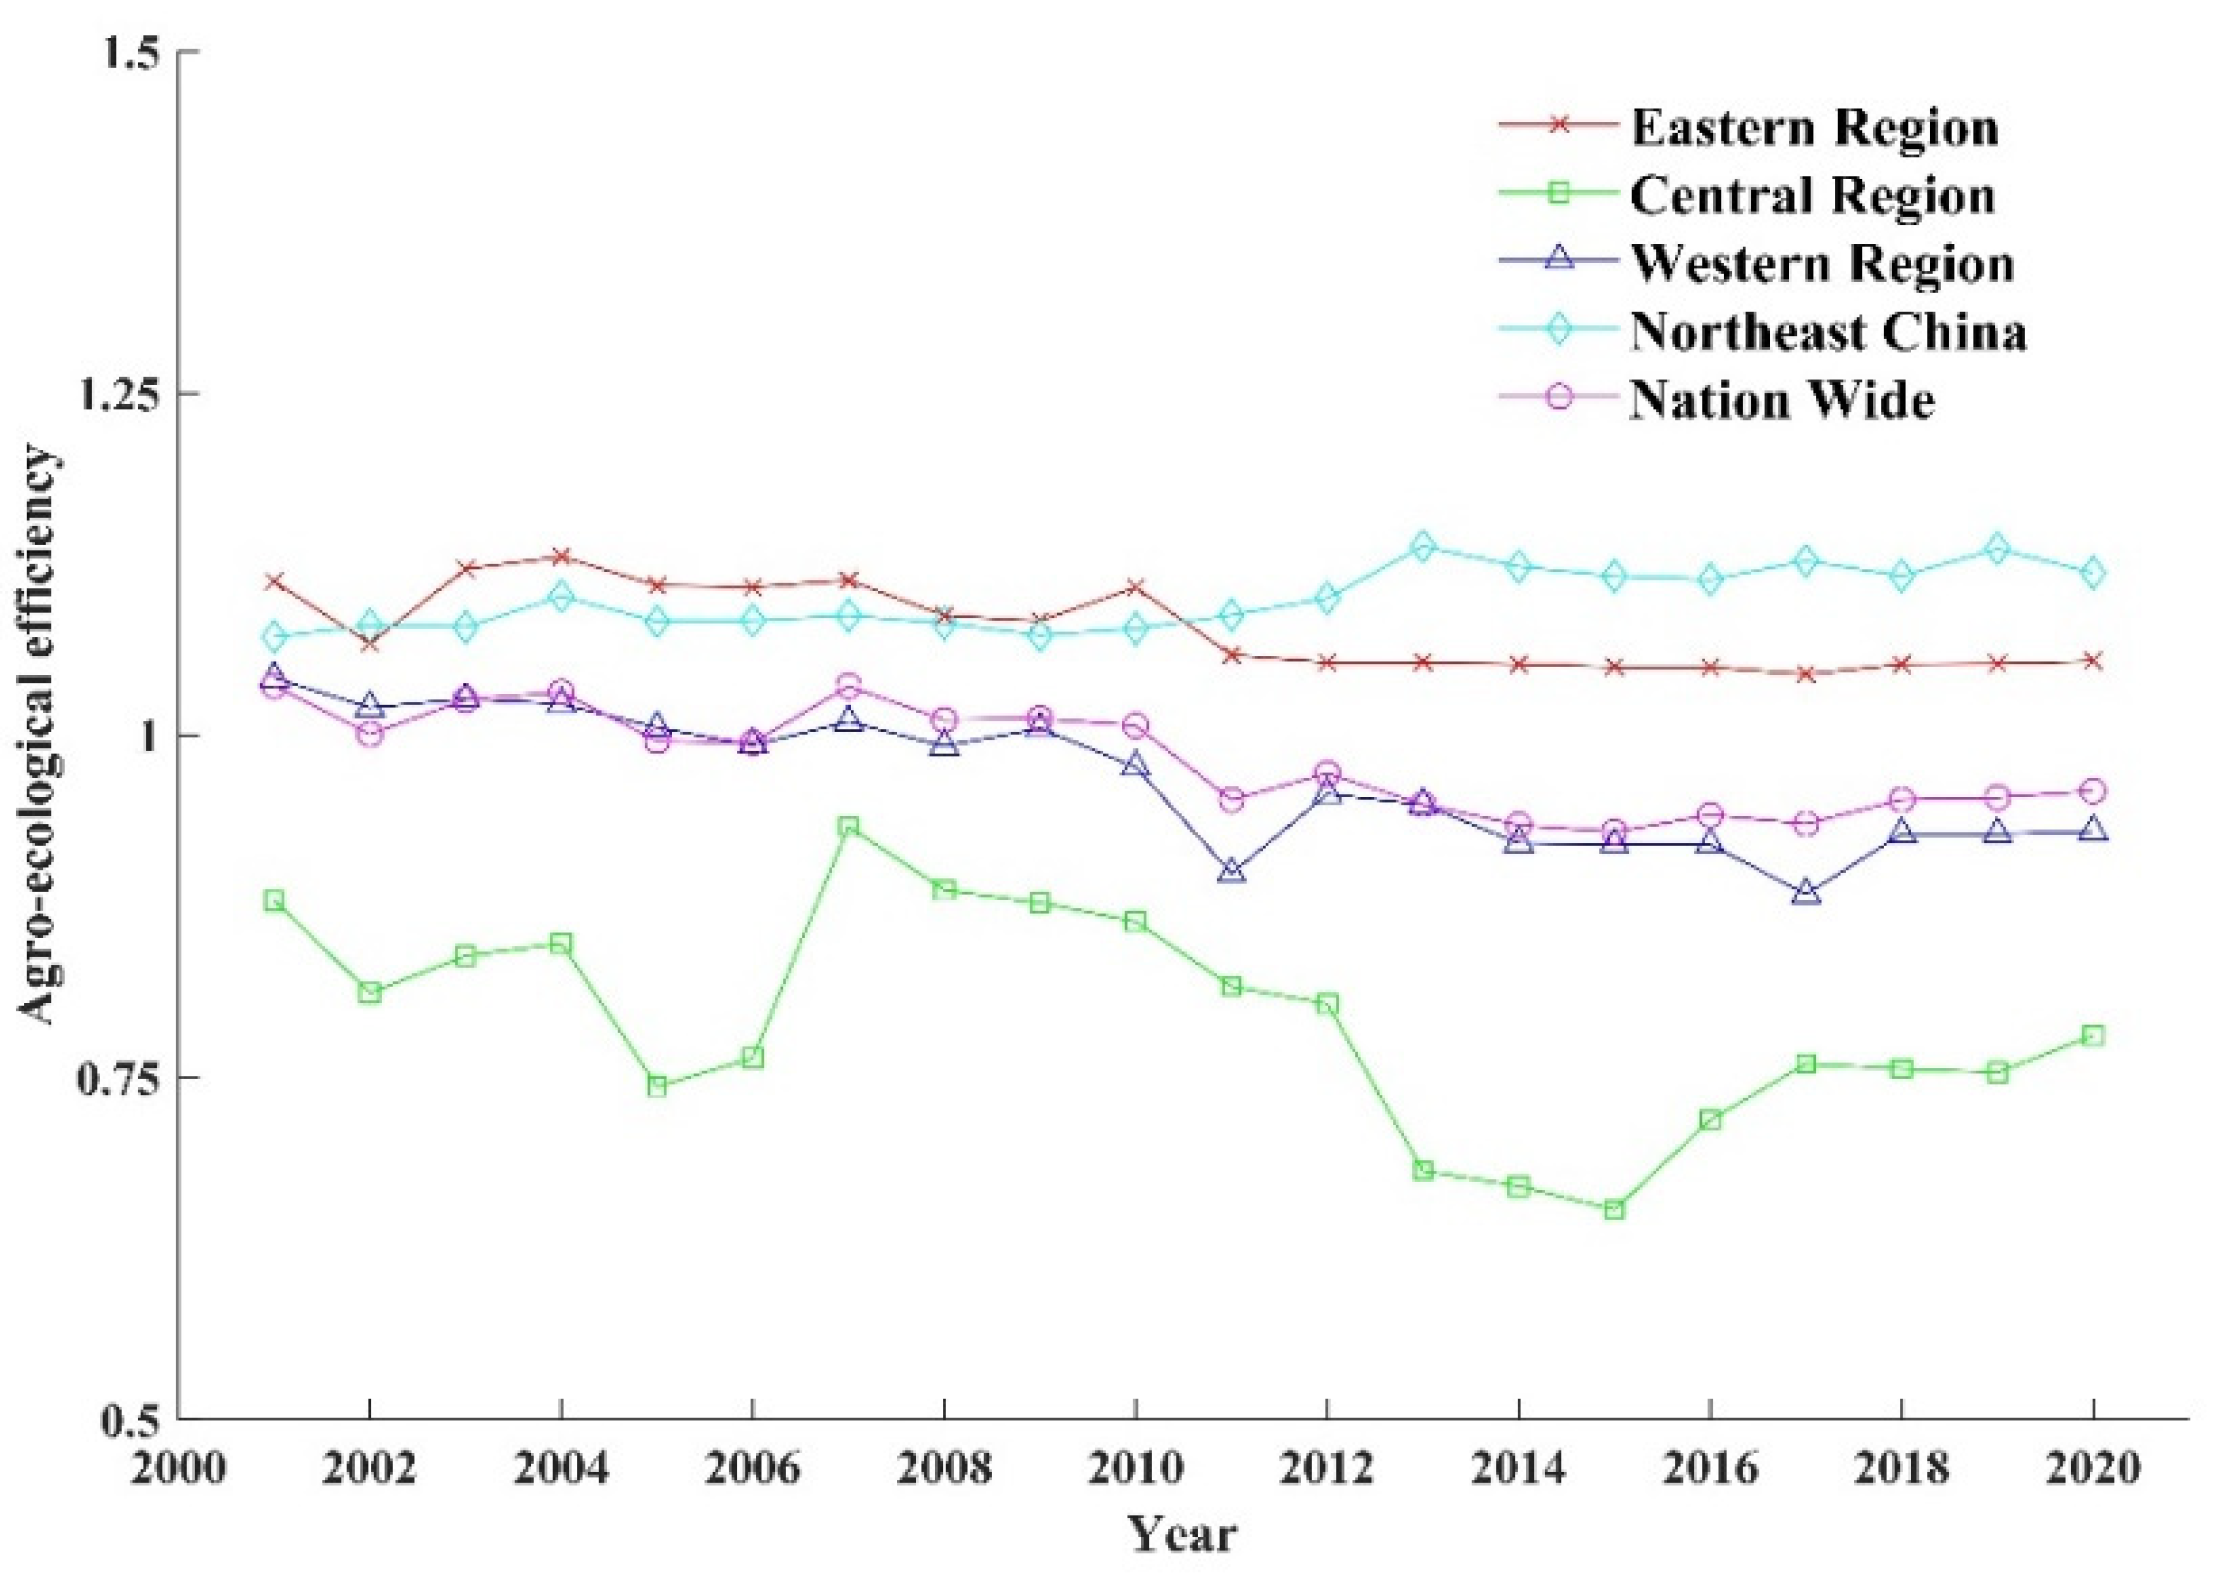
A subregional discussion of the evolution of agro-ecological efficiency according to the regional divisions of the Statistical Bulletin of the National Economic and Social Development of the People’s Republic of China 2020 (Figure 1).
I.
The change in national agricultural eco-efficiency from 2001 to 2020 is relatively stable, with the overall mean value remaining around 1.00. The change in AEE in the western region (Inner Mongolia, Guangxi, Chongqing, Sichuan, Guizhou, Yunnan, Tibet, Shaanxi, Gansu, Qinghai, Ningxia and Xinjiang) remains relatively consistent with the national agricultural change.
II.
Agricultural eco-efficiency values in central China (Henan, Hubei, Hunan, Anhui, Jiangxi and Shanxi) show large fluctuations over time, with a W-shaped trend, and the region as a whole is in an inefficient state.
III.
The average regional agro-ecological efficiency values for the eastern regions of China (Beijing, Tianjin, Hebei, Shanghai, Jiangsu, Zhejiang, Fujian, Shandong, Guangdong and Hainan) and the northeastern regions (Liaoning, Jilin and Heilongjiang) are all in the medium efficiency range. However, the AEE in the eastern region stabilized at around 1.05 after a decrease in efficiency between 2010 and 2011, with an overall decrease. The AEE in the Northeast region, on the other hand, showed an overall upward trend.
IV.
Eastern China is the most urbanized region in China in terms of population, and therefore urbanization is an important factor among those affecting agro-ecological efficiency. The northeastern region is a significant region for food production in China, and agro-ecological efficiency may also be influenced by various direct aspects under the perspective of agricultural production. This section provides ideas and rational explanations for the selection of influencing factors for the construction of the panel Tobit model in the paper.
(2)
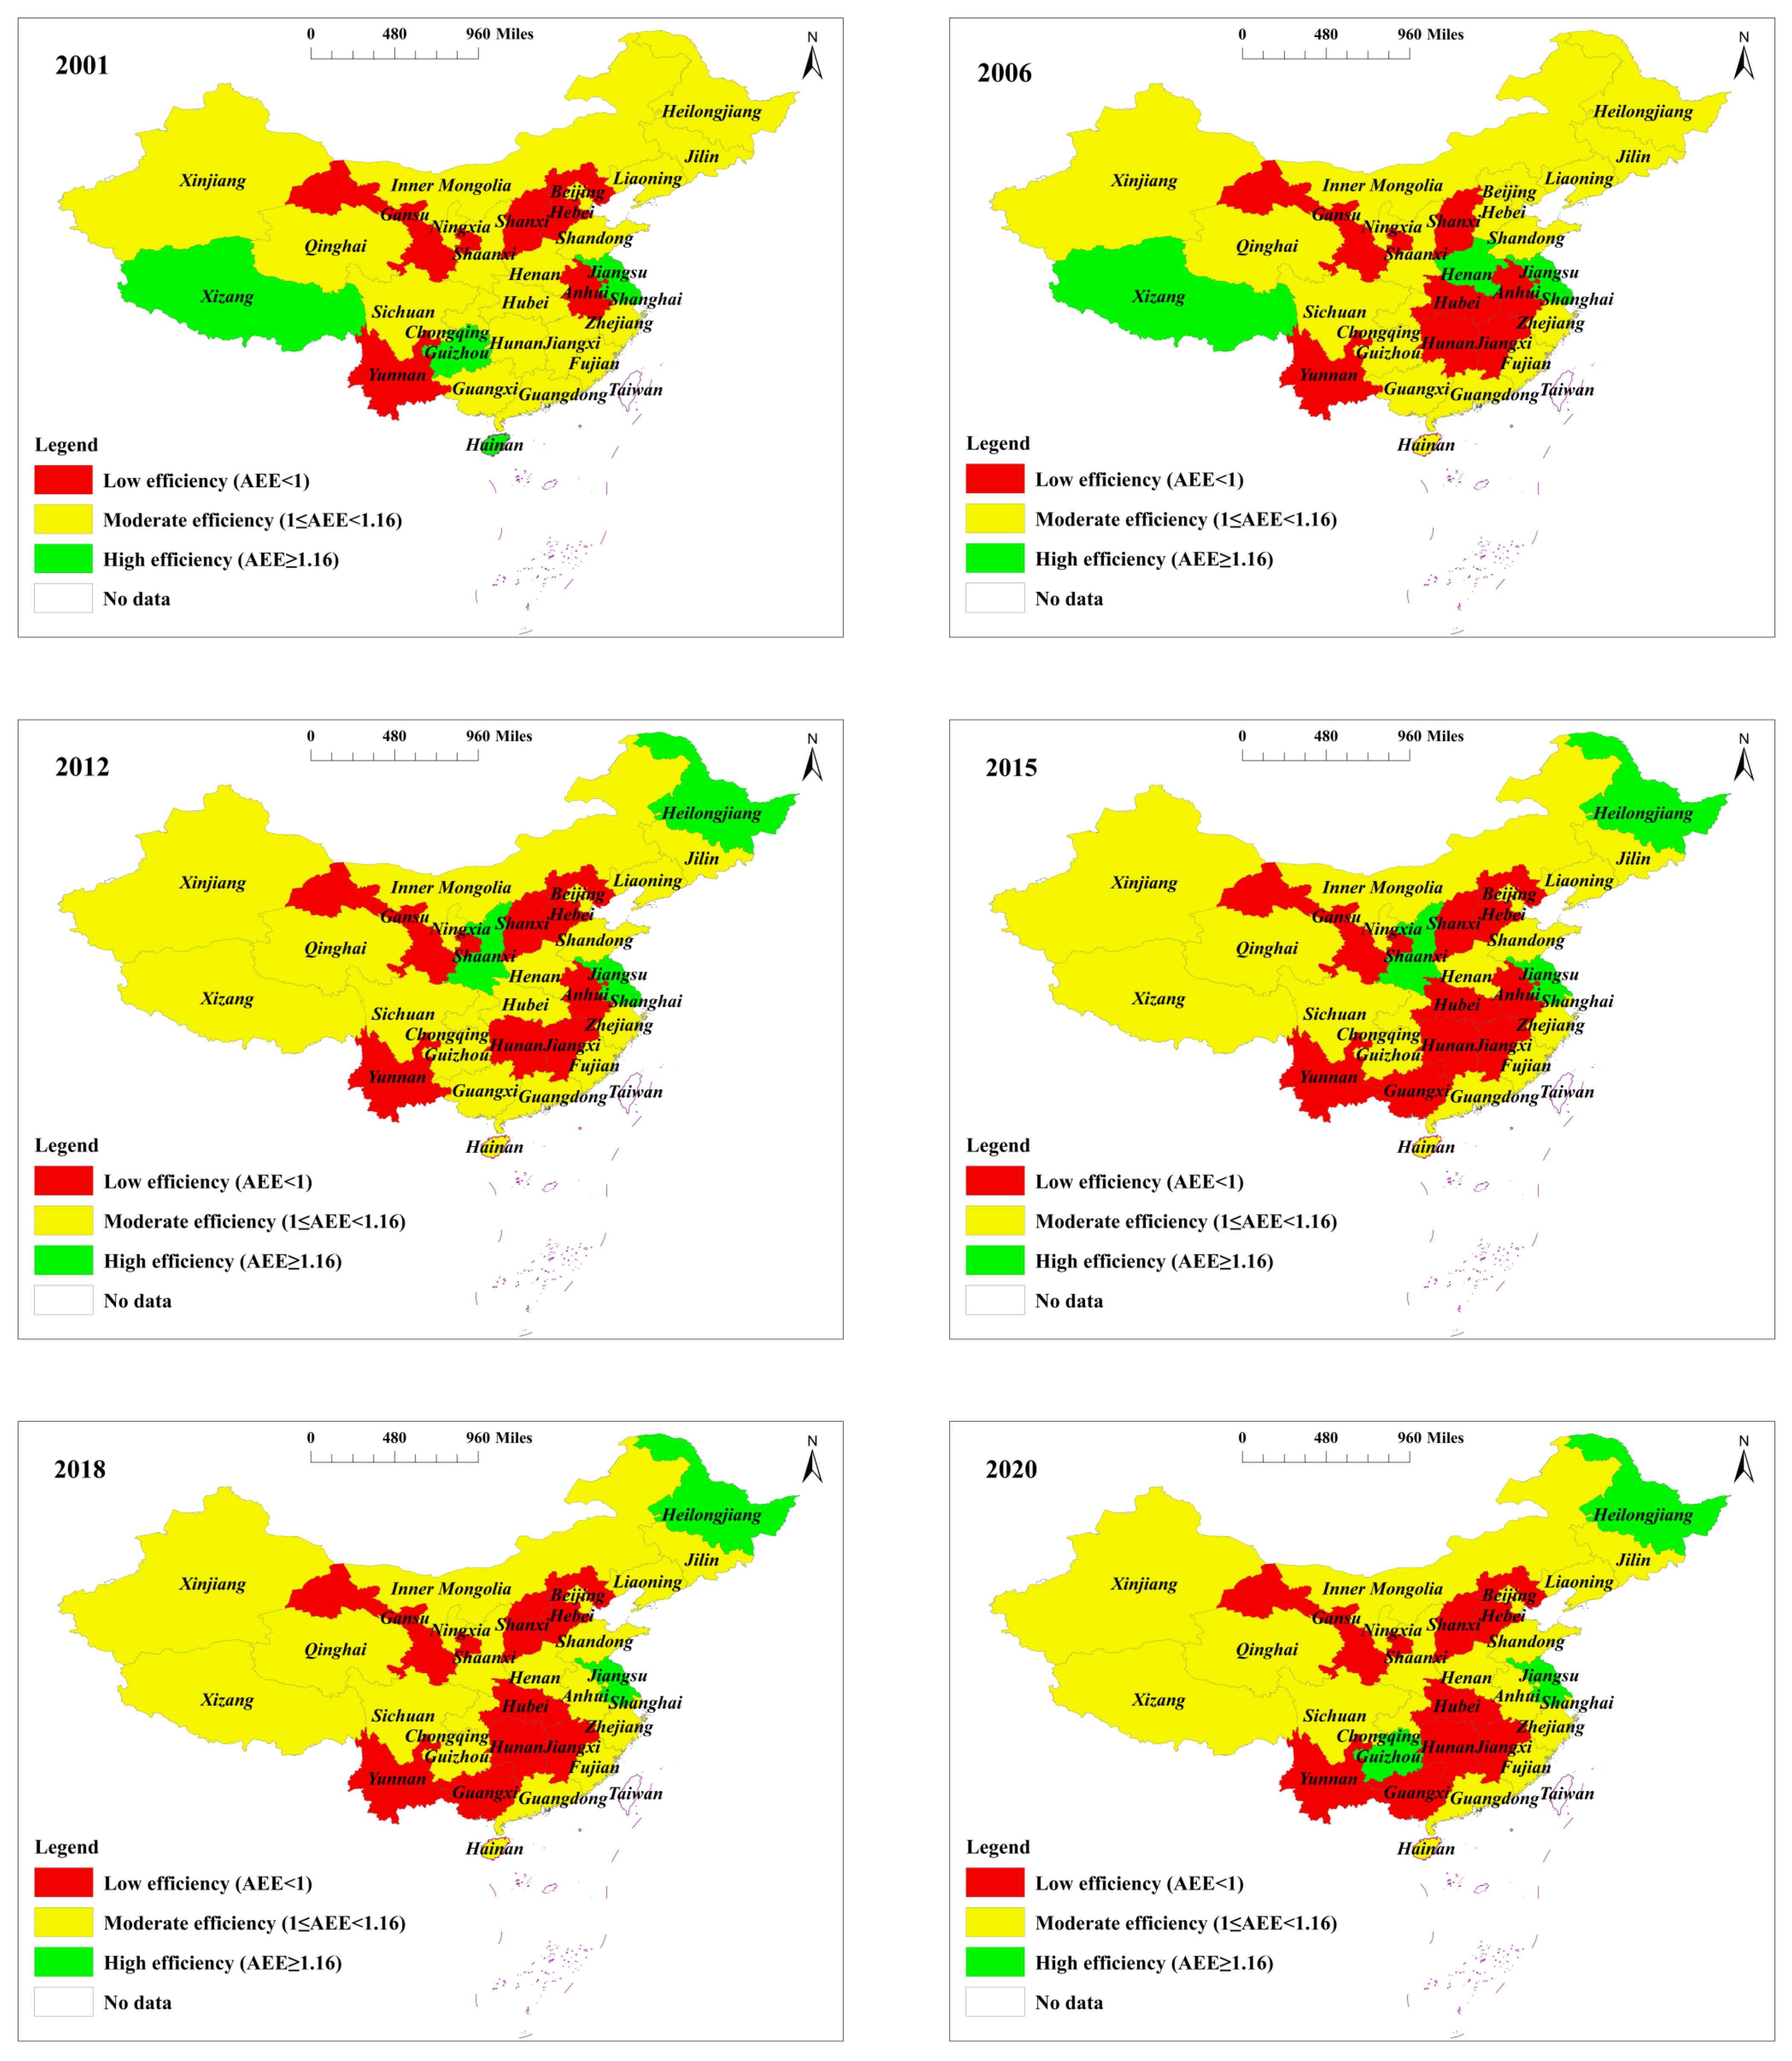
A discussion of the classification of agro-ecological efficiency in China’s provinces in terms of spatial and temporal evolution patterns (Figure 2).
I.
Between 2001 and 2020, Gansu, Yunnan and Shanxi were in the low-efficiency region for a long time, while the eco-efficiency values of Hunan, Hubei, Jiangxi, Hebei and Guangxi were also in the low-efficiency state most of the time. The agro-ecological efficiency of the three traditionally large agricultural provinces, including Hebei, Hubei and Hunan, were all in a state of low-efficiency after 2012.
II.
Most of the eastern regions are in a moderately efficient state, with no provinces or cities in the eastern coastal region being in an inefficient region. However, the eastern coastal region includes provinces and cities such as Guangdong, Shanghai, Jiangsu, Zhejiang, Shandong and Tianjin, which represent the most rapid and highest level of population urbanization in China. Thus, once again, the need for research on the impact of population urbanization on agro-ecological efficiency has been side-lined.
III.
Jiangsu and Heilongjiang were all in a state of high efficiency after 2012, while Shaanxi, Hainan and Tibet decreased from high to medium efficiency. It is also evident from Figure 2 that the number of inefficient areas in China’s agro-ecological efficiency has gradually increased over time, and has shown a concentration in the central region. Therefore, if China is to achieve high-quality agricultural development, it needs to pay extra attention to the central region and the long-term inefficient regions.
(3)
Analysed in relation to regional characteristics.
I.
Heilongjiang Province has always been highly efficient in terms of agro-ecological efficiency. Heilongjiang is known as the “granary” of China and was the first region in China to start large-scale agricultural production. With large-scale agricultural production and relatively flat land, grain output is the mainstay, and labour inputs and livestock inputs are small. The Heilongjiang province has mature agricultural production on a large scale after more than 50 years of mechanized land clearing. Thus, the provinces can consider agricultural production models with the high input of agricultural machinery according to their internal terrain. Similar areas include Jilin, Liaoning and Xinjiang.
II.
Guizhou is predominantly mountainous, with difficult large-scale grain production and high levels of draft animal inputs, but the mean value of agro-ecological efficiency is 1.07. This is mainly due to the large scale of cash crop production in Guizhou, the relatively high proportion of economic output and the low level of machinery inputs. Similar regions include Tibet, Yunnan and Guangxi. However, the mean agro-ecological efficiency of Yunnan is 0.5197. The reason for this is that Yunnan has large inputs of chemical fertilizers, pesticides, agricultural films and draft animals, and serious surface pollution. Therefore, what Yunnan needs to face now is how to use agricultural chemicals efficiently and consider mechanization power substitution. Properly restructuring crop cultivation to improve economic output is also an important way to improve agro-ecological efficiency in Yunnan at present.
III.
The south-eastern coastal region, such as Jiangsu, has a high level of agricultural machinery inputs and a low level of agricultural chemical inputs. In addition to the fact that the southeast coastal region is rich in water resources and the land is mostly plain, it has a relatively reasonable cropping structure. Inefficient regions such as Hubei and Hunan have similar labour, machinery, and irrigation inputs as the eastern coastal regions, but have high agricultural chemical inputs and lower economic output per unit and food output than provinces and cities of the same size. It can be assumed that these regions possess low input utilization rates. China is still in a region of low agro-ecological efficiency and needs to strengthen the use of agricultural chemicals as inputs.

4.2. The Results of PVAR Model

4.2.1. Panel Unit Root Test and Lag Order Determination

Before the model is estimated, the stationarity test of the data of each variable needs to be conducted to determine the stationarity of the panel data. As shown in Table 3, the paper conducted the stationarity test by using the LLC test, IPS test and ADF test at the same time. The unit root test was conducted on the urbanization level and agricultural eco-efficiency of the study area, and the heteroscedasticity was minimized. lnAEE and lnURB were used as the data series, and the original hypothesis of the “existence of unit root” was rejected, indicating that the two variables were homogeneous single integer series, and the PVAR model could be initially constructed.
Determining the lag order of the model is a key aspect of building a PVAR model. A lag order that is too long or too short cannot capture the dynamic properties of the model with guaranteed fitting accuracy. Therefore, in this paper, the optimal lag order of PVAR is selected based on the Akuchi Information Criterion (AIC), Bayesian Information Criterion (BIC) and Hannan–Kyung Information Criterion (HQIC) (Table 4). The AIC and HQIC possess the minimum value at the fifth order lag, and the optimal lag order of the PVAR model is fifth order according to the minimization principle of AIC, BIC and HQIC.

4.2.2. Analysis of PVAR Model Results

The results were obtained by generalized moment estimation (GMM) (Table 5). When lnAEE was used as the response variable, the coefficient of agro-ecological efficiency with one period lag was positive and significant at the 5% level. When lnURB was used as the response variable, the coefficient of agro-ecological efficiency with one period lag was negative and significant at the 5% level. The coefficient on the level of urbanization for the lagged period was positive and significant at the 1% level. The remaining 2, 3, 4 and 5 period lagged estimates were not significant. This suggests that the rise in agro-ecological efficiency has a negative effect on the development of population urbanization, mainly because good agro-ecological efficiency promotes the development of the agricultural economy, which allows for stable changes in the rural population stock and slows down the rate of population transfer to urban areas.
Figure 3 gives a graphical representation of the impulse response function of the variable PVAR model. The dashed line (dark red dotted line) in the middle represents the impulse response of a variable given a shock of one standard deviation, with the upper (green solid line) and lower (blue solid line) curves representing the upper and lower bounds of the 95% confidence interval, respectively, obtained using Monte Carlo simulations 200 times. The horizontal axis represents the number of lags that the shocks last, and the vertical axis represents the degree of positive, negative and strong responses. From Figure 3, it can be seen that when lnURB and lnAEE receive shocks of their own, both produce a negative impact, and their impact effect diminishes as the lag period passes, whereas, when lnAEE receives a shock from lnURB, it produces a U-shaped impact trend over time evolution and causes a negative impact, and when lnURB receives an lnAEE shock, the lagged impact is both positive and negative, with the impact effect fluctuating around the 0-value line. (Hysteresis effect: when one system maintains a relative trend in development, another system is affected and causes long-term effects over time).
In order to reveal the degree of interaction between the level of population urbanization and the development of agro-ecological efficiency, this paper uses the variance decomposition method to decompose the variance between URB and AEE based on the analysis of impulse response plots, and the results are shown in Table 6. The fluctuations of AEE are almost always concentrated on the impact of its own shocks. However, when the shock variable is URB, the explanation of URB for the change in AEE gradually increases over time, with a variance contribution of 71.7% by the tenth period.
The above GMM estimation results indicate a link between AEE and URB, and the PVAR impulse response indicates that URB has a shock effect on AEE. The results of the variance decomposition show that the impact of URB on AEE has a long-lasting effect, and the extent of the impact increases over time. Meanwhile, this paper conducted Granger causality tests on the raw data and the raw data of AEE and URB passed the ADF test and were both significant at the 1% level. The results show that URB can be proved to be the Granger cause of AEE at the 1% significant level. Therefore, the shock to the urbanization of the population has a negative impact on the agro-ecological efficiency when combining the above GMM estimation results and the results of the Granger causality test. Thus, when population urbanization is hit, it has a long-term negative impact on agro-ecological efficiency.

4.3. Analysis of Panel Tobit Model Results

The results of the studies by Breitung [44] and Choi [45] show that, in fixed-effects Tobit models, adequate statistics for individual heterogeneity cannot be found, and conditional maximum likelihood estimation is not possible as in the case of fixed-effects Logit or count models. If dummy variables for panel units are added directly to the mixed Tobit regression, the resulting fixed-effects estimates are inconsistent and biased, and the test statistics for the bias-corrected fixed-effects panel Tobit models of existing studies do not have broad applicability. Therefore, the presence of individual effects in the panel data was determined by LM tests (significant at the 1% level) in all models with traditional panel regressions, using random effects panel Tobit regressions in the paper. The models are constructed by adding the elements step by step as a robustness test for the final models. As can be seen from Table 7, all models are significant and pass the robustness test.
The paper focuses on the impact of the level of the urbanization of population on agricultural eco-efficiency. Firstly, model (2) is constructed with only URB as the explanatory variable, and then models (3) and (4) are constructed by adding direct and indirect influencing factors of agriculture itself, respectively, and model (5) is the regression result including direct and indirect influencing factors.
The results of model (2) show that the regression coefficient of URB is significantly negative at the 1% level. This indicates that the advancement of population urbanization does not directly improve agro-ecological efficiency. The reason for this is that as population urbanization advances, there is an outflow of agricultural population and the labour stock is insufficient to support the original production methods, requiring increased inputs such as agricultural machinery and chemicals to maintain food output. This tends to increase undesired output significantly, which in turn inhibits agro-ecological efficiency.
Model (3) incorporates four variables that directly affect agro-ecological efficiency, PADA, AHM, EIR and ADR. The results show that at the 1% level, all variables are significantly negative, except for PADA, which is significantly positive. While ADR itself is a negative influence, its regression is significantly negative, implying that a lower agricultural disaster rate will enhance agro-ecological efficiency.
Model (4) is based on model (2) with the addition of two external indirect variables affecting agro-ecological efficiency, IND and TRAF. The results show that the effect of IND is not significant, while TRAF is significantly positive at the 10% level. Combined with model (5), TRAF is significantly positive and IND is significantly negative at the 5% level. In all four models, URB is significantly negative at the 1% level; therefore, hypothesis 2 holds.
Combining the above models, model (5) has the largest log likelihood value and all variables are significant at the 5% level of explanation, implying that it better explains the effect of each variable on AEE. The analysis of the results of model (5) shows that good PADA and TRAF can promote the improvement in agricultural eco-efficiency, especially the improvement in PADA, which can improve agricultural eco-efficiency to a greater extent. Therefore, the high-quality development of agriculture requires economic market promotion. The core variables URB and AHM, and EIR and IND are all significantly negative. The main reason for the negative impact of water infrastructure improvements on agro-ecological efficiency is that Chinese provinces are not very efficient in terms of agro-ecological water use [46] and are under pressure to rationalize the allocation of water resources in agriculture [47]. The equivalent effective irrigated area requires more energy power, and the larger the coverage of water infrastructure, the greater the factor inputs required.
The increase in the number of years of education per capita lies in the increased ability of agricultural workers to communicate externally and to acquire knowledge. In the information age, the increase in the level of education of rural residents has given them more external options, but it has also increased the opportunities for labour migration, which is why URB and IND have a negative impact on AEE. Moreover, the core of the work of agricultural workers lies in manual labour, while the mental labour lies more in agricultural science and technology research and development (e.g., high-yield rice research and development, low-pollution fertilizers, etc.). The combination of the two leads to a statistically significant negative relationship between the increase in AHM and agro-ecological efficiency.
Of the four models in the panel Tobit regression, model (5) has a URB regression coefficient of -0.0023082, which is similar to the peak of the impulse response value of the PVAR model (the peak impulse response value is about -0.0025). The absolute value of the URB regression coefficient for the rest of the models is even smaller. This implies that population urbanization has a direct negative impact on agro-ecological efficiency, but also that population urbanization can, through indirect economic and technological progress, bring about the efficient use of agricultural input factors, and the expansion of agricultural market size can also effectively improve agro-ecological efficiency.

5. Discussion

The paper uses panel data from 31 provinces and cities in China from 2001 to 2020, based on the current situation of agricultural production in China, incorporating draft animal inputs. Using agricultural input carbon emission coefficients that are closer to the actual situation in China for the remeasurement of agricultural eco-efficiency, it can be concluded that:
(1)
Agro-ecological efficiency values are relatively high in eastern and northeastern China, with an overall medium efficiency status, but with a slight downward trend in AEE in the eastern region. The evolution of AEE values in the western region and the country as a whole follows a similar trend, showing a downward trend over time and dropping from moderate to low efficiency. The overall AEE in the central region is in an inefficient state. From a macro perspective, the central provinces need to pay more attention to agro-ecological efficiency in order to achieve sustainable, high-quality agricultural development in China as a whole.
(2)
In terms of temporal evolution, both inefficient and efficient regions have increased, and agro-ecological efficiency has shown a bifurcation in the region. The inefficient regions tend to be concentrated in the central region, and Gansu, Yunnan and Shanxi have been in the inefficient regions for a long time, so researchers can conduct more microscopic studies on the central region and the provinces that have been in the inefficient regions for a long time.
(3)
The analysis of the results from the provincial and municipal characteristics shows that in areas with flat terrain and more abundant water resources, the large-scale production model can be adopted, and the representative region is Heilongjiang. The second is in regions with relatively developed economies, where reference can be made to the efficient model of input utilization in the southeast coastal areas, controlling certain costs and increasing output through good business systems. The third is in regions where food cultivation is difficult and economic output can be increased by adjusting the proportion of cash crops grown.
(4)
Considering that China’s “national agricultural security” strategy emphasizes stable and sufficient grain output and increased production, and that Heilongjiang, Jilin and Liaoning provinces are established as grain production bases at the national policy level, it is clear that there is a certain degree of differentiation in the positioning of agricultural production in each province in China. Therefore, in this study, grain output is also included as the main desired output in the AEE measurement. The desired effect of grain output in these three regions offsets the negative output and enhances overall efficiency when input factors increase and non-desired output increases.
(5)
The results of the agro-ecological efficiency (AEE) values obtained in the paper were compared with existing studies. The mean value of AEE for each region in the paper is higher than that of Wang [29]. The mean value of the overall results of Jiang [31] for measuring agricultural eco-efficiency in China is 0.8032, while the national mean value obtained in this paper is 0.9819, which is numerically higher. The AEE values are generally higher in the southeast coastal region in this paper’s study. This is similar to the findings of Chenxuan [33] and other researchers.
Based on the results of the AEE value measurement, the paper examines the two independent effects of URB and AEE (PVAR model) and the combined effects of multiple factors (panel Tobit model), which reveal that:
(1)
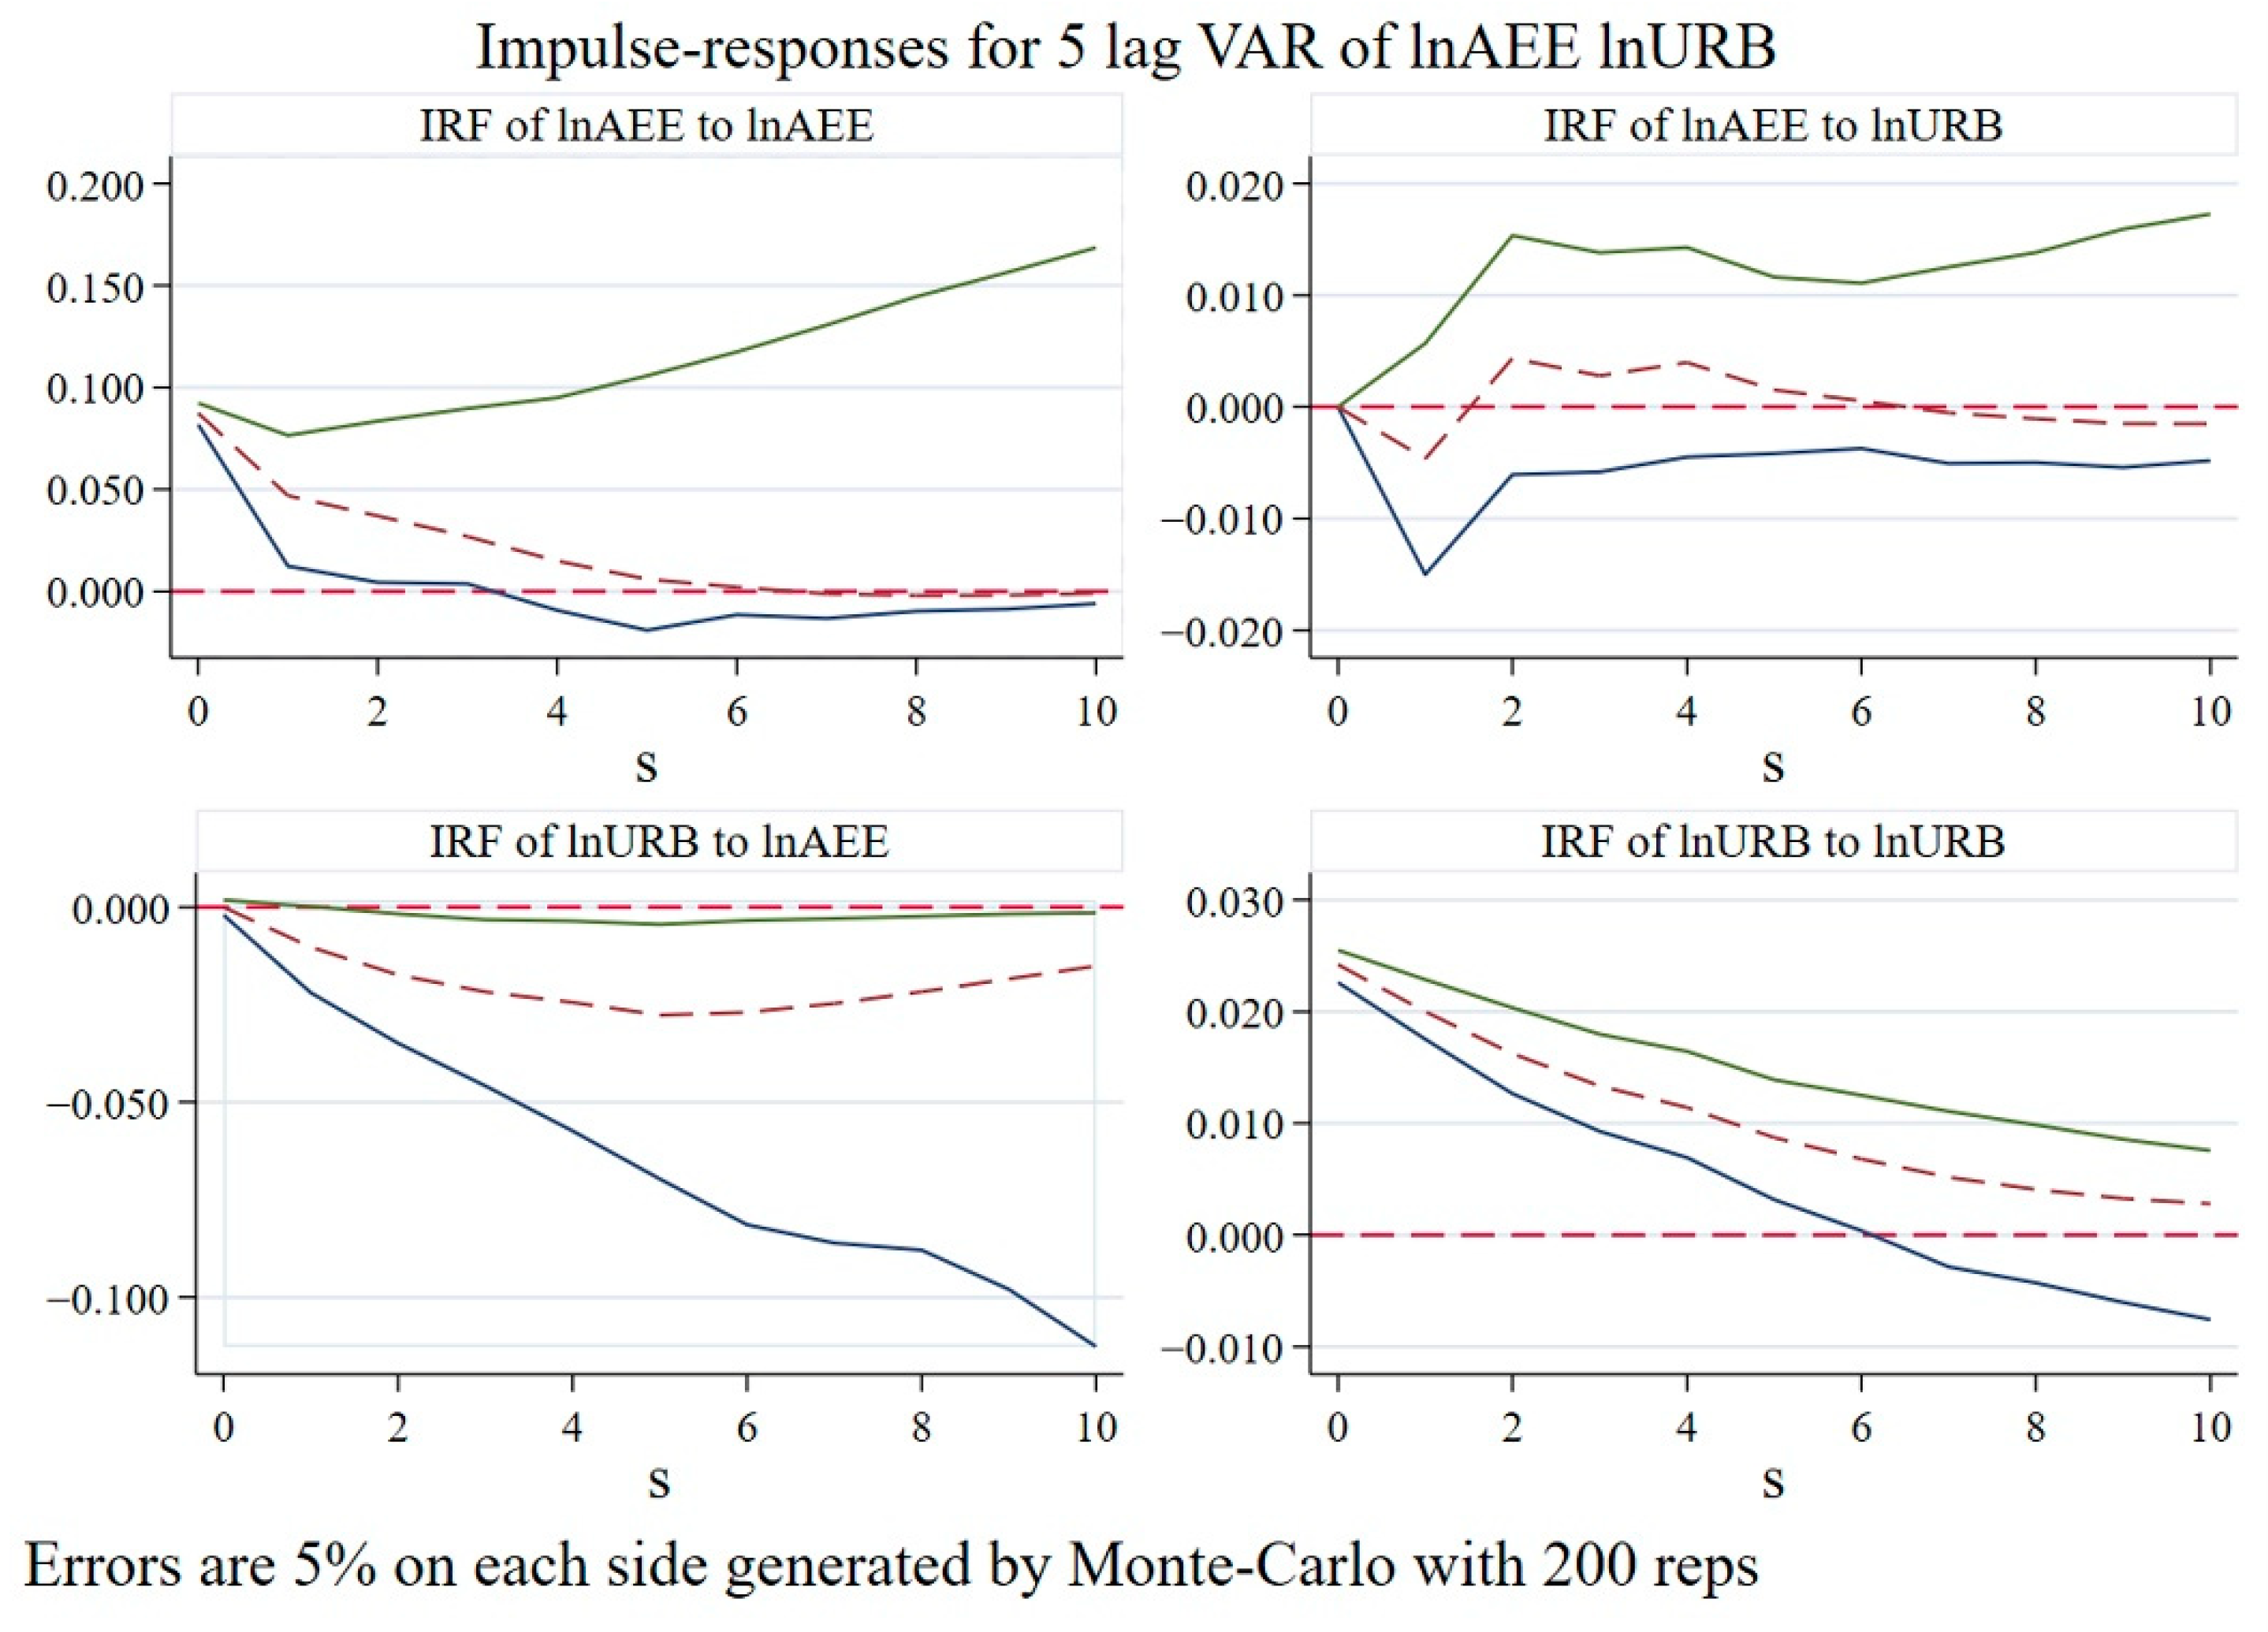
The impulse response plots and ANOVA of the PVAR model reveal that agro-ecological efficiency is negatively affected when there is a negative shock to population urbanization. However, the main impact contribution of a shock to agro-ecological efficiency is by itself. This means that when population urbanization is hit, it has a significant “one-way shock” effect on agro-ecological efficiency, and the negative effect on agro-ecological efficiency has a long-term effect.
(2)
The panel Tobit regression results show that population urbanization, rural human capital, agricultural water infrastructure and the level of regional industrialization have a negative impact on agro-ecological efficiency at a statistical level. Not all elements of the model construction that included only external influences were significant, similar to the results obtained from the PVAR variance decomposition, i.e., when agro-ecological efficiency was shocked, the impact on population urbanization was relatively small.
(3)
The analysis of the results of the PVAR model and the panel Tobit model combined shows that the advancement of population urbanization has a negative impact on agro-ecological efficiency. This finding supports the conclusions of Berry [24] and Chaolin [25]. However, other changes brought about by population urbanization, such as transport infrastructure and economic growth, will promote agro-ecological efficiency. In contrast to the findings of SHANG [27], the paper analyses a larger amount of panel data and finds that population urbanization has a significant negative effect on agro-ecological efficiency.
(4)
The findings of the paper need to be summarized in two parts: (I) The increase in population urbanization has a direct inhibiting effect on agro-ecological efficiency. However, the institutional and technological changes that accompany population urbanization can have a catalytic effect on agro-ecological efficiency. (II) The degradation of population urbanization can also have a dampening effect on agro-ecological efficiency. For example, the return of population to the countryside can lead to a surplus of agricultural labour, or the economic decline that accompanies the degradation of population urbanization can lead to a reduction in agro-ecological efficiency. Therefore, in the promotion of population urbanization, agricultural population transfer should not be restricted and urbanization should not be put on hold in order to enhance agro-ecological efficiency.
(5)
Combining the results of the AEE remeasurement and the results of the models in this paper, it can be learned that China’s agricultural eco-efficiency as a whole is in an inefficient state, and more attention needs to be paid to green and efficient production in agriculture. The advantages brought about by population urbanization should be brought into full play, and agricultural eco-efficiency should be improved in all aspects through the introduction of regulatory technology [33] and the introduction of industrial and commercial capital [48]. Therefore, subsequent studies can explore the multifaceted effects of various external factors, such as the intensity of industrial and commercial capital inputs and the level of technological inputs, on food security and agro-ecological efficiency in order to find more suitable ecological and efficient agricultural production models in different parts of China, and to ensure China’s agricultural security and food safety.

6. Conclusions

Based on the current situation of agricultural production in China, the paper considers the heterogeneity of agricultural chemicals and main production drivers from the scientific level and the current focus of agricultural development in China from the policy level, and constructs a provincial agricultural eco-efficiency measurement index system that is more in line with the current situation of Chinese agriculture with reference to existing studies. The super-efficient SBM model based on non-expected output measures the agricultural eco-efficiency values of 31 provinces and cities in China over a 20-year period from 2001 to 2020, and provides an in-depth analysis of regional differences and temporal evolution patterns. The results obtained can help local governments to understand the current situation of agricultural eco-efficiency and provide a statistically significant reference basis for subsequent agricultural policy formulation.

Author Contributions

Data curation, F.C.; Funding acquisition, F.C. and G.Q.; Methodology, G.Q.; Writing—original draft, F.C.; Writing—review & editing, G.Q., N.W. and D.Z. All authors have read and agreed to the published version of the manuscript.

Funding

Anhui University of Science and Technology Postgraduate Innovation Funding Program: Study on the Coupling and Coordination Mechanism of Rural Economic Development and Ecological Environment under the Strategy of Rural Revitalization (2022CX2158).

Institutional Review Board Statement

Not applicable.

Informed Consent Statement

Not applicable.

Data Availability Statement

All data can be accessed through the corresponding author or by looking on FIGSHARE: “Chen, Fei (2022): A study on the impact of population urbanization on agro-ecological efficiency and agro-ecological efficiency revaluation in China”, figshare. dataset. https://doi.org/10.6084/m9.figshare.21299181.v1 (accessed on 13 December 2021) is available for the article dataset.

Conflicts of Interest

The authors declare no conflict of interest.

References

  1. Wu, H.; Xia, Y.; Yang, X.; Hao, Y.; Ren, S. Does environmental pollution promote China’s crime rate? A new perspective through government official corruption. Struct. Change Econ. Dyn. 2021, 57, 292–307. [Google Scholar] [CrossRef]
  2. Wu, H.; Hao, Y.; Ren, S. How do environmental regulation and environmental decentralization affect green total factor energy efficiency: Evidence from China. Energy Econ. 2020, 91, 104880. [Google Scholar] [CrossRef]
  3. Su, Y.; Li, Z.; Yang, C. Spatial interaction spillover effects between digital financial technology and urban ecological efficiency in China: An empirical study based on spatial simultaneous equations. Int. J. Environ. Res. Public Health 2021, 18, 8535. [Google Scholar] [CrossRef] [PubMed]
  4. Jia, S.; Qiu, Y.; Yang, C. Sustainable Development Goals, Financial Inclusion, and Grain Security Efficiency. Agronomy 2021, 11, 2542. [Google Scholar] [CrossRef]
  5. Cai, J.; Li, X.; Liu, L.; Chen, Y.; Wang, X.; Lu, S. Coupling and coordinated development of new urbanization and agro-ecological environment in China. Sci. Total Environ. 2021, 776, 145837. [Google Scholar] [CrossRef]
  6. Oueslati, W.; Salanié, J.; Wu, J.J. Urbanization and agricultural productivity: Some lessons from European cities. J. Econ. Geogr. 2019, 19, 225–249. [Google Scholar] [CrossRef]
  7. Pham Thi, N.; Kappas, M.; Faust, H. Impacts of agricultural land acquisition for urbanization on agricultural activities of affected households: A case study in Huong Thuy Town, Thua Thien Hue Province, Vietnam. Sustainability 2021, 13, 8559. [Google Scholar] [CrossRef]
  8. Yin, K.; Wang, R.; Zhou, C.; Liang, J. Review of eco-efficiency accounting method and its applications. Acta Ecol. Sin. 2012, 32, 3595–3605. [Google Scholar] [CrossRef]
  9. Luo, Y.; Lu, Z.; Muhammad, S.; Yang, H. The heterogeneous effects of different technological innovations on eco-efficiency: Evidence from 30 China’s provinces. Ecol. Indic. 2021, 127, 107802. [Google Scholar] [CrossRef]
  10. Wang, G.; Shi, R.; Mi, L.; Hu, J. Agricultural Eco-Efficiency: Challenges and Progress. Sustainability 2022, 14, 1051. [Google Scholar] [CrossRef]
  11. Yun, Z.; Jie, H. A Study on the characteristics and driving factors of spatial correlation network of agricultural ecological efficiency in China. Econ. Jingwei 2021, 38, 32–41. (In Chinese) [Google Scholar] [CrossRef]
  12. Wang, B.Y.; Zhang, W.G. Cross-provincial differences in determinants of agricultural eco-efficiency in China: An analysis based on panel data from 31 provinces in 1996–2015. China Rural. Econ. 2018, 1, 46–62. [Google Scholar]
  13. Zhang, H.P. The evolution of China’s urban-rural relations in the past seven decades: From separation to integration. China Rural. Econ. 2019, 3, 2–8. [Google Scholar]
  14. She, Z.X. The rural areas experiences conflicts under the urbanization process and its development issue. Chin. J. Environ. Manag. 2015, 7, 57–62. [Google Scholar]
  15. Lewis, W.A. Economic development with unlimited supplies of labour. Manch. Sch. 1954, 22, 139–191. [Google Scholar] [CrossRef]
  16. Ma, L.; Long, H.; Zhang, Y.; Tu, S.; Ge, D.; Tu, X. Agricultural labor changes and agricultural economic development in China and their implications for rural vitalization. J. Geogr. Sci. 2019, 29, 163–179. [Google Scholar] [CrossRef] [Green Version]
  17. Tian, H.Y.; Zhu, Z.Y. Rural labor migration, scale of operation and environmental technical efficiency of grain production. J. S. China Agric. Univ. Soc. Sci. Ed. 2018, 17, 69–81. [Google Scholar]
  18. Guo, J.H.; Ni, M.; Li, B. Research on agricultural production efficiency based on three-stage DEA model. J. Quant. Tech. Econ. 2010, 12, 27–38. [Google Scholar]
  19. Taylor, J.E.; Lopez-Feldman, A. Does migration make rural households more productive? Evidence from Mexico. In Migration, Transfers and Economic Decision Making among Agricultural Households; Routledge: London, UK, 2020; pp. 68–90. [Google Scholar]
  20. Li, Y.H.; Yan, J.Y.; Wu, W.H.; Liu, Y.S. The process of rural transformation in the world and prospects of sustainable development. Prog. Geogr. 2018, 37, 627–635. [Google Scholar]
  21. Li, J.; Chen, J.; Liu, H. Sustainable agricultural total factor productivity and its spatial relationship with urbanization in China. Sustainability 2021, 13, 6773. [Google Scholar] [CrossRef]
  22. Wang, Y.; Yao, X.; Zhou, M. Rural labor outflow, regional disparities and food production. Manag. World 2013, 11, 67–76. [Google Scholar]
  23. Liu, X.; Xu, Y.; Engel, B.A.; Sun, S.; Zhao, X.; Wu, P.; Wang, Y. The impact of urbanization and aging on food security in developing countries: The view from Northwest China. J. Clean. Prod. 2021, 292, 126067. [Google Scholar] [CrossRef]
  24. Berry, D. Effects of urbanization on agricultural activities. Growth Change 1978, 9, 2–8. [Google Scholar] [CrossRef]
  25. Chaolin, G. Challenges and corresponding policies for China’s urban sustainable development. J. Chin. Geogr. 1996, 6, 72–77. [Google Scholar]
  26. Yang, H.; Li, X. Cultivated land and food supply in China. Land Use Policy 2000, 17, 73–88. [Google Scholar] [CrossRef]
  27. Shang, J.; Xueqiang, J.I.; Ximing, C. Study on the impact of China’s urbanization on agricultural ecological efficiency: Based on panel data of 13 major grain-producing regions in China from 2009 to 2018. Chin. J. Eco-Agric. 2020, 28, 1265–1276. [Google Scholar]
  28. Gao, J.; Song, G.; Sun, X. Does labor migration affect rural land transfer? Evidence from China. Land Use Policy 2020, 99, 105096. [Google Scholar] [CrossRef]
  29. Wang, Y.Q.; Yao, S.B.; Hou, M.Y.; Jia, L.; Li, Y.Y.; Deng, Y.J.; Zhang, X. Spatial-temporal differentiation and its influencing factors of agricultural eco-efficiency in China based on geographic detector. J. Appl. Ecol. 2021, 32, 4039–4049. [Google Scholar]
  30. Ren, Y.; Bai, Y.; Liu, Y.; Wang, J.; Zhang, F.; Wang, Z. Conflict or Coordination? Analysis of Spatio-Temporal Coupling Relationship between Urbanization and Eco-Efficiency: A Case Study of Urban Agglomerations in the Yellow River Basin, China. Land 2022, 11, 882. [Google Scholar] [CrossRef]
  31. Jiang, G. How Does Agro-Tourism Integration Influence the Rebound Effect of China’s Agricultural Eco-Efficiency? An Economic Development Perspective. Front. Environ. Sci. 2022, 689. [Google Scholar] [CrossRef]
  32. Huang, Y.; Huang, X.; Xie, M.; Cheng, W.; Shu, Q. A study on the effects of regional differences on agricultural water resource utilization efficiency using super-efficiency SBM model. Sci. Rep. 2021, 11, 9953. [Google Scholar] [CrossRef] [PubMed]
  33. Chenxuan, W.; Zuowen, Y.A.O. An analysis of the spatial effect of agricultural science and technology investment on agricultural eco-efficiency. Chin. J. Eco-Agric. 2021, 29, 1952–1963. [Google Scholar]
  34. Andersen, P.; Petersen, N.C. A procedure for ranking efficient units in data envelopment analysis. Manag. Sci. 1993, 39, 1261–1264. [Google Scholar] [CrossRef]
  35. Fukuyama, H.; Weber, W.L. A directional slacks-based measure of technical inefficiency. Socio-Econ. Plan. Sci. 2009, 43, 274–287. [Google Scholar] [CrossRef]
  36. West, T.O.; Marl, G. Asynthesis of carbon sequestration, carbon emissions, and net carbon fluxin agriculture: Comparing tillage practices in the United States. Agric. Ecosyst. Environ. 2002, 91, 217–232. [Google Scholar] [CrossRef]
  37. Tian, Y.; Li, B.; Zhang, J.B. Research on stage characteristics and factor decomposition of agricultural land carbon emission in China. J. China Univ. Geosci. 2011, 11, 59–63. [Google Scholar]
  38. Chen, S.; Lu, F.; Wang, X.K. Estimation of green house gas esemission factors for China’s nitrogen, phosphate, and potash fertilizers. Acta Ecol. Sin. 2015, 35, 6371–6383. [Google Scholar]
  39. Guotong, Q.; Fei, C.; Na, W.; Dandan, Z. Inter-annual variation patterns in the carbon footprint of farmland ecosystems in Guangdong Province, China. Sci. Rep. 2022, 12, 1–10. [Google Scholar]
  40. Li, H.; Ma, L. Analysis of agricultural non-point source pollution and regional difference in Mianyang city. J. Henan Agric. Sci. 2014, 43, 59–64. [Google Scholar]
  41. Holtz-Eakin, D.; Newey, W.; Rosen, H.S. Estimating vector autoregressions with panel data. Econom. J. Econom. Soc. 1988, 56, 1372–1395. [Google Scholar] [CrossRef]
  42. Ghorbani, M.; Shayanmehr, S. Identifying Factors Affecting the Economic Growth of Developed Countries: Application of Panel Tobit and Spatial Panel Tobit Models. J. Agric. Econ. Res. 2022, 14, 43–58. [Google Scholar]
  43. Yang, H.; Huang, K.; Deng, X.; Xu, D. Livelihood capital and land transfer of different types of farmers: Evidence from panel data in sichuan province, China. Land 2021, 10, 532. [Google Scholar] [CrossRef]
  44. Breitung, J.; Kripfganz, S.; Hayakawa, K. Bias-corrected method of moments estimators for dynamic panel data models. Econ. Stat. 2021, 24, 116–132. [Google Scholar] [CrossRef]
  45. Choi, I.; Jung, S. Cross-sectional quasi-maximum likelihood and bias-corrected pooled least squares estimators for short dynamic panels. Empir. Econ. 2021, 60, 177–203. [Google Scholar] [CrossRef]
  46. Cao, Y.; Zhang, W.; Ren, J. Efficiency analysis of the input for water-saving agriculture in China. Water 2020, 12, 207. [Google Scholar] [CrossRef] [Green Version]
  47. Cai, Y.; Yue, W.; Xu, L.; Yang, Z.; Rong, Q. Sustainable urban water resources management considering life-cycle environmental impacts of water utilization under uncertainty. Resour. Conserv. Recycl. 2016, 108, 21–40. [Google Scholar] [CrossRef]
  48. Mu, N.N.; Kong, X.Z. The revenue growth mechanism of grain production by industrial and commercial capitals: A case study of Anhui, Shandong and Hebei provinces. Res. Agric. Mod. 2017, 38, 23–30. [Google Scholar]
Figure 1. Interannual variation in agro-ecological efficiency by region.
Sustainability 14 12996 g001
Figure 2. Changes in agro-ecological efficiency rating.
Sustainability 14 12996 g002
Figure 3. PVAR impulse response plot.
Sustainability 14 12996 g003
Table 1. Agro-ecological efficiency evaluation index system.
IndicatorsVariablesVariable Description
Resource inputLabour inputAgricultural workforce (10,000 people)
Land inputTotal area sown to crop (thousands of ha)
Irrigation inputsEffective irrigated area (thousands of ha)
Agricultural machinery power inputsTotal agricultural machinery power (×10 thousand kW)
Fertilizer inputsAgricultural fertilizer application (converted, × 10 thousand ton)
Pesticide inputsPesticide use (ton)
Agricultural film inputsAmount of agricultural film used (ton)
Draft animal inputsNumber of cattle in stock at the end of the year (×10 thousand head)
Desired outputAgricultural outputTotal agricultural output (×100 million yuan)
Food outputTotal grain production (×10 thousand ton)
Undesired outputsCarbon emissionsCarbon emissions from agricultural production processes (×10 thousand ton)
Surface source pollutionAmount of surface source pollution from agricultural production inputs (×10 thousand ton)
Table 2. System of impact factor indicators.
VariablesIndicator/UnitIndicator Description
Explained variableAgro-Ecological Efficiency (AEE)Measured based on the undesired output super-efficiency SBM model
Core explanatory variableLevel of urbanisation of population (URB)/%Direct access
Control variablesEconomic Development in Agriculture (PADA)/(USD/person)Value added in agriculture/population employed in agriculture
Rural human capital (AHM)/(year)Average years of schooling for rural household labour force
Water Infrastructure (EIR)/%Effective irrigated area/total sown area
Agricultural disaster rate (ADR)/%Affected area/total sown area
Industrialisation level (IND)/%Tertiary sector value added/GDP
Transport infrastructure (TRAF)/(km/km2)(Railway mileage + inland waterway mileage + road mileage)/Land area
Table 3. Unit root test results.
VariablesLLC TestIPS TestingADF TestConclusion
lnAEE−4.7640 *−2.5058 *−5.062 *Stable
lnURB−98.688 *−30.4752 *−5.954 *Stable
* denotes significant at the 10% level.
Table 4. Determination of lag order.
Lag12345
AIC−5.82784−6.10487−6.09801−6.02081−6.26054 *
BIC−5.31636−5.37807 *−5.47042−5.32602−5.49098
HQIC−5.62809−5.88297−5.85166−5.74734−5.95678 *
* denotes significant at the 10% level.
Table 5. GMM estimation results.
Response VariablesShock Variables
lnAEElnURB
L.lnAEE0.5369 **(2.23)−0.1168 **(−1.76)
L.lnURB−0.1915 (−0.74)0.8258 ***(14.06)
Note: Values in brackets are z-statistic values. ** and *** denote significant at the 5% and 1% level, respectively.
Table 6. Results of variance decomposition.
Shock VariablelnAEElnURB
Response VariablelnAEElnURBlnAEElnURB
Prediction period11.0000.0000.0001.000
20.9980.0020.0960.904
30.9960.0040.2460.754
40.9960.0040.3810.619
50.9950.0050.4860.514
60.9950.0050.5780.422
70.9950.0050.6380.362
80.9950.0050.6770.323
90.9940.0060.7010.299
100.9940.0060.7170.283
Table 7. Random effects panel Tobit regression results.
Explanatory VariablesModels (2)Models (3)Models (4)Models (5)
URB−0.0011721 ***
(−3.98)
−0.0018583 ***
(−3.43)
−0.0014495 ***
(−2.70)
−0.0023082 ***
(−3.65)
PADA 2.11 × 10⁻⁶ ***
(4.34)
2.51 × 10⁻⁶ ***
(4.93)
AHM −0.0216954 ***
(−2.59)
−0.0273955 ***
(−3.19)
EIR −0.1310255 ***
(−3.66)
−0.1126165 ***
(−3.12)
ADR −0.0005539 ***
(−2.65)
−0.0005818 ***
(−2.81)
IND −0.0892232
(−1.43)
−0.1523307 **
(−2.35)
TRAF 0.0227137 *
(1.67)
0.0338134 **
(2.51)
Constant1.110918 ***
(42.19)
1.344557 ***
(24.29)
1.148044 ***
(35.66)
1.439624 ***
(23.06)
Log
likelihood
588.11947607.78554590.2583612.9421
*, ** and *** denote significant at the 10%, 5% and 1% level, respectively.
Publisher’s Note: MDPI stays neutral with regard to jurisdictional claims in published maps and institutional affiliations.

